Quantitative prediction of variant effects on alternative splicing in MAPT using endogenous pre-messenger RNA structure probing
- Department of Biology, University of North Carolina at Chapel Hill, United States
- Curriculum in Bioinformatics and Computational Biology, University of North Carolina at Chapel Hill, United States
- Department of Genetics and Biochemistry, Center for Human Genetics, Clemson University, United States
- Verna and Marrs McClean Department of Biochemistry and Molecular Biology, Therapeutic Innovation Center (THINC), and Department of Molecular and Human Genetics, Baylor College of Medicine, United States
- Department of Chemistry, University of North Carolina at Chapel Hill, United States
- Department of Biochemistry & Biophysics and Center for RNA Biology, School of Medicine and Dentistry, University of Rochester, United States
Figures
Figure 1 with 8 supplements
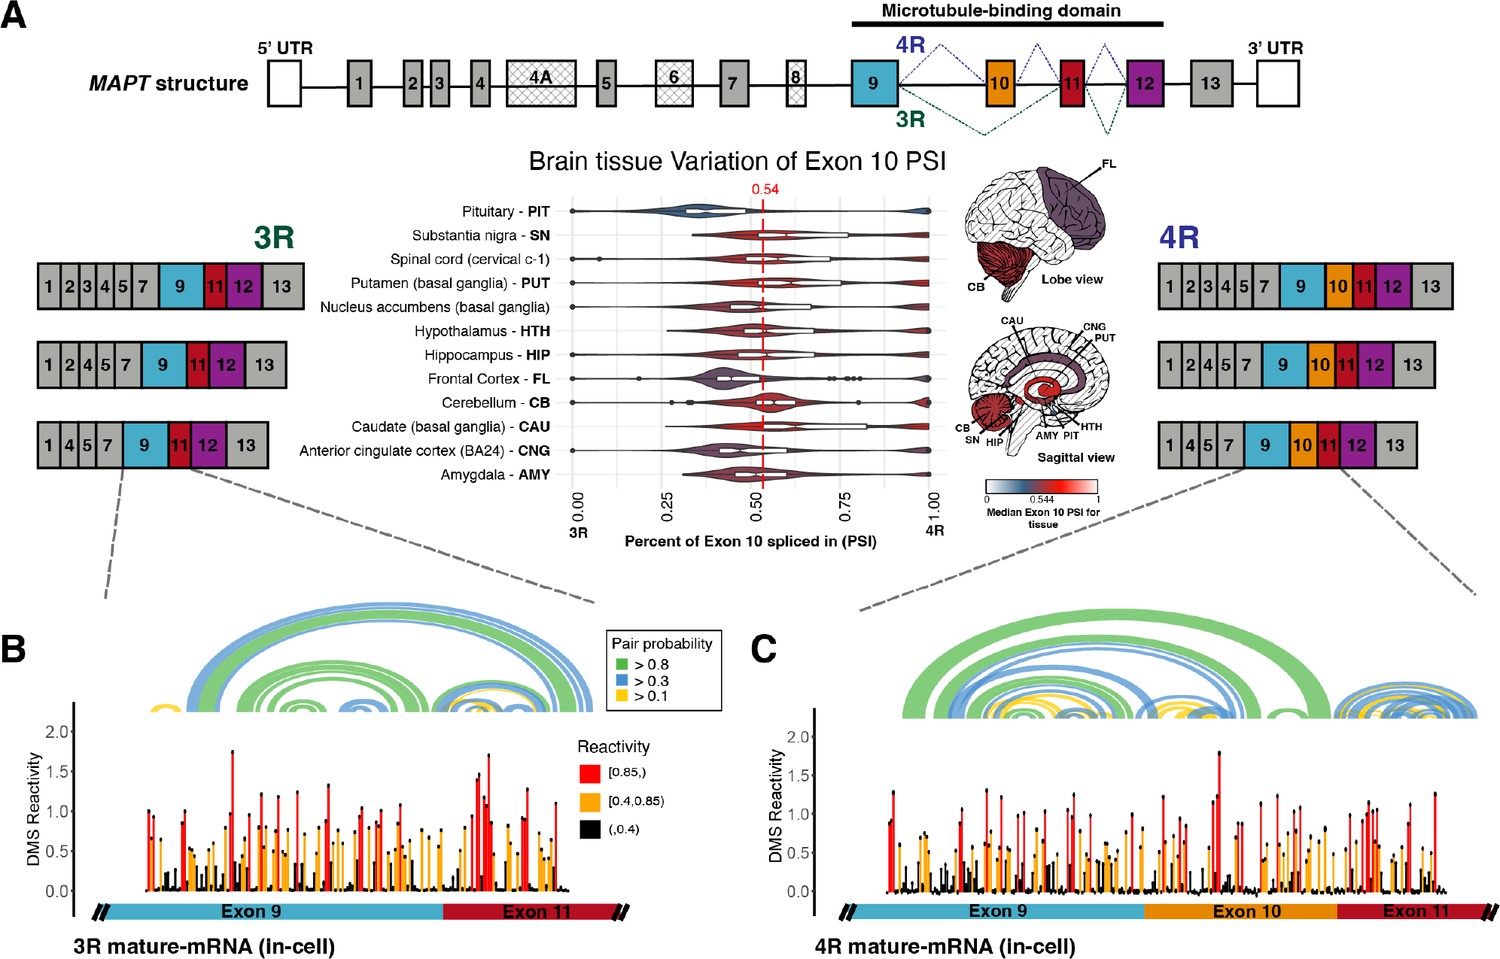
Three repeat (3R) and four repeat (4R) mature MAPT transcripts are expressed in a 1:1 ratio in samples from human subjects and mature exons appear to fold as independent structural units.
(A) Ratio of 3R and 4R MAPT transcripts is approximately 1:1 among brain tissues. There are 14 exons alternatively spliced in MAPT. Exons 4 A, 6, and 8 are not found in brain mRNA. The four exons highlighted in color are repeat regions that form the microtubule binding domain in the Tau protein. Exon 10 is alternatively spliced to form the 3R or 4R isoform. This is highlighted by the alternate lines from the 5’ splice site of exon 9 to either the 3’ splice site of exon 10 (4R) or the 3’ splice site of exon 11 (3R). The six canonical transcripts found in the CNS can be separated into 3R and 4R transcripts. Percent spliced in (PSI) of exon 10 was calculated from RNA-seq data for 2315 tissue samples representing 12 CNS tissue types and collected from 375 individuals in genotype-tissue expression (GTEx) v8 database. The violin plot for each tissue type and the corresponding region on the brain diagram is colored by the median PSI for all samples of a given type. The patterned regions on the brain diagram indicate tissue types with no data. Tissue types spinal cord and nucleus accumbens are not visualized on the brain diagram. The median PSI of 0.54 among all tissue samples is indicated by the red dotted line. (B) In-cell dimethyl sulfate probing read out by mutational profiling (DMS-MaP) structure probing data across exon 9 – exon 11 junction of 3R mature MAPT transcript. T47D cells were treated with dimethyl sulfate (DMS). Structure probing data for junctions of interest were obtained using amplicon sequencing with region-specific primers (Supplementary file 4) following reverse transcription (RT) of extracted RNA. DMS reactivity is plotted for each nucleotide across spliced junctions. Each value is shown with its SE and colored by reactivity based on color scale. High DMS reactivities correspond to less structured regions, whereas low DMS reactivities correspond to more structured regions. The base pairs of the predicted secondary structure guided by DMS reactivities (using A/C nucleotides only) are shown in the arcs colored by pairing probabilities. (C) In-cell DMS-MaP structure probing data across exon 9 – exon 10 – exon 11 junction of 4R mature MAPT transcript.
-
Figure 1—source data 1
Percent spliced in (PSI) of exon 10 plotted in Figure 1A and Figure 1—figure supplement 1B.
PSIs were calculated for 2962 tissue samples from 15 tissues types for CNS, muscle-skeletal, colon-sigmoid, and breast-mammary. Each row has the genotype-tissue expression (GTEx) participant ID, the tissue type, and the PSI calculated.
- https://cdn.elifesciences.org/articles/73888/elife-73888-fig1-data1-v2.txt
-
Figure 1—source data 2
Dimethyl sulfate (DMS) reactivities plotted in Figure 1B.
Reactivities are from the exon 9 – exon 11 junction of three repeat (3R) mature MAPT transcript in T47D cells, pooled from two replicates. Each row contains nucleotide position, DMS reactivity, the SE, and the base at the position.
- https://cdn.elifesciences.org/articles/73888/elife-73888-fig1-data2-v2.txt
-
Figure 1—source data 3
Dimethyl sulfate (DMS) reactivities plotted in Figure 1C.
Reactivities are from the exon 9 – exon 10 – exon 11 junction of four repeat (4R) mature MAPT transcript in T47D cells, pooled from two replicates. Each row contains nucleotide position, DMS reactivity, the SE, and the base at the position.
- https://cdn.elifesciences.org/articles/73888/elife-73888-fig1-data3-v2.txt
Figure 1—figure supplement 1

Distribution of exon 10 percent spliced ins (PSIs) calculated for RNA-seq data from genotype-tissue expression (GTEx) database.
(A) Distribution of transcripts per million (TPM) values of MAPT gene expression for tissues in the GTEx database sorted by median TPM. Dotted box indicates tissues with median TPM greater than 10. MAPT is highly expressed in the brain, and there is little expression in other tissues. Figure was downloaded from the GTEx website. (B) Distribution of exon 10 PSI for 12 CNS, muscle-skeletal, colon-sigmoid, and breast-mammary tissue types. PSI of exon 10 was calculated from RNA-seq data for 2962 tissue samples among 15 tissue types collected from 818 individuals in GTEx v8 database. The violin plot for each tissue type and the corresponding region on the brain diagram is colored by the median PSI for all samples of that type. The median PSI of 0.56 for all tissue samples is indicated by the red dotted line. (C) Distribution of exon 10 PSI for tissues per individual. Only individuals with MAPT expression data in eight or more tissues were plotted. Median PSI for each individual is labeled by red dot on box plot.
Figure 1—figure supplement 2
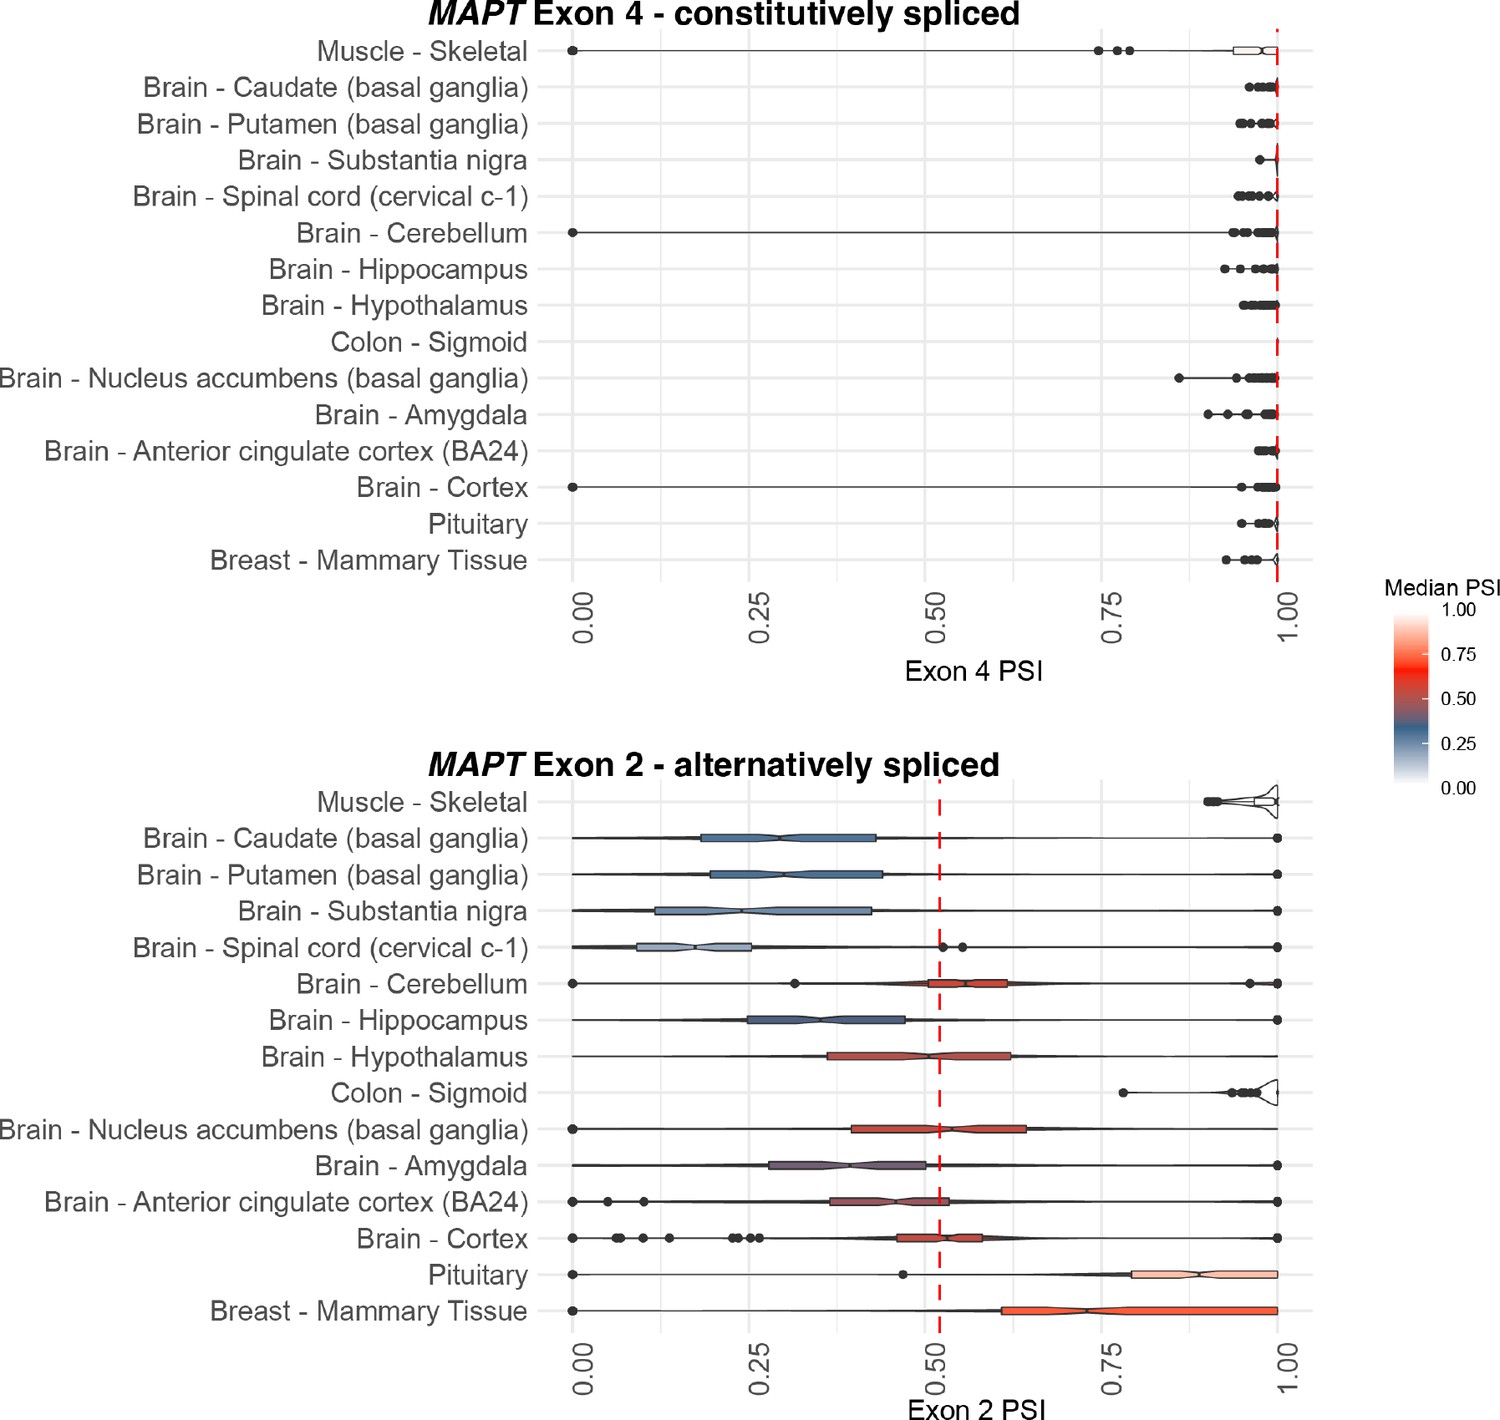
Distribution of constitutively spliced exon 4 and alternatively spliced exon 2 percent spliced ins (PSIs) for 12 CNS, muscle-skeletal, colon-sigmoid, and breast-mammary tissue types.
The median PSIs for all tissue samples per exon are indicated by the red dotted line.
Figure 1—figure supplement 3
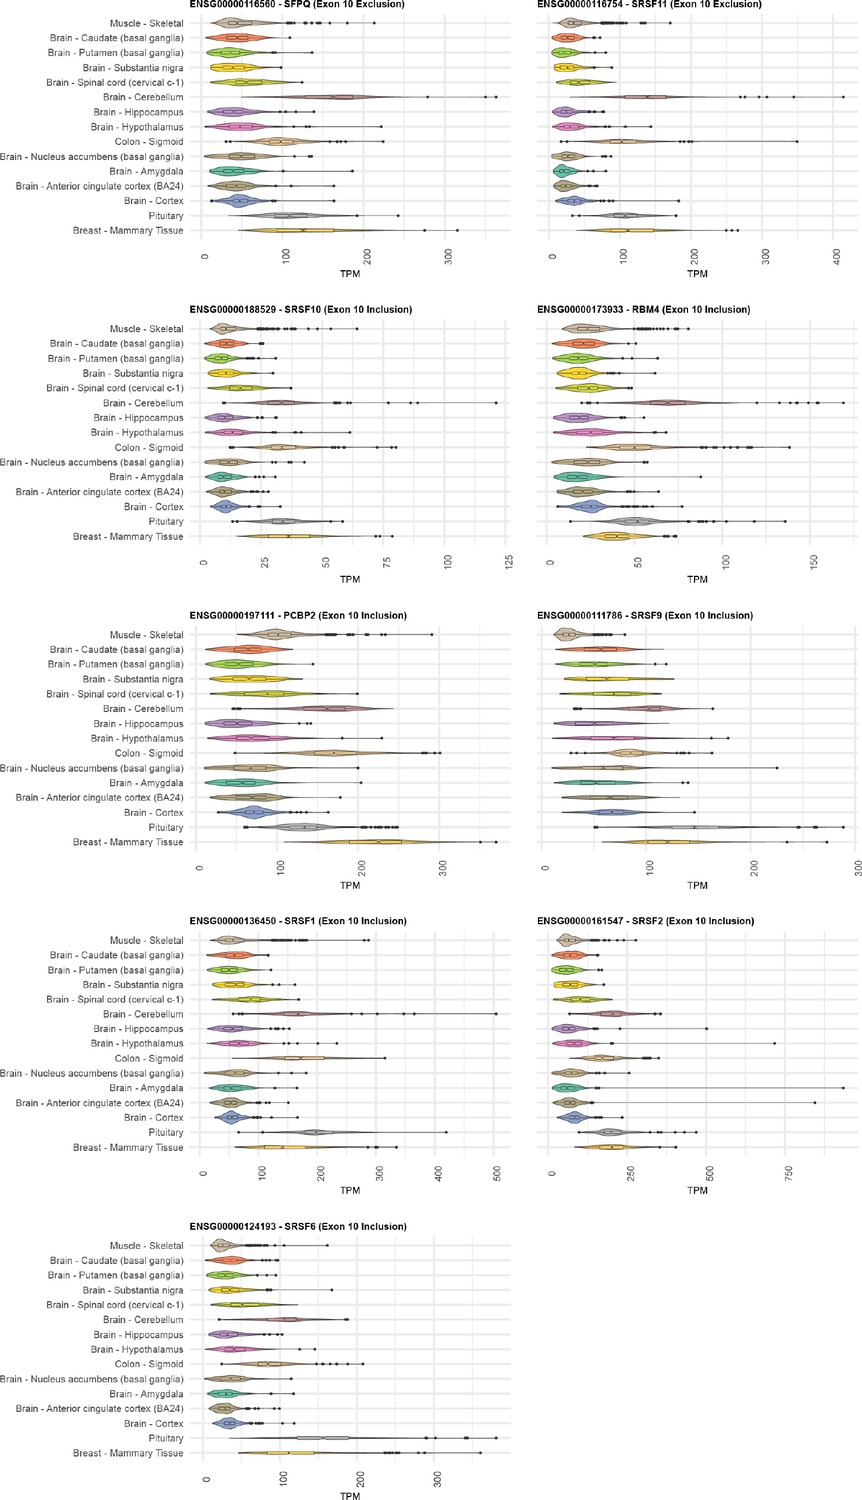
Distribution of gene expression levels for RNA-binding proteins (RBPs) implicated in the splicing regulation of MAPT exon 10.
Figure 1—figure supplement 4
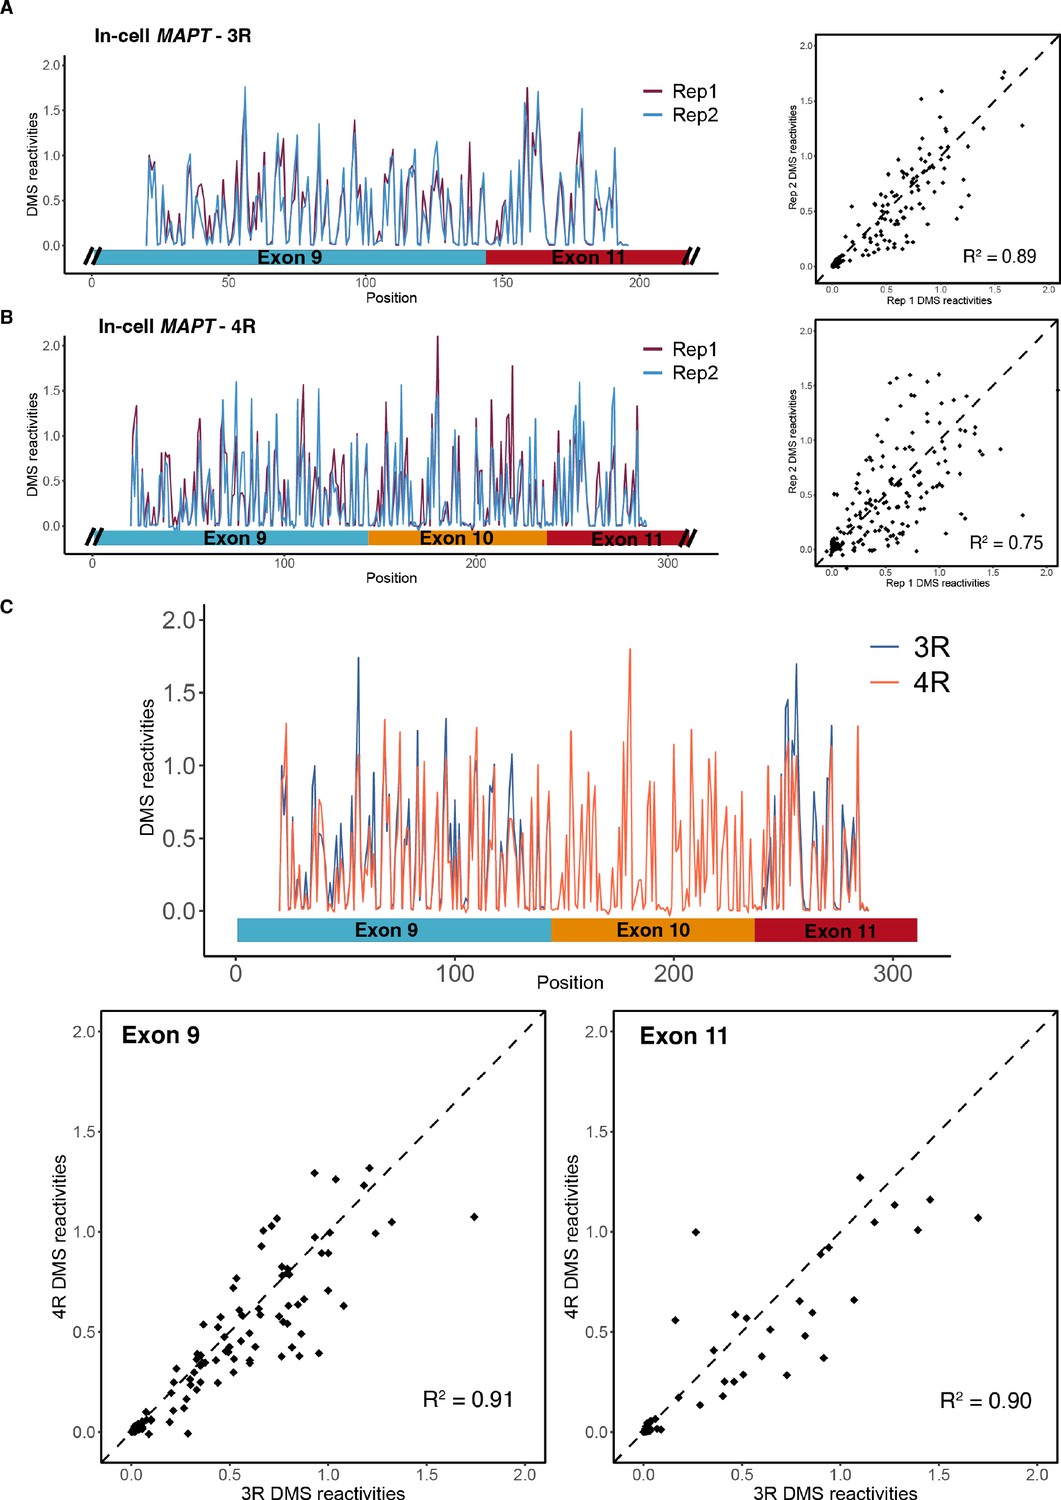
Dimethyl sulfate (DMS) structure probing data for mature MAPT three repeat (3R) and four repeat (4R) isoforms.
(A) Left: in-cell DMS reactivity data from T47D cells for two biological replicates for the exon 9 – exon 11 region (3R isoform). Structure probing data were obtained using primers listed in Supplementary file 4. DMS reactivity is plotted for each nucleotide for both replicates. Right: DMS reactivity for replicate 1 vs. replicate 2 plotted per nucleotide. (B) In-cell DMS reactivity data from T47D cells for two biological replicates for exon 9 – exon 10 – exon 11 region (4R isoform). (C) Comparison of in-cell DMS reactivity data for 3R vs. 4R isoforms. Replicates 1 and 2 were pooled for each isoform. Top: DMS reactivity plotted for each nucleotide with isoforms overlaid. No data were collected for exon 10 for the 3R isoform because exon 10 is spliced out. Bottom left: DMS reactivities for exon 9 in the 4R vs. 3R contexts. Bottom right: DMS reactivities for exon 11 in the 4R vs. 3R context.
Figure 1—figure supplement 5
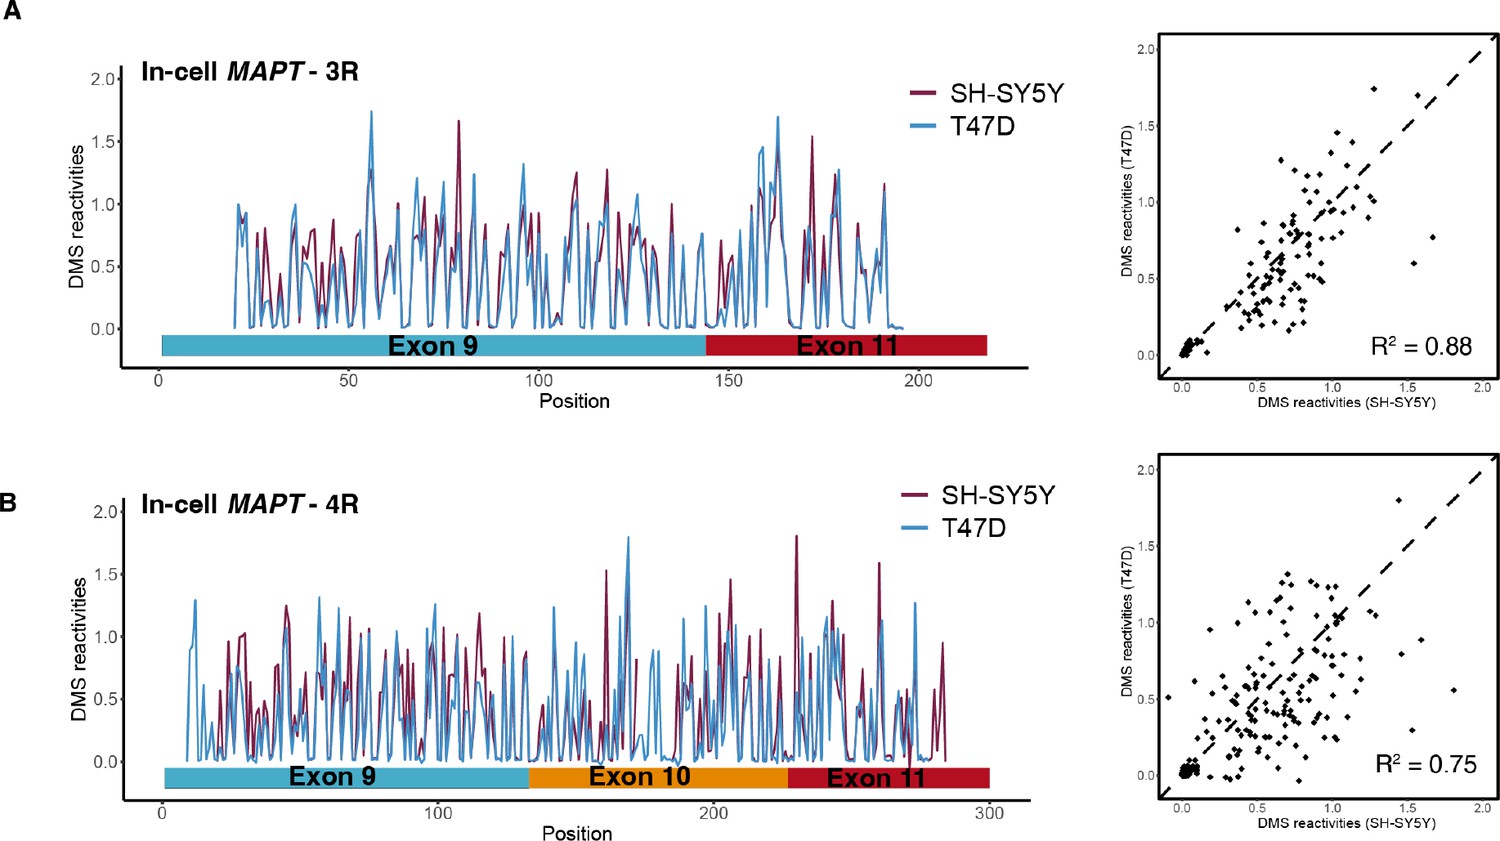
In-cell dimethyl sulfate (DMS) reactivity data from T47D and SH-SY5Y.
(A) In-cell DMS reactivity data from T47D and SH-SY5Y cells for exon 9 – exon 11 region (three repeat [3R] isoform). Replicates from T47D cells were pooled. Left: DMS reactivity for each nucleotide across the spliced junctions for overlaid replicates from T47D cells. Right: DMS reactivity for T47D vs. SH-SY5Y cells. (B) In-cell DMS reactivity data from T47D and SH-SY5Y cells for exon 9 – exon 10 –exon 11 region (four repeat [4R] isoform).
Figure 1—figure supplement 6
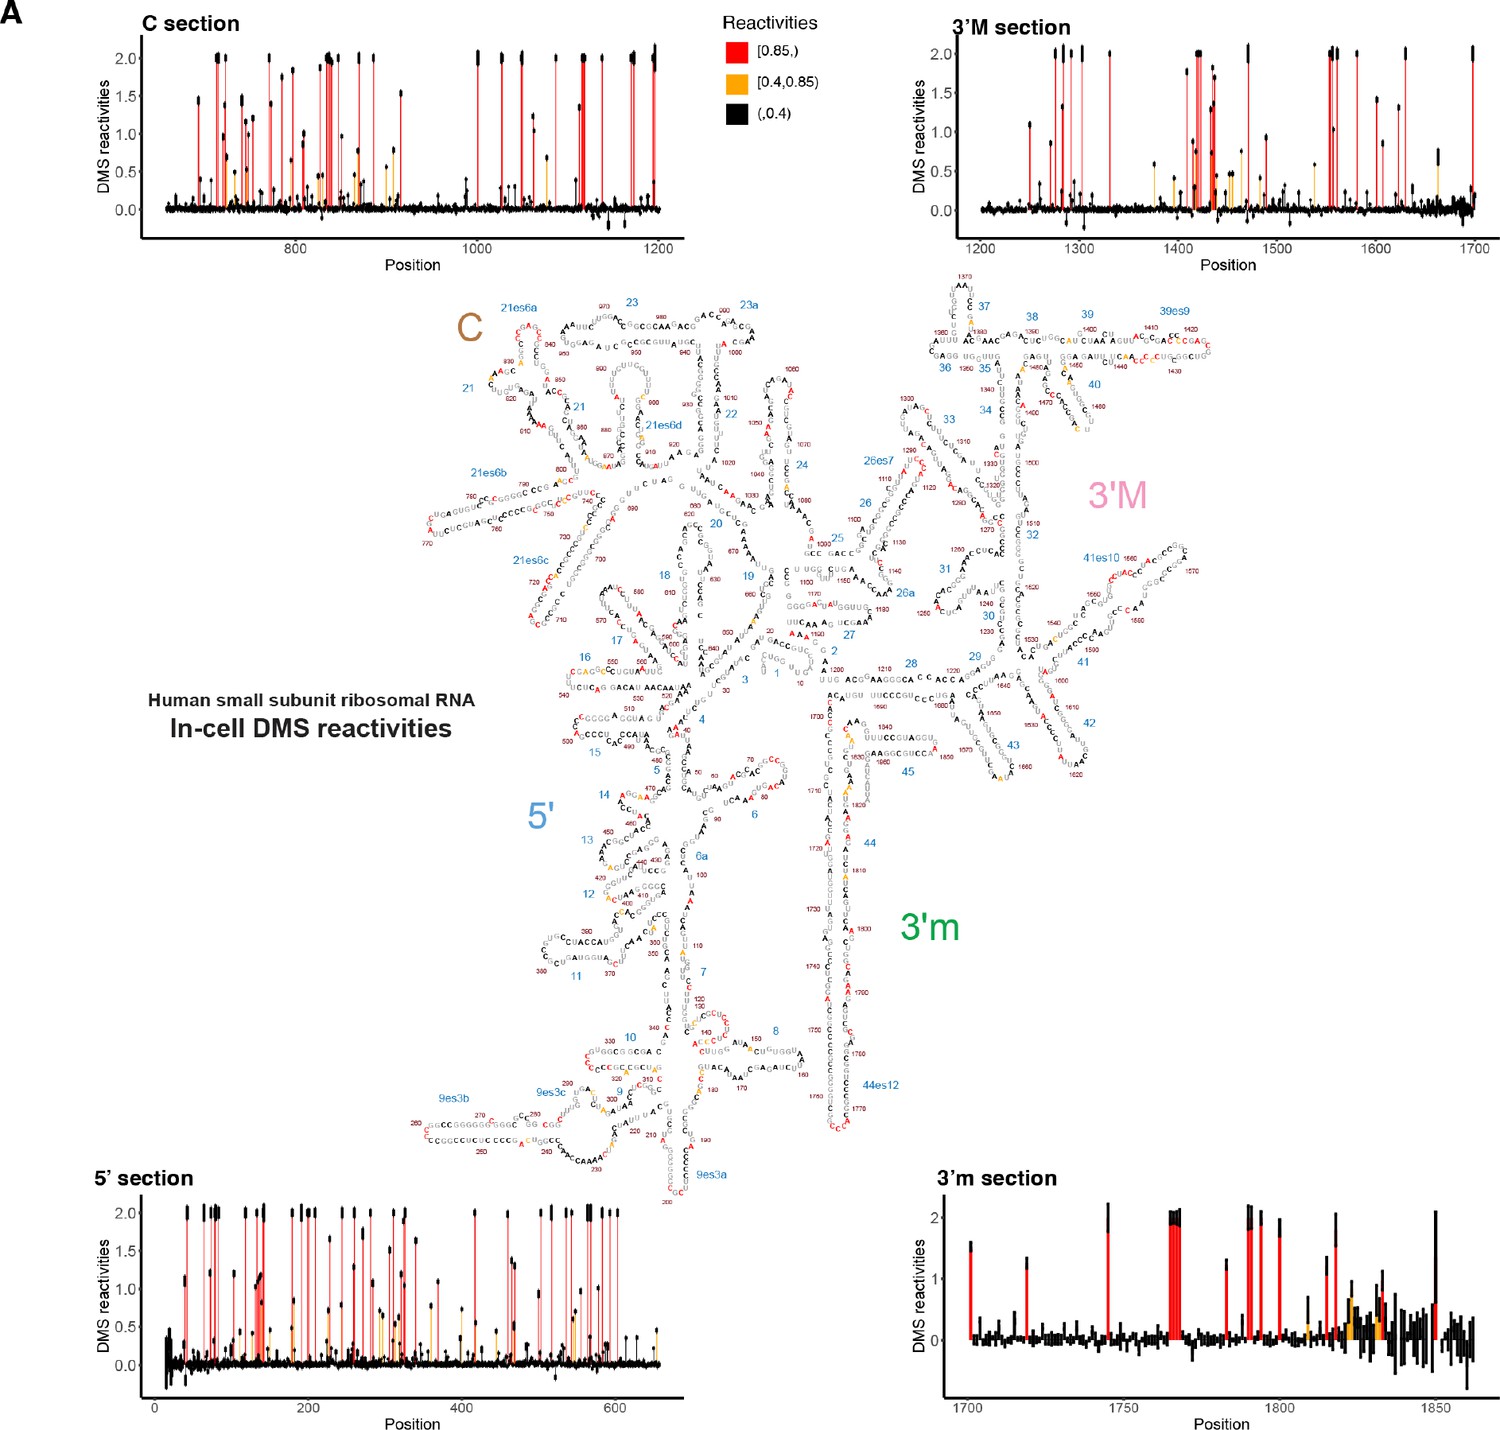
Dimethyl sulfate (DMS) structure probing data for small subunit (SSU) collected from T47D cells.
Data for SSU were extracted by aligning reverse transcribed RNA-seq data against the SSU sequence, after which reactivities were calculated. DMS reactivities are plotted for each of the four subdomains of the SSU. Each value is shown with its SE and colored by reactivity. Reactivities were cut off at 2. High DMS reactivities correspond to unstructured regions, whereas low DMS reactivities correspond to structured regions. On the secondary structure of the SSU, As and Cs are colored by their respective DMS reactivities; Gs and Us are grayed out. The original structure of the SSU was downloaded from the Ribosome Gallery. (http://apollo.chemistry.gatech.edu/RibosomeGallery/eukarya/H%20sapiens/SSU/index.html).
Figure 1—figure supplement 7
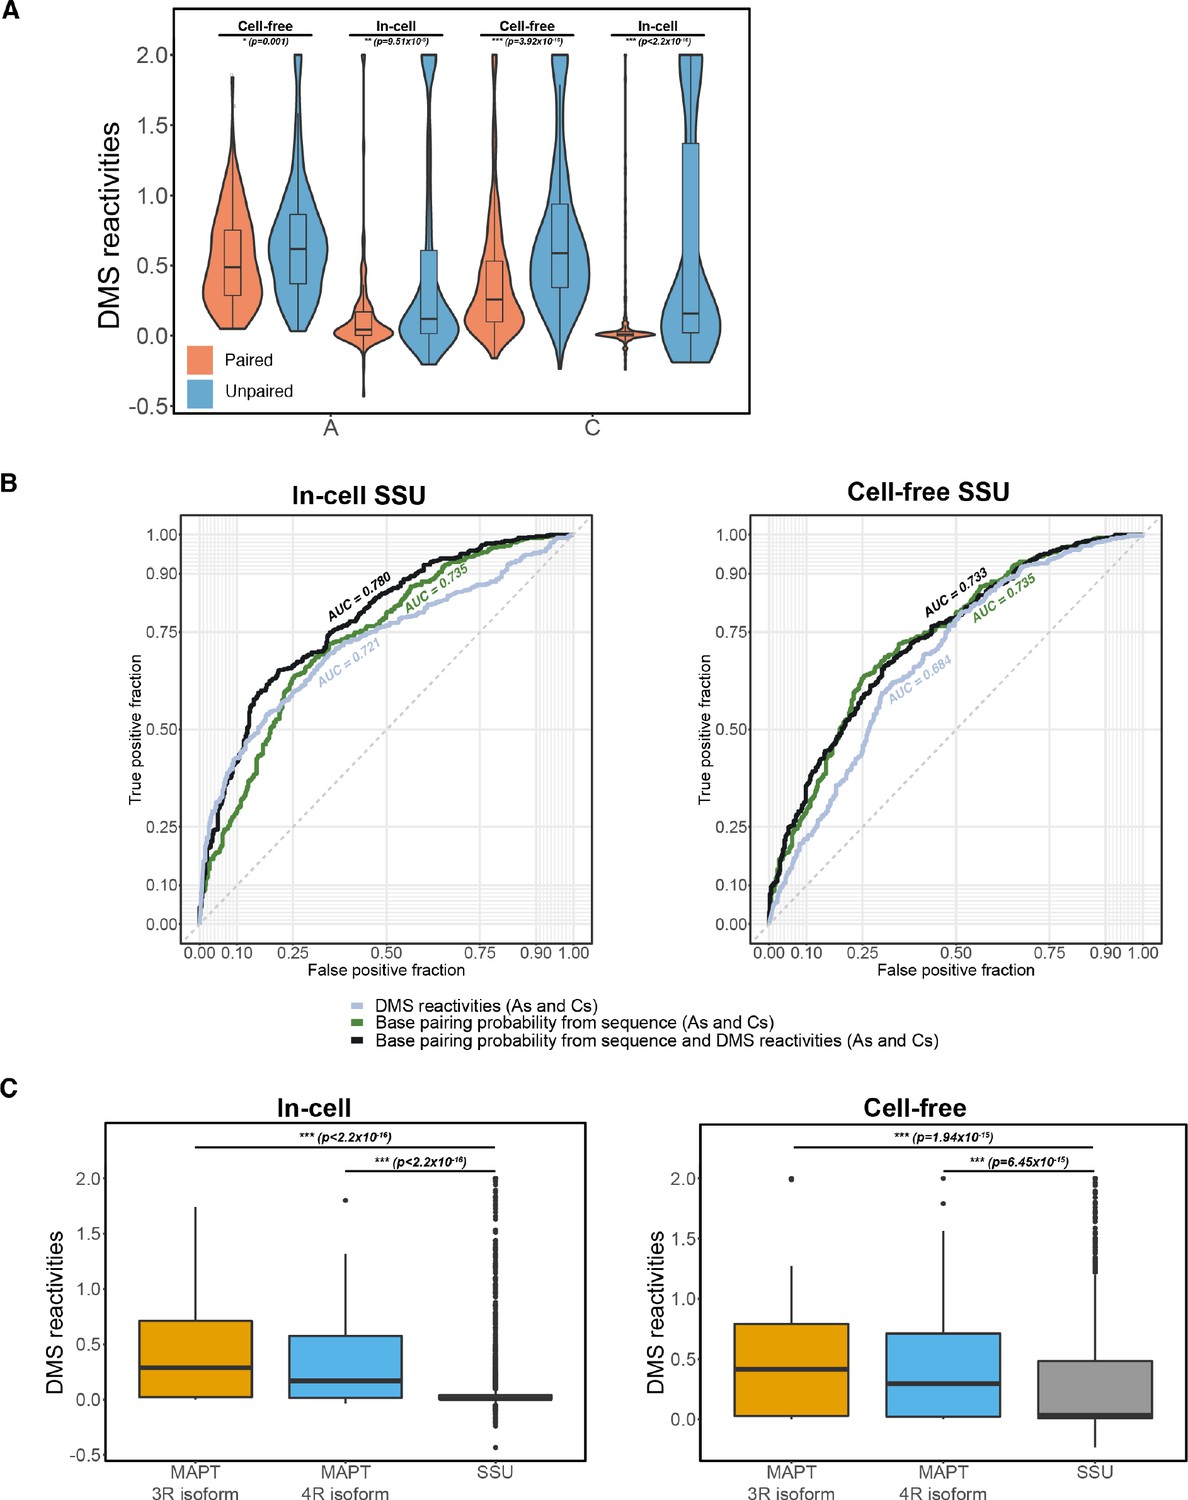
Comparing dimethyl sulfate (DMS) structure probing data for small subunit (SSU) vs. MAPT.
(A) Violin plots showing distribution of in-cell and cell-free DMS reactivities for As and Cs partitioned by paired vs. unpaired nucleotides. Pairing status of nucleotides was determined from the known secondary structure of the SSU. Median DMS reactivity is indicated by thick horizontal black line on violin plot. One-tailed Wilcoxon rank sum test was used to test significance; *** p-value<10–6. (B) Receiver operating characteristic curves for prediction of whether As or Cs in the SSU are paired. The two plots were generated separately using in-cell and cell-free SSU DMS reactivities. Three different parameters were used for each of the three curves: DMS reactivities, base pairing probabilities predicted from SSU sequence, and base pairing probabilities for SSU sequence that were guided by DMS reactivities. The area under the curve (AUC) for each curve was calculated with AUCs closer to 1 corresponding to higher accuracy of predictions. Dotted line indicates AUC of 0.5, which corresponds to random predictions. (C) Comparison of distribution of DMS reactivities between SSU and MAPT three repeat (3R) and four repeat (4R) isoforms. The two plots were generated separately using in-cell and cell-free DMS reactivities. One-tailed Wilcoxon rank sum test was used to test significance; *** p-value<10–6.
Figure 1—figure supplement 8
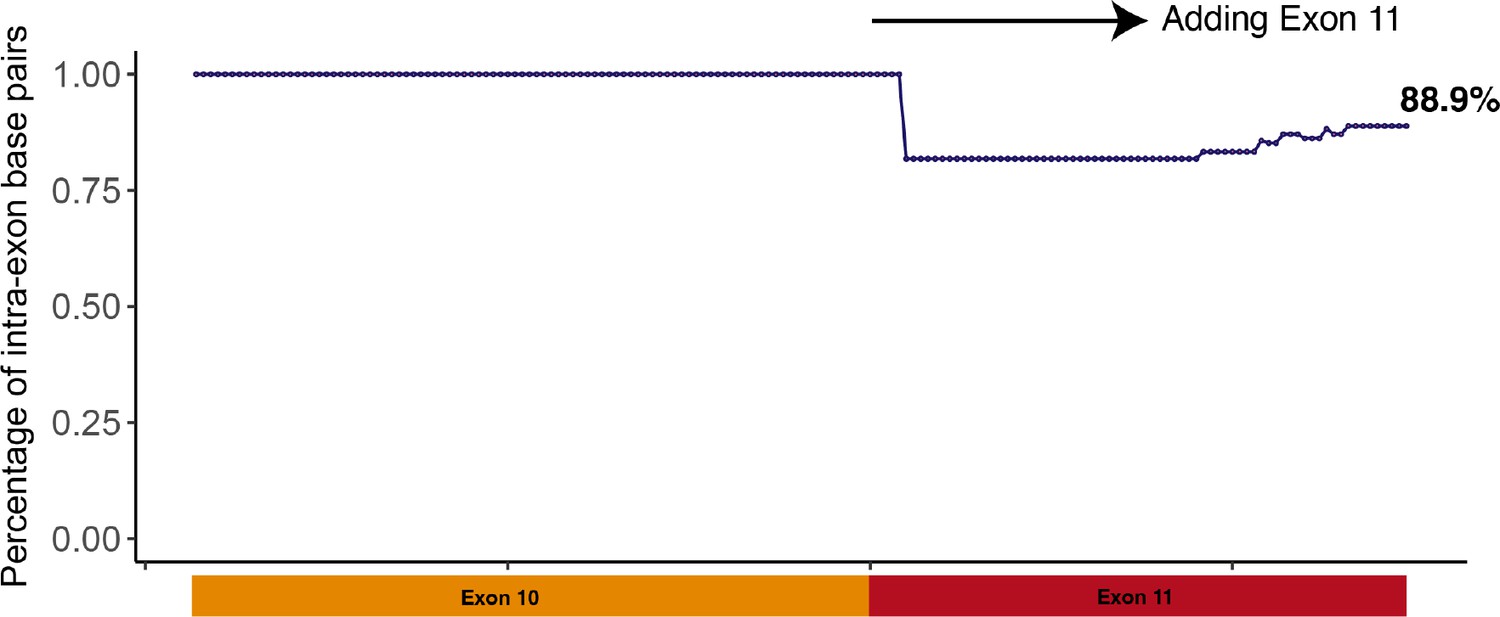
Scatter plot showing the percentage of intra-exon base pairs out of total number of base pairs.
Initially, exon 10 was folded; thus, the percentage of intra-exon base pairs was 100%. Exon 11 nucleotides were then added one at a time, and the RNA sequence was refolded after each addition. When all exon 11 nucleotides were included in the folding, 88.9% of base pairs were intra-exon.
Figure 2 with 4 supplements
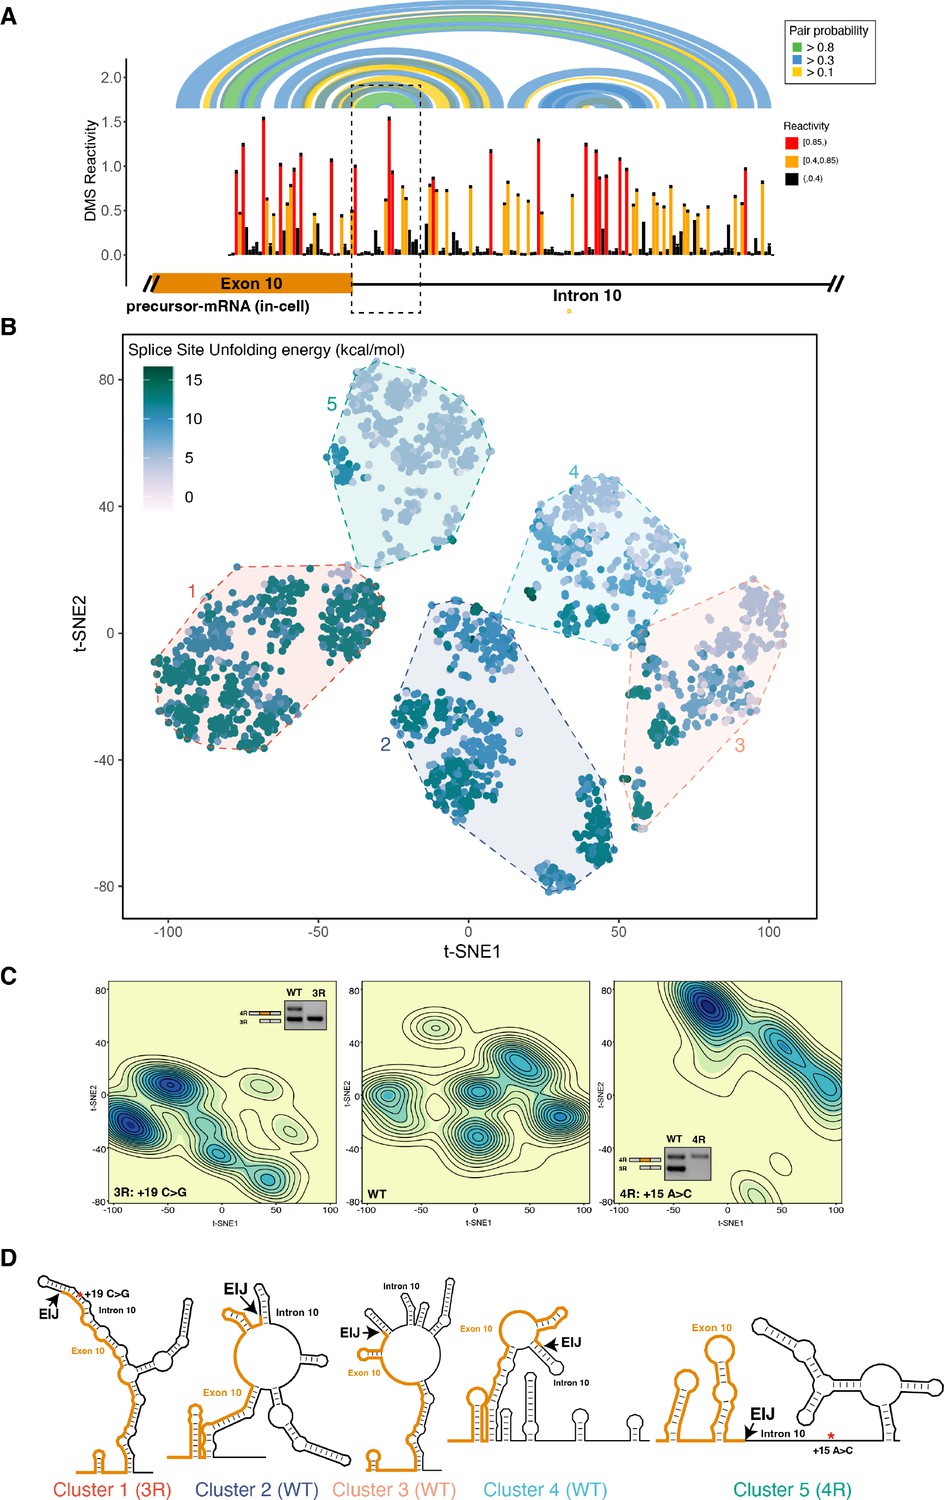
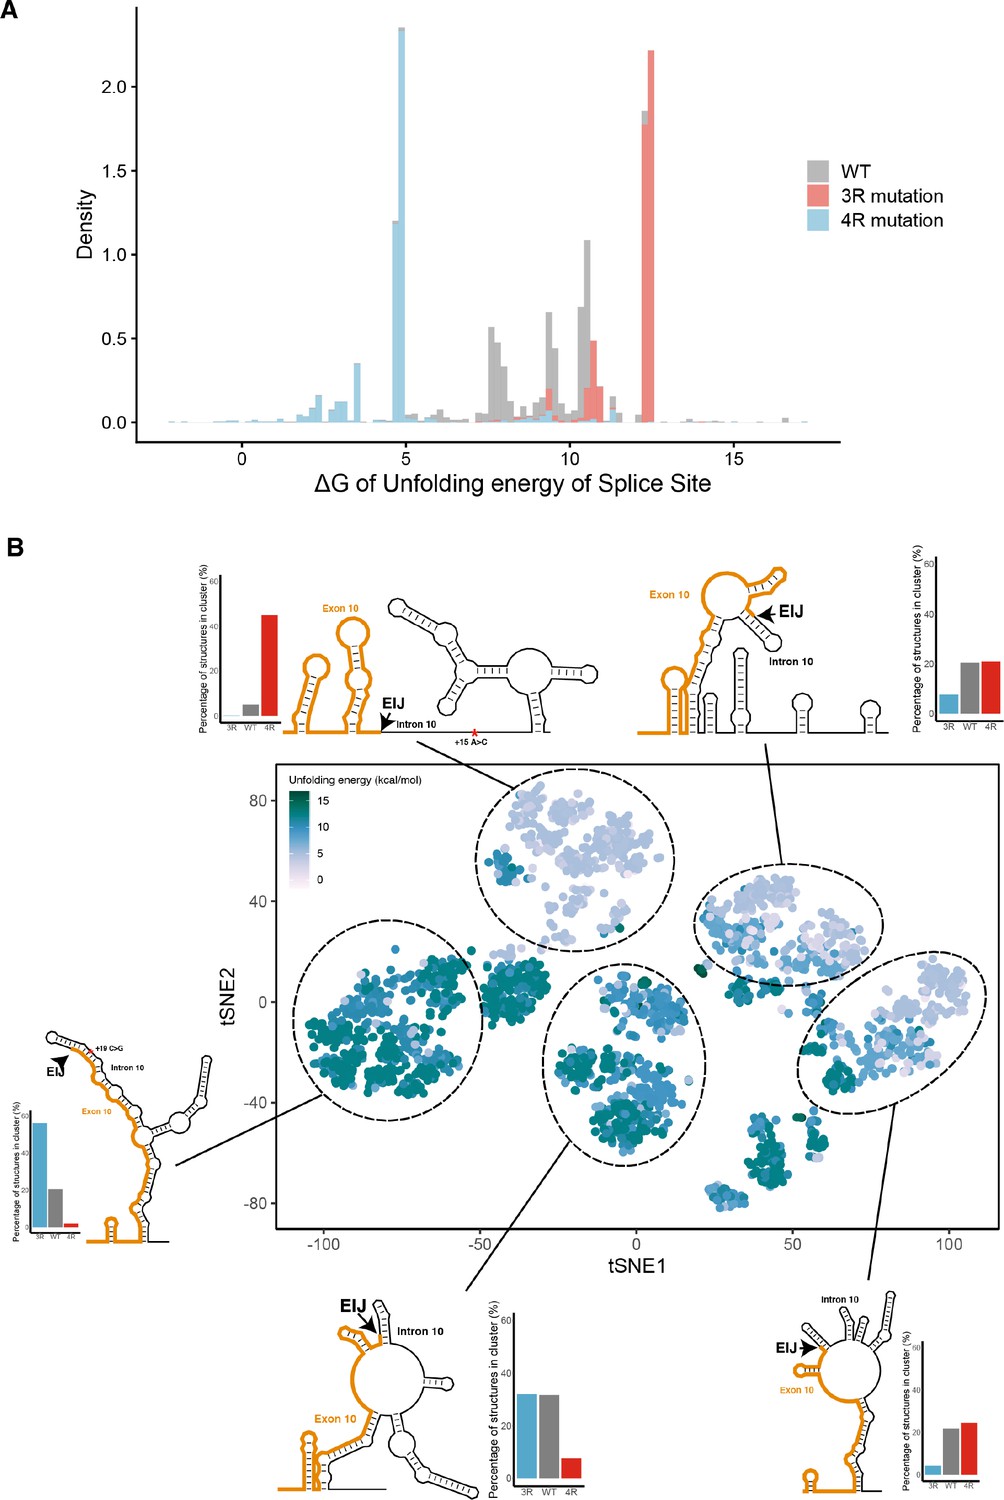
The four repeat (4R) and three repeat (3R) mutations shift dimethyl sulfate (DMS) reactivity-guided structural ensemble of exon 10 – intron 10 junction to be less structured and more structured, respectively.
(A) In-cell dimethyl sulfate probing read out by mutational profiling (DMS-MaP) structure probing data across exon 10 – intron 10 junction of precursor MAPT transcript in T47D cells. Structure probing data for junctions of interest were obtained using amplicon sequencing with primers (Supplementary file 4) following RT of extracted RNA. DMS reactivity is plotted for each nucleotide. Each value is shown with its SE and colored by reactivity based on the color scale. High median DMS reactivities correspond to less structured regions, whereas low median DMS reactivities correspond to more structured regions. Base pairs of predicted secondary structure guided by A/C DMS reactivities are shown by arcs colored by pairing probabilities. Strongly predicted hairpin structure near exon-intron junction is highlighted by dotted box. (B) t-Distributed stochastic neighbor embedding (t-SNE) visualization of structural ensemble of wildtype (WT) and,+19C>G (3R) and +15A>C (4R) mutations. Structures were predicted using Boltzmann suboptimal sampling and guided by DMS reactivity data for A/C nucleotides generated in A. Data were visualized using t-SNE. Shown are 3000 structures corresponding to 1000 structures per sequence. Each dot represents a single structure and is colored by the calculated unfolding free energy of the 5’ splice site at exon-intron junction (three exonic and six intronic bases). Clusters have been circled and enumerated using k-means clustering with k=5. (C) Density contour plots of structural ensemble of WT and, 3R, and 4R mutations. Contour plots were derived from the distribution of points on the t-SNE plot in B. The darker the blue, the higher the density of structures. Contour lines additionally represent density of points. Color scales for the three plots are identical. Inserts are gel images representative of splicing assays using a reporter plasmid expressing either the WT sequence, the +19C>G (3R) mutation or +15A>C (4R) mutation in HEK293 cells, where the RNA was extracted and reverse transcribed to measure the isoform ratio using specific PCR amplification (Materials and methods). In WT, both 3R (exon 9 – exon 11) and 4R (exon 9 – exon 10 – exon 11) isoforms are expressed (two bands). In the presence of the 3R mutation, only the 3R isoform is expressed (one band), whereas for the 4R mutation, only the 4R isoform is expressed (one band). Gel insets for the 3R and 4R mutation are in their respective density plots. (D) Representative structures for the five clusters are shown. The cluster number is indicated below each structure. The exon-intron junction is marked by EIJ on each structure. Positions of 3R and 4R mutations are marked by a red asterisk on their respective representative structures.
-
Figure 2—source data 1
Dimethyl sulfate (DMS) reactivities plotted in Figure 2A.
Reactivities are from the exon 10 – intron 10 junction of precursor MAPT transcript in T47D cells, pooled from two replicates. Each row contains nucleotide position, DMS reactivity, the SE, and the base at that position.
- https://cdn.elifesciences.org/articles/73888/elife-73888-fig2-data1-v2.txt
-
Figure 2—source data 2
t-Distributed stochastic neighbor embedding (t-SNE) coordinates plotted in Figure 2B.
3000 sampled structures of the exon 10 – intron 10 junction for wildtype (WT), three repeat (3R), and four repeat (4R) mutation were digitized into a 1000 × 234 matrix as described in Materials and methods. t-SNE dimension reductionality was performed to obtain a 3000 × 2 matrix. Each row is for a single structure. It contains the t-SNE x and y coordinate, the sequence type of the structure (WT, 3R, or 4R), k-means cluster number, and the ΔG‡ of unfolding of the splice site for the structure.
- https://cdn.elifesciences.org/articles/73888/elife-73888-fig2-data2-v2.txt
Figure 2—figure supplement 1
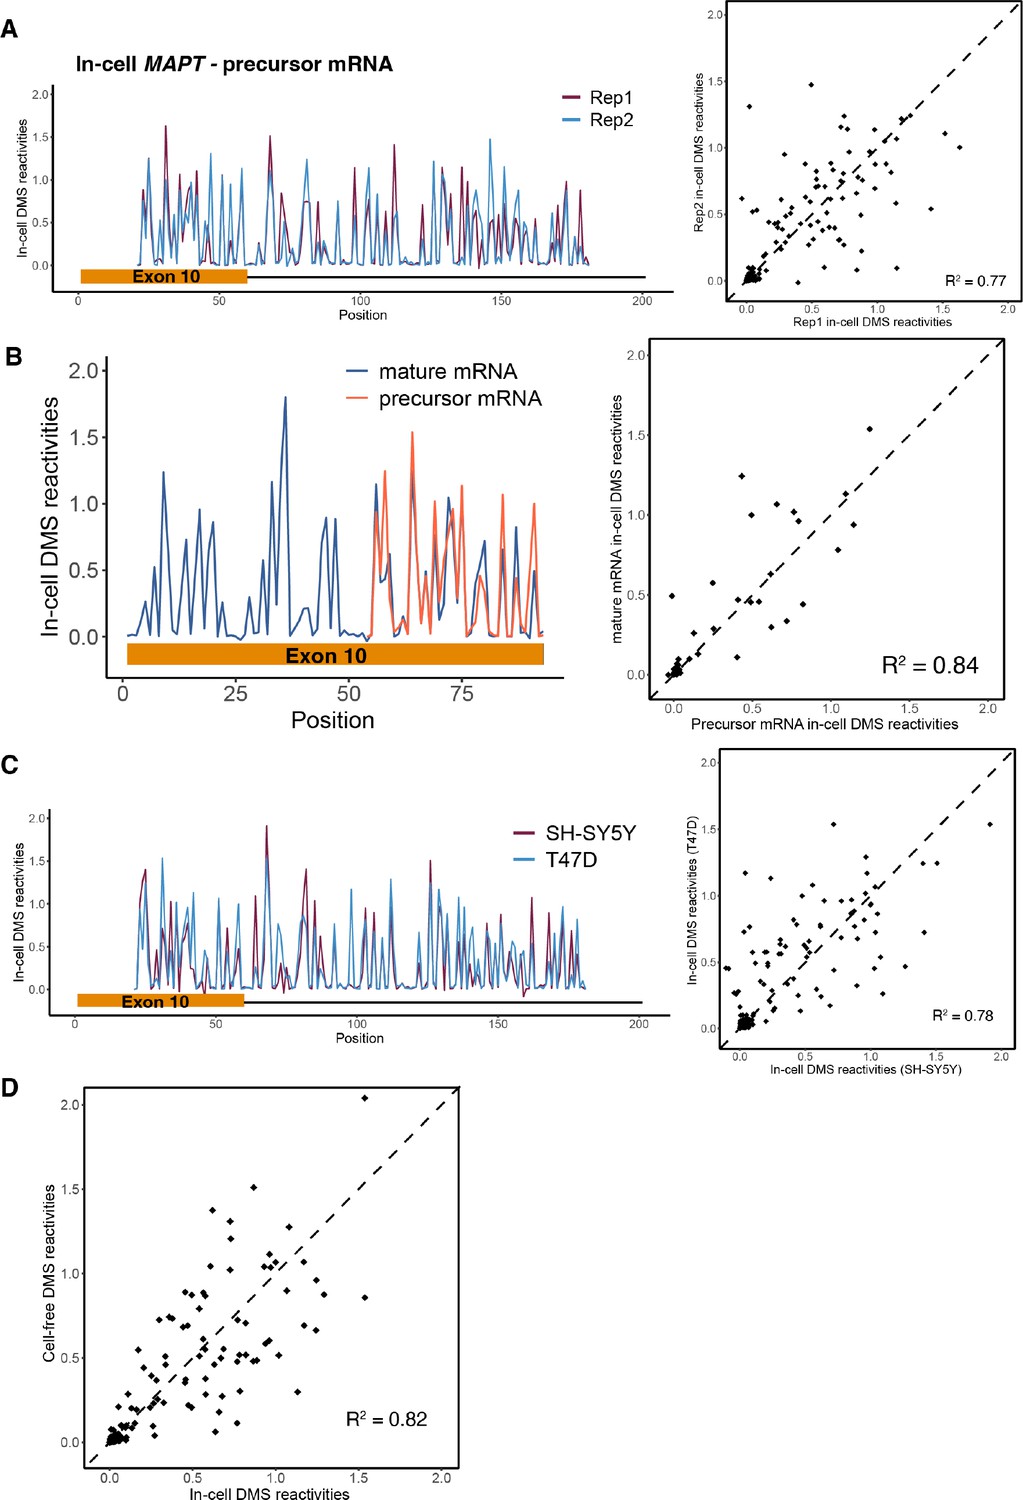
Dimethyl sulfate (DMS) structure probing data for precursor MAPT exon 10 – intron 10 region.
(A) Left: in-cell DMS reactivity data from T47D cells for two biological replicates for exon 10 – intron 10 region plotted for each nucleotide with replicates overlaid. Right: DMS reactivity for replicate 2 vs. replicate 1 plotted per nucleotide. (B) In-cell DMS reactivity data comparing exon 10 in mature vs. precursor transcripts. Replicates 1 and 2 were pooled for each transcript. Left: DMS reactivity plotted for each nucleotide with mature and precursor RNAs overlaid. DMS data for all of exon 10 could not be collected for the precursor messenger RNA (pre-mRNA) due to the position of primers chosen for amplification. Right: DMS reactivities for exon 10 in the mature vs. pre-mRNA. (C) In-cell DMS reactivity data from T47D and SH-SY5Y cells for exon 10 – intron 10 region. Replicates from T47D cells were pooled. Right: DMS reactivities for both cell types overlaid. Right: DMS reactivity for T47D vs. SH-SY5Y. (D) Scatter plot of cell-free vs. in-cell DMS reactivities in T47D cells for exon 10 – intron 10 region.
Figure 2—figure supplement 2
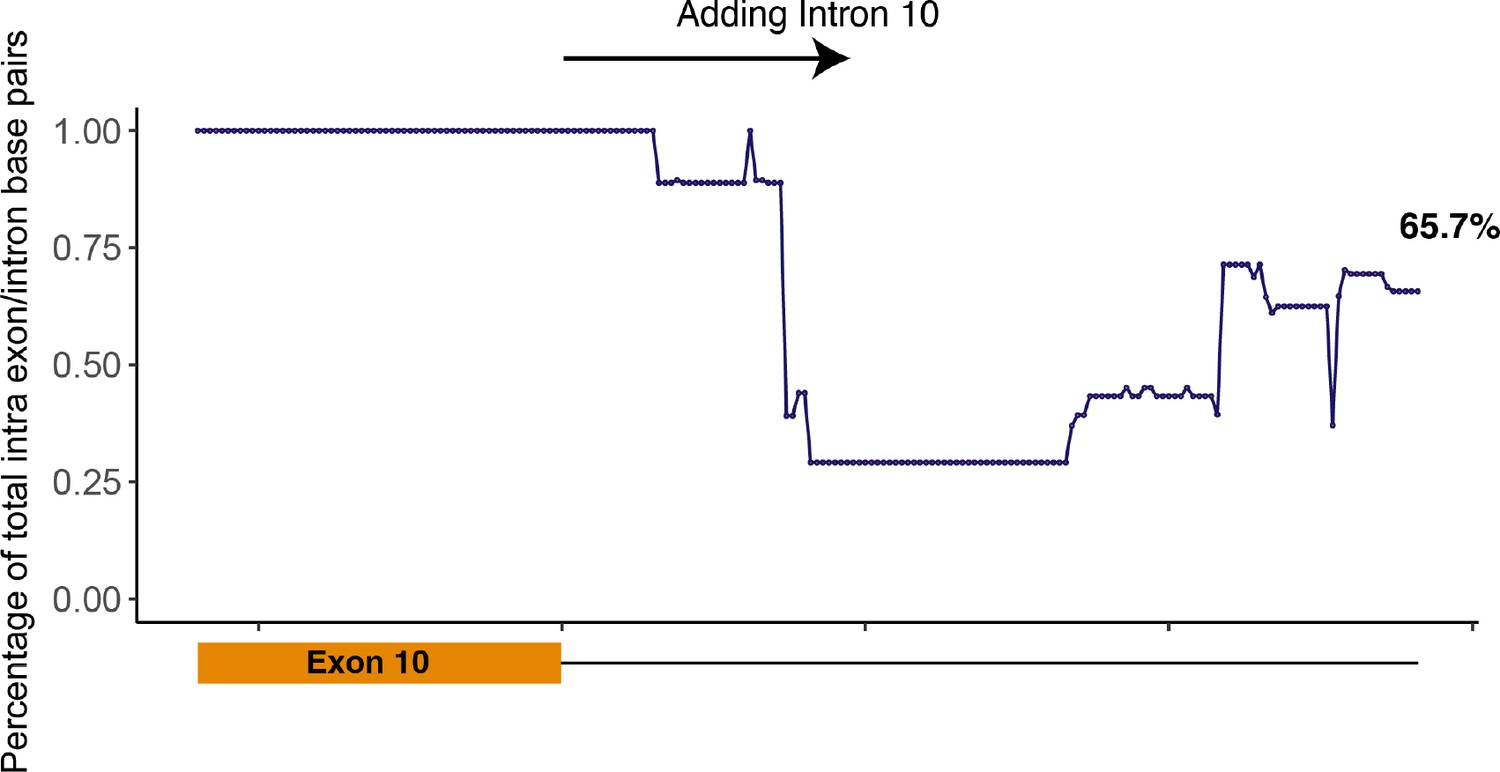
Scatter plot showing the percentage of intra-exon/intron base pairs out of total number of base pairs.
Initially, exon 10 was folded; thus, the percentage of intra-exon base pairs was 100%. Intron 10 nucleotides were then added one at a time, and the RNA sequence was refolded after each addition. When all intron 10 nucleotides were included in the folding, 65.7% of base pairs were intra-exon/intron.
Figure 2—figure supplement 3
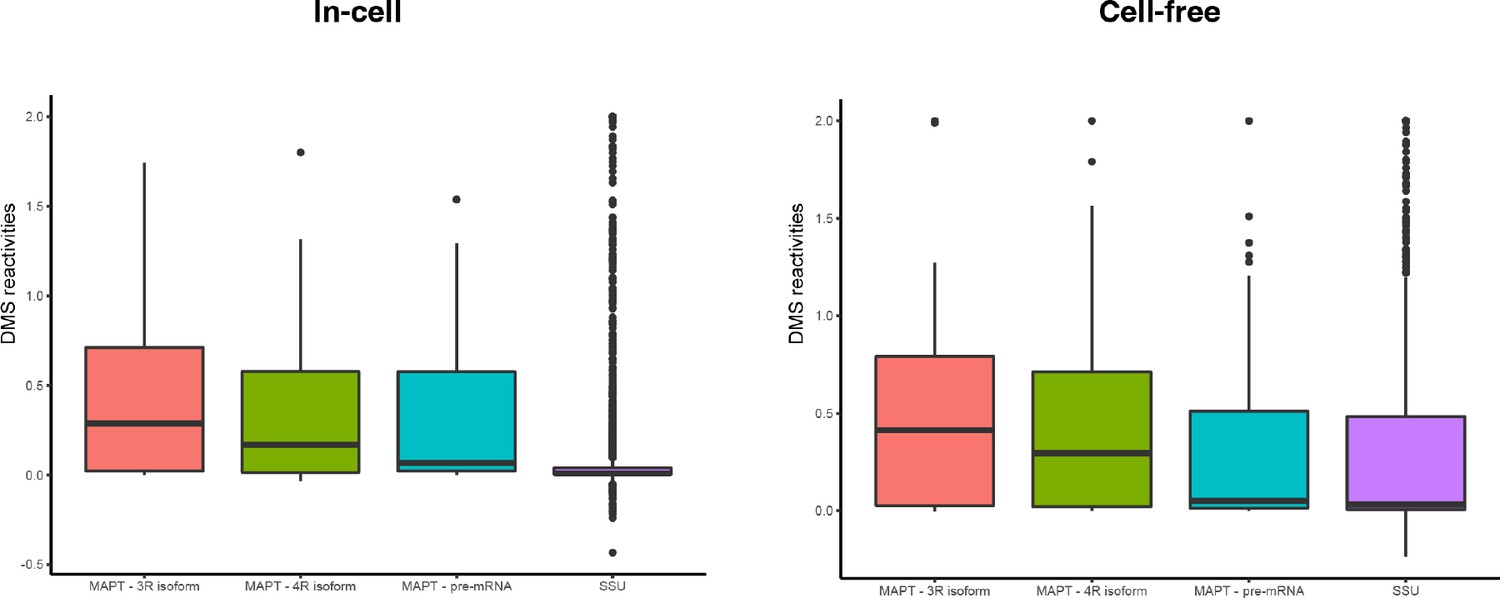
Box plots of distribution of dimethyl sulfate (DMS) reactivities for small subunit (SSU), three repeat (3R) isoform, four repeat (4R) isoform, and precursor mRNA (pre-mRNA) for in-cell and cell-free conditions.
Figure 2—figure supplement 4
Mutations shift the structural ensemble.
(A) Density histogram showing the distribution of unfolding free energies of the 5’ splice site (defined as last three nucleotides of exon and first six nucleotides of intron) for all structures in the ensemble for wildtype (WT) and three repeat (3R) (+19C>G) and four repeat (4R) (+15A>C). Distributions for each sequence are colored according to the legend. (B) t-Distributed stochastic neighbor embedding (t-SNE) visualization of structural ensemble of WT and 3R (+19C>G) and 4R (+15A>C) mutations. Structures were predicted using Boltzmann suboptimal sampling guided by dimethyl sulfate (DMS) reactivity data. Shown are 3000 structures corresponding to 1000 structures per category. Each dot represents a single structure and was colored by calculated unfolding free energy of the 5’ splice site. Data were clustered by k-means clustering, and representative structures for five clusters are shown. Bar plots show the proportions of WT, 3R, and 4R in clusters. The exon-intron junction is marked with an arrow on each structure. Position of 3R and 4R mutations are marked by red asterisks.
Figure 3 with 1 supplement

The best predictor of exon 10 percent spliced in (PSI) for intronic and synonymous mutations was the unfolding free energy of precursor mRNA (pre-mRNA) during the Bact stage of splicing.
(A) Spliceosome footprint on pre-mRNA during splicing cycle. Structure in the center of the cycle is the wildtype (WT) representative structure from Figure 2B. The dotted box indicates the zoomed-in region at each stage of interest. Cryo-EM structures of the human spliceosome complex at stages Pre-B (PDB ID: 6Q × 9), B (PDB ID: 5O9Z), Pre-Bact (PDB ID: 7ABF), and Bact (PDB ID: 5Z56) are available in the Protein Data Bank. The region around the 5’ splice site of pre-mRNA within the spliceosome at each stage is highlighted in blue on the zoomed-in representative structure. The number of nucleotides for each stage is as follows: Pre-B (2 exonic and 8 intronic); B (10 exonic and 17 intronic); Pre-Bact (9 exonic and 20 intronic); Bact (12 exonic and 31 intronic). These values represent the minimum number of nucleotides required to be unfolded to be accessible to the spliceosome. The mean free energy and SE to unfold RNA within the spliceosome at each stage are calculated for the WT structural ensemble and indicated under the zoomed-in structure. (B) Exon 10 PSIs of synonymous and intronic mutations predicted with the unfolding free energy of pre-mRNA within the spliceosome in B, Pre-B, Pre-Bact, and Bact stages vs. corresponding experimental PSIs measured in splicing assays. Exon 10 PSIs were predicted using Equation 2. Gray line represents the best fit with dotted lines indicating the 95% CI. Pearson correlation coefficients (R2) of experimental to predicted PSIs were calculated for each stage. Violin plots (inset) show R2s calculated for each mutation category by training and testing on subsets of all mutations by non-parametric bootstrapping; synonymous (n=6), intronic (n=14), and WT (n=1). (C) Overall R2 calculated for experimental vs. predicted exon 10 PSIs by non-parametric bootstrapping of mutations. Subsets of mutations were randomly sampled 10 times, trained and tested using unfolding free energy of the exon-intron junction region of pre-mRNA within the spliceosome for the respective splicing stage. Pearson’s R2 was calculated by comparing predicted PSIs to experimental PSIs. A two-tailed Wilcoxon rank sum test was used to determine significance between Bact complex and the other three complexes. Level of significance: ***p-value<10–6, **p-value<0.001, and * p-value<0.01.
Figure 3—figure supplement 1
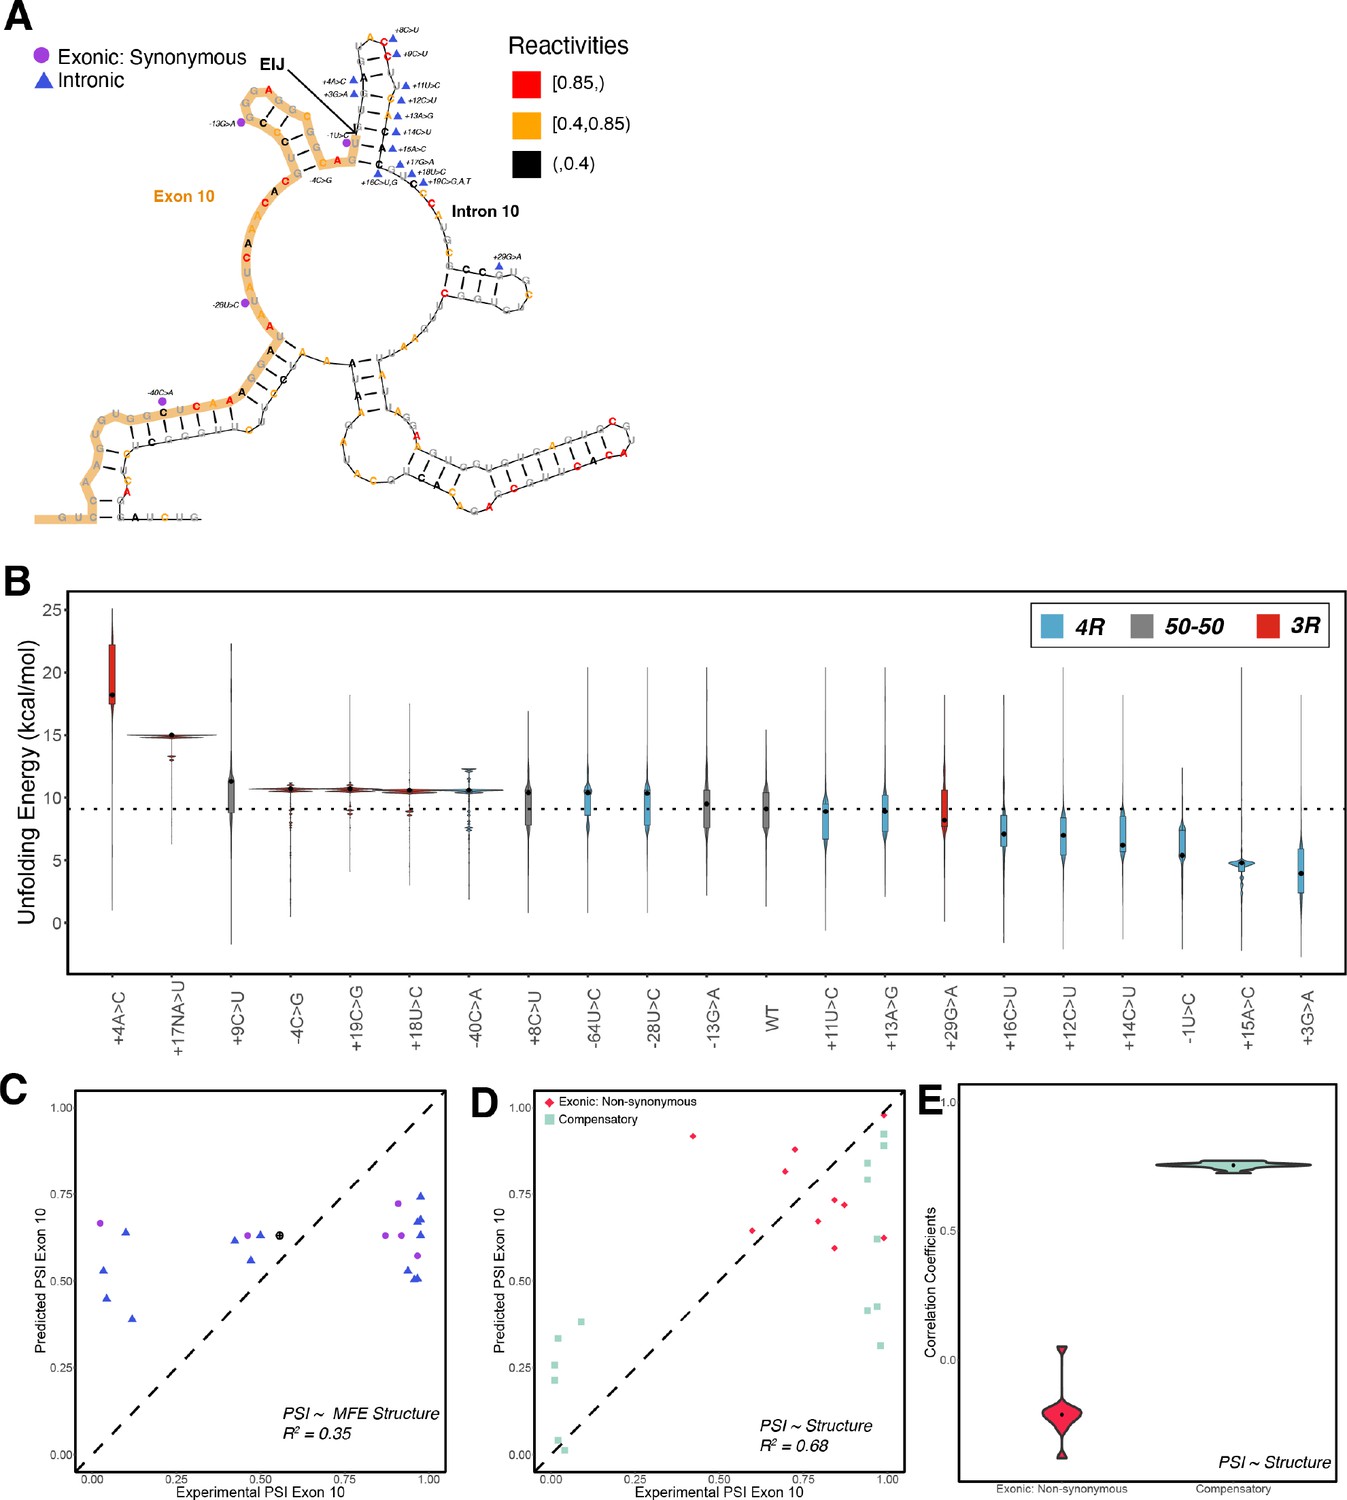
Structure is a poor predictor of exon 10 percent spliced in (PSI) for exonic non-synonymous mutations.
(A) Positions of intronic and synonymous mutations used in training the structure model are shown on the wildtype structure. Each nucleotide is colored by its corresponding reactivity value. (B) Violin plots of the distribution of unfolding free energy of the pre-mRNA in the spliceosome Bact complex for the 1000 structures in the ensembles of the 22 intronic and synonymous mutations. Each violin plot is colored by whether the mutation promotes production of three repeat (3R) or four repeat (4R) or whether the ratio remains 1:1. (C) Exon 10 PSIs of 22 mutations predicted using unfolding free energy for nucleotides in Bact complex for the single minimum free energy structure and plotted against experimentally determined PSIs. Each point on the scatterplot represents a mutation and is colored by mutation type. The closer the points are to the diagonal, the more accurate the prediction. (D) Exon 10 PSIs of non-synonymous and compensatory mutations predicted using the unfolding free energy of pre-mRNA within the Bact complex plotted against experimentally determined PSIs. (E) Violin plots for Pearson correlation coefficients (R2s) calculated for non-synonymous (n=10) and compensatory (n=14) mutation categories by training and testing on subsets of all mutations by non-parametric bootstrapping.
Figure 4 with 2 supplements
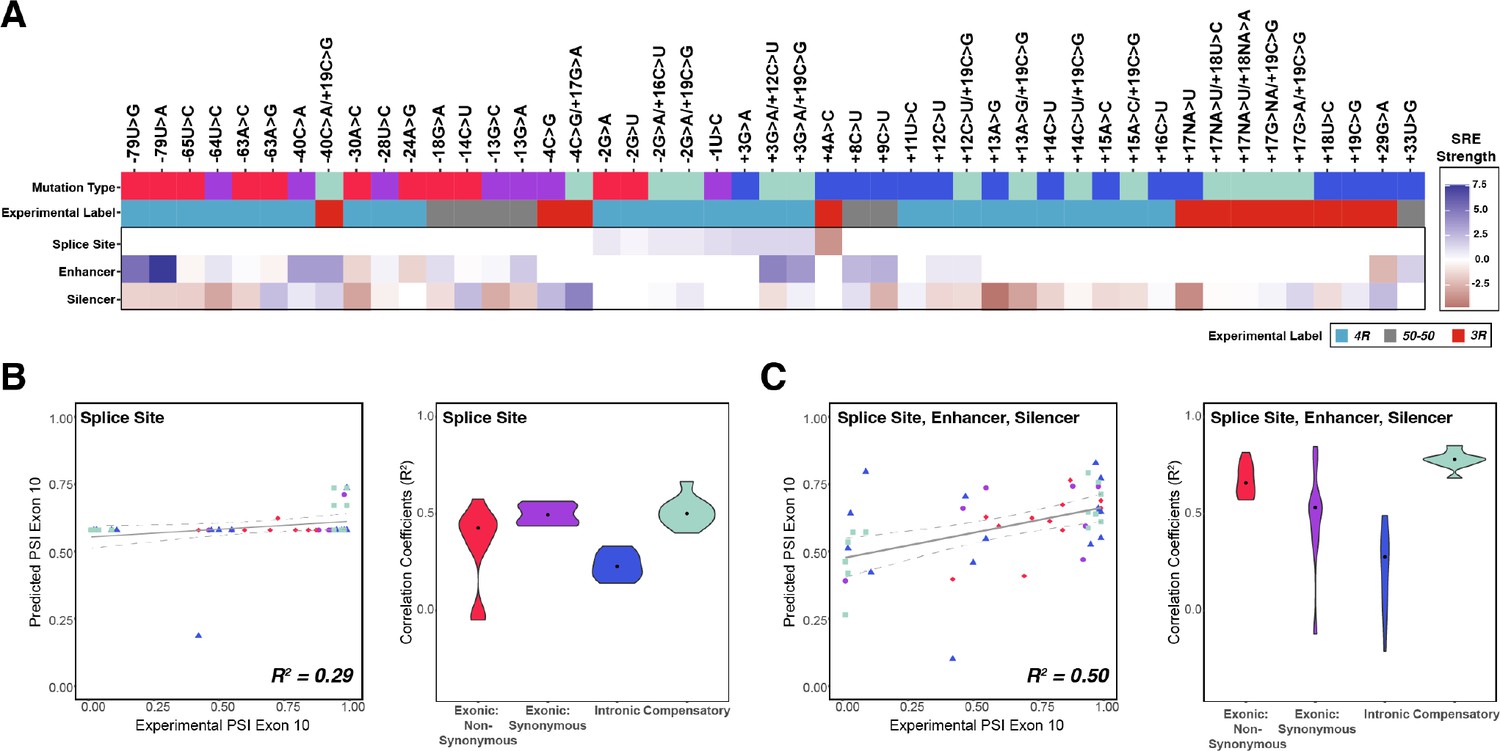
Combining the strength of all splicing regulatory elements (SREs) significantly improves prediction of exon 10 percent spliced in (PSI) compared to using only splice site strength.
(A) Heatmap of SRE relative strength for 47 mutations compared with wildtype (WT). A value of 0 indicates mutation does not change WT SRE strength, positive values indicate SRE strength is greater than WT, and negative values indicate SRE strength is weaker than WT. Splice site strengths were calculated using MaxEntScan; a splice site was defined as the last three nucleotides of the exon and first six nucleotides of the intron. Enhancer and silencer strengths were calculated from position weight matrices of known motifs derived from cell-based screens (Materials and methods). Mutation type refers to whether the mutation is exonic non-synonymous, exonic synonymous, intronic, or compensatory. Experimental label is the label given by the original study that experimentally validated each mutation using a splicing assay. (B) Exon 10 PSIs of 47 mutations predicted from change in splice site strength and plotted against experimental PSIs measured in splicing assays. Exon 10 PSIs predicted using Equation 4. Each point on the scatterplot represents a mutation and is colored by mutation category. Gray line represents the best fit with dotted lines indicating the 95% CI. Pearson correlation coefficient (R2) calculated of experimental to predicted PSIs. Violin plot shows R2s calculated for each category by training and testing on subsets of all mutations by non-parametric bootstrapping; exonic non-synonymous (n=11), exonic synonymous (n=7), intronic (n=15), compensatory (n=14), and WT (n=1). (C) Exon 10 PSIs of 47 mutations predicted by combining change in splice site, enhancer, and silencer strength and plotted against experimental PSIs measured in splicing assays. Exon 10 PSIs predicted using Equation 5.
-
Figure 4—source data 1
Values of heatmap plotted in Figure 4A which show the relative splicing regulatory strength for 47 mutations compared with wildtype.
Each row contains the mutation ID (Supplementary file 2), the mutation type, the enhancer relative strength, the silencer relative strength, and the splice site relative strength for the mutation.
- https://cdn.elifesciences.org/articles/73888/elife-73888-fig4-data1-v2.txt
Figure 4—figure supplement 1
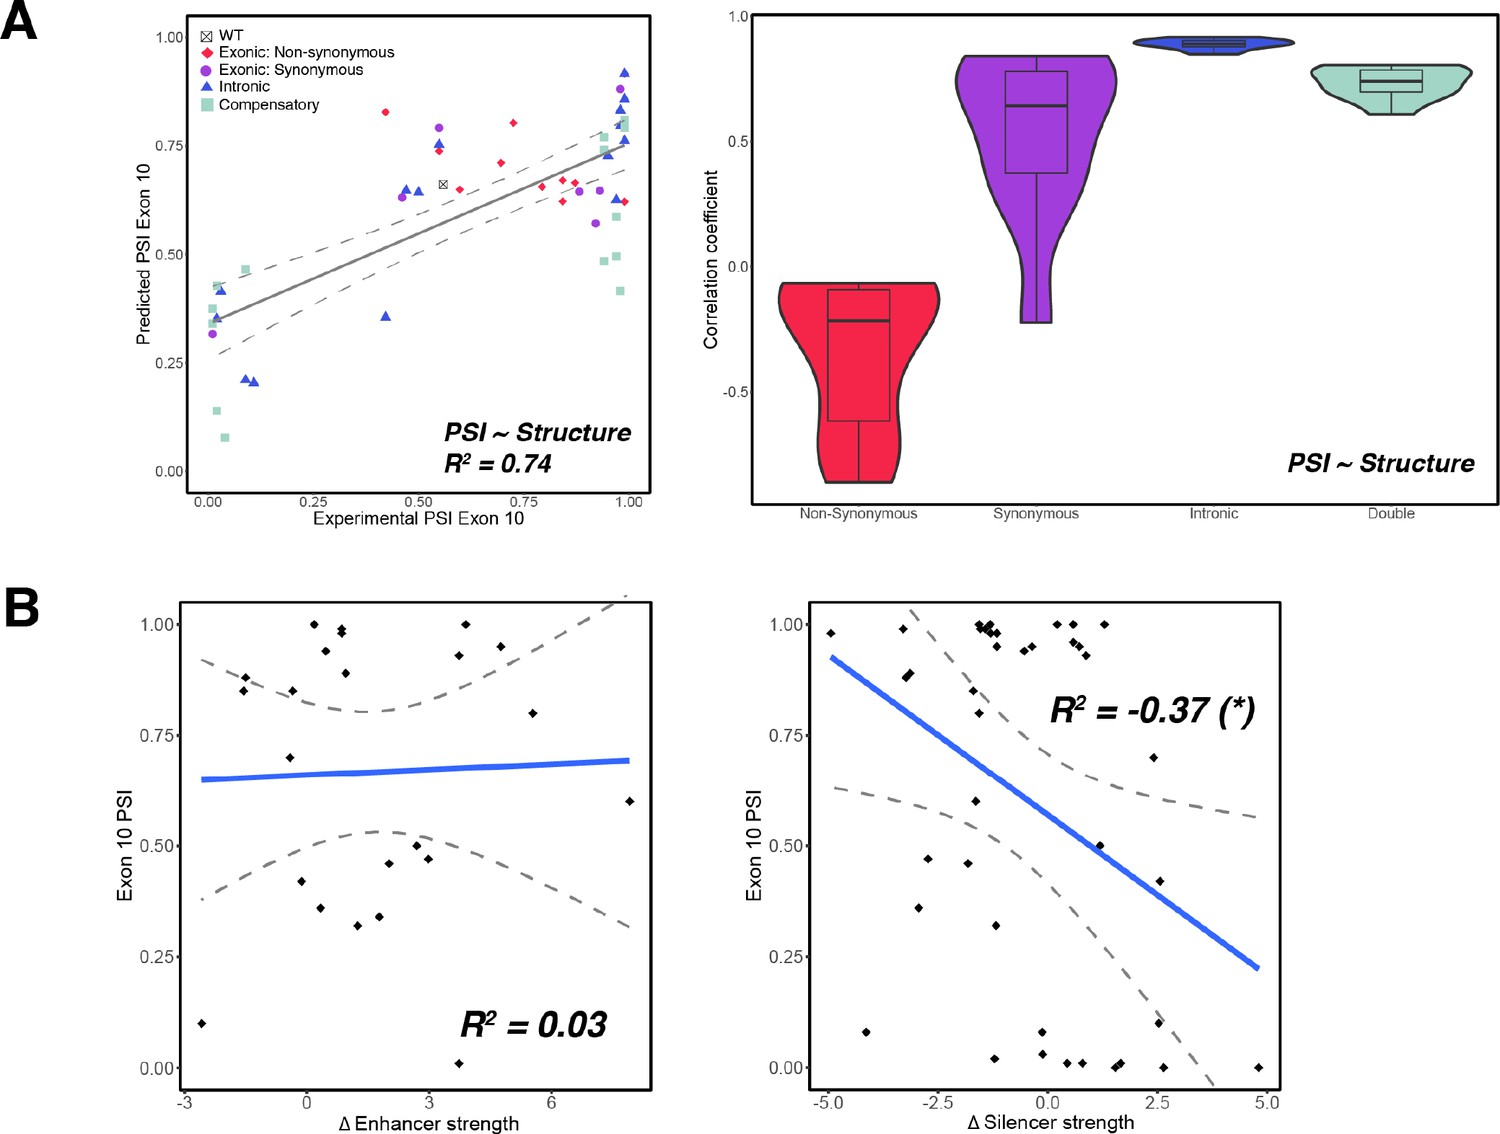
RNA-binding protein (RBP) binding motif strength is a poor predictor of exon 10 percent spliced in (PSI) for all mutations.
RBP binding motif strength is a poor predictor of exon 10 PSI for all mutations. (A) Exon 10 PSIs of 47 mutants predicted from structural change (Equation 2) and plotted against experimentally determined PSIs. Each point on the scatterplot is colored by mutation type. Gray line represents the best fit, and dotted lines indicate the 95% CI. Violin plot shows Pearson correlation coefficient (R2s) calculated for exonic non-synonymous (n=11), exonic synonymous (n=7), intronic (n=15), and compensatory (n=14) mutations by training and testing on subsets of all mutations by non-parametric bootstrapping. (B) Change in enhancer or silencer strength vs. exon 10 PSI. Each point represents a mutation. Blue line represents the best fit, and dotted lines indicate the 95% CI. The negative correlation between silencer strength and exon 10 PSI is statistically significant with a p-value of 0.004.
Figure 4—figure supplement 2
RNA-binding protein (RBP) binding motif strength is a poor predictor of exon 10 percent spliced in (PSI) for all mutations.
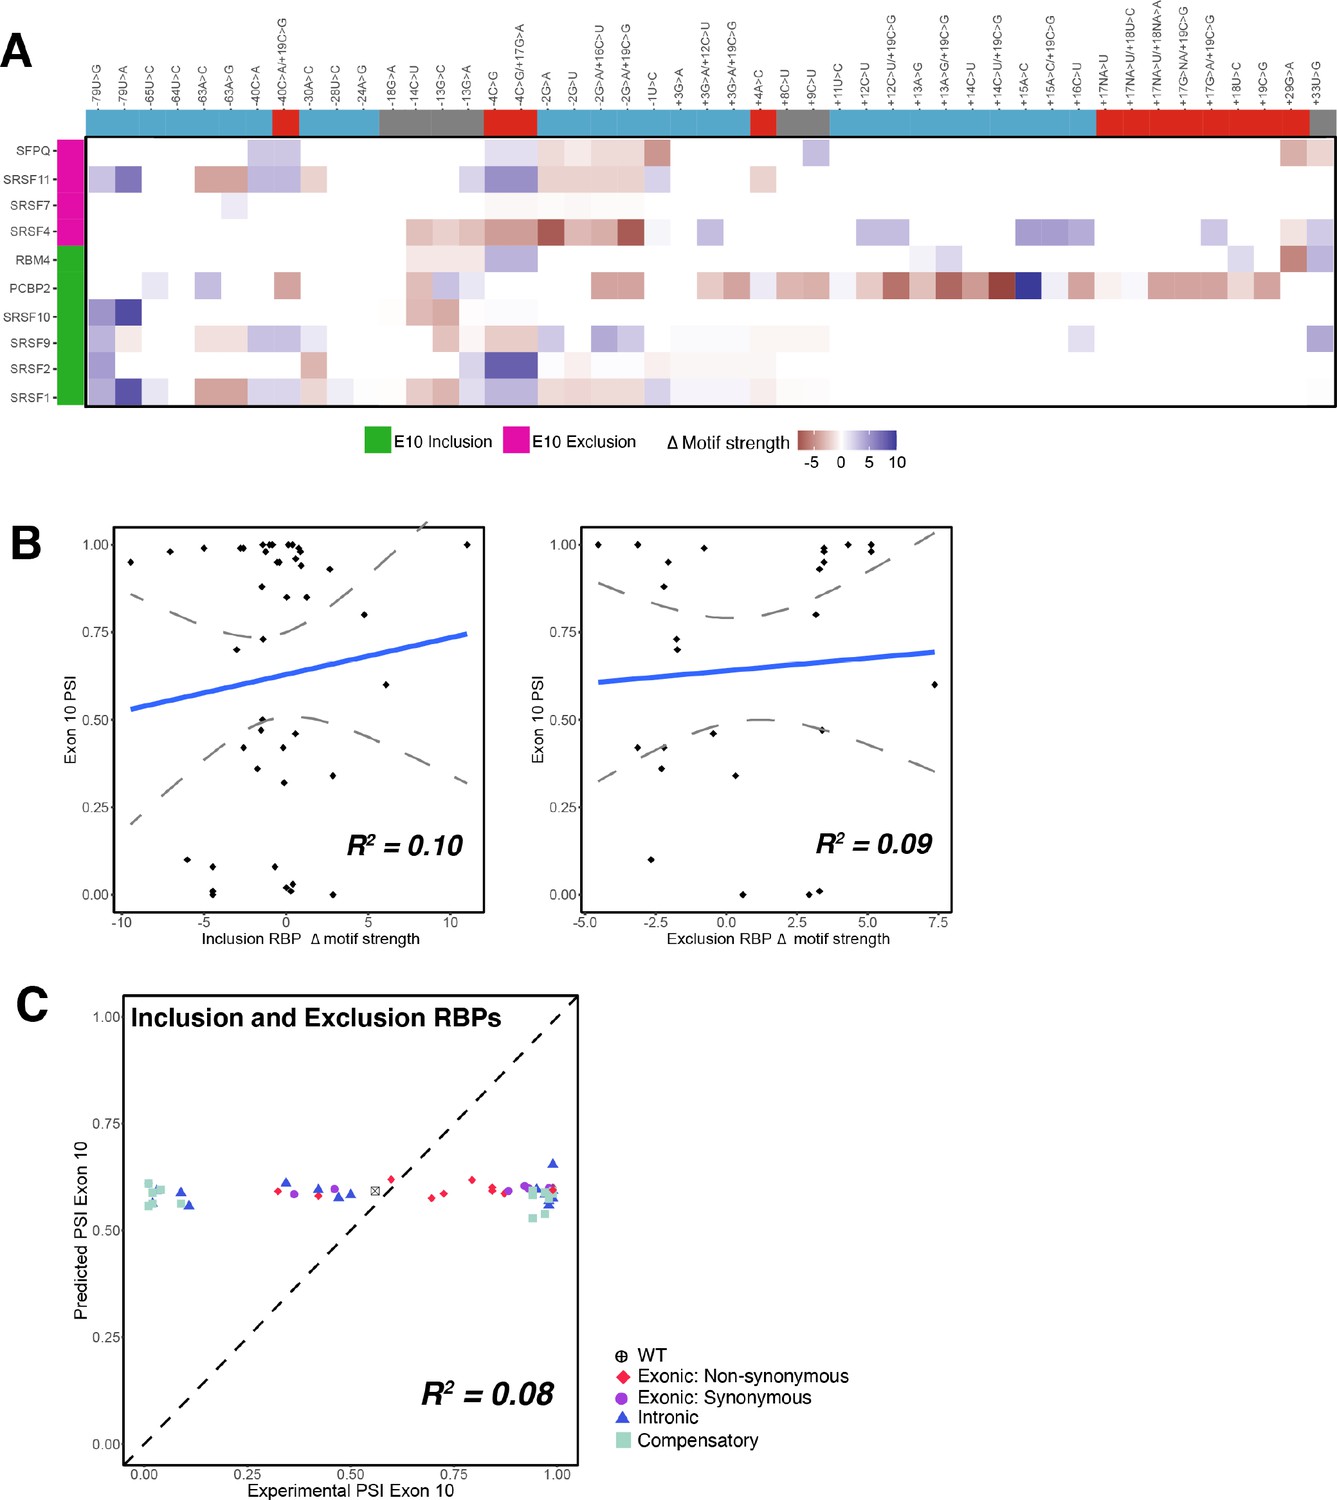
(A) Heatmap of relative RBP binding motif strengths compared to wildtype (WT) for 44 mutations. A value of 0 indicates that the mutation does not change RBP binding motif strength, a positive value indicates increase in RBP binding motif strength, and a negative value indicates weaker strength. RBPs implicated in the regulation of exon 10 splicing (Qian and Liu, 2014) and RBP binding motifs (Dominguez et al., 2018 and Ray et al., 2013) were previously reported. RBPs implicated in the splicing inclusion of exon 10 are highlighted in pink, and RBPs involved in the exclusion of exon 10 are highlighted in green. Mutations are marked based on whether they promote production of three repeat or four repeat or do not alter the 1:1 ratio of the WT MAPT. (B) Scatter plot of changes in RBP motif strength vs. exon 10 PSI categorized based on whether the RBP is implicated in exclusion or inclusion of exon 10. Neither correlation coefficient is statistically significant. (C) Exon 10 PSIs of 44 mutants predicted using the combined change in motif strength of RBPs implicated in the inclusion of exon 10 and those implicated in the exclusion of exon 10 (Equation 6), plotted against experimental PSIs measured in splicing assays. Each point represents a mutation and is colored by mutation type. The closer to the diagonal, the more accurate the prediction.
Figure 5 with 1 supplement
Combining structure and splicing regulatory element (SRE) strength into a unified model best predicts exon 10 percent spliced in (PSI).
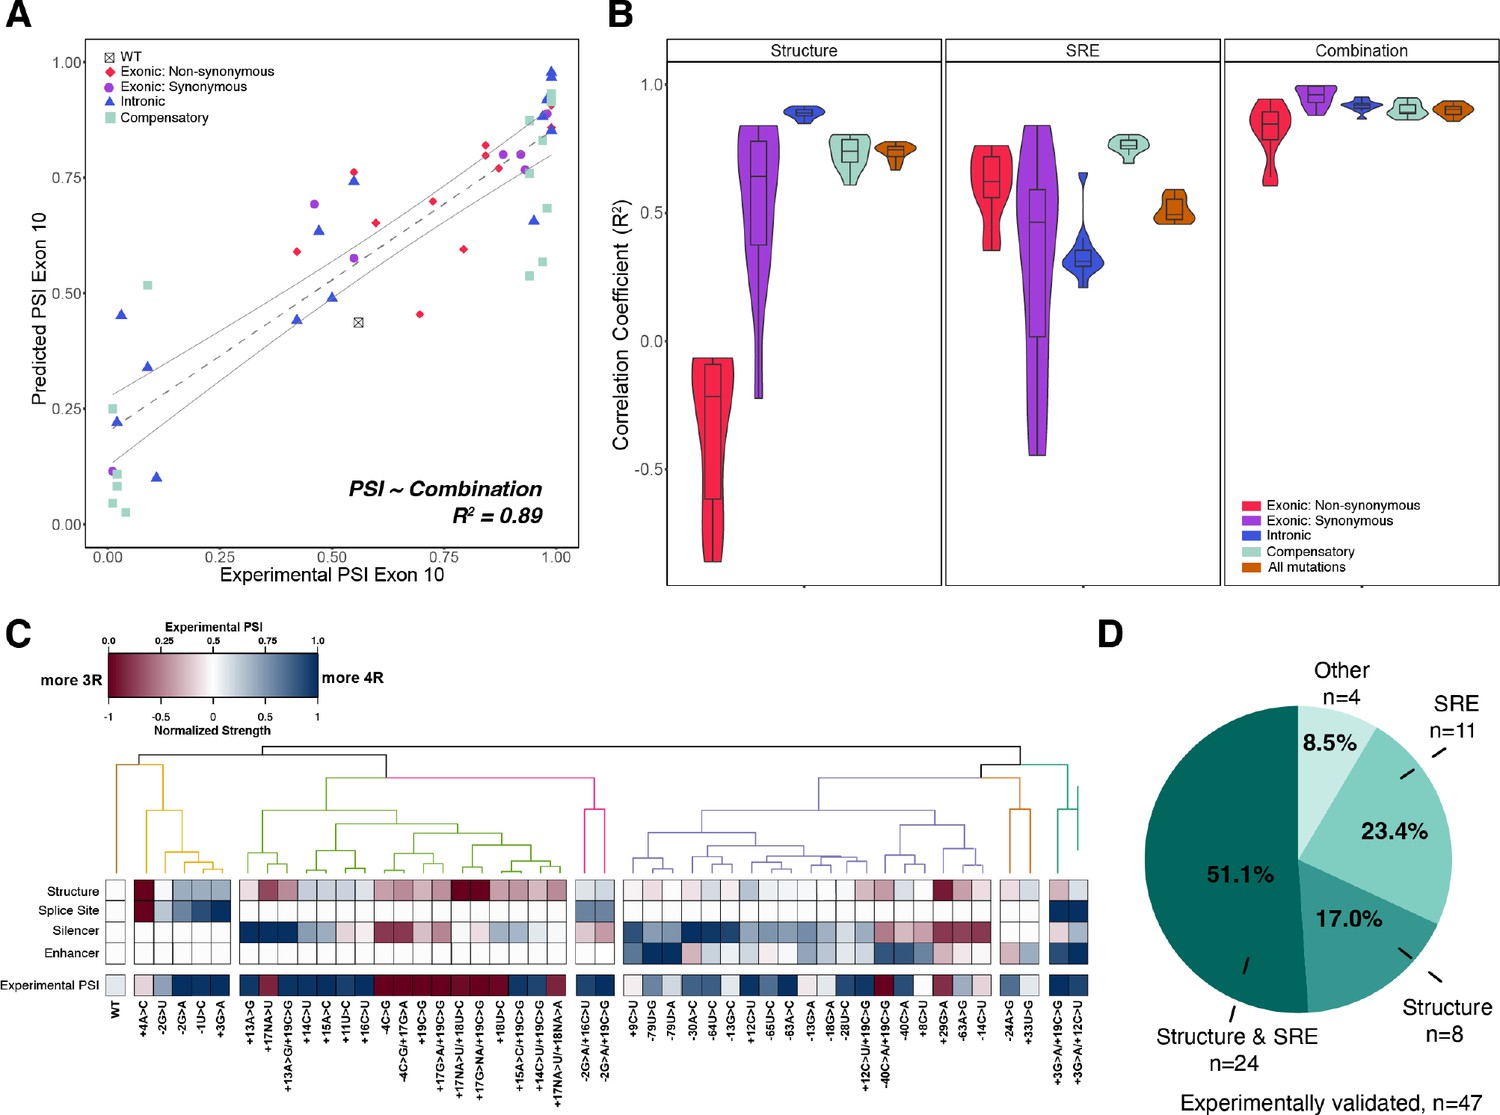
(A) Exon 10 PSIs of 47 mutations predicted from combined model using structure and SRE strength and fit to experimental PSIs measured in splicing assays. Exon 10 PSIs predicted using Equation 7. Each point on scatterplot represents a mutation and is colored by mutation category. Gray line represents the best fit with dotted lines indicating the 95% CI. Pearson correlation coefficient (R2) calculated of experimental to predicted PSIs. (B) Violin plots of correlation coefficients for each mutation category for structure model, SRE model, and combined model. R2s calculated for each mutation category by training and testing on subsets of all mutations by non-parametric bootstrapping 10 times. Structure model uses unfolding free energy of precursor mRNA (pre-mRNA) within spliceosome at Bact stage as predictor. SRE strength model uses relative change in SRE strength as predictor. Combination model using both structure and SRE strength and weighs the features based on if mutation is intronic/synonymous or non-synonymous (Materials and methods). (C) Heatmap of the normalized changes in structure and SRE strength for each mutation clustered by affected features. Features were normalized such that a value of 1 predicts exon 10 spliced in (four repeat [4R] isoform, blue), whereas a value of 0 implies exon 10 spliced out (three repeat [3R] isoform, red). Mutations were clustered using hierarchical clustering on normalized features (Materials and methods). Experimental PSIs are plotted for each mutation with a PSI of 1 colored as blue, PSI of 0.5 colored as white, and PSI of 0 colored as red. (D) Pie chart showing the features that regulate exon 10 splicing for the 47 experimentally validated mutations. The pie chart was generated based on the heatmap in C. Exon 10 splicing for 51.1% of mutations is supported by changes in both structure and SRE. This implies that structure, at least one SRE motif, and PSI are all blue or all red in the heatmap in (C). Exon 10 splicing for 23.4% of mutations is supported by changes in SRE wherein one of the SREs is the same color as PSI. For 17.0% of mutations, structural changes support exon 10 splicing wherein structure and PSI are the same color. For 4 mutations (8.5%), the colors of none of the features match the color of PSI.
-
Figure 5—source data 1
Values of heatmap plotted in Figure 5C which show the normalized changes in structure and splicing regulatory element (SRE) strength.
Each row contains the mutation ID (Supplementary file 2), the normalized splice strength, normalized silencer strength, normalized enhancer strength, normalized mean ΔG‡ of unfolding, and experimental percent spliced in (PSI) of the mutation.
- https://cdn.elifesciences.org/articles/73888/elife-73888-fig5-data1-v2.txt
Figure 5—figure supplement 1
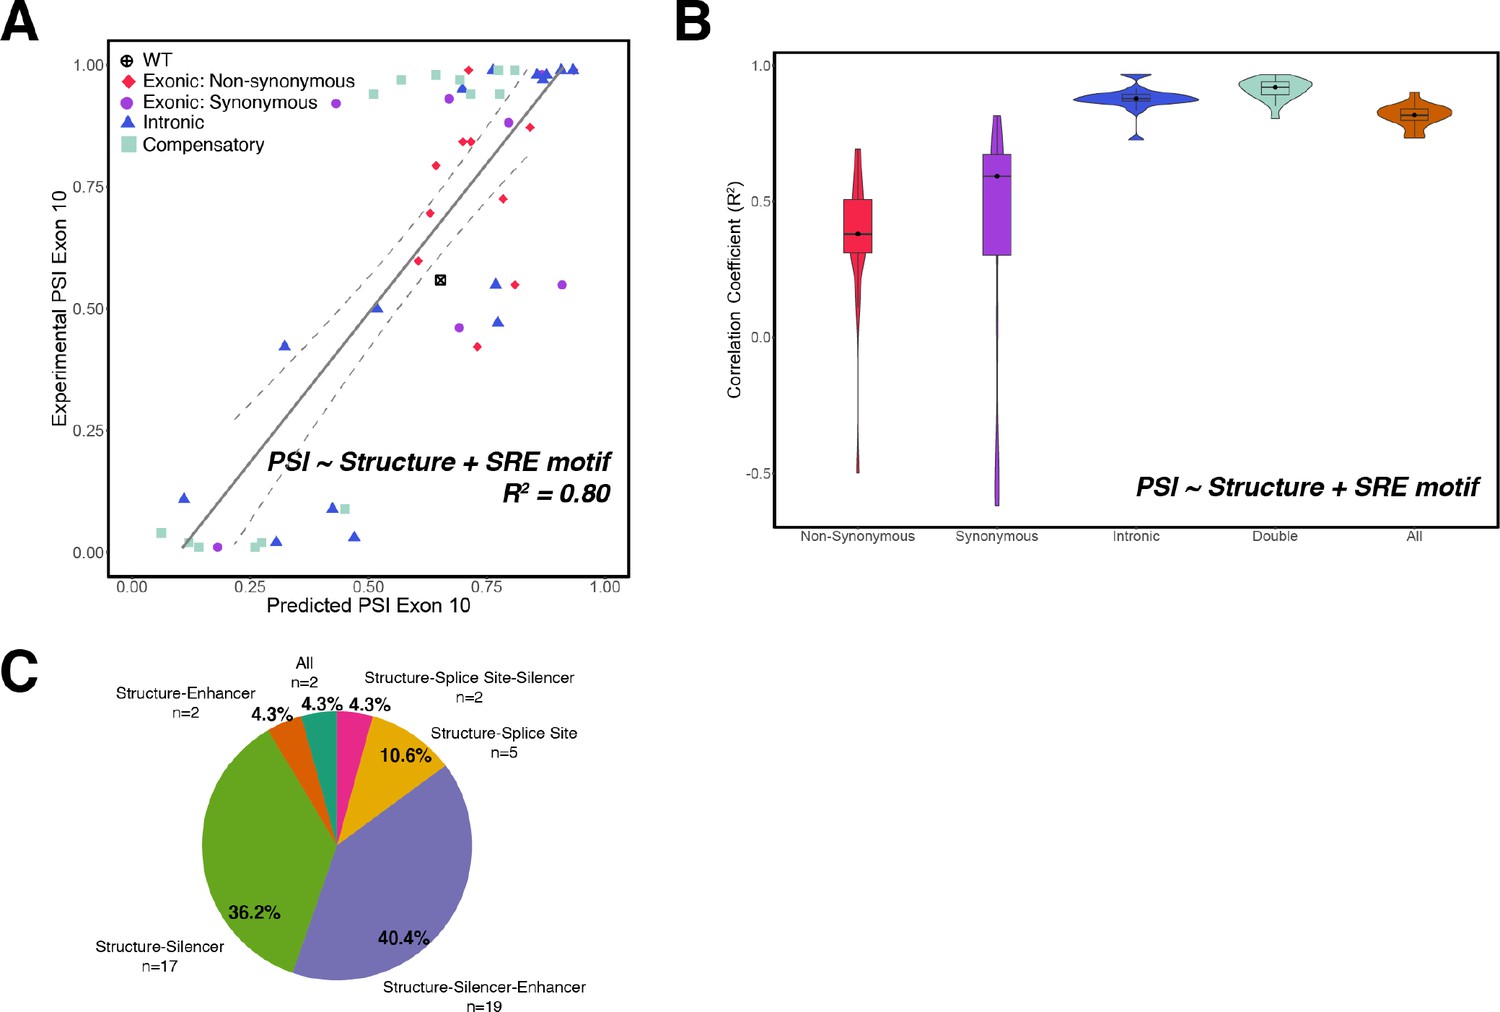
Additive model of structure and splicing regulatory element (SRE) has poorer predictive performance than combined interactive model.
(A) Experimentally measured percent spliced ins (PSIs) vs. exon 10 PSIs of 47 mutants and wildtype (WT) MAPT predicted using addition between structure and SRE strength (Equation 8). Each point represents a mutant and is colored by mutation type. Gray line represents the best fit, and dotted lines indicate the 95% CI. (B) Violin plots of correlation coefficients for each mutation type for the additive model (Equation 8). R2s were calculated for each mutation type by non-parametric bootstrapping 10 times. (C) Pie chart of number and proportion of experimentally validated mutations in each cluster.
Figure 6 with 1 supplement
Combined model is predictive of exon 10 inclusion ratios for previously uncharacterized mutations.
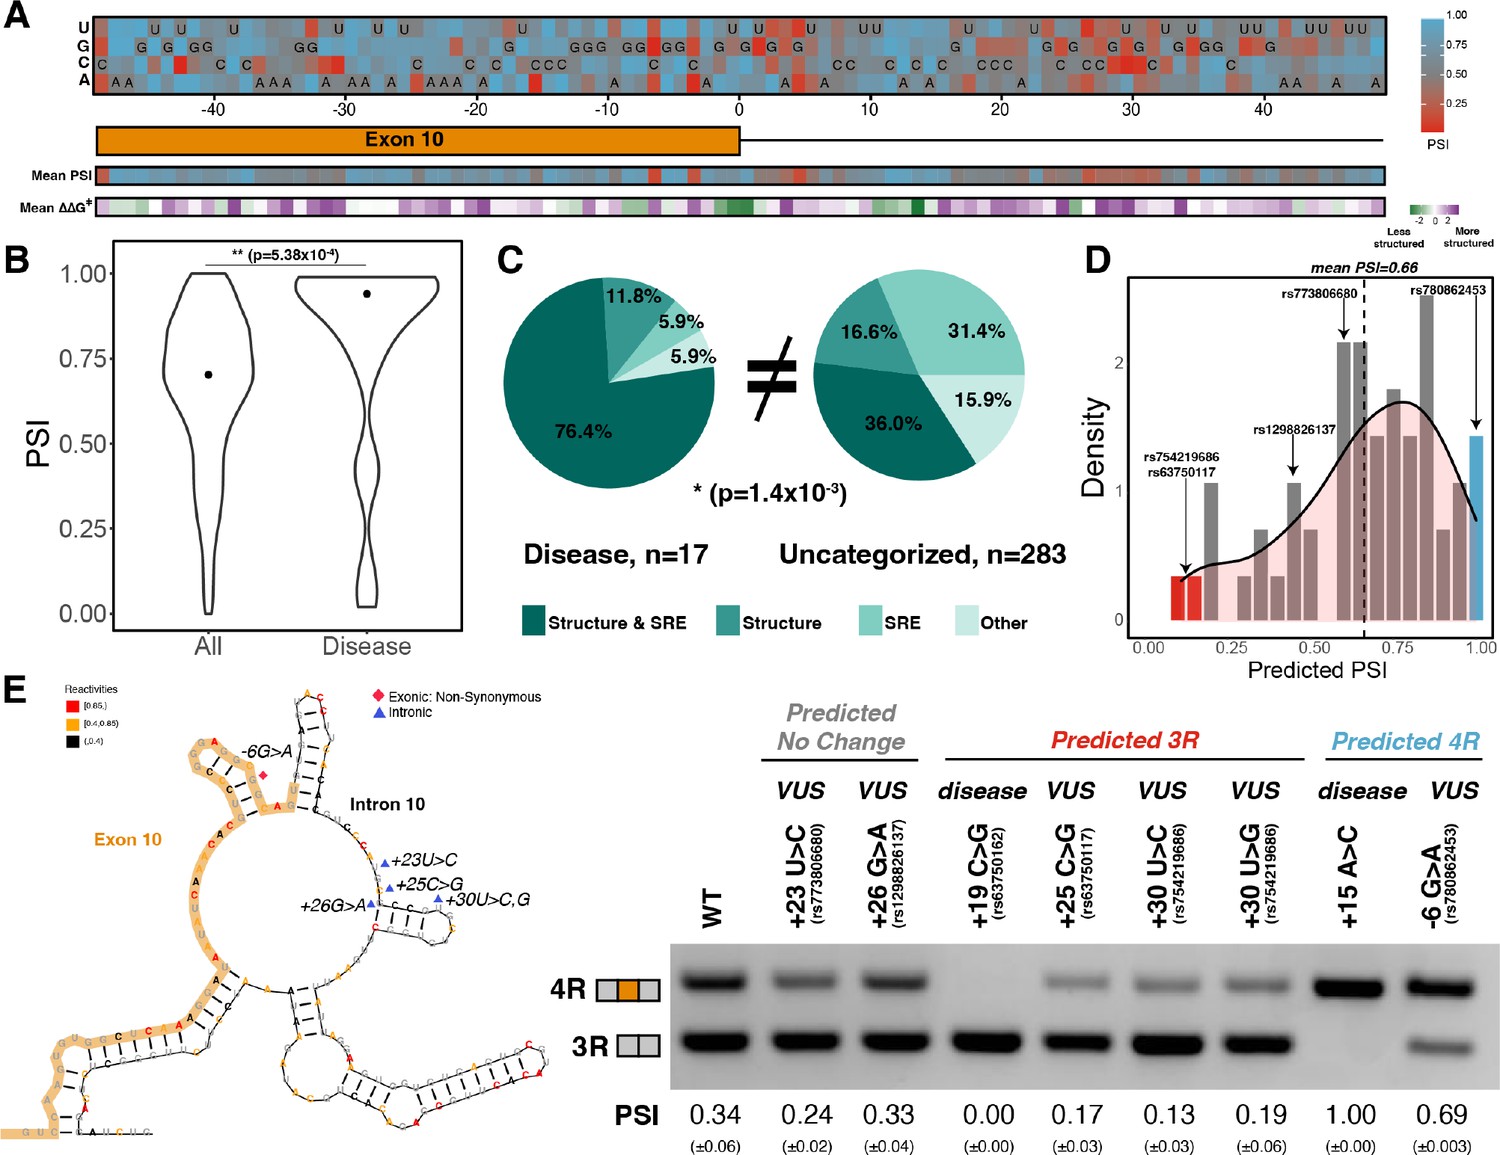
(A) Heatmap of predicted exon 10 percent spliced ins (PSIs) for every possible mutation around 100 nucleotide window of exon 10 – intron 10 junction. Combined model was trained using 47 mutations with experimental PSIs measured from splicing assays as shown in Figure 5A and then used to predict PSIs for all mutation combinations for 100 nucleotides around the junction. Tiles with sequence indicate the wildtype (WT) nucleotide at the position. Heatmap of mean PSI per position and mean relative change in unfolding free energy of pre-mRNA within spliceosome at Bact stage compared with WT is shown below the gene diagram. (B) Violin plot of predicted PSIs for all possible mutations around exon 10 – intron 10 junction and only disease mutations. All possible mutations (n=300) and disease mutations (n=17). A two-tailed Wilcoxon rank sum test was used to determine significance between the two categories. Level of significance: ***p-value<10–6, **p-value<0.001, and * p-value<0.01. (C) Pie chart showing features that drive exon 10 splicing for disease and presently uncategorized mutations. The pie chart was generated by quantifying the number of mutations for which the direction of predicted exon 10 PSI matched the direction of structure or splicing regulatory element (SRE) change. Exon 10 splicing for 76.4% of disease mutations is supported by changes to both structure and SRE compared with only 36.0% of uncategorized mutations. The difference in proportions was tested with a one-tailed Fisher’s exact test. (D) Histogram displaying the distribution of predicted PSIs using the combined model for 55 variants of unknown significance (VUSs) found in dot-bracket SNP (dbSNP). Density curve was overlaid on top of histogram showing that predicted PSIs skew away from three repeat (3R). Dotted line shows mean predicted PSI of 0.66. VUSs tested in splicing assays are indicated by their dbSNP RS IDs. (E) Representative gel of RT-PCR data for splicing assay in the presence of VUSs. Splicing reporter was transfected into HEK293 cells. The mean exon 10 PSI displayed for each variant was calculated from three replicates, and SE is shown in brackets below. Structure diagram on left displays the location of the VUSs tested.
-
Figure 6—source data 1
Values of heatmap of in-silico mutagenesis around exon 10 – intron 10 junction shown in upper panel of Figure 6A.
Each row contains mutation ID (Supplementary file 6), the relative position of the mutation with respect to the exon 10 – intron 10 junction, mutation type, mutated base, wildtype (WT) base, and predicted percent spliced in (PSI) using combined interactive model.
- https://cdn.elifesciences.org/articles/73888/elife-73888-fig6-data1-v2.txt
-
Figure 6—source data 2
Values of heatmap of mean percent spliced in (PSI) predicted per position shown in lower panel of Figure 6A.
Each row contains the relative position with respect to the exon 10 – intron 10 junction and the mean predicted PSI of the three mutations for that position.
- https://cdn.elifesciences.org/articles/73888/elife-73888-fig6-data2-v2.txt
-
Figure 6—source data 3
Values of heatmap of mean ΔΔG‡ per position shown in lower panel of Figure 6A.
Each row contains the relative position with respect to the exon 10 – intron 10 junction and the mean ΔΔG‡ of the three mutations for that position.
- https://cdn.elifesciences.org/articles/73888/elife-73888-fig6-data3-v2.txt
-
Figure 6—source data 4
Values of predicted percent spliced in (PSI) predicted for 55 variants of unknown significance (VUSs) shown in Figure 6D.
Each row contains the mutation ID (Supplementary file 3), the relative position of the mutation with respect to the exon 10 – intron 10 junction, the wildtype (WT) base, the mutated base, and the predicted PSI for the VUS using the combined interactive model.
- https://cdn.elifesciences.org/articles/73888/elife-73888-fig6-data4-v2.txt
-
Figure 6—source data 5
Band intensities of three replicates calculated for splicing reporter gels for six variants of unknown significance (VUSs) and wild type (WT) shown in Figure 6E.
Each row contains the mutation, the replicate number, the four repeat (4R) band intensity, three repeat (3R) band intensity, calculated percent spliced in (PSI) from the band intensities, and the mean calculated PSI for the mutation from three replicates.
- https://cdn.elifesciences.org/articles/73888/elife-73888-fig6-data5-v2.txt
Figure 6—figure supplement 1
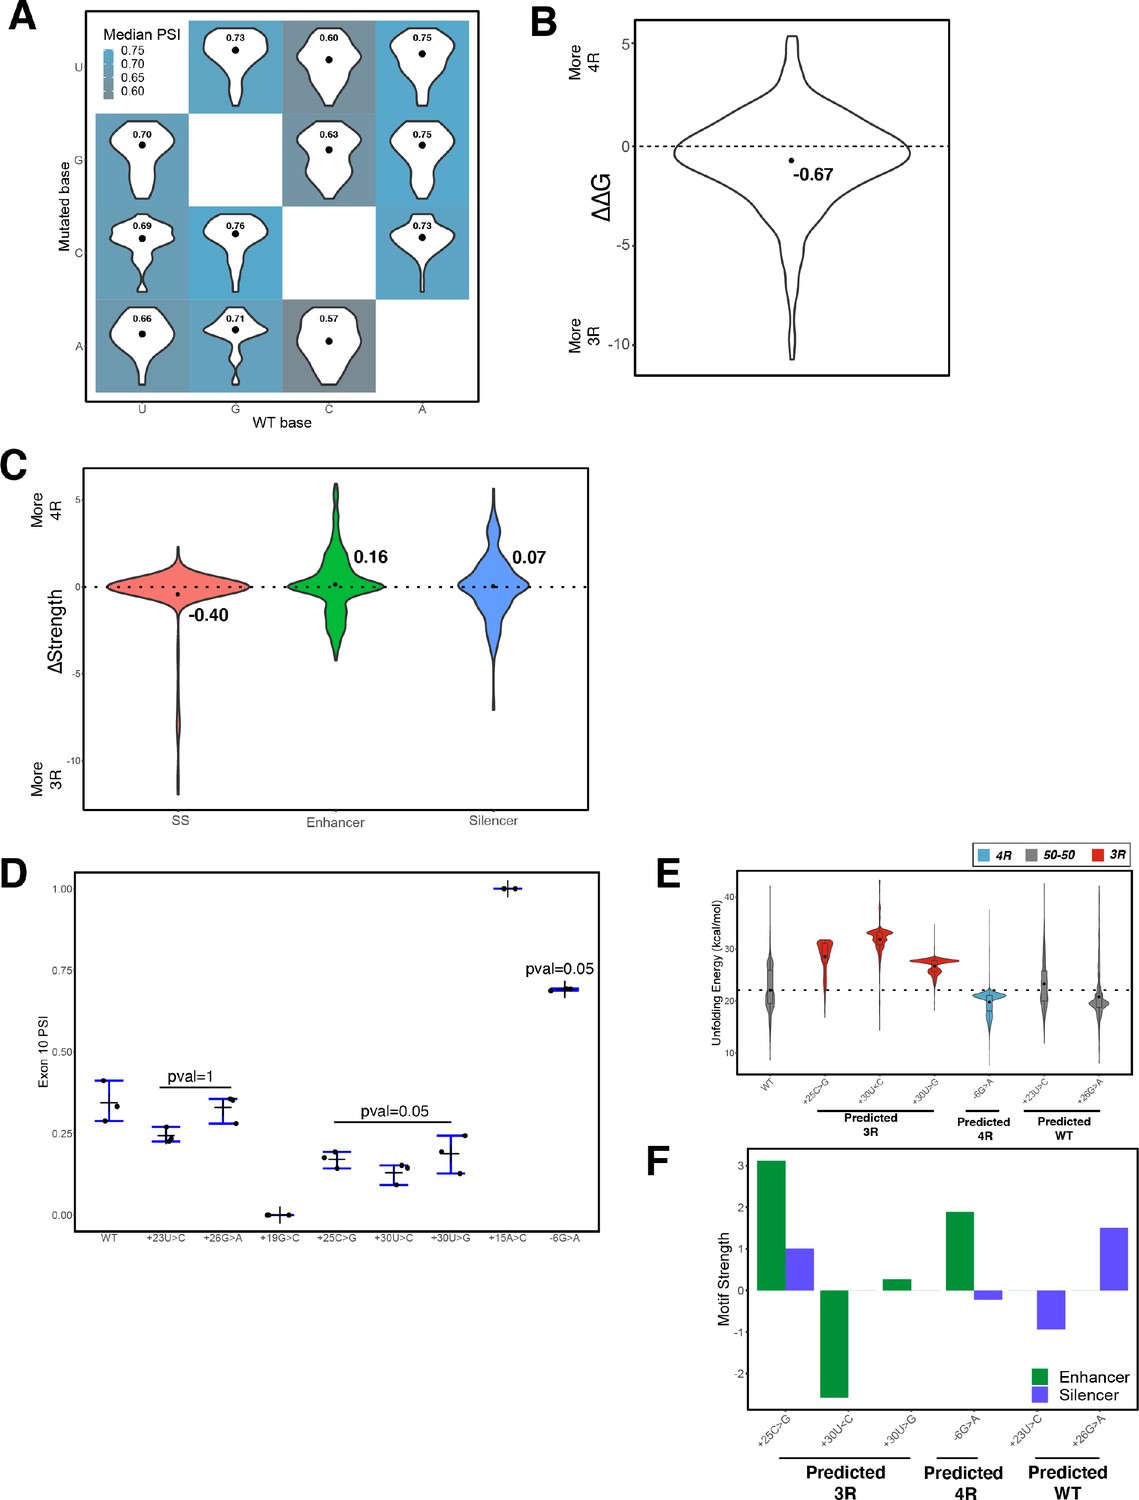
Effects of mutagenesis at each nucleotide in exon 10 – intron 10 region on percent spliced in (PSI).
(A) Heatmap of mean predicted exon 10 PSI distributions grouped by wildtype (WT) and mutant nucleotide. Mean predicted PSIs (using Equation 7) were calculated by group and are indicated by dots within violin plots. (B) Violin plots of distribution of normalized change in unfolding free energy of the exon-intron precursor mRNA (pre-mRNA) in the spliceosome Bact complex for mutations in the 100-nucleotide window of exon-intron junction. Mean of –0.67 is indicated by dot. Dotted line represents the 0 value where there is no difference between WT and mutant unfolding free energy. Positive values imply region becomes less structured and has increased inclusion of exon 10; negative values indicate that the mutant is more structured than WT with decreased inclusion of exon. (C) Violin plots of distribution of normalized change in splice site, enhancer, and silencer strength compared with WT for all mutations in the 100-nucleotide window of exon-intron junction. Means are indicated by black dots. Dotted lines represent the 0 value where there is no difference between WT and mutant unfolding free energy. Positive values imply region becomes less structured and has increased inclusion of exon 10; negative values indicate that the mutant is more structured than WT with decreased inclusion of exon. (D) Quantification of exon 10 PSI of three replicates for splicing assay gels for indicated variants of unknown significance (VUSs). One-tailed Wilcoxon rank sum test was used to calculate significance of exon 10 PSI of each three repeat (3R) or four repeat (4R) predicted VUS of interest compared with WT since we are determining if PSI of mutant is either less than or greater than WT PSI respectively. Two-tailed Wilcoxon rank sum test was used to calculate significance of exon 10 PSI of WT predicted VUS of interest compared with WT since we are determining if PSI of mutant is different from WT PSI in either direction. (E) Violin plot of distribution of unfolding free energy of the pre-mRNA in the spliceosome Bact complex for the 1000 structures in the ensembles of WT and VUSs. Each plot is colored by whether the mutation promotes production of 3R or 4R isoform. The dotted line indicates the median unfolding free energy of the WT ensemble. (F) Bar plots of change in enhancer and silencer strength of the VUSs compared with WT.
Tables
Key resources table
| Reagent type (species) or resource | Designation | Source or reference | Identifiers | Additional information |
|---|---|---|---|---|
| Cell line (Homo sapiens) | T-47D | ATCC | HTB-133 | Epithelial cells from ductal carcinoma of breast |
| Cell line (H. sapiens) | SH-SY5Y | ATCC | CRL-2266 | Neuroblastoma cells from bone marrow |
| Recombinant DNA reagent | Wildtype splicing reporter plasmid for MAPT exon 10 – intron 10 junction | Tan et al., 2019 | ||
| Sequence-based reagent | Exon10Intron10-Fwd | This paper | PCR primers | AACGTCCAGTCCAAGTGTGG |
| Sequence-based reagent | Exon10Intron10-Rev | This paper | PCR primers | CATTCACCCAGAGGTCGCAG |
| Sequence-based reagent | 3 R/4R-Fwd | This paper | PCR primers | GCAGTGGTCCGTACTCCAC |
| Sequence-based reagent | 3 R/4R-Rev | This paper | PCR primers | TGATGGATGTTGCCTAATGAGC |
Additional files
-
Supplementary file 1
ANOVA table for between individuals and within individuals Exon 10 PSI comparison.
- https://cdn.elifesciences.org/articles/73888/elife-73888-supp1-v2.docx
-
Supplementary file 2
Details on 47 experimentally tested MAPT mutations used in training model.
- https://cdn.elifesciences.org/articles/73888/elife-73888-supp2-v2.xlsx
-
Supplementary file 3
Details on 55 variants of unknown significance (VUSs) in MAPT from dbSNP.
- https://cdn.elifesciences.org/articles/73888/elife-73888-supp3-v2.xlsx
-
Supplementary file 4
Primers used for amplification of exon-exon or exon-intron junctions.
- https://cdn.elifesciences.org/articles/73888/elife-73888-supp4-v2.xlsx
-
Supplementary file 5
Re-calculated Position Weight Matrices for ESEs, ESSs, ISEs, ISSs.
- https://cdn.elifesciences.org/articles/73888/elife-73888-supp5-v2.xlsx
-
Supplementary file 6
Details on beta regression model results and features used for each training and test set.
- https://cdn.elifesciences.org/articles/73888/elife-73888-supp6-v2.xlsx
-
Supplementary file 7
Gel of RT-PCR data for splicing assay for new WT VUSs.
- https://cdn.elifesciences.org/articles/73888/elife-73888-supp7-v2.docx
-
Transparent reporting form
- https://cdn.elifesciences.org/articles/73888/elife-73888-transrepform1-v2.pdf
-
Source data 1
Marked-up gel images for 3 replicates from MAPT splicing plasmid assay.
- https://cdn.elifesciences.org/articles/73888/elife-73888-data1-v2.pdf
-
Source data 2
Raw unmarked gel images for 3 replicates from MAPT splicing plasmid assay.
- https://cdn.elifesciences.org/articles/73888/elife-73888-data2-v2.zip
Download links
A two-part list of links to download the article, or parts of the article, in various formats.
Downloads (link to download the article as PDF)
Open citations (links to open the citations from this article in various online reference manager services)
Cite this article (links to download the citations from this article in formats compatible with various reference manager tools)
Quantitative prediction of variant effects on alternative splicing in MAPT using endogenous pre-messenger RNA structure probing
eLife 11:e73888.
https://doi.org/10.7554/eLife.73888


