CompoundRay, an open-source tool for high-speed and high-fidelity rendering of compound eyes
- Department of Computer Science, University of Sheffield, United Kingdom
Figures
Figure 1
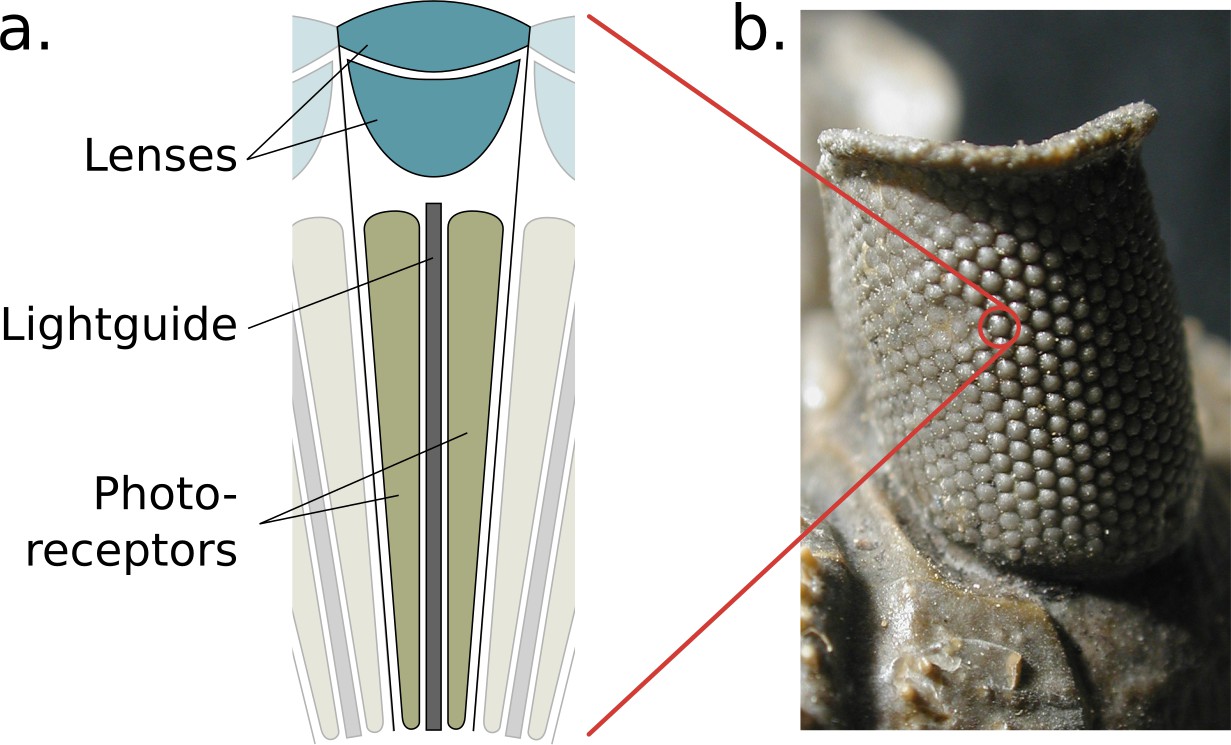
The structure of the compound eye.
(a) A diagram of a single ommatidium, shown with the lensing apparatus at the top that guides light into the photo-sensitive cells below. (b) An image of a real compound eye consisting of hundreds of ommatidia, available in WikiMedia Commons copyright holder Moussa Direct Ltd., copyright year 2001, distributed under the terms of a CC BY-SA 3.0 license (https://creativecommons.org/licenses/by-sa/3.0), and cropped with an added zoom indicator (red) from the original.
© 2001, Moussa Direct Ltd. Panel b is modified from an image of a real compound eye consisting of hundreds of ommatidia, available in WikiMedia Commons, distributed under the terms of a CC BY-SA 3.0 license
Figure 2
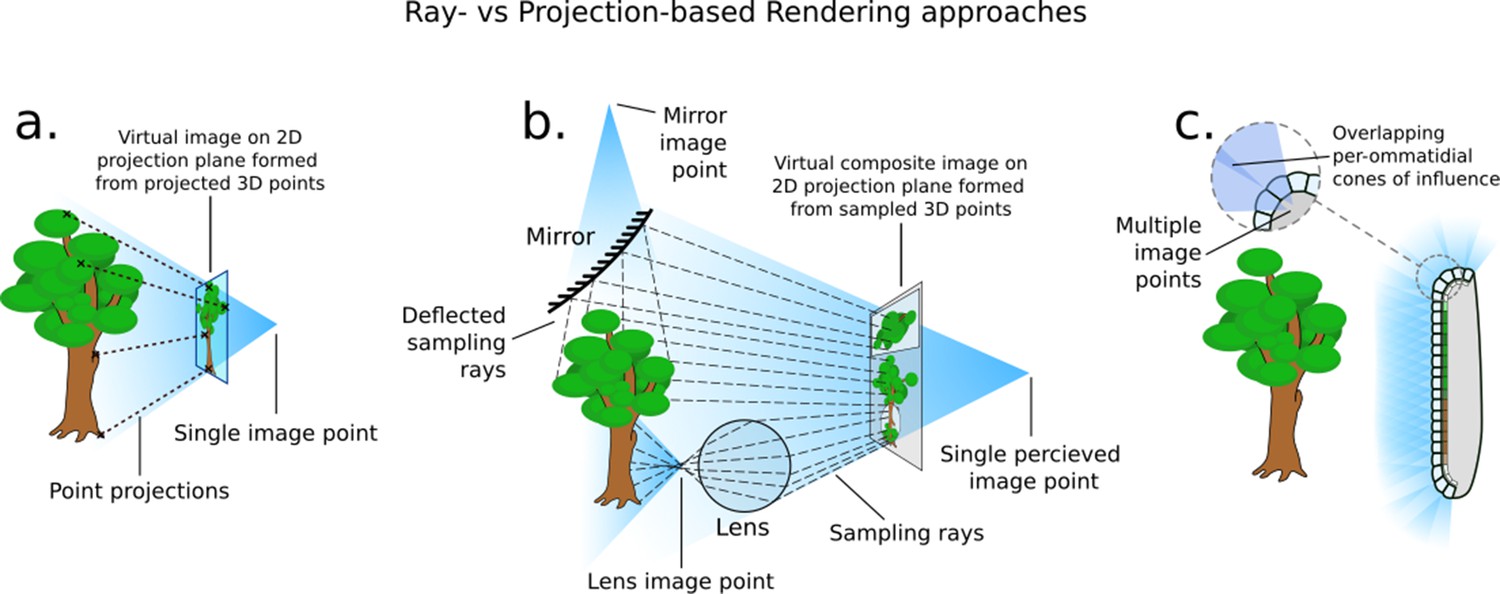
How different rendering approaches form differing image points (not to scale).
(a) In three-dimensional (3D) projection-based rendering, the polygons that comprise the 3D geometry are projected down to a viewing plane, through one image point. (b) In 3D ray-casting-based rendering (used in this paper), rays are emitted into a scene and sample the 3D geometry they contact, potentially forming many image points. (c) A compound eye requires many image points in order to image its surroundings.
Figure 3
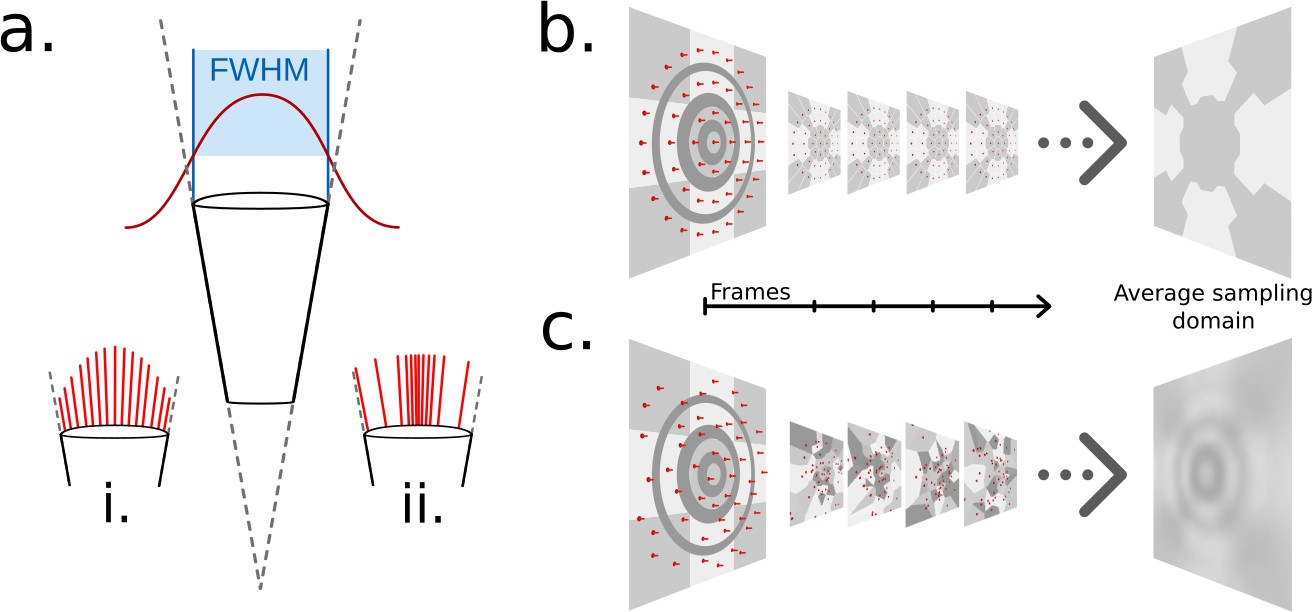
Ommatidial sampling distributions, statically and stochastically distributed.
(a) The Gaussian sampling curve (red) with a full width at half maximum (FWHM) equal to the acceptance angle of each ommatidium. (i) Example statically distributed sampling rays, length indicates weight. (ii) Example stochastically distributed sampling rays, equal weight, distributed according to Gaussian distribution. (b) A concentric circular static sampling pattern (red dots) aliases away the three concentric dark grey rings present on a surface. (c) The per-sample colours as seen from a single ommatidium mapping to the samples in b, note the lack of any influence from the dark grey concentric rings, which have been aliased out.
Figure 4
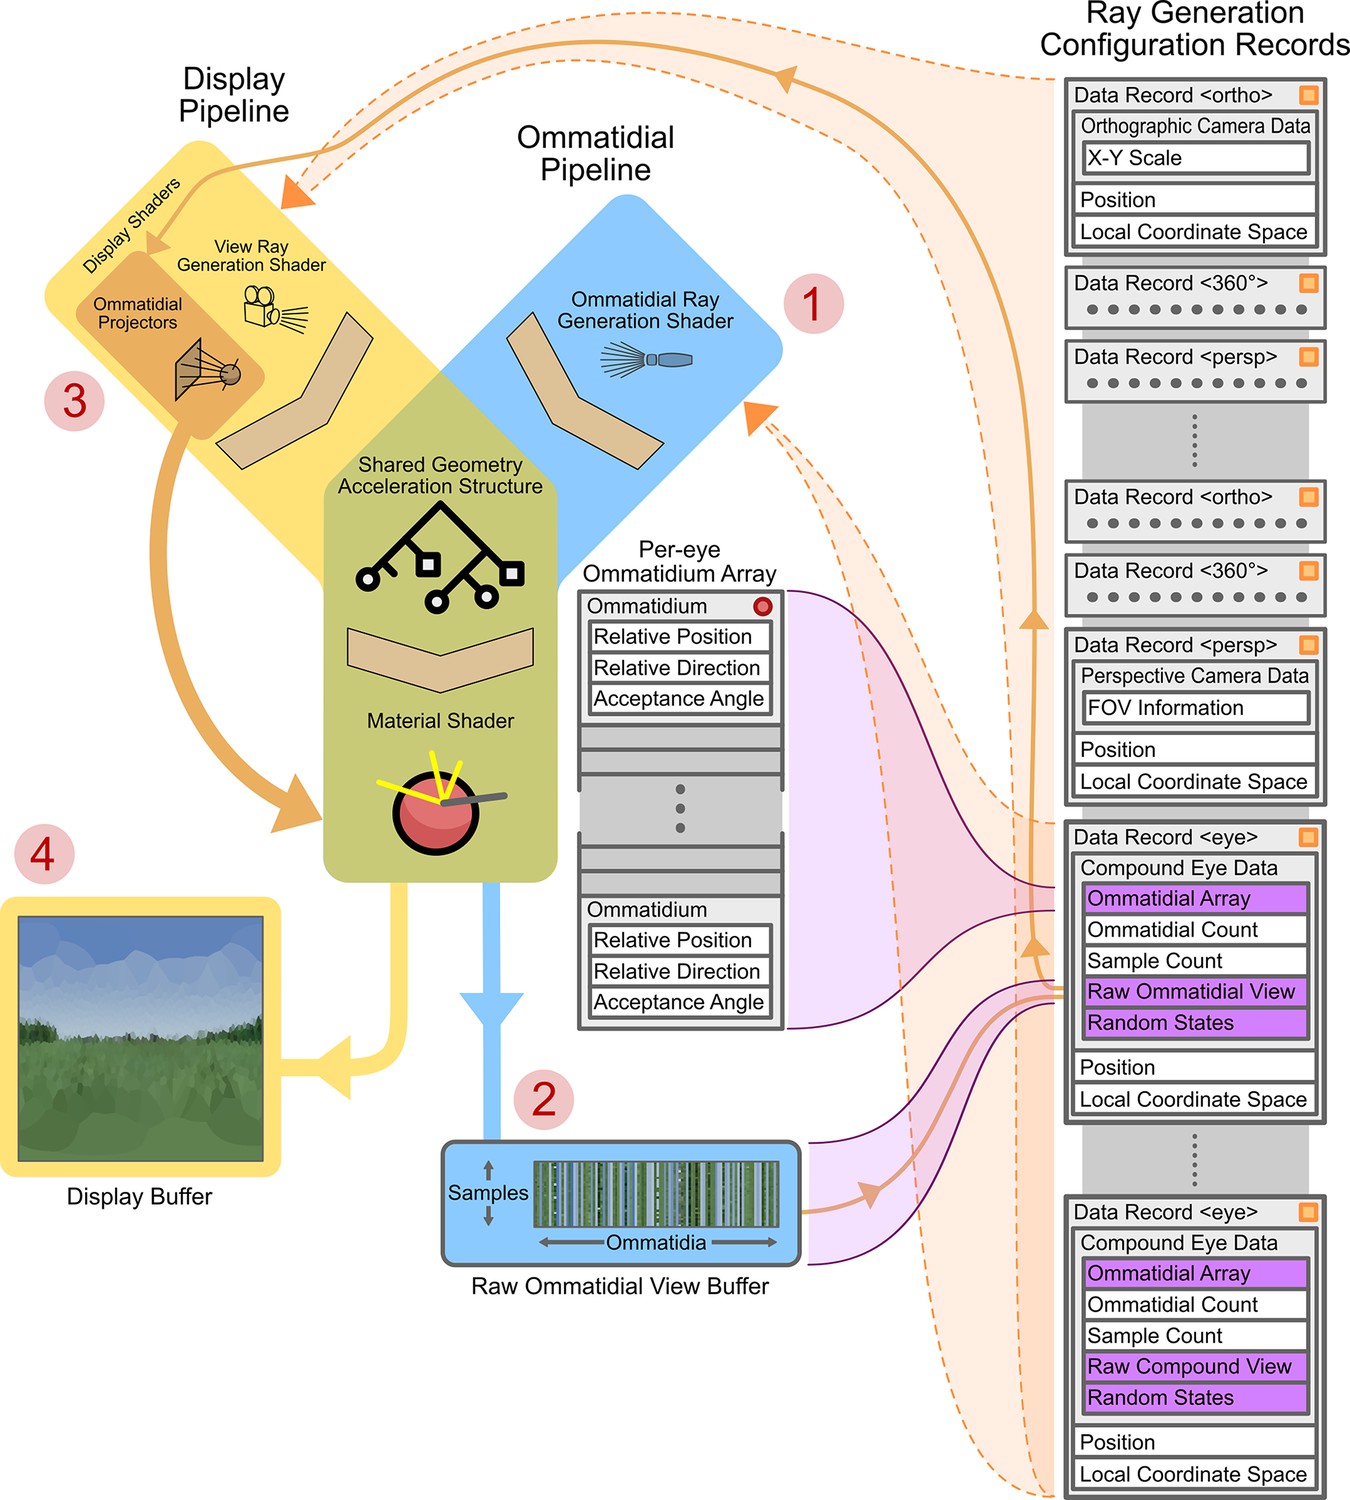
Graphics processing unit (GPU)-side renderer operational diagram.
Featured are the joined ommatidial and display rendering pipelines (including display buffers) as well as the on-device (running on the GPU) per-camera configuration records and related memory allocations. Data structure memory allocations are shown in grey (indicating in-place data) or purple (indicating pointers to other sections of data). Vertical stacks of memory indicate contiguously allocated structures. Data structures marked with an orange square are automatically updated as their host-side (running on the CPU) copies change; those with red circles are manually updated via application programming interface (API) calls. Circled numbers (1–4) indicate the path of processing through both pipelines required to display a compound eye view. FOV: field of views.
Figure 5
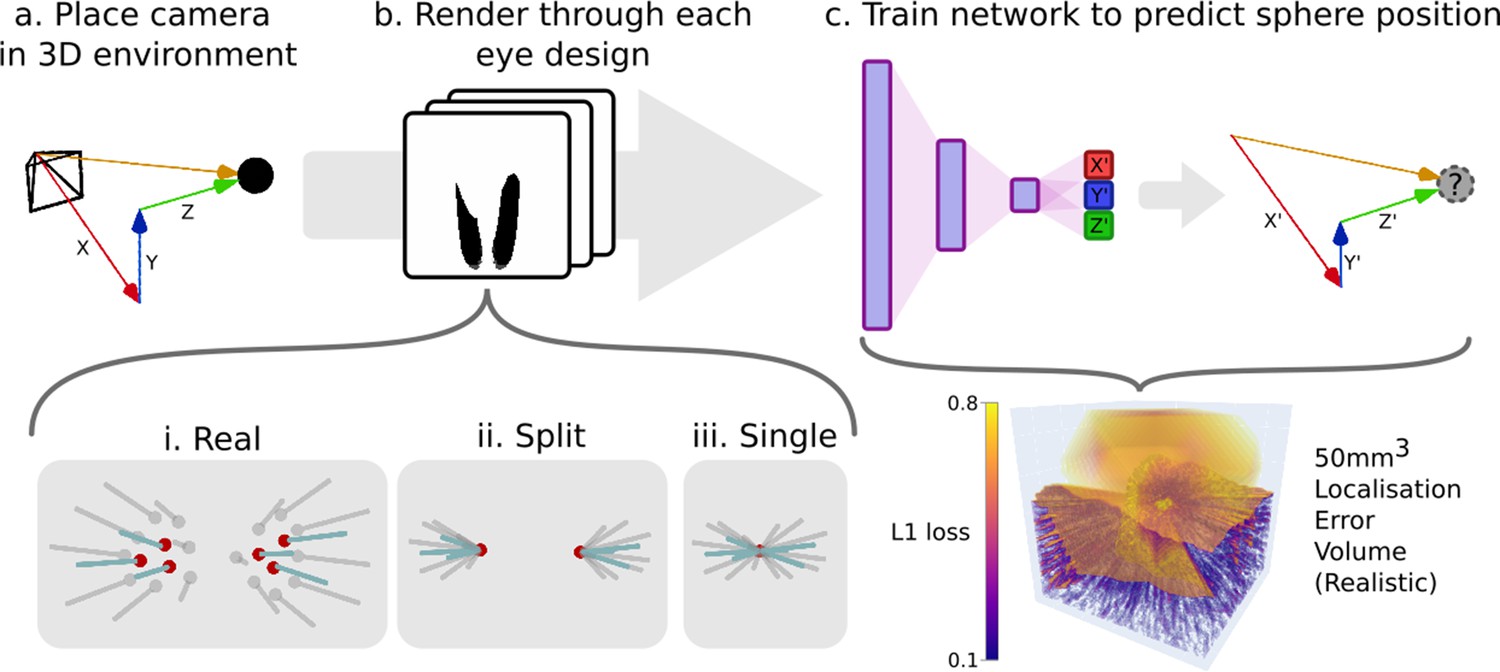
An example pipeline for exploring eye designs leveraging CompoundRay’s ability to produce large quantities of data.
(a) A camera is placed at various locations within an environment consisting of a single small point in an entirely white world. (b) Images (and the associated relative position of the camera in the , , and axes) are collected from each location through the differing eye designs that are being compared (here ‘realistic’, ‘split’, and ‘single’ designs). (c) A simple multi-layer perceptron neural network is trained to predict the the relative position (, , and ) given a compound eye view. The quality of this encoding can then be interrogated by sampling uniformly across the test volume forming an error volume, here presented directly as the L1 loss (the sum of all absolute errors between the output of the network and each axis of the ground truth relative position vector) for any given point.
Figure 6
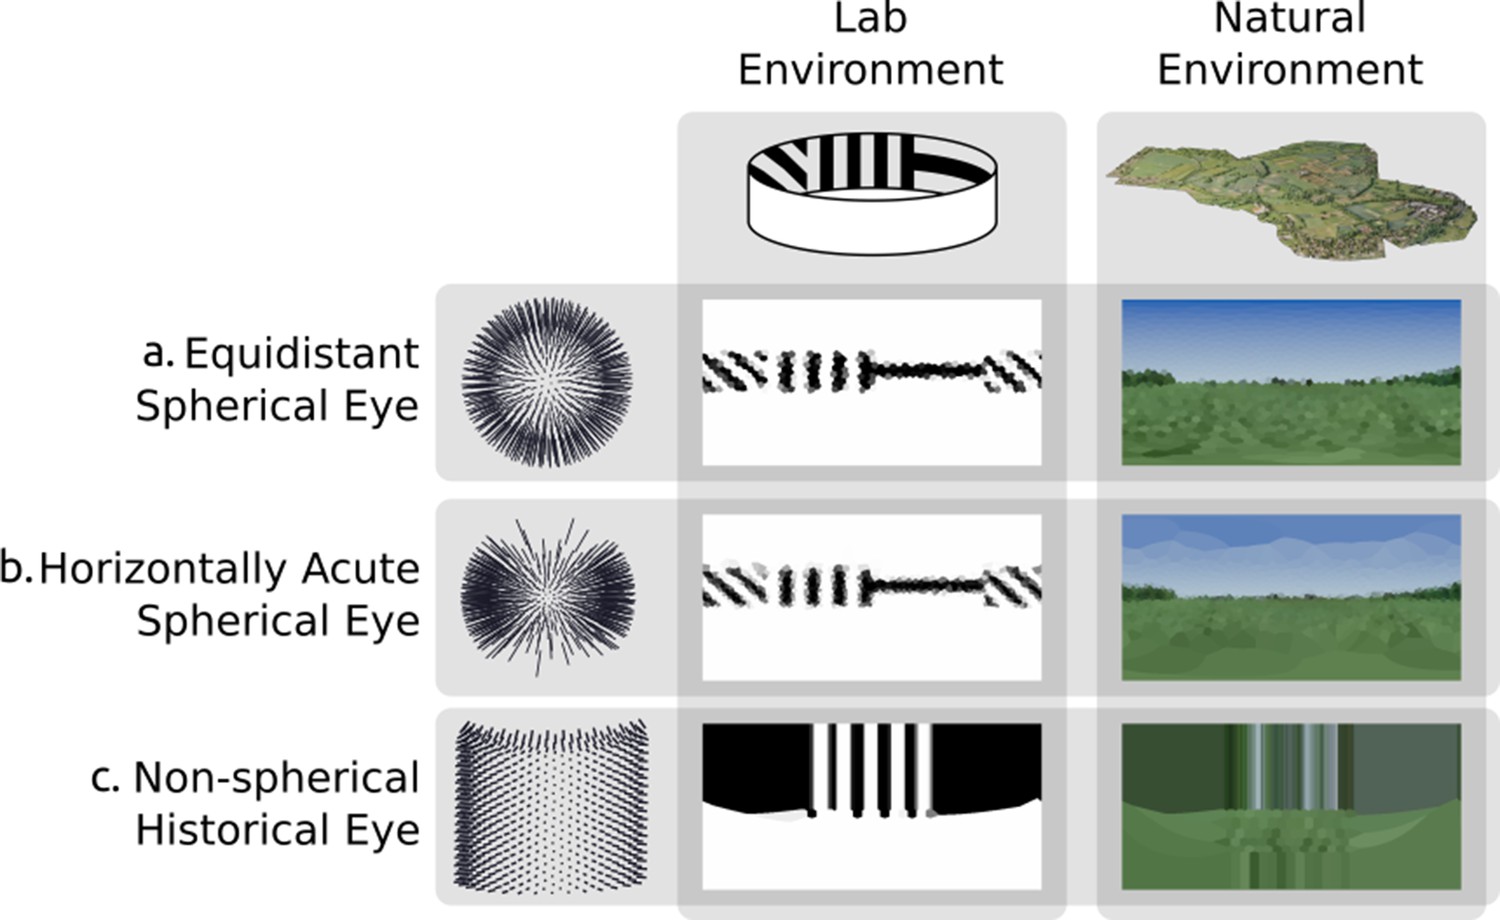
Rendering from eyes with ommatidia placed on arbitrary surfaces in one lab environment and one three-dimensional scan of a natural outdoor environment.
Renderings are projected to two-dimensional using a spherical orientation-wise Voronoi latitude/longitude mapping (orientation-wise equirectangular spherical mapping). (a) Spherically uniformly distributed ommatidia. (b) Ommatidia clumped to form a horizontal acute zone (c) A design inspired by the Erbenochile erbeni.
Figure 7
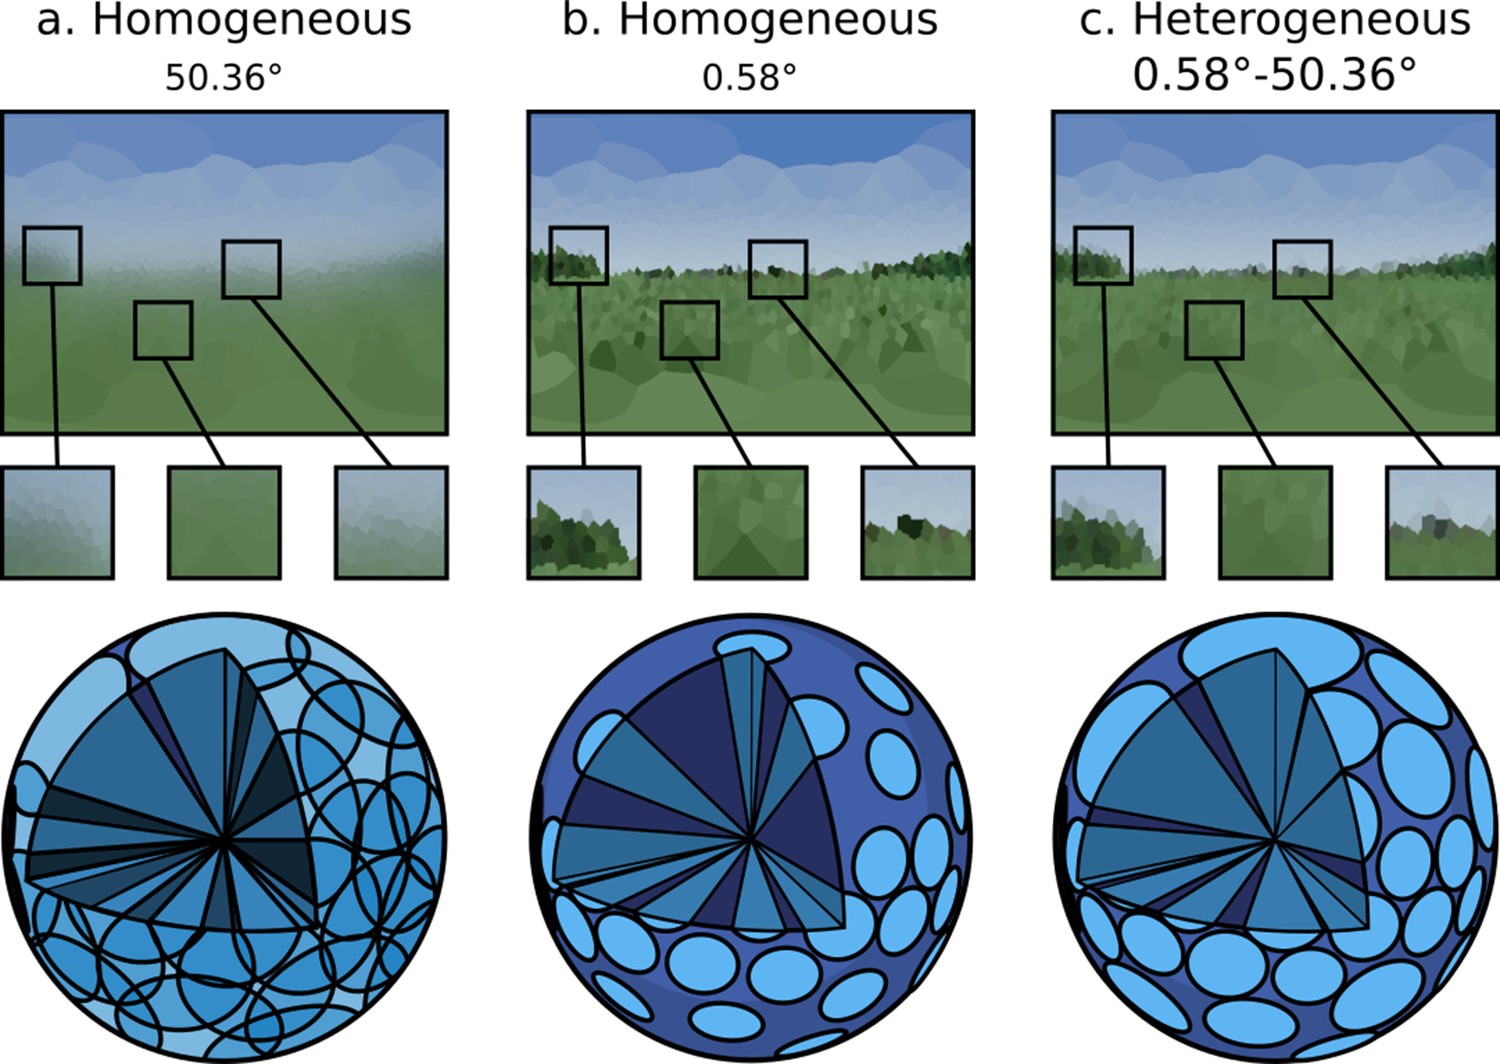
A single environment as viewed through: (a and b) eye designs with homogeneous ommatidial acceptance angles, note the blurred edges in (a) and sharp aliased edges in (b).
(c) An eye with heterogeneous ommatidial acceptance angles. Below each output image is a three-dimensional depiction of the field of view of the specific array of ommitidia making up each eye: (a) oversampled, homogeneous eye; (b) undersampled, homogeneous eye; (c) evenly sampled, heterogeneous eye. Model (c) has the benefit of being able to leverage the most useful aspects of (b) and (a). Renderings are projected to wo-dimensional using an orientation-wise equirectangular spherical mapping.
Figure 8
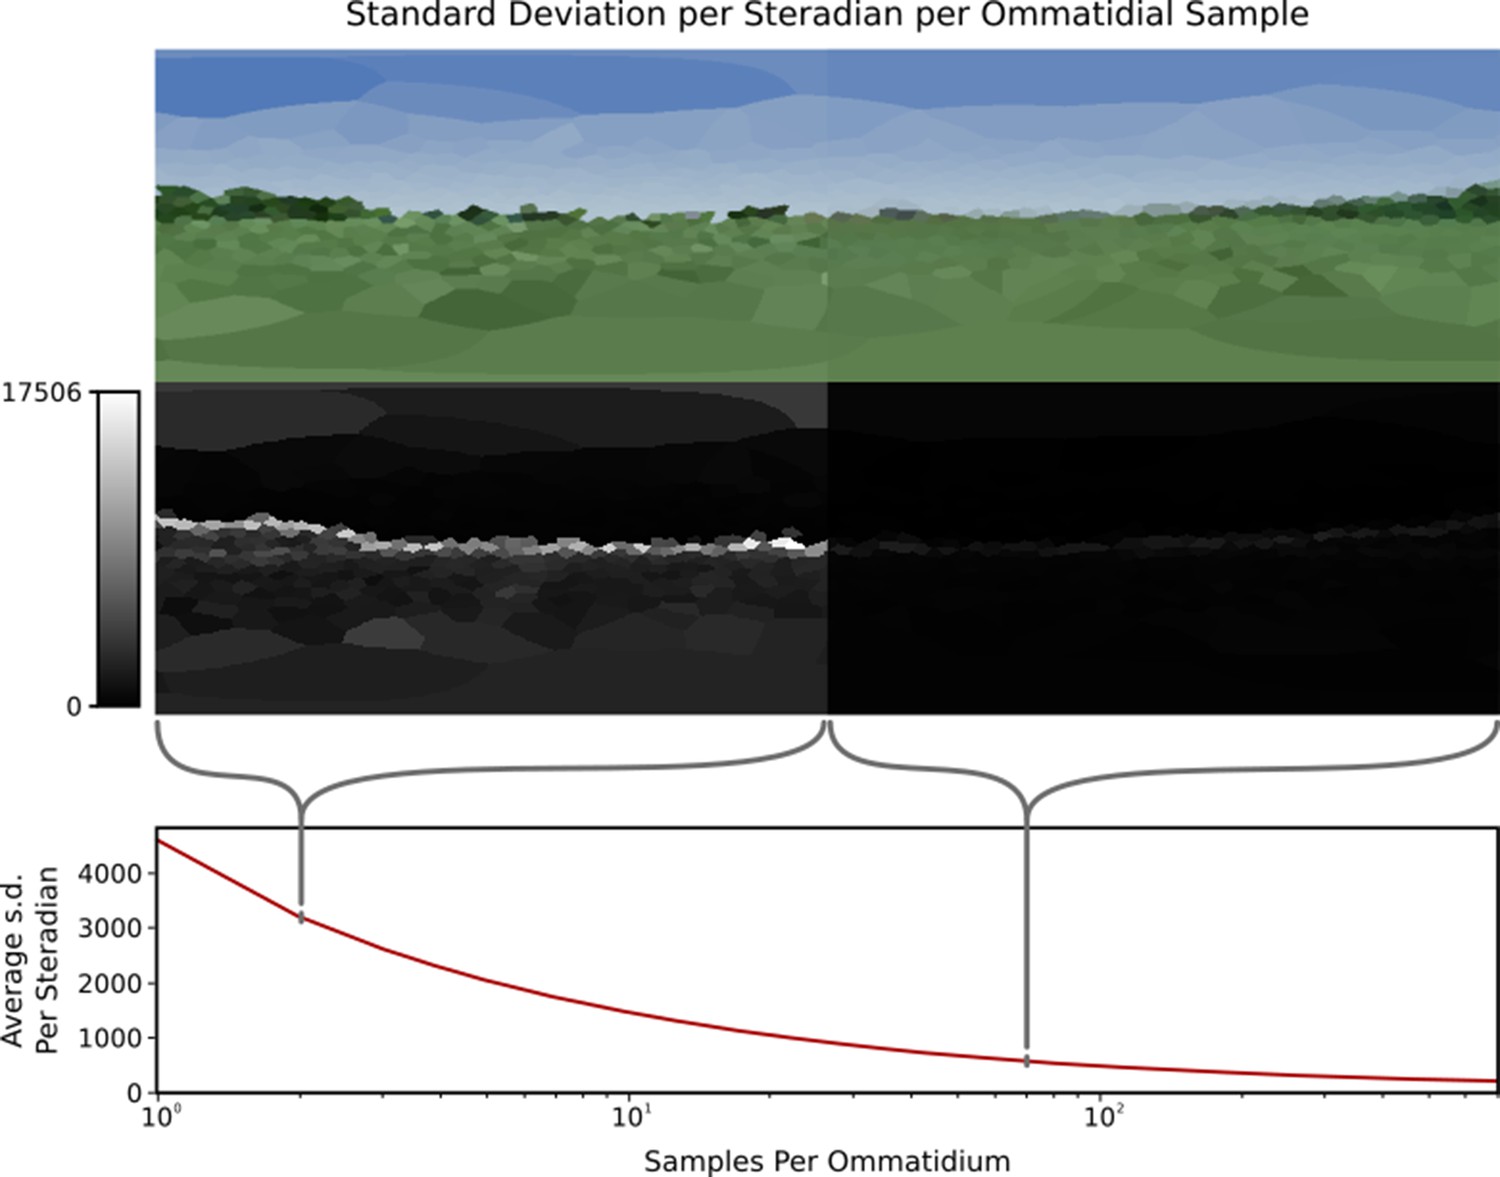
A single viewpoint viewed using variable samples per ommatidium.
Top: How changing sample count changes the generated image. Note that the left side (with only 1 sample per ommatidium) is more ‘jagged’ than the right side image (70 samples per ommatidium) due to aliasing. Middle: Relative standard deviations of each ommatidium across 1000 frames, where difference is measured as the Euclidean distance between the two colours, this highlights the significantly larger standard deviation at points of high visual contrast in the image. Bottom: Plot of the average standard deviation of an eye per sample rays per ommatidium, normalised to one steradian. The standard deviation decreases as per-ommatidium sampling rate increases.
Figure 9
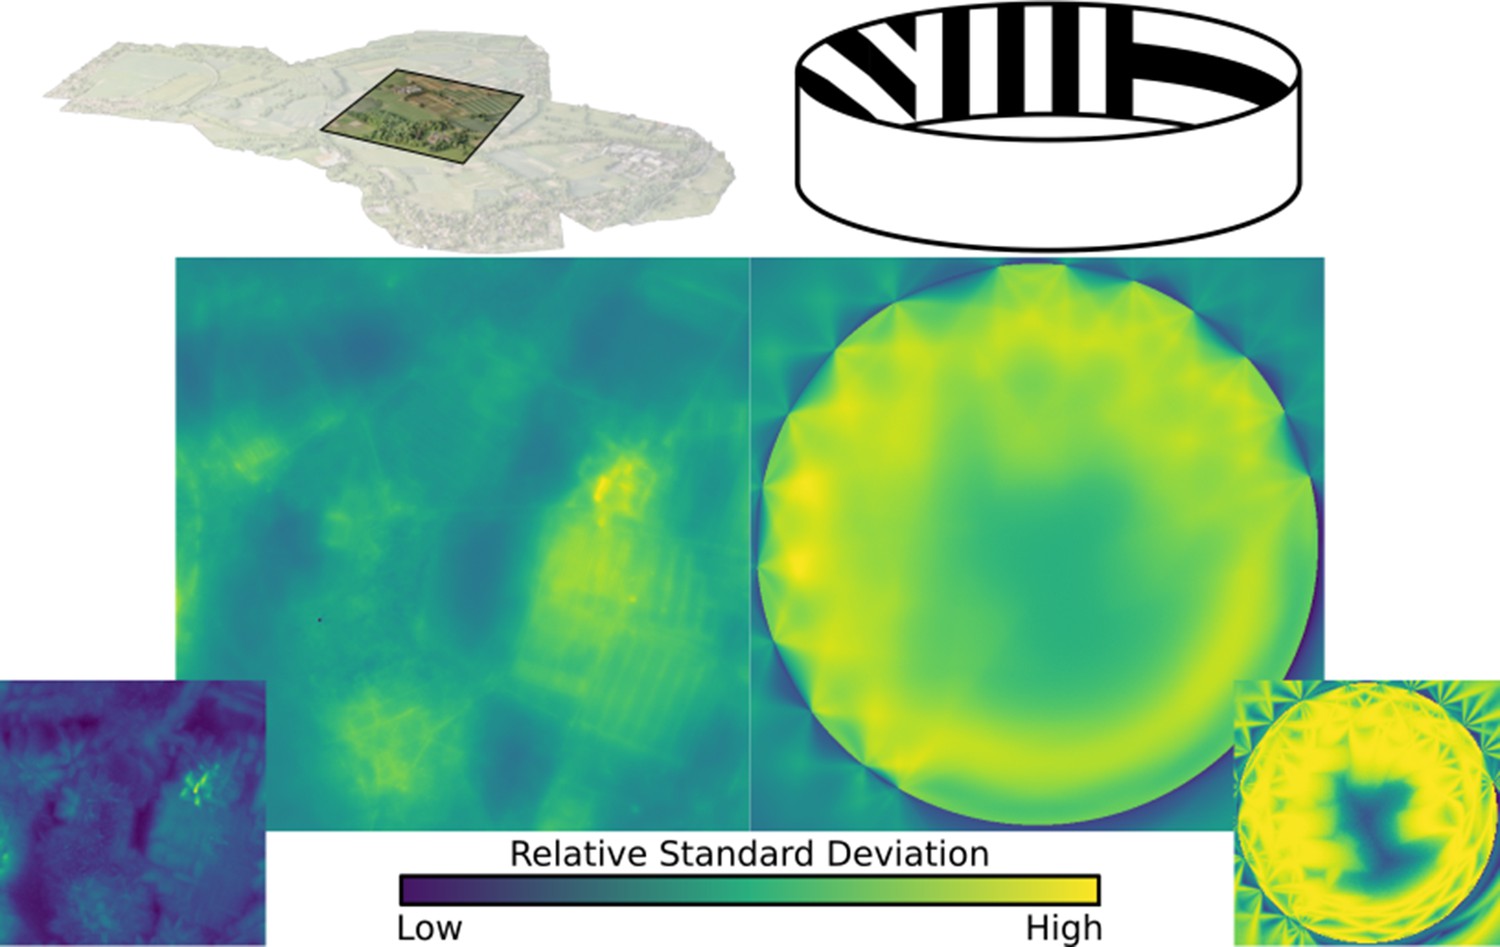
Standard deviation, averaged over all ommatidia in an eye, mapped over the natural and lab environments, showing a range of ‘hotspots’ of high variance in renderings.
These hotspots must be accounted for when calculating minimum sample ray count. Inserts bottom left and right: the maximum (over all ommatidia) standard deviation recorded in the eye at each location.
Figure 10
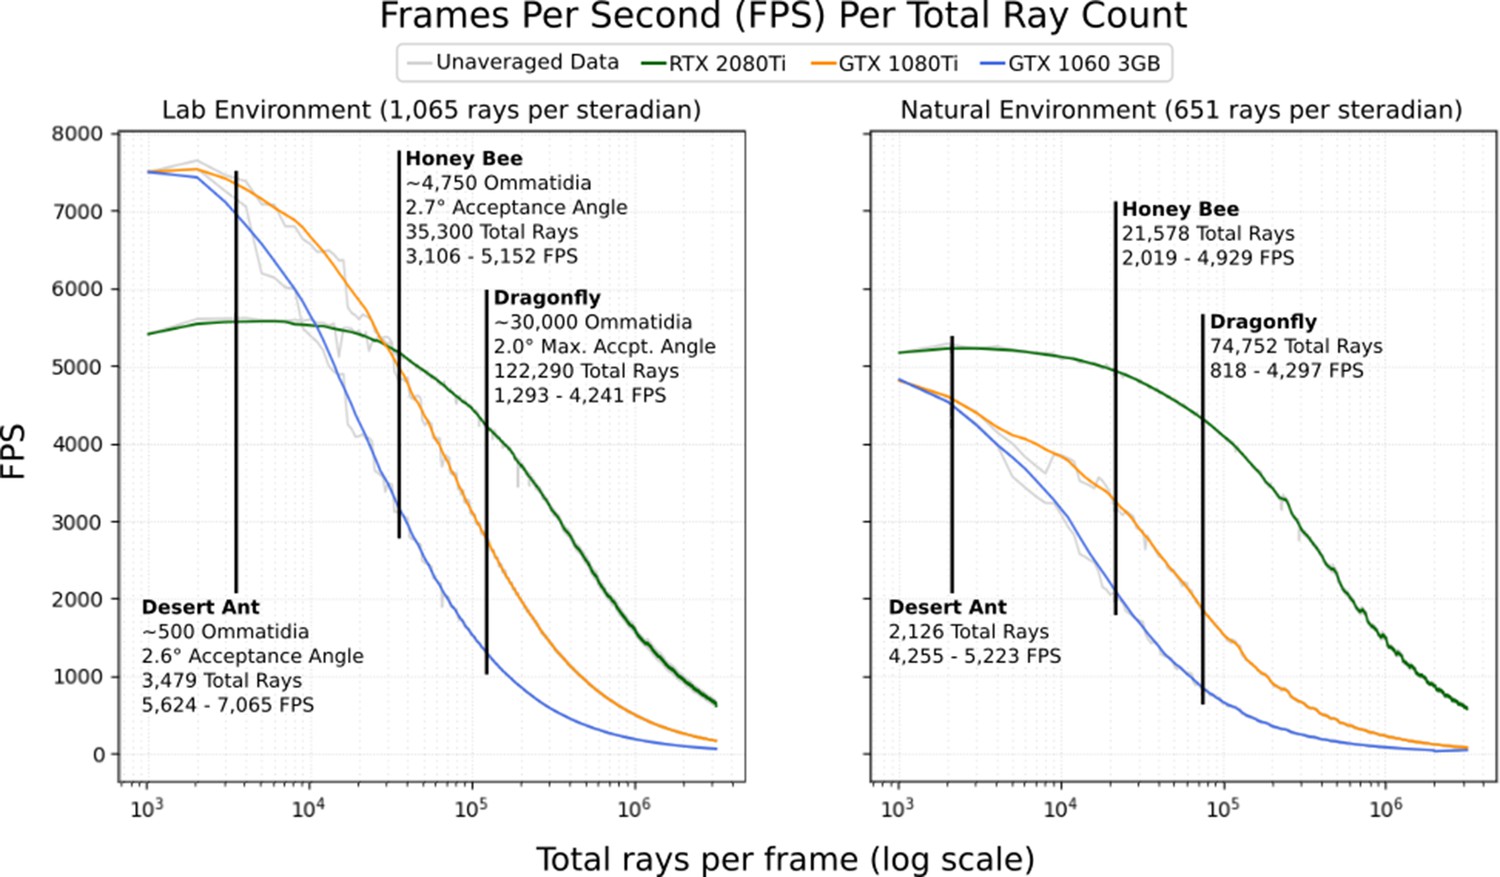
The average frames per second (FPS; 500 samples) per total number of rays dispatched into the scene for 3 different graphics cards in the 2 environments depicted in Figure 6.
Marked are expected FPS values for a desert ant (Schwarz et al., 2011), honey bee (Greiner et al., 2004), and dragonfly (Labhart and Nilsson, 1995; Land and Nilsson, 2002). Averaged data is smoothed using a 1-dimensional box filter acting over 10 samples, clipped at the beginning and end.
Figure 11
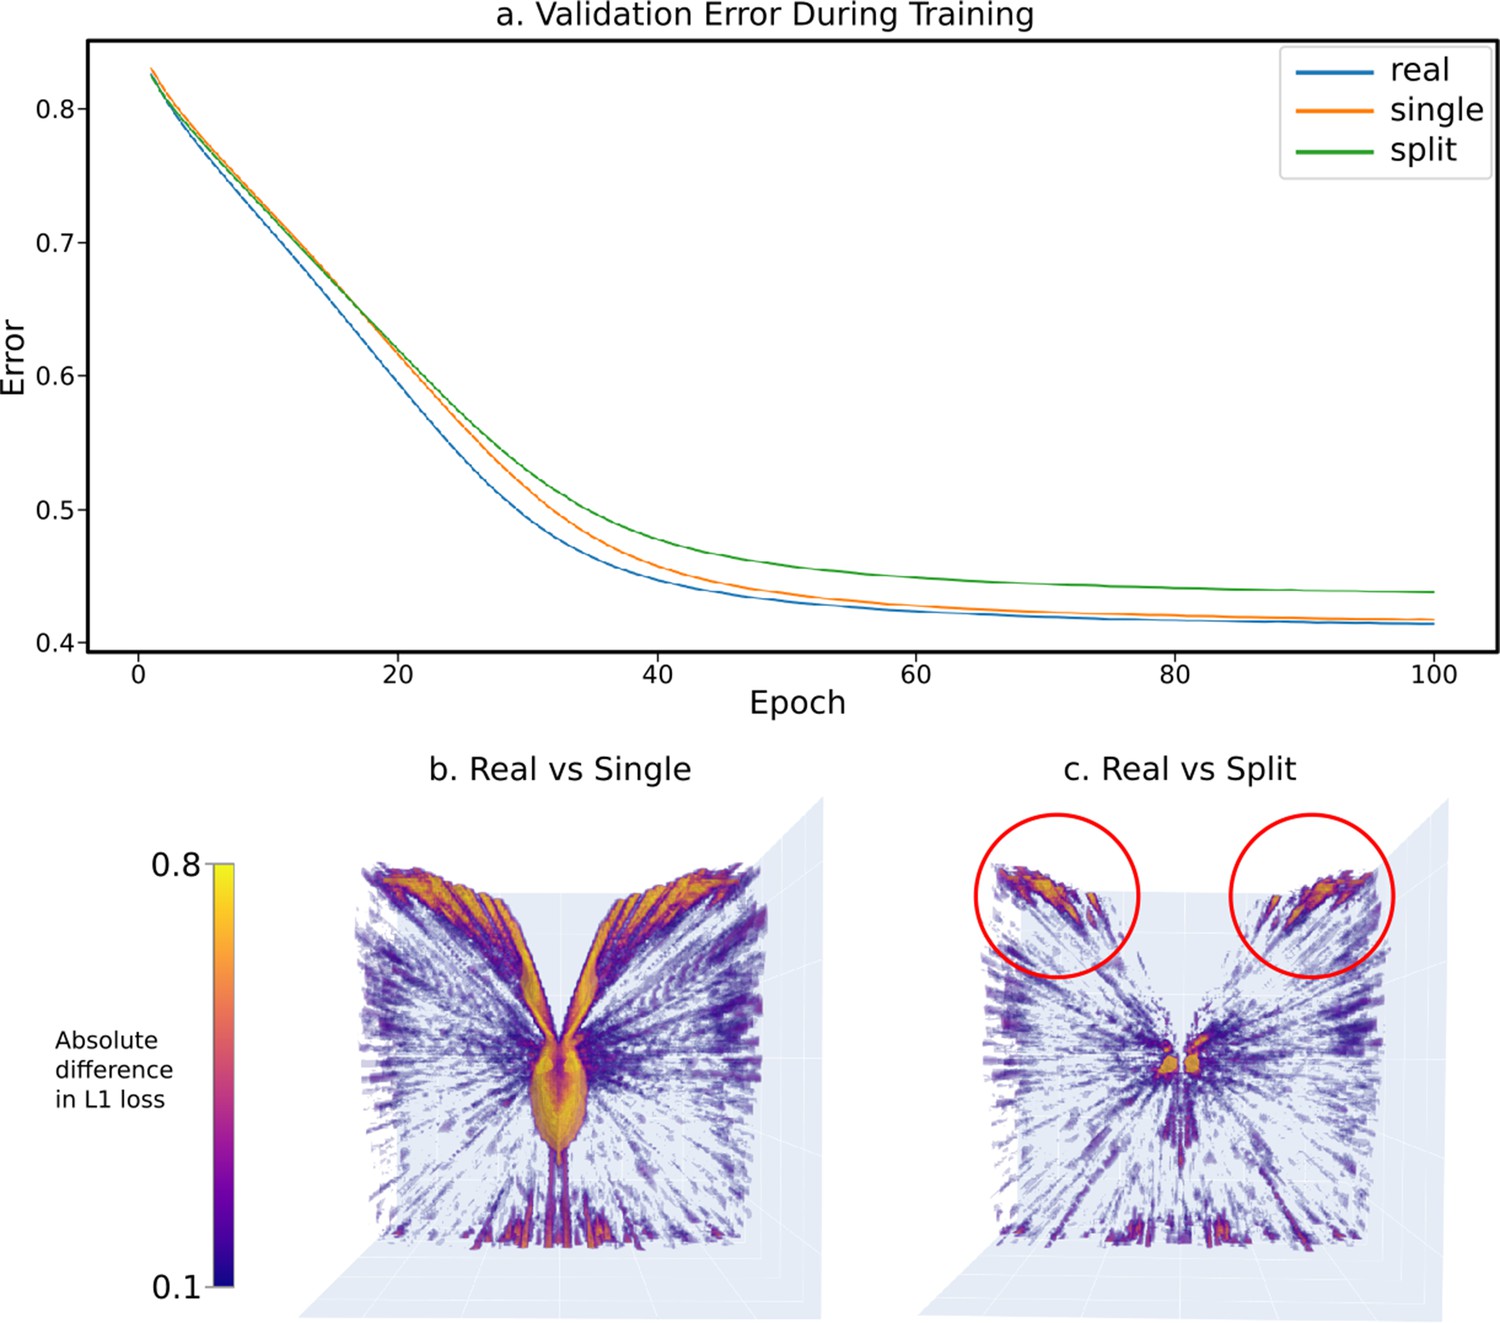
The results of a sample experiment comparing the relative effectiveness of three progressively simplified dual-eye designs – a ‘real’ design built from data collected from real-world Apis mellifera (Baird and Taylor, 2017) and two progressively simplified designs: the ‘split’ design, collapsing ommatidial viewing points onto two eye centres, and the ‘single’ design, projecting all ommatidial viewing points onto one central position (figurative examples shown in Figure 5i–iii).
(a) The validation error graphs over 100 epochs of training for each eye design. The majority of learning occurs between epoch 0 and 60, and by epoch 100 all networks have converged in optimal-approximating states. (b) The absolute relative differences across the error volumes (see Figure 5c) between the ‘real’ and ‘single’ eye designs, as seen from the top. (c) As in (b), but between the ‘real’ and ‘split’ designs.
Additional files
Download links
A two-part list of links to download the article, or parts of the article, in various formats.
Downloads (link to download the article as PDF)
Open citations (links to open the citations from this article in various online reference manager services)
Cite this article (links to download the citations from this article in formats compatible with various reference manager tools)
CompoundRay, an open-source tool for high-speed and high-fidelity rendering of compound eyes
eLife 11:e73893.
https://doi.org/10.7554/eLife.73893


