Quantification of protein abundance and interaction defines a mechanism for operation of the circadian clock
- Faculty of Biology, Medicine and Health, University of Manchester, United Kingdom
- MRC Laboratory of Molecular Biology, United Kingdom
- Department of Chemistry and Biochemistry, University of California, Santa Cruz, United States
- Department of Mathematics, University of Manchester, United Kingdom
Figures
Figure 1 with 2 supplements
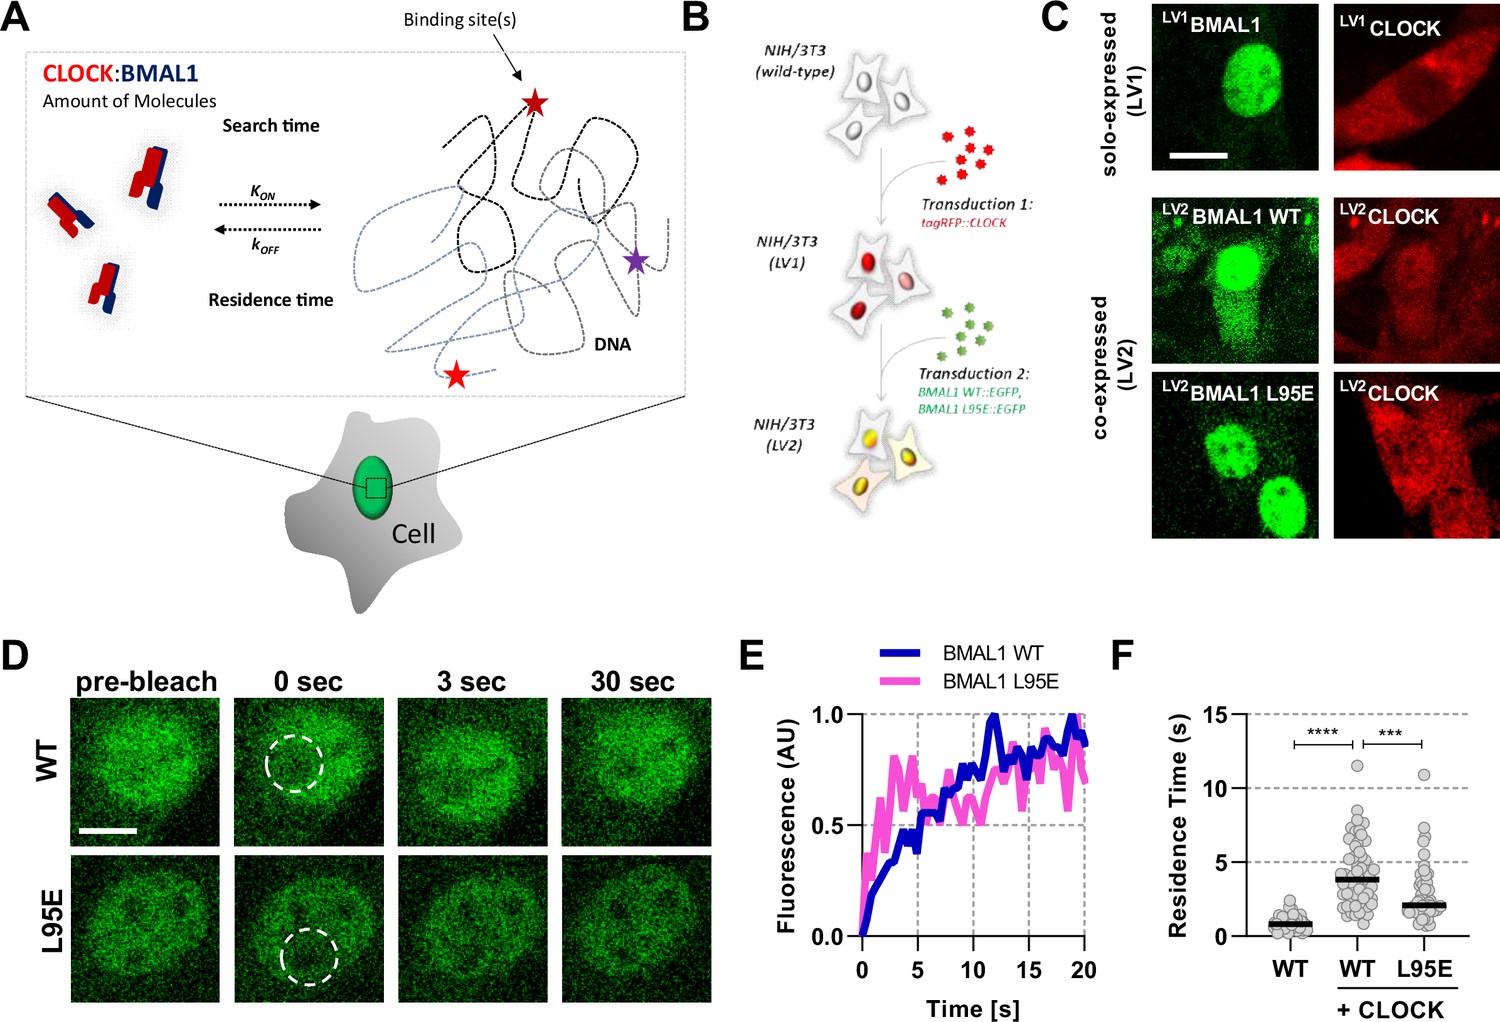
Short-lived DNA binding of BMAL1 and CLOCK.
(A) Schematic representation of parameters regulating CLOCK:BMAL1 dimers binding to target DNA sites. (B) NIH/3T3 cells are either singularly or sequentially transduced to express fluorescent fusions with CLOCK or BMAL1 (wildtype and mutant variants).(C) Confocal microscopy images of cells solo-expressing (LV1) either tagRFP::CLOCK or BMAL1::EGFP or co-expressing (LV2) them together (including BMAL1 L95E DNA-binding mutant). (D) Confocal microscopy images for photobleaching of LV2BMAL1::EGFP-RFP::CLOCK labelled cells, either with wild-type or BMAL1 L95E DNA binding mutant. Images show nuclei and highlight region of bleaching. (E) Representative fluorescence recovery curves of bleach region for B. following normalisation. (F) Residence time calculated as the inverse of kOFF (), determined from fitting the recovery data with a single component binding model (n = 69, 58, and 51 cells). Bar represents median values. Source data for panel F available as Figure 1—source data 1.
-
Figure 1—source data 1
BMAL1 residence times.
- https://cdn.elifesciences.org/articles/73976/elife-73976-fig1-data1-v2.csv
Figure 1—figure supplement 1
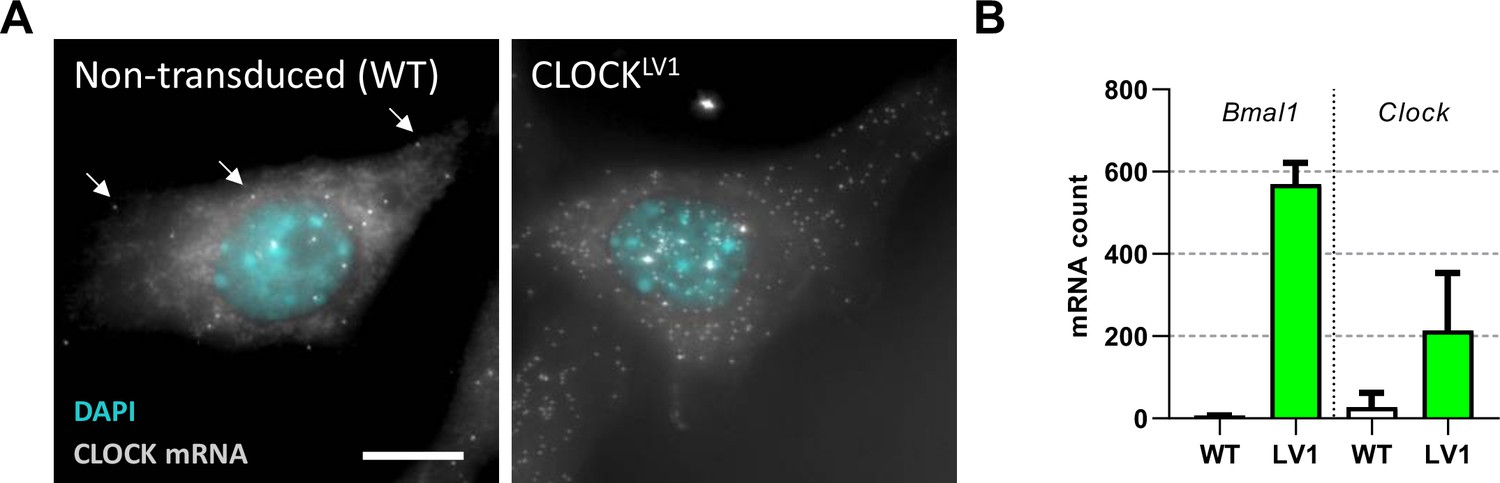
Ectopically expressed mRNA is the major form in a lentivirus transduced system.
(A) NIH/3T3 cells were stained for CLOCK mRNA by single-molecule fluorescent in situ hybridisation (smFISH). (B) Mature mRNA was counted from images of many single cells to determine the mRNA content per cell for both non-transduced and cells transduced to express EGFP::CLOCK from a ubiquitin ligase C promoter (n = 2177 cells for WT and n = 155 cells for LV1). Increased nuclear bright dots can be seen for the transduced cells. These bright dots correspond to sites of transcription which is increased beyond two copies due to the multiple sites of integration following transduction. Full details for summary statistics can be found in Figure 1—figure supplement 1—source data 1.
-
Figure 1—figure supplement 1—source data 1
Summary statistics.
- https://cdn.elifesciences.org/articles/73976/elife-73976-fig1-figsupp1-data1-v2.xlsx
Figure 1—figure supplement 2
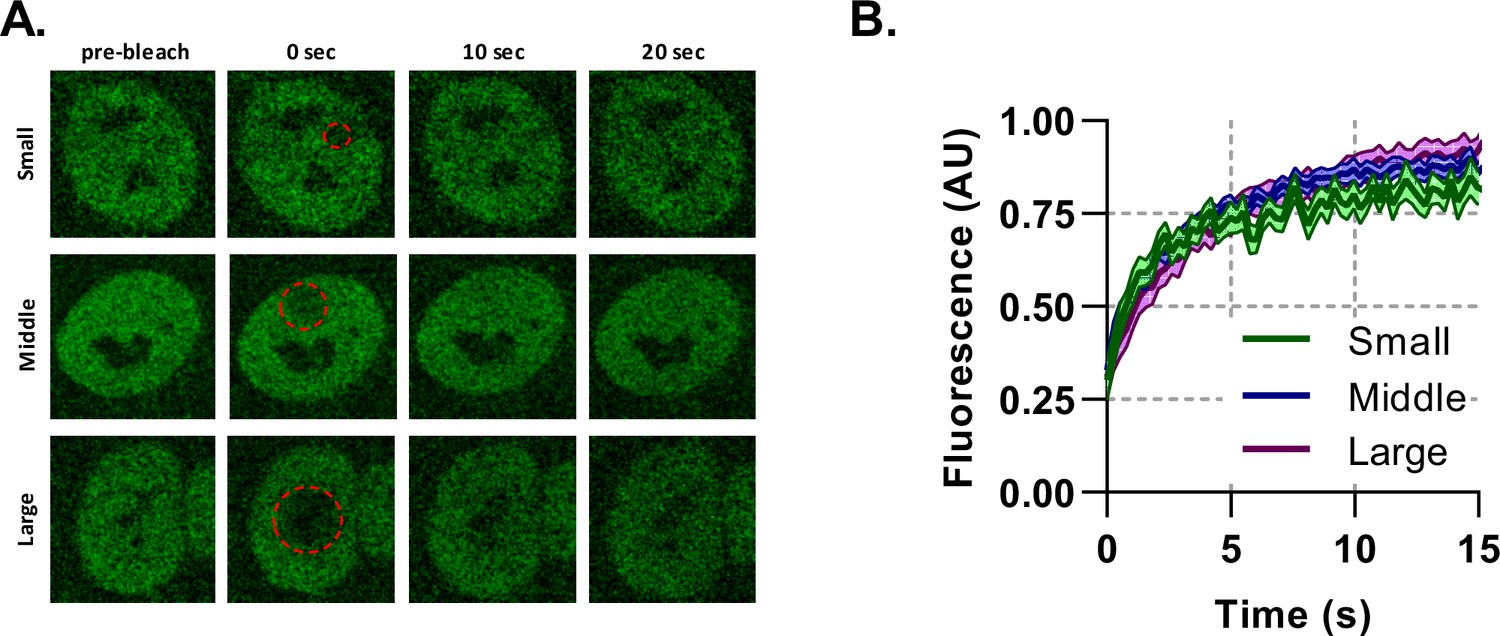
Binding plays a significant role in BMAL1 mobility.
Fluorescence recovery after photobleaching for NIH/3T3 cells transduced with tagRFP::CLOCK and BMAL1:EGFP. (A) Imaging protocol was performed on BMAL1::EGFP signal. Regions of photobleaching are shown as a red-dotted line which is increased in size. (B) The bleached region recovery curves are shown as averages of all cells with an SEM error envelope (n = 14, 20, and 15).
Figure 2 with 2 supplements
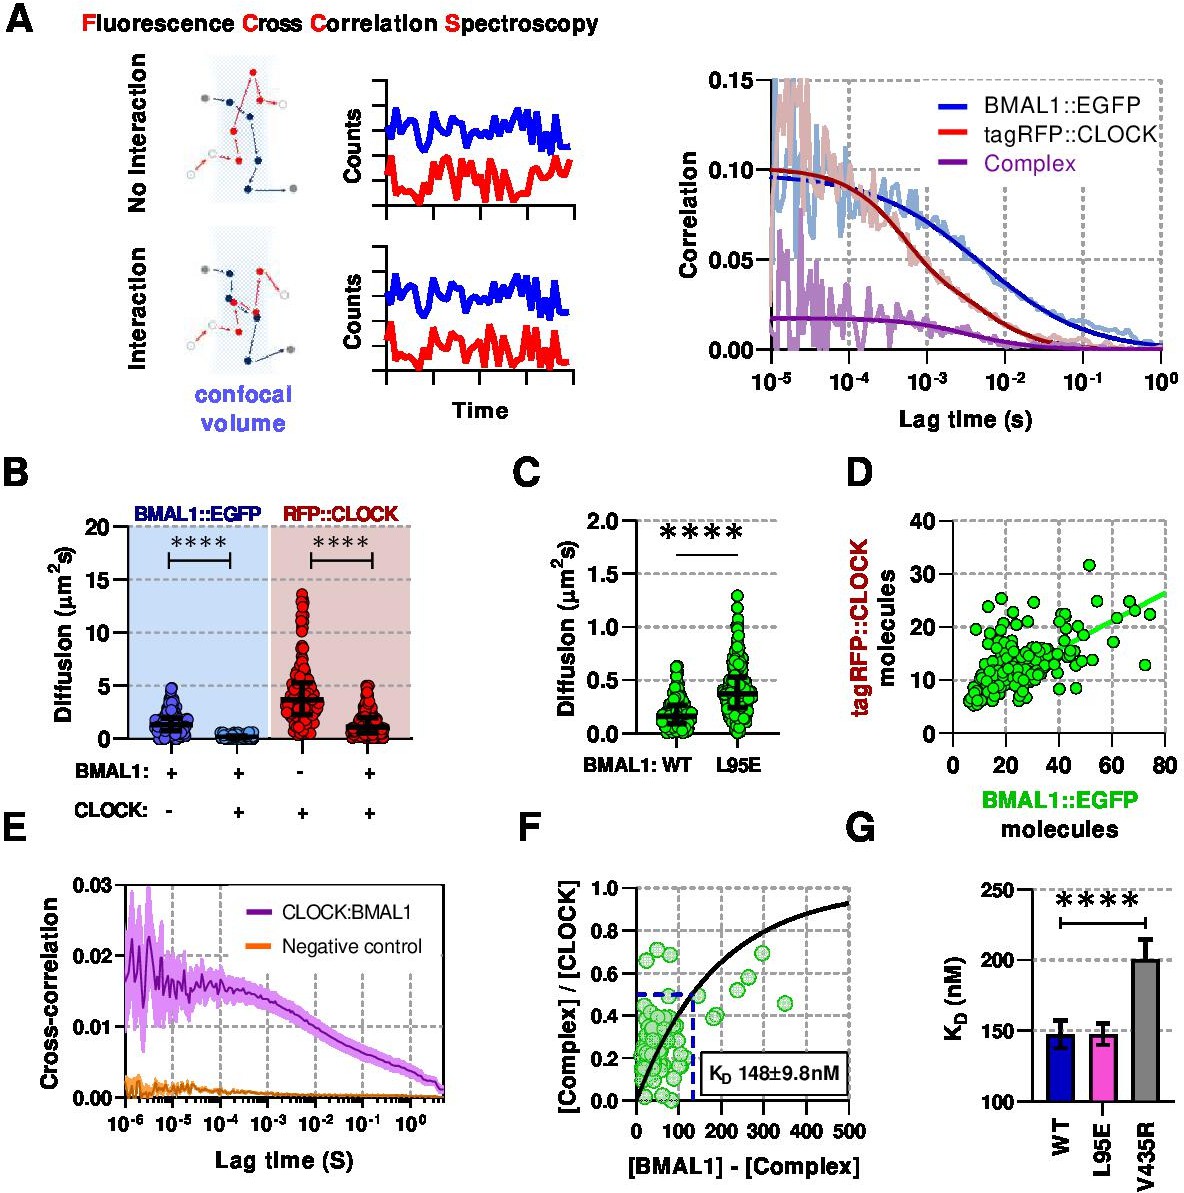
Live-cell interaction measurements demonstrate BMAL1 and CLOCK mobility is regulated by dimerisation and DNA binding.
(A) Schematic of confocal volume used in FCCS with corresponding photon count traces. Interaction may be seen by correlation between both channels. Representative auto- and cross- correlation data showing raw data and fit lines for monomeric and complexed fluorescent proteins. (B) FCS data showing diffusion for BMAL1 and CLOCK in solo- and co-expressed conditions (n = 173, 152, 198, and 185 cells). (C) FCS results for BMAL1::EGFP diffusion for NIH/3T3 cells that co-express tagRFP::CLOCK. Data shown is for comparison of BMAL1 as either wild-type of L95E DNA-binding mutant. Bars show median and interquartile range. (D) Correlation of nuclear protein quantification showing relationship of BMAL1::EGFP with tagRFP::CLOCK for both wildtype and DNA binding mutant (n = 221 cells from three biological replicates). (E) Average cross-correlation curves for BMAL1::EGFP (WT) with tagRFP::CLOCK (n = 140) compared to a non-interacting control of NLS::EGFP co-expressed with tagRFP::CLOCK (n = 408). (F) Dissociation plot from FCCS data for BMAL1::WT and tagRFP::CLOCK. (G) Summary of calculated dissociation constants across all conditions, including BMAL1 dimerisation mutant, V435R (n = 156, 274, and 244). Mann-Whitney non-parametric test to determine significance (values are denoted as p > 0.05 ns, p < 0.05 *, p < 0.01 **, p < 0.001 *** and p < 0.0001 ****). Source data for panels B,C available as Figure 2—source data 1 and panel E as Figure 2—source data 2.
-
Figure 2—source data 1
BMAL1 and CLOCK FCS diffusion rates.
- https://cdn.elifesciences.org/articles/73976/elife-73976-fig2-data1-v2.csv
-
Figure 2—source data 2
BMAL1 and CLOCK paired FCS concentrations.
- https://cdn.elifesciences.org/articles/73976/elife-73976-fig2-data2-v2.csv
Figure 2—figure supplement 1

Anomalous diffusion best fits protein movement.
(A) Representative normal and anomalous model fits for BMAL1::EGFP FCS data sets for cells transduced with lentivirus to express BMAL1, CLOCK or control fluorescent proteins. (B) Summary data sets for all five models considered. Each model was fit to each measurement and the fit with the lowest AIC score selected. A single pie chart was generated for cells carrying a single fluorescent label whereas two pie charts are plotted for cells with multiple labels, corresponding to the analysed green or red fluorescence.
Figure 2—figure supplement 2
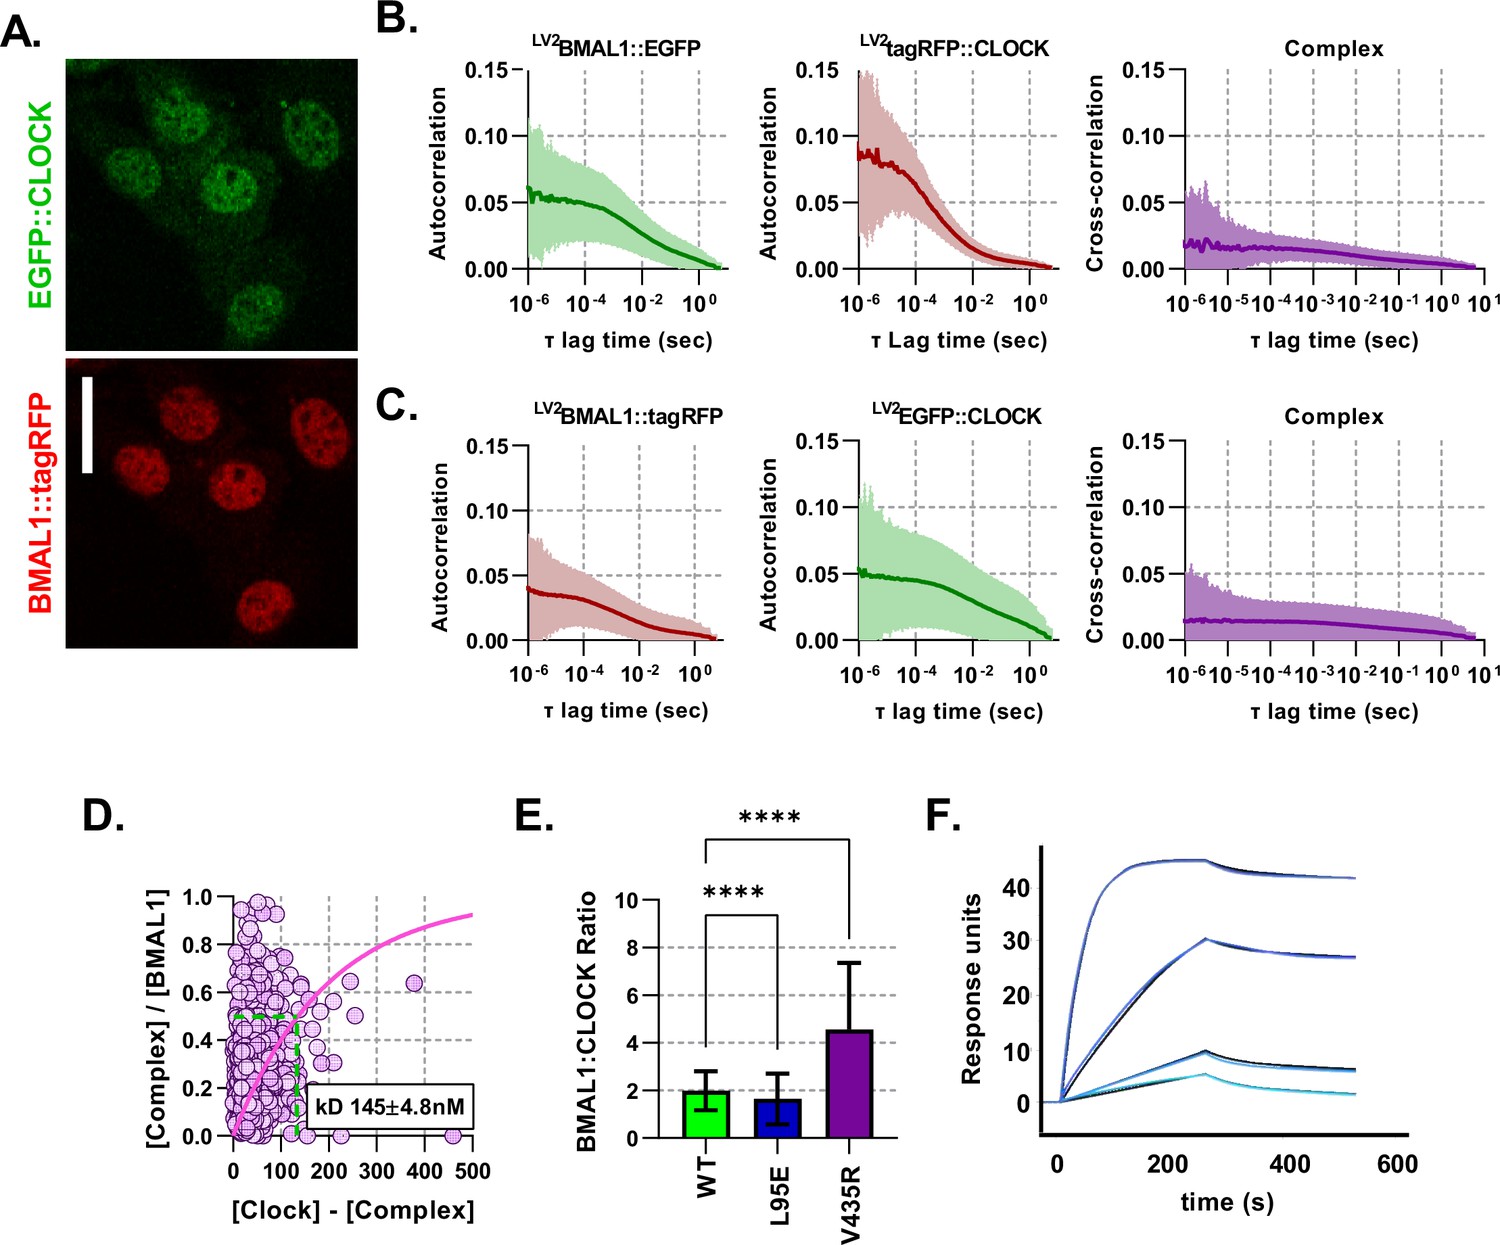
Fluorescent BMAL1 and CLOCK proteins behave similarly when colours are swapped.
(A) Confocal images of NIH/3T3-LV2 EGFP::CLOCK-BMAL1::tagRFP cells. (B) Average auto- and cross- correlation curves shown as mean (line) and standard deviation (error envelope) for NIH/3T3 cells transduced to express BMAL1::EGFP and tagRFP::CLOCK. (C) Same as previous for colour swapped cells so that they express BMAL1::tagRFP and EGFP::CLOCK (n = 1158). (D) Dissociation plot to determine for data from C. (E) Ratio calculations for number of nuclear molecules of BMAL1::EGFP/NLS::EGFP to tagRFP::CLOCK. (F) Surface plasmon resonance (SPR) analysis of heterodimer formation with immobilised biotinylated CLOCK PAS-AB in the presence of increasing concentrations of BMAL1 PAS-AB from 0.25 to 10 (light to dark blue). Data were fitted using a 1:1 binding model (global fit in black, association rate , dissociation rate , , ). Kruskal-Wallis test used to determine significance (values are denoted as p > 0.05 ns, p < 0.05 *, p < 0.01 **, p < 0.001 *** and p < 0.0001 ****).
Figure 3 with 3 supplements
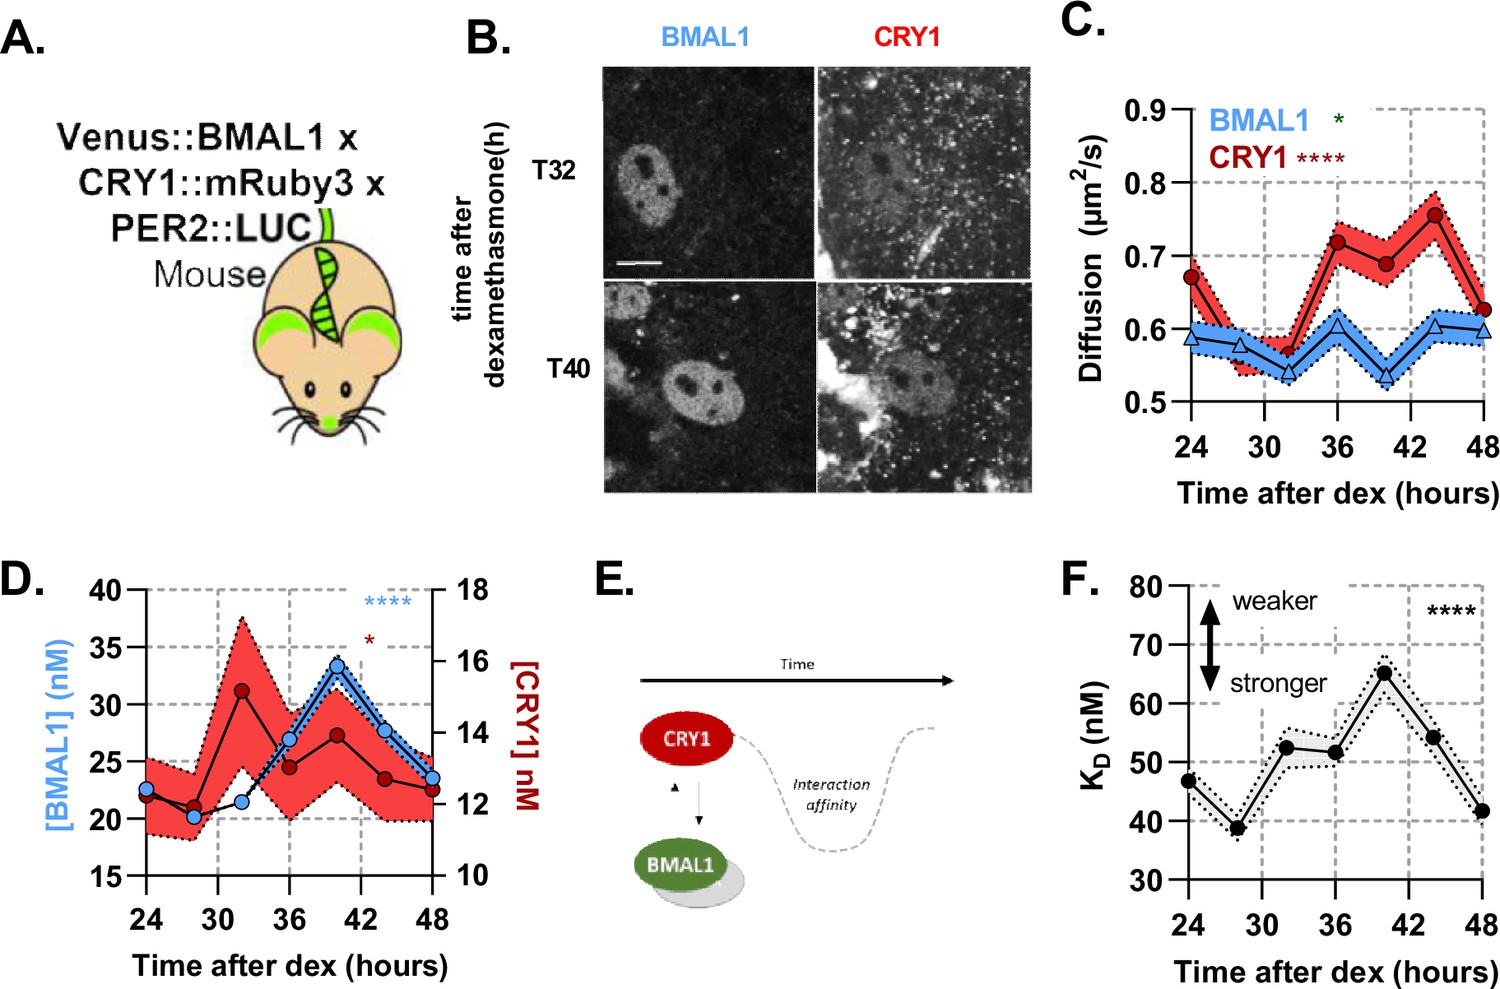
A rhythmic and strong interaction observed between slow-diffusing BMAL1 and CRY1 facilitates repression.
(A) Schematic of triple-labelled mice from which primary lung fibroblasts were isolated (B) Confocal images of two cells shown for Venus::BMAL1 and CRY1::mRuby3 over time. FCS determined measurement for diffusion coefficient (C) and protein concentration (D) of Venus::BMAL1 and CRY1::mRuby3 (n = 136, 143, 173, 131, 158, 121, and 132; line shows the mean and error envelopes show the SEM). (E–F) Interaction strength between BMAL1 and CRY1 was also measured over time as illustrated by the schematic of affinity as well as plotted values of dissociation constant (error envelope shows the standard deviation). Kruskal-Wallis test used to determine significance (values are denoted as p > 0.05 ns, p < 0.05 *, p < 0.01 **, p < 0.001 *** and p < 0.0001 ****). Source data for panels B,C available as Figure 3—source data 1, Figure 3—source data 2, Figure 3—source data 3, Figure 3—source data 4.
-
Figure 3—source data 1
CRY1 FCS diffusion rates.
- https://cdn.elifesciences.org/articles/73976/elife-73976-fig3-data1-v2.csv
-
Figure 3—source data 2
BMAL1 FCS diffusion rates.
- https://cdn.elifesciences.org/articles/73976/elife-73976-fig3-data2-v2.csv
-
Figure 3—source data 3
BMAL1 FCS concentration.
- https://cdn.elifesciences.org/articles/73976/elife-73976-fig3-data3-v2.csv
-
Figure 3—source data 4
CRY1 FCS concentration.
- https://cdn.elifesciences.org/articles/73976/elife-73976-fig3-data4-v2.csv
Figure 3—figure supplement 1
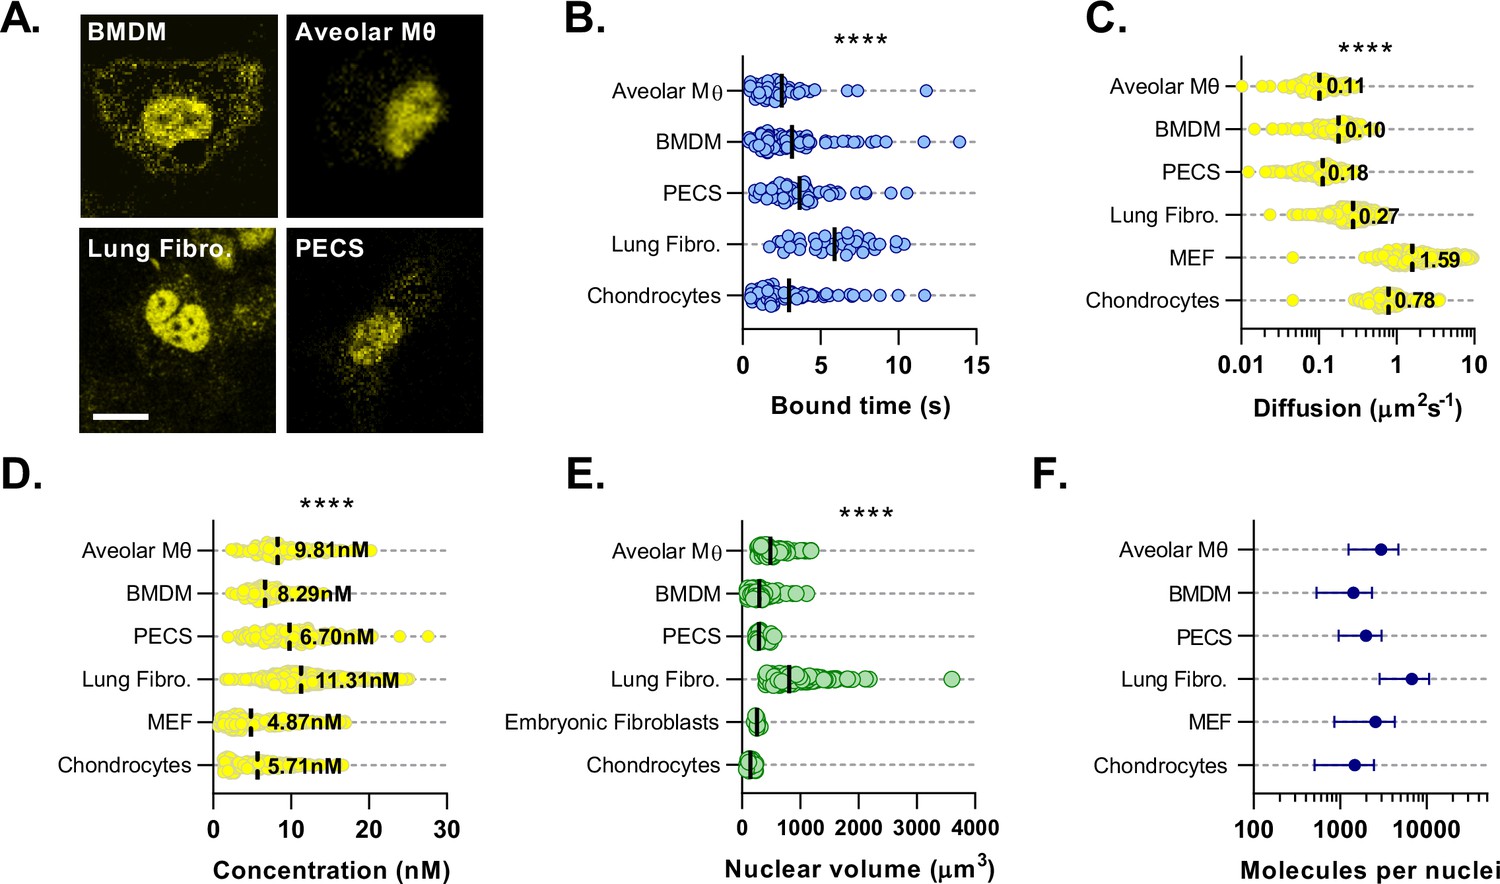
BMAL1 concentration and DNA binding parameters minimally vary across cell types.
(A) Confocal microscopy images of primary cultures isolated from Venus::BMAL1 mice. (B) Characteristic bound time calculated from FRAP measurements of primary cultures from A. Chondrocyte data was previously measured by Yang et al., 2020 and reanalysed for bound time (n = 73, 87, 61, 42, and 35 cells). (C) Cell cultures were measured using FCS and the auto-correlation data used to determine Venus::BMAL1 diffusion coefficient and (D) protein concentration (n = 107, 142, 156, 1597, 243, and 172 cells). (E) To determine total molecular abundance per nuclei, cultures were stained with Hoechst 33,342 and then imaged. Nuclear volumes were then determined (n = 84, 115, 27, 169, 9 and 30). (F) Total BMAL1 molecules calculated from average nuclear concentration and average nuclear volume. Kruskal-Wallis test was used to determine significance (values are denoted as p > 0.05 *, p < 0.01 **, p < 0.001 *** and p < 0.0001 ****). Panels B and D have been adapted from Figure 4E and 5A, B from Yang et al., 2020.
-
Figure 3—figure supplement 1—source data 1
CRY1::mRuby3 mouse genotyping.
- https://cdn.elifesciences.org/articles/73976/elife-73976-fig3-figsupp1-data1-v2.pdf
Figure 3—figure supplement 2
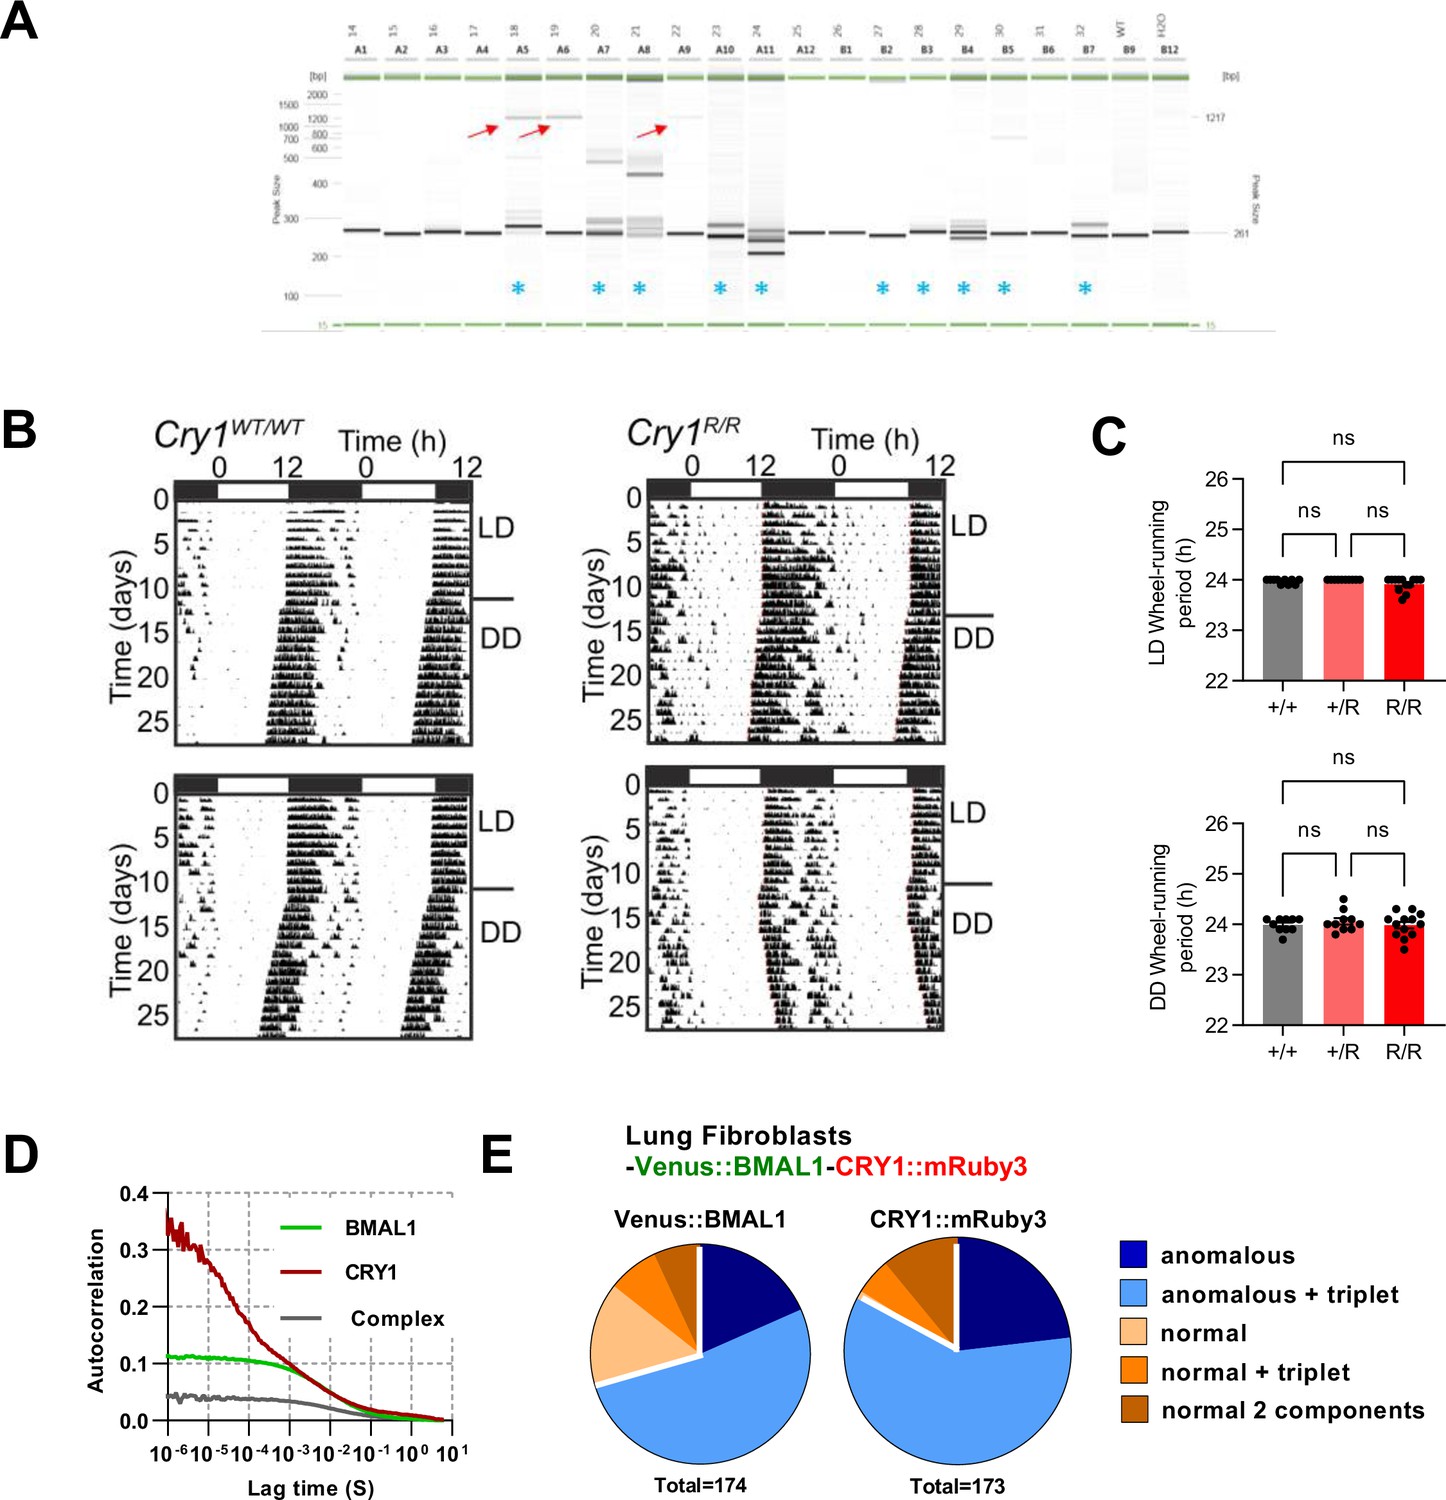
Generation of CRY1::mRuby3 mouse line.
(A) Genotyping of pups by PCR. Images are PCR reactions run on Qiaxcel with red arrows indicating correct HDR product size, blue asterisks indicate mice in which InDels resulting from NHEJ are observed. (B) Actogram traces for wild-type and genetically modified CRY1::mRuby3 mice. (C) Mean ± SEM circadian periods for wheel-running in light-dark conditions (12 h/12 h) (+/+ = 10; +/R = 10; R/R = 13). Mean ± SEM circadian periods for wheel-running in constant dark (+/+ = 6; +/R = 10; R/R = 10). (D) Mean correlation curve for FCS measurements of BMAL1 x CRY1 x PER2::luc lung fibroblasts 24 hr after dexamethasone synchronisation (n = 144, BMAL1 and n = 135, CRY1). (E) FCS model selection results (pooling 24–48 hr post-dexamethasone measurements). One-way ANOVA test used to determine significance (values are denoted as p > 0.05 ns, p < 0.05 *, p < 0.01 **, p < 0.001 *** and p < 0.0001 ****).
Figure 3—figure supplement 3
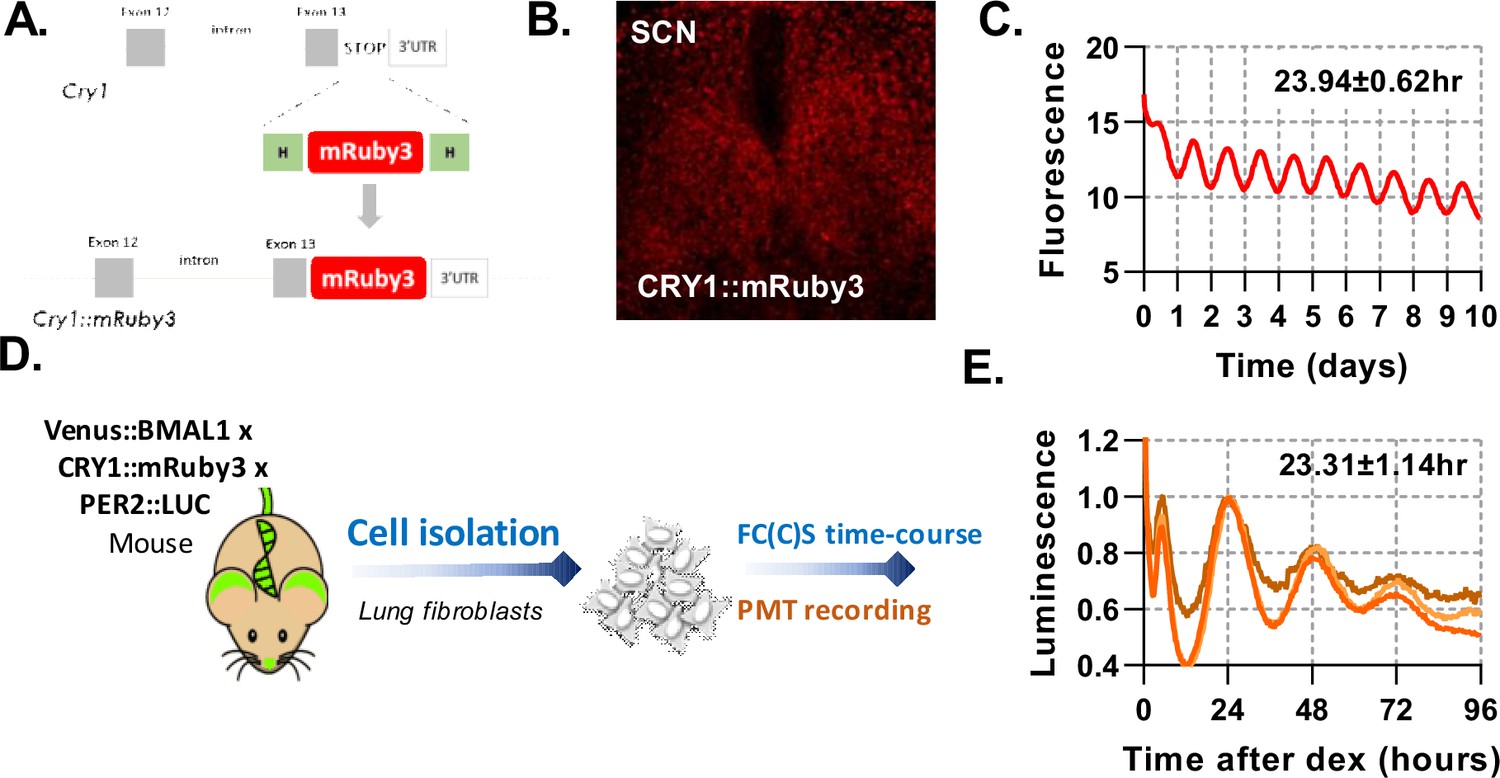
Triple endogenous labelled mice used to assay rhythms in SCN and peripheral lung fibroblasts.
(A) Schematic representation of newly made transgenic mouse engineered to express CRY1::mRuby3, Venus::BMAL1, and PER2::LUC. (B) Confocal microscopy image of SCN organotypic slice expressing CRY1::mRuby3. (C) Quantification of mRuby3 fluorescence over time for the whole SCN, with mean and standard deviation of period. (D) Experimental set up to measure isolated primary lung fibroblasts from Venus::BMAL1 x CRY1::mRuby3 x PER2::LUC labelled mice synchronised with dexamethasone. Parallel cell cultures were analysed for luminescence and also by FCS over a time-course, measured every 4 hr. (E) Luminescence recordings of isolated primary lung fibroblasts from BMAL1 x CRY1 x PER2 labelled mice synchronised with dexamethasone. Data shown is for three independent replicates, with mean and standard deviation of period shown.
Figure 4 with 1 supplement
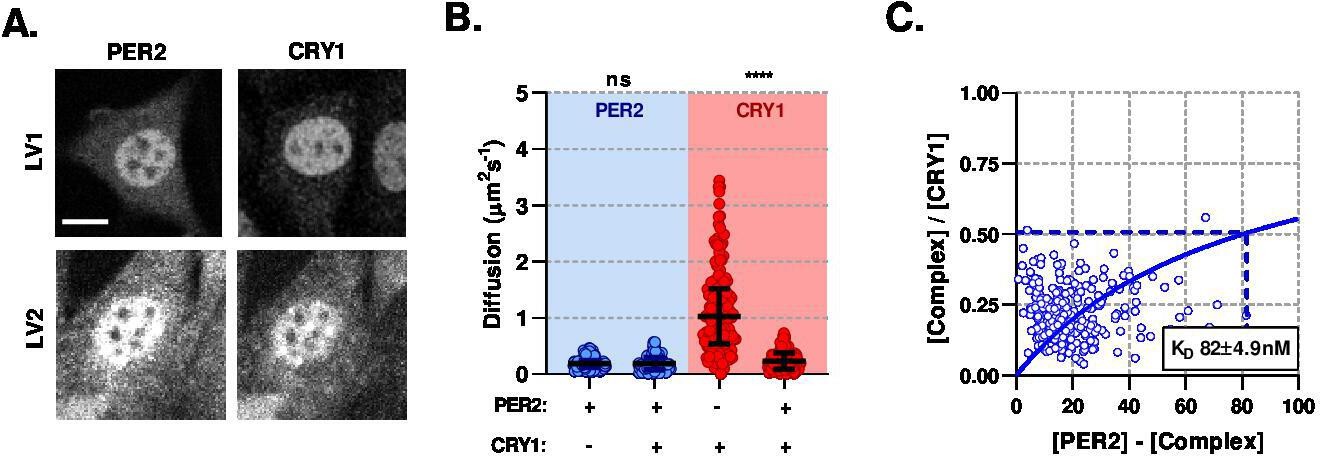
PER2 modulates CRY1 mobility via a high-affinity association.
(A) Confocal images of transduced NIH/3T3 cells that either solo- or co- express PER2 and CRY1. (B) FCS data showing diffusion for PER2 and CRY1 in solo- and co-expressed conditions (n = 165, 174, 274, and 274 cells; diffusion rate means of 0.2, 0.2, 1.1, 0.2). (C) Dissociation plot from nuclear FCS measurements for EGFP::PER2 and CRY1::tagRFP (n = 274). Significance determined by Mann-Whitney test (values are denoted as p > 0.05 ns, p < 0.05 *, p < 0.01 **, p < 0.001 *** and p < 0.0001 ****). Source data for panels B available as Figure 4—source data 1.
-
Figure 4—source data 1
PER2 and CRY1 FCS diffusion rates.
- https://cdn.elifesciences.org/articles/73976/elife-73976-fig4-data1-v2.csv
Figure 4—figure supplement 1

CRY1 mobility is affected by co-expression with PER2.
(A) Average auto- and cross- correlation curves shown as mean (line) and standard deviation (error envelope) for NIH/3T3 cells transduced to express EGFP::PER2 and CRY1::tagRFP. Measurements were made in the nuclei. (B) FCS model selection results for cells that either solo-express CRY1/PER2 or co-express both.
Figure 5 with 1 supplement

PER2 acts via CRY1 to mediate rhythmic displacement of CLOCK:BMAL1 from DNA.
(A) Schematic representation of model topology used for the deterministic model of CLOCK:BMAL1 DNA binding. (B) Primary lung fibroblasts from BMAL1 x CRY1 x PER2 mice were synchronised with dexamethasone. Plot shows PER2 concentration as measured via FCS by Smyllie et al., 2016 as well as mean BMAL1 binding time (showing SEM error envelope). Binding time was measured by confocal FRAP measurements performed on the Venus::BMAL1 fluorescence. Orange line shows the inverse of kOFF (s-1), determined from fitting the recovery data with a single component model (n = 48, 70, 82, 63, 82, 64, and 65 cells). (C) ODE model was fit to FRAP binding data from E. and using a measured input for PER2 nuclear concentration previously determined in Smyllie et al., 2016. Model output showing (D) inferred nuclear concentrations for molecular complexes (E) and CLOCK:BMAL1 without and with CRY1 bound to target sites (see supplementary materials for parameters). Panel B has been adapted from Figure 3C from Smyllie et al., 2016.
Figure 5—figure supplement 1
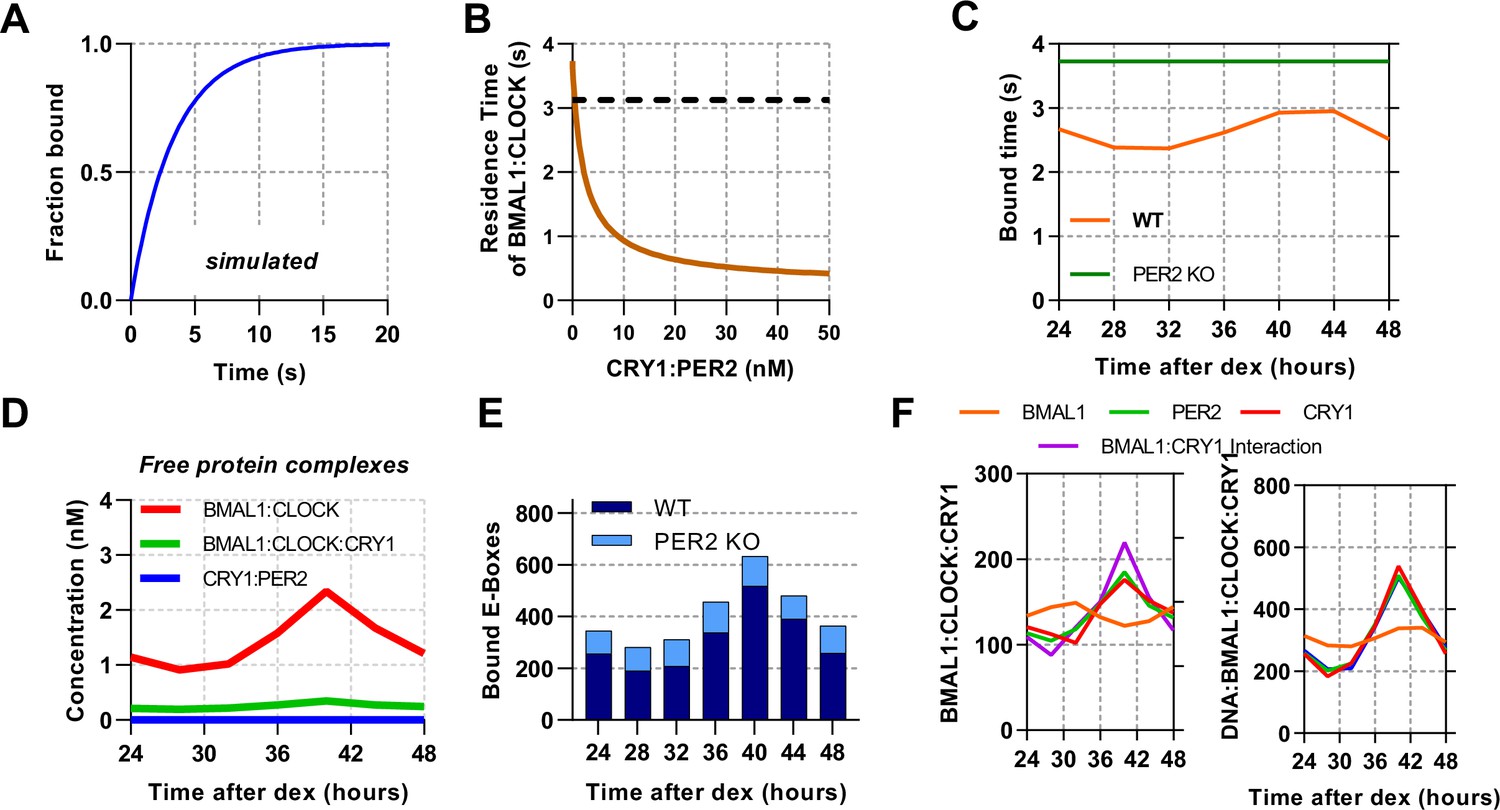
ODE model of CLOCK:BMAL1 DNA binding using measured inputs and modelled perturbations.
(A) Normalised model simulated FRAP using ODE model by counting recovery of site bound BMAL1 species after removal. (B) Model determined residence time of DNA bound CLOCK:BMAL1 across different concentrations of CRY1:PER2 using parameters from T40. (C) Modelled residence time of DNA bound CLOCK:BMAL1 across circadian time calculated for WT and without PER2. Without PER2 model data over a circadian cycle showing (D) non DNA-bound complexes and (E) DNA bound CLOCK:BMAL1. (F) Plots showing the CLOCK:BMAL1:CRY1 complex across several simulated conditions, including removal of rhythmicity from BMAL1, CRY1, or PER2 protein levels or the interaction between BMAL1:CRY1 (fixing them to their mean concentration).
Figure 6
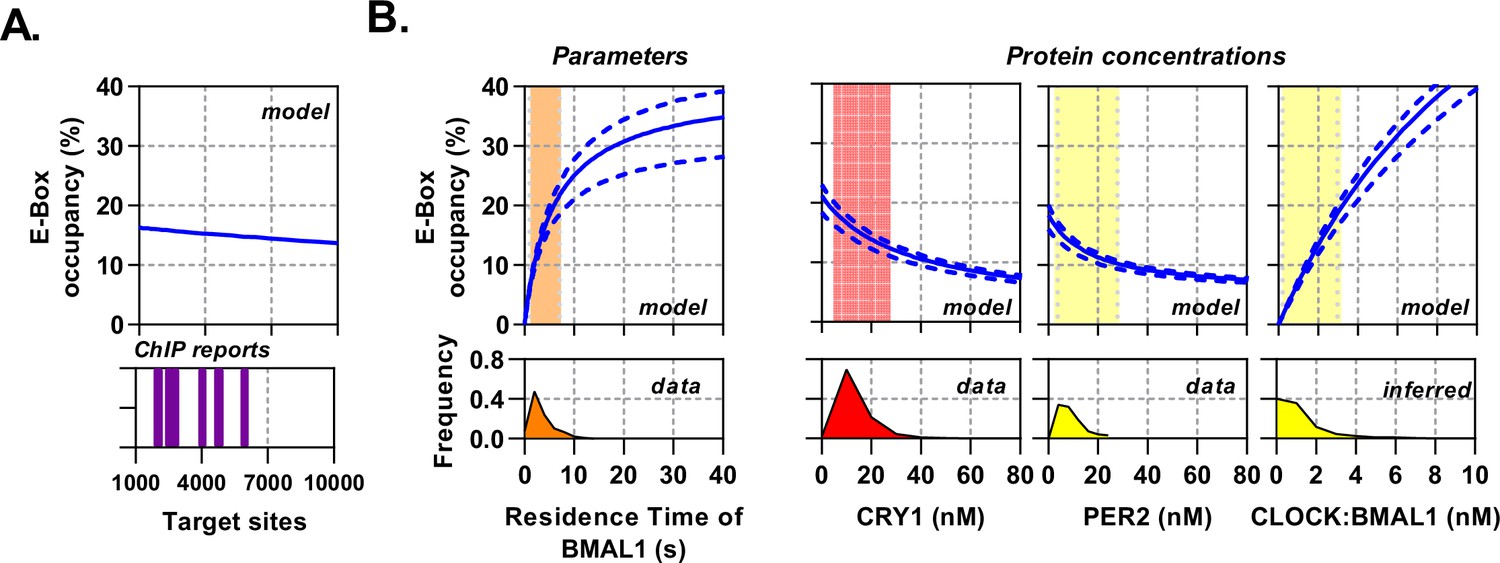
Circadian proteins operate within an optimal range to modulate E-Box binding.
Sensitivity analysis of the deterministic binding model showing relationship of measured parameters (bottom) against model for occupancy of active BMAL1:CLOCK on target sites (top). (A) Changing number of target sites with data matched to BMAL1 ChIP data sets. (B) From left to right, the effect of changing residence time of CLOCK:BMAL1, or protein concentrations. Histograms show measured concentrations for corresponding proteins across all conditions/cells. The 10th to 90th percentile is highlighted. Source data available as Figure 6—source data 1.
-
Figure 6—source data 1
Model OAT outputs.
- https://cdn.elifesciences.org/articles/73976/elife-73976-fig6-data1-v2.xlsx
Figure 7 with 1 supplement
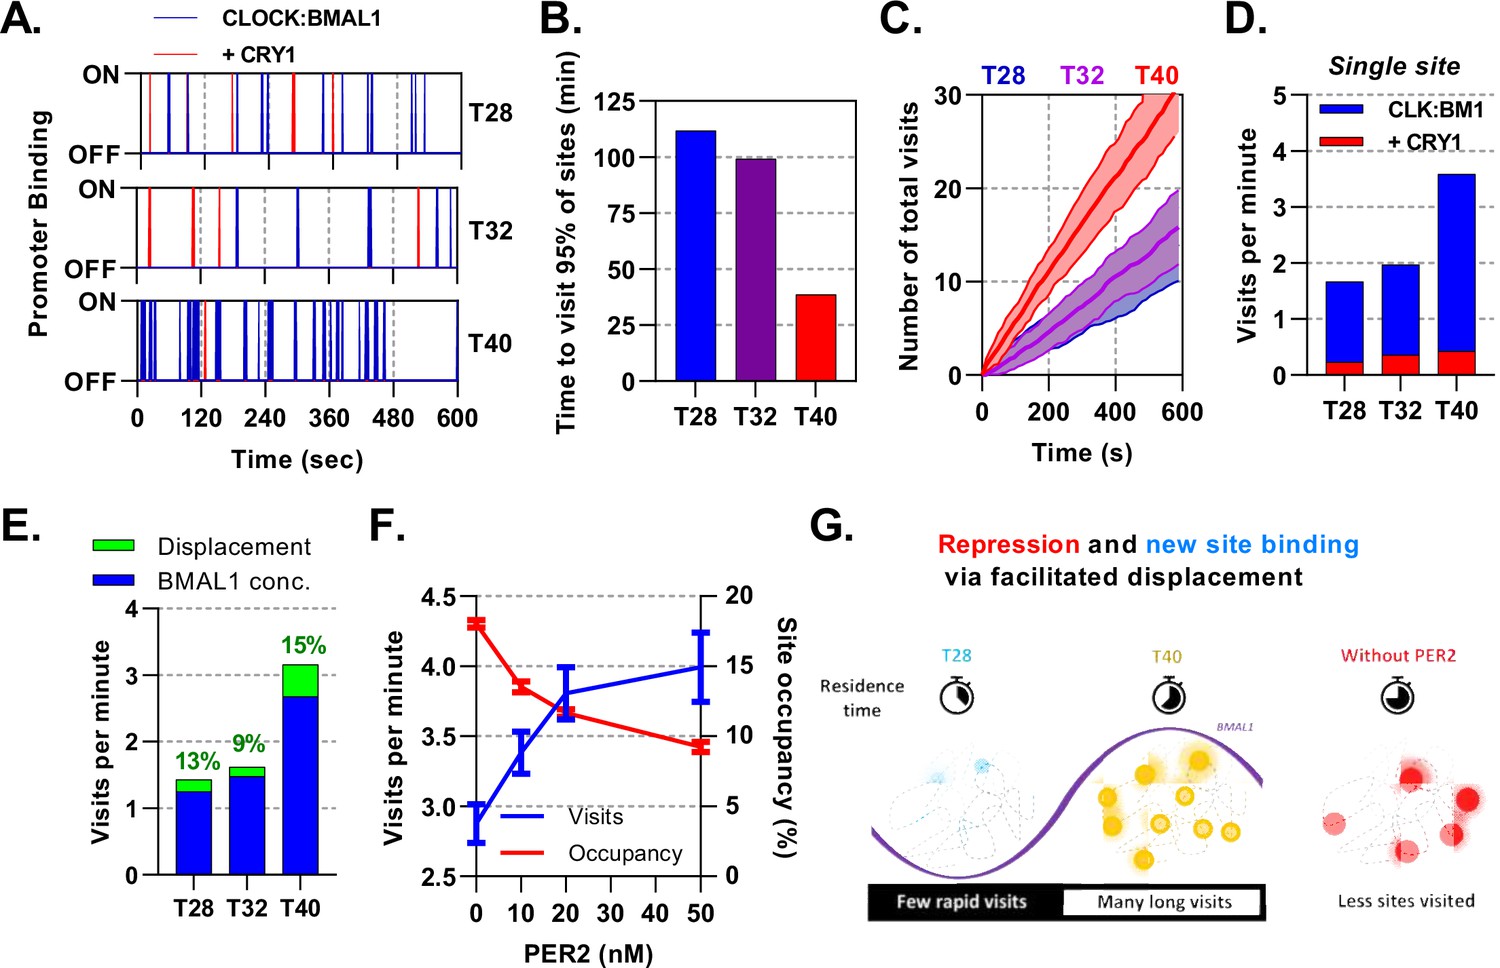
Mathematical modelling demonstrates dual function of PER:CRY mediated repression.
Stochastic binding model outputs using parameters corresponding to T28, T32 or T40 post dexamethasone BMAL1 x CRY1 data sets. (A) Shows a promoter corresponding to the average binding rate of CLOCK:BMAL1, (B) the time to visit 95% of target sites once and (C) number of visits to a single promoter over time. Shaded error envelope shows standard deviation. (D) Average number of visits per minute to a target site showing active and CRY1 repressed CLOCK:BMAL1 visits. (E). Comparison of the contribution of BMAL1 concentration (blue) and PER2 facilitated displacement (green) on the visits per minute to a target site. Percentage contribution indicated. (F) Relationship of PER2 protein concentration to site visitations per minute and occupancy by CLOCK:BMAL1 using parameters for T40 explored over different concentrations of PER2. Error bars represent standard deviation. (G) The action of CRY:PER leads to short-lived transient binding of CLOCK:BMAL1 to DNA, working as both a repressive action whilst also facilitating binding to new target sites.
Figure 7—figure supplement 1

Stochastic binding model using experimentally measured parameters (A) Stochastic model showing the average binding (with SD) of CLOCK:BMAL1 bound target sites using input measurements from all time points for both WT and without PER2 simulations.
(B) The time to visit every E-Box site once for T28 showing fit. (C) Model simulation plots showing CLOCK:BMAL1 visits to a single promoter over time. Red and blue lines show simulations using different nuclear volumes (red and blue lines, corresponding to primary lung fibroblasts and mouse embryonic fibroblasts). Input values for BMAL1 concentration and binding OFF rate correspond to those measured at the time point referred above each panel.
Tables
Table 1
Summary of ordinary differential equation model parameters.
Model fit .
| Input parameters | |||
|---|---|---|---|
| Parameter | Unit | Description | Value±SD |
| nM | CLOCK:BMAL1 - E-Box dissociation constant | 10 (Huang et al., 2012) | |
| nM | CLOCK - BMAL1 dissociation constant | 147.6 ± 9.8 | |
| nM | BMAL1 - CRY1 dissociation constant | Time-point dependent, Figure 3F | |
| nM | CRY1 - PER2 dissociation constant | 81.8 ± 4.9 | |
| Fitted parameters | |||
| Parameter | Unit | Description | Value±SD (Inverse Hessian eigenvalue of fit) |
| CLOCK:BMAL1 - DNA binding on rate | |||
| BMAL1 - CRY1 binding rate | |||
| PER2 - CRY1 binding rate | |||
| CLOCK:BMAL1:CRY1:PER2 - DNA unbinding rate | |||
| CLOCK - BMAL1 binding rate | |||
| Derived parameters | |||
| Parameter | Unit | Description | Value±SD |
| CLOCK:BMAL1 - DNA binding unbinding rate | |||
| CLOCK - BMAL1 unbinding rate | |||
| BMAL1 - CRY1 unbinding rate | Time-point dependent, | ||
| PER2 - CRY1 unbinding rate | |||
Table 2
BMAL1 ChIP reports.
| No. | Tissue | BMAL1 peaks | Reference |
|---|---|---|---|
| 1 | Liver | 2049 | Rey et al., 2011 |
| 2 | Liver | 5952 | Koike et al., 2012 |
| 3 | U2OS | 2001 | Wu et al., 2017 |
| 4 | PECS | 2026 | Oishi et al., 2017 |
| 5 | Liver | 4813 | Beytebiere et al., 2019 |
| 6 | Kidney | 4034 | Beytebiere et al., 2019 |
| 7 | Heart | 2520 | Beytebiere et al., 2019 |
| 8 | NIH3T3 | 4740 | Chiou et al., 2016 |
| 9 | Skeletal muscle | 2787 | Dyar et al., 2018 |
| Mean average | 3436 |
Key resources table
| Reagent type (species) or resource | Designation | Source or reference | Identifiers | Additional information |
|---|---|---|---|---|
| Genetic reagent (M. musclus) | C57BL/6 Venus::BMAL1 | Yang et al., 2020 | Venus sequence inserted before BMAL1 start codon. | |
| Genetic reagent (M. musclus) | C57BL/6 Cry1::mRuby3 | This paper | CRY1 stop codon replaced with mRuby3 | |
| Genetic reagent (M. musclus) | C57BL/6 Venus::BMAL1 x CRY1::mRuby3 | This paper | Crossed from Venus::BMAL1 and CRY1::mRuby3 mice | |
| Cell line (M. musculus) | NIH/3T3 | ATCC | CRL-1658 | |
| Transfected construct (M. musculus) | pLNT-NLS::EGFP | Vector Builder VB900119-0501njq | Lentiviral construct to express nuclear EGFP. | |
| Transfected construct (M. musculus) | pLNT-BMAL1::EGFP or pLNT-BMAL1::RFP | This paper | NCBI reference: NM_007489.4 | Lentiviral construct to express fluorescent BMAL1. |
| Transfected construct (M. musculus) | pLNT-BMAL1-L95E::EGFP | This paper | NCBI reference: NM_007489.4 | Lentiviral construct to express fluorescent BMAL1 L95E mutant. |
| Transfected construct (M. musculus) | pLNT-BMAL1-V435R::EGFP | This paper | NCBI reference: NM_007489.4 | Lentiviral construct to express fluorescent BMAL1 V435R mutant. |
| Transfected construct (M. musculus) | pLNT-EGFP::CLOCK or pLNT-RFP::CLOCK | This paper | NCBI reference: NM_007715.6 | Lentiviral construct to express fluorescent CLOCK. |
| Transfected construct (M. musculus) | pLNT-EGFP::PER2 | This paper | NCBI reference: NM_011066 | Lentiviral construct to express fluorescent PER2. |
| Transfected construct (M. musculus) | pLNT-CRY1::RFP | This paper | NCBI reference: NM_007771.3 | Lentiviral construct to express fluorescent CRY1. |
| Chemical compound, drug | Dexamethasone | Sigma Aldrich | D4902 | |
| Software, algorithm | GraphPad Prism | GraphPad Prism | Version 9 | |
| Software, algorithm | FCCS analysis pipeline | This paper | https://github.com/LoudonLab/FcsAnalysisPipeline,(copy archived at swh:1:rev:b12e9007ed7f8a033485e57c8605e27c67df74f1; Koch, 2021) |
Table 3
Stochastic model reactions and propensities.
Counter for arrivals by CLOCK:BMAL1 () without CRY1 () to previously unbound sites converting them to S0 given by as well as counters for marked site binding represented by , and unbinding, , by species . The size of the system is given by , where is the volume in liters and is used to convert ON rate quantities with dimensions nm–1s–1 into particle–1 s–1. is the same value as previously fitted for the ODE model given in Table 1.
| No. | Reaction | Propensity |
|---|---|---|
| 1 | ||
| 2 | ||
| 3 | ||
| 4 | ||
| 5 | ||
| 6 | ||
| 7 | ||
| 8 | ||
| 9 | ||
| 10 | ||
| 11 |
Additional files
Download links
A two-part list of links to download the article, or parts of the article, in various formats.
Downloads (link to download the article as PDF)
Open citations (links to open the citations from this article in various online reference manager services)
Cite this article (links to download the citations from this article in formats compatible with various reference manager tools)
Quantification of protein abundance and interaction defines a mechanism for operation of the circadian clock
eLife 11:e73976.
https://doi.org/10.7554/eLife.73976


