Cell-surface tethered promiscuous biotinylators enable comparative small-scale surface proteomic analysis of human extracellular vesicles and cells
- Department of Pharmaceutical Chemistry, University of California, San Francisco, United States
- Department of Urology, University of California, San Francisco, United States
- The Eli and Edythe Broad Center of Regeneration Medicine and Stem Cell Research, University of California, San Francisco, United States
- Department of Cellular and Molecular Pharmacology, University of California, San Francisco, United States
Figures
Figure 1 with 3 supplements
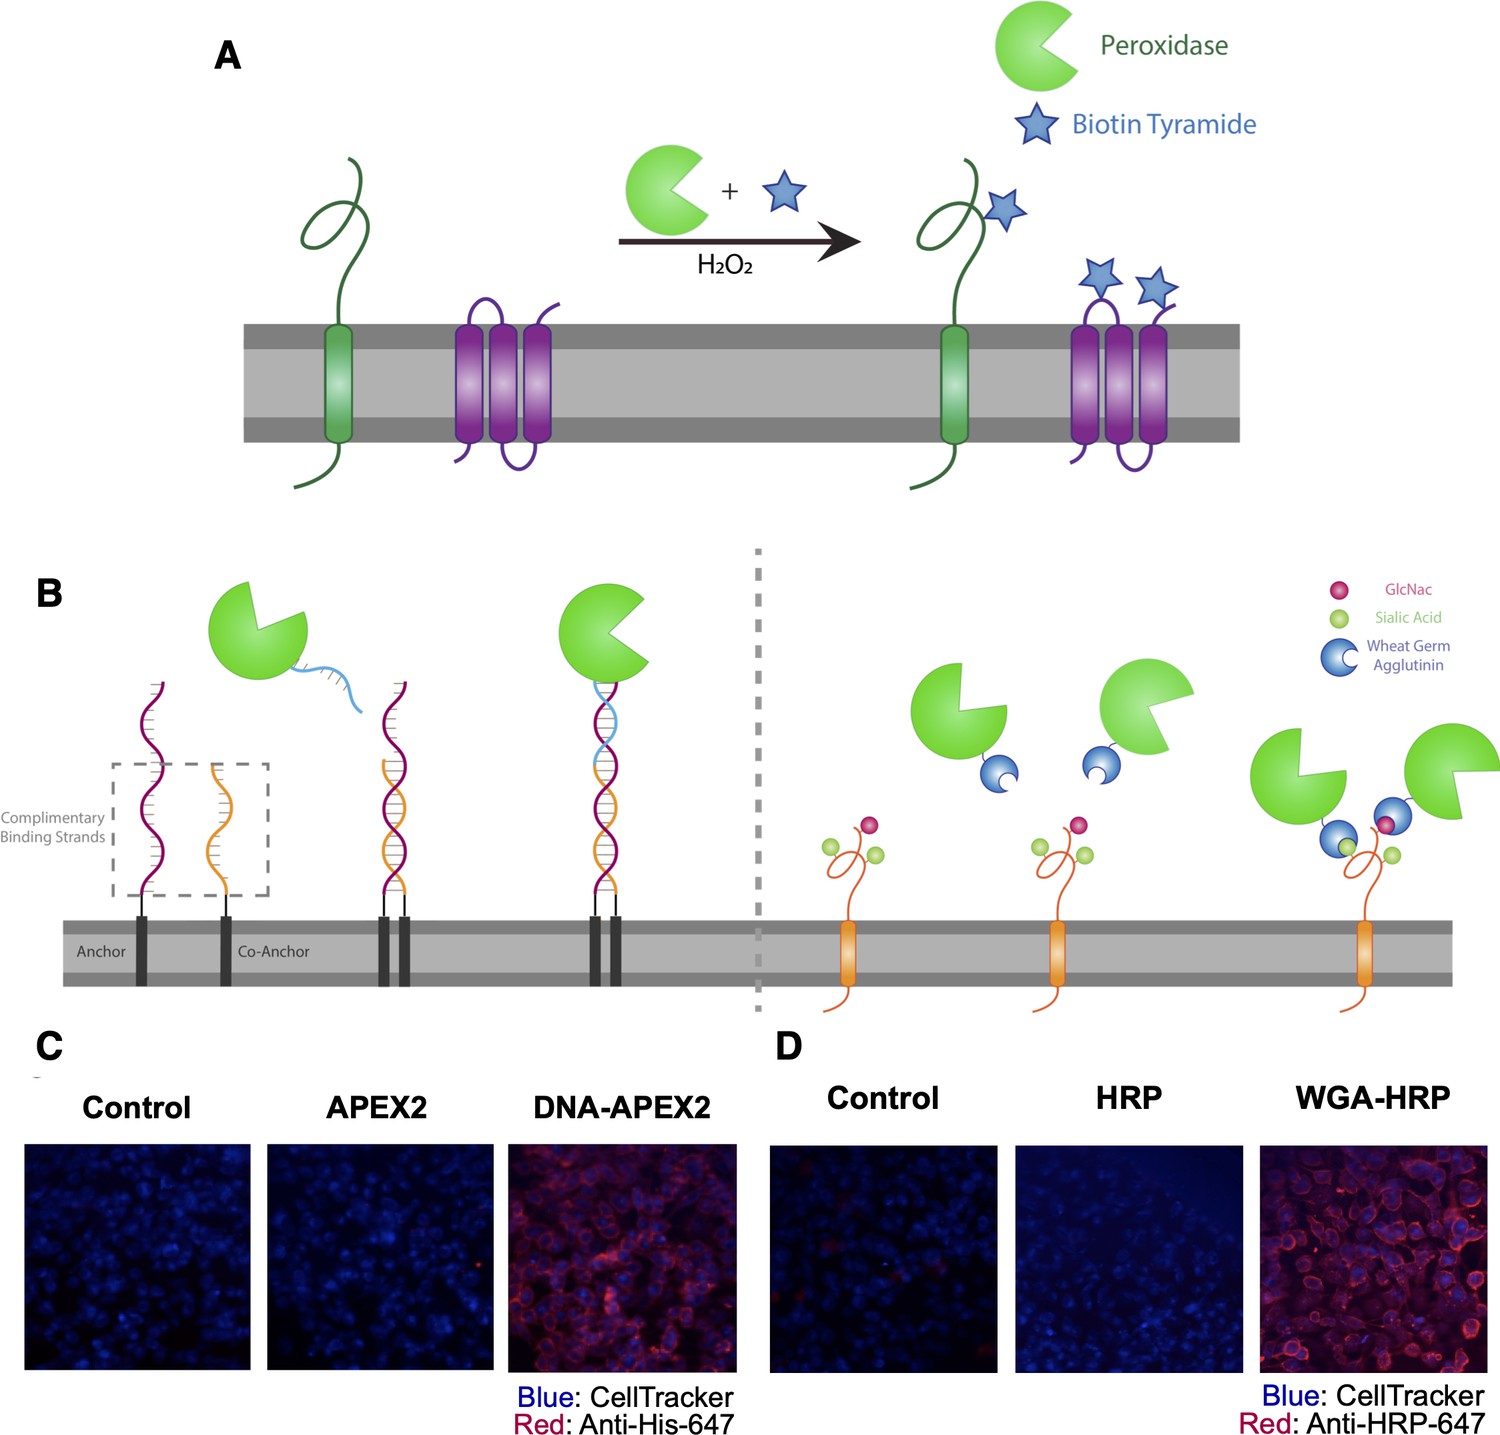
Direct labeling of promiscuous biotinylators to the cell membrane for rapid cell surface proteome characterization of small-scale biological samples.
(A) Outline of enzymatic reaction mechanism. APEX2 and HRP both require biotin tyramide and hydrogen peroxide to produce the biotin-radical intermediate. (B) Tethering either enzyme is completed through differing mechanisms: (i) APEX2 is tethered through bio-conjugation of a single-strand of DNA, which is complementary to an exogenously added sequence of lipidated-DNA attached to the membrane, (ii) Commercially available wheat germ agglutinin (WGA)-HRP associates with native GlcNAc and sialic acid glycan moieties on cell surface proteins. (C) Microscopy images depicting the localization of DNA-APEX2 to the cell surface of KP-4 cells after the introduction of the lipidated-DNA complementary strands. (D) Microscopy images depicting the localization of WGA-HRP to the membrane of KP-4 cells. All microscopy images are representative of two biological replicates.
Figure 1—figure supplement 1
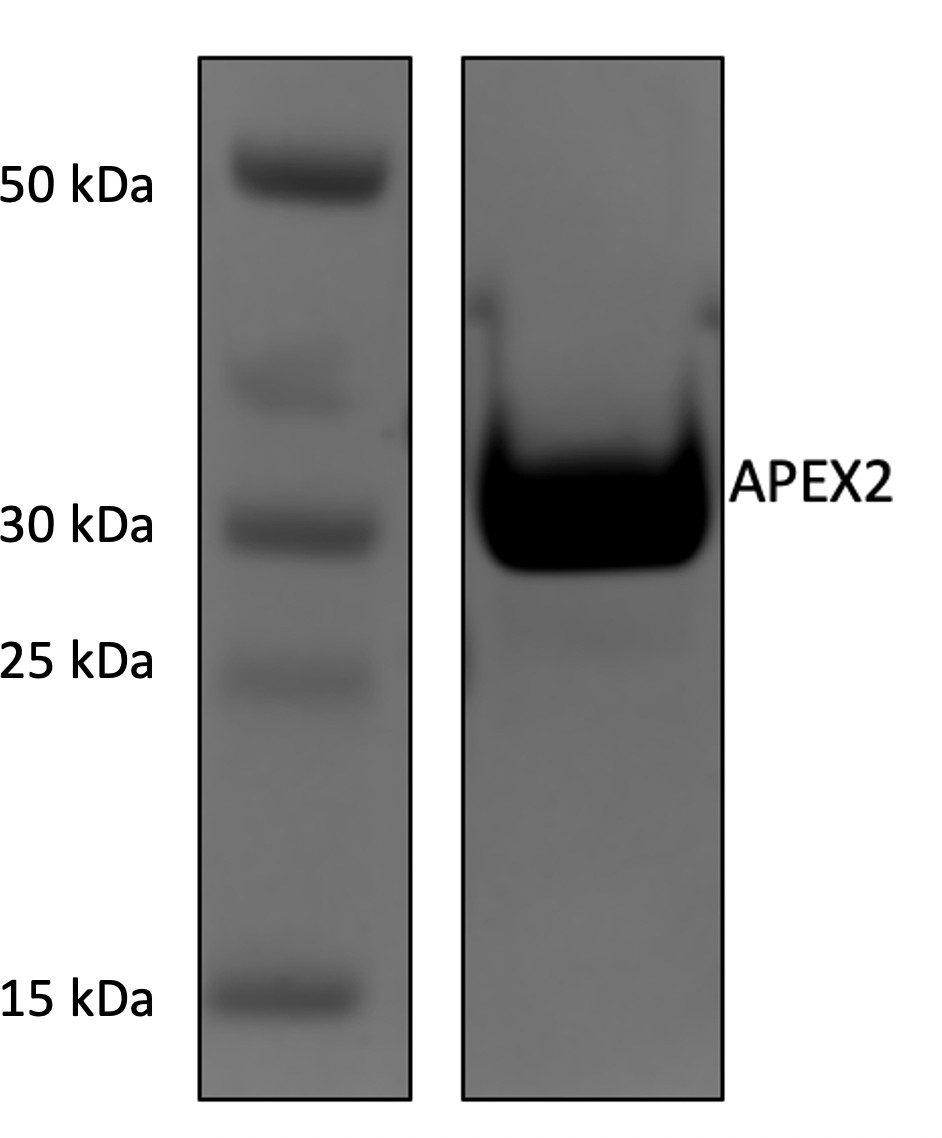
Expression, purification, and validation of APEX2 enzyme.
His-tagged APEX2 was expressed in BL21(DE3)pLysS cells and purified by a nickel column. Ten milligrams of the purified enzyme were run out on a 4%–12% Bis-Tris gel to confirm purity.
Figure 1—figure supplement 2
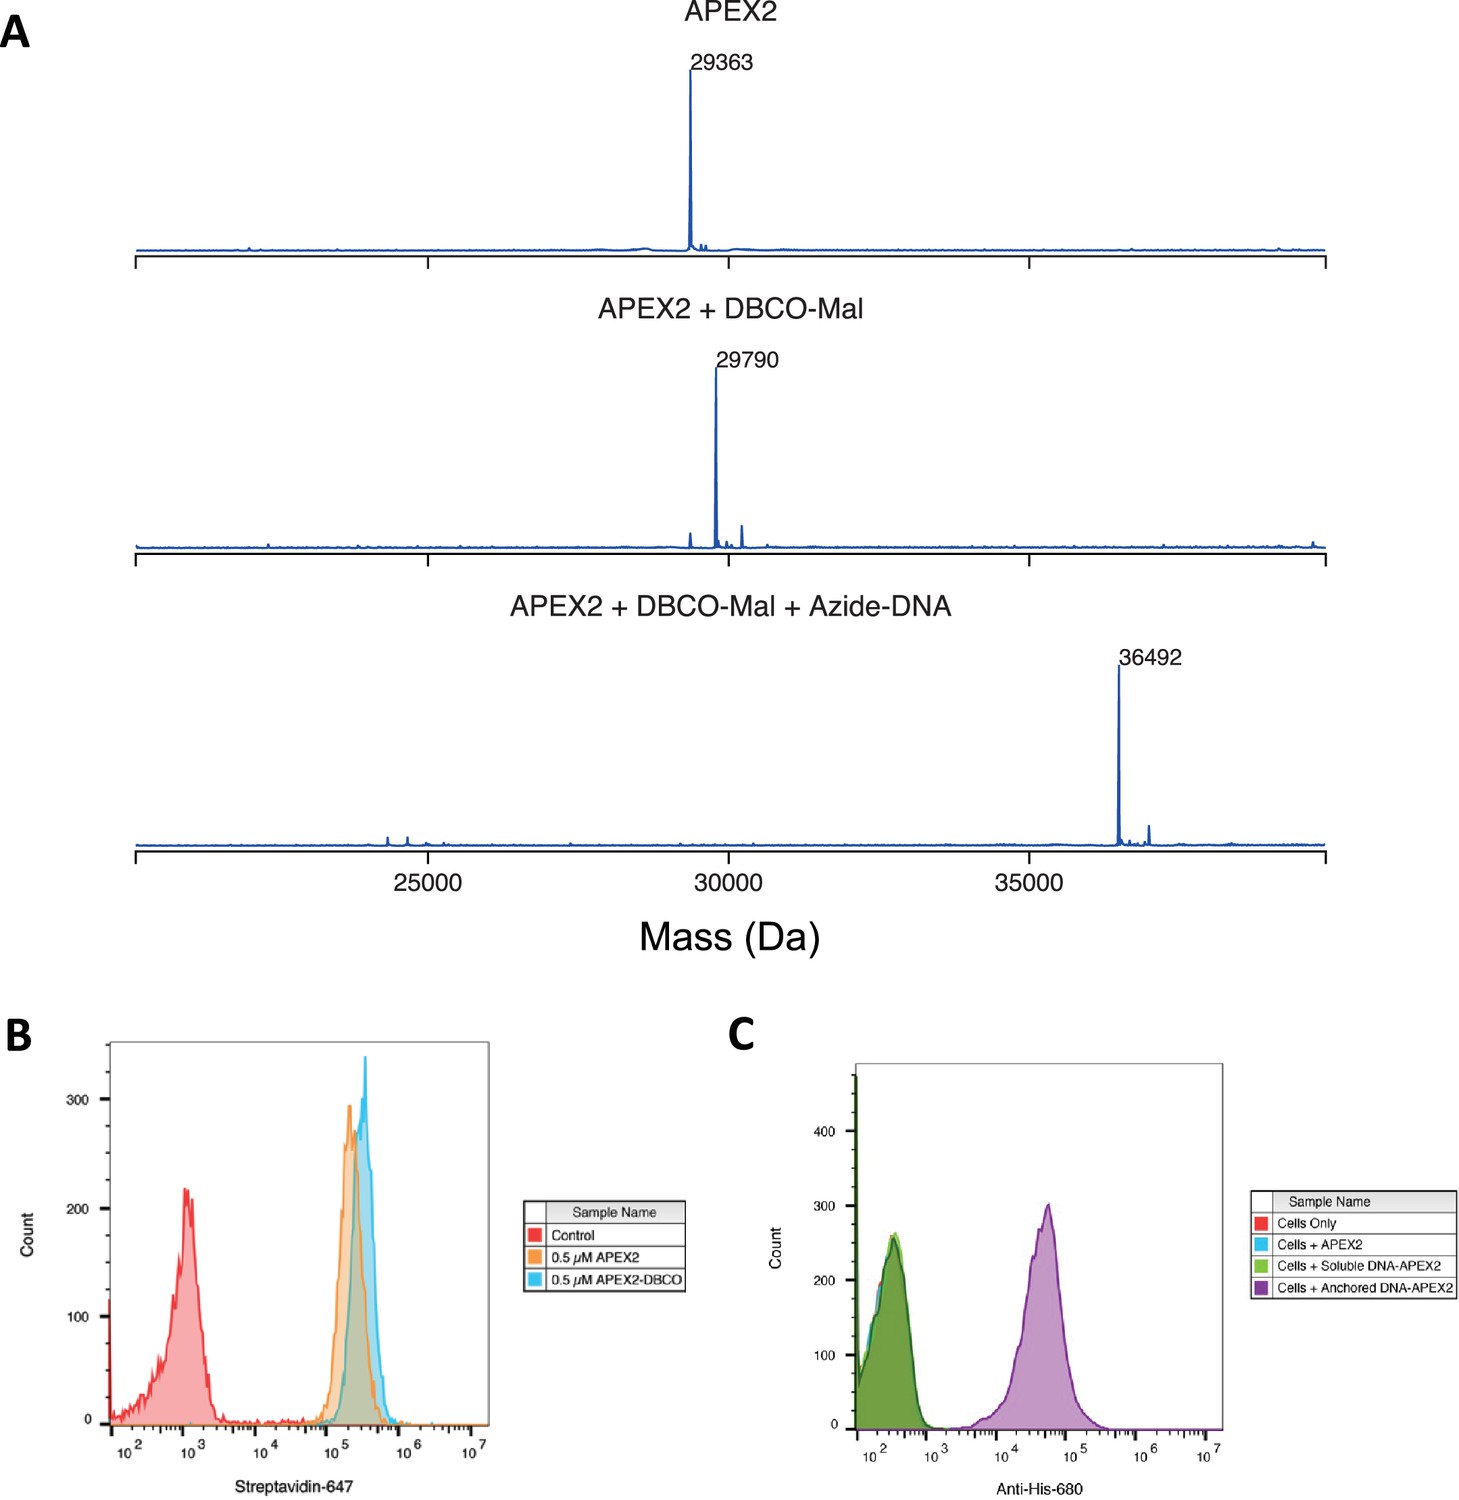
Labeling and efficacy of APEX2 with DNA.
(A) APEX2 was first conjugated with DBCO-Maleimide (DBCO-Mal) reagent at 40 equivalents for 5 hr (80% conversion to the singly labeled product). Following desalting, three equivalences of Azide-DNA were added to the conjugate and purified by a Nickel column. Both reactions were monitored by LC-MS as shown. (B) 500,000 Expi293 cells were labeled with 0.5 µM purified APEX2 and DBCO-labeled APEX2 for 2 min. Extent of biotinylation of target cells was quantified by flow cytometry staining with streptavidin-647. (C) The DNA-APEX2 conjugate was shown to be tethered in the presence of the lipidated DNA (purple) and not in the absence (green), as detected by an Anti-His 680 antibody. Unlabeled APEX2 (blue) additionally did not result in a signal shift. Flow cytometry images are representative of one biological replicate.
Figure 1—figure supplement 3
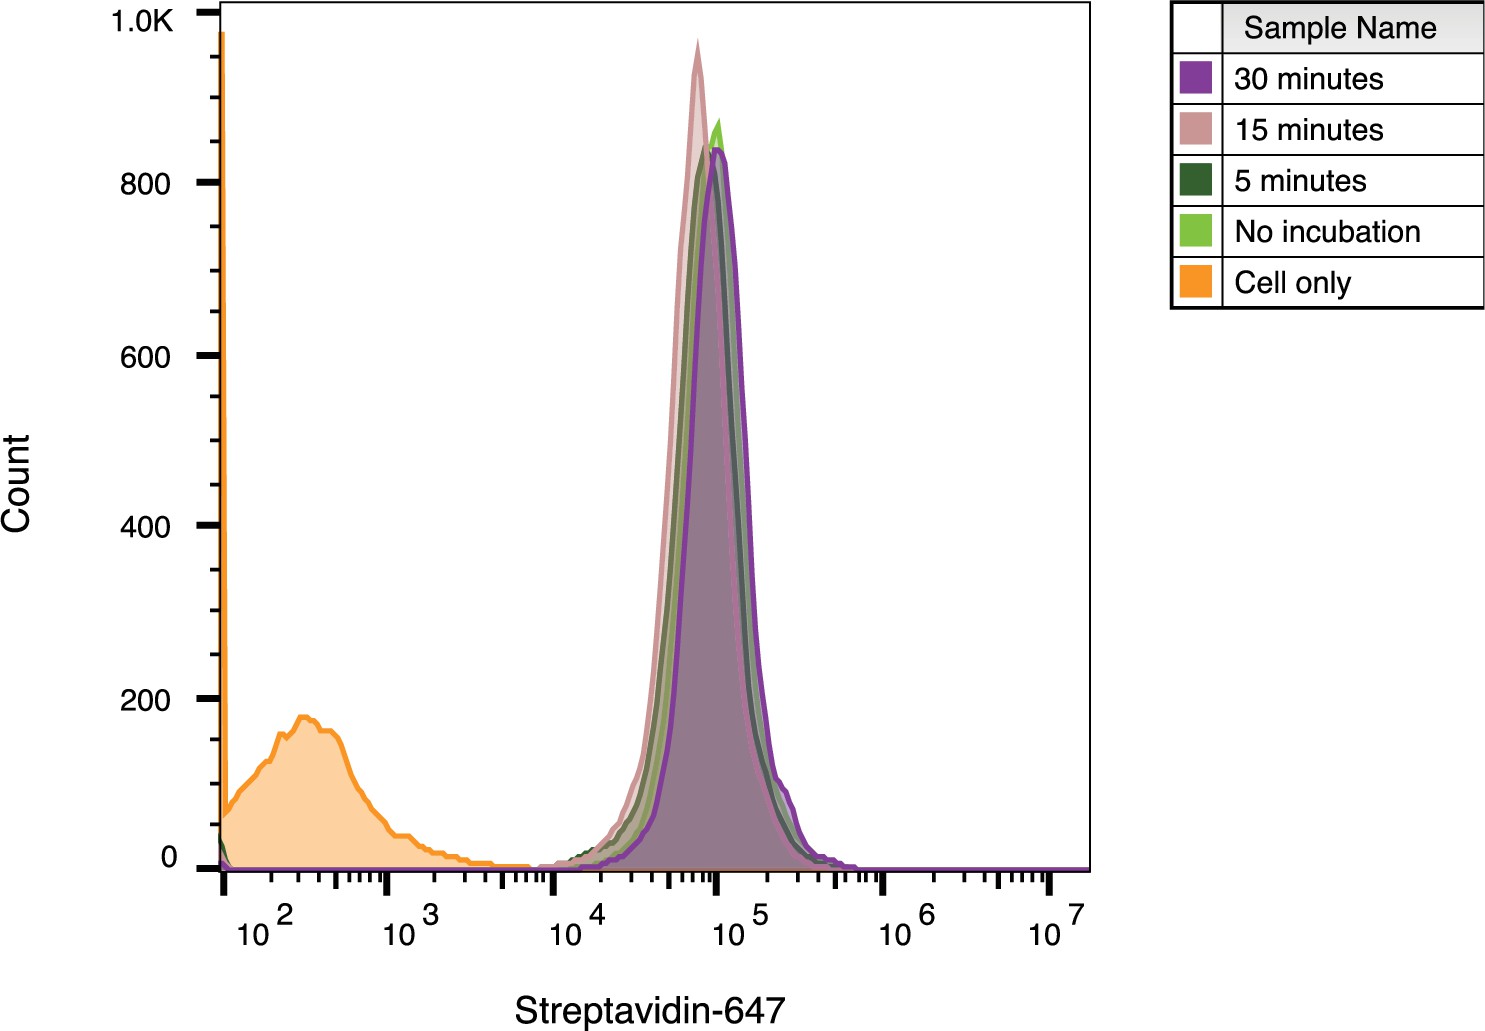
WGA-HRP preincubation time on cells has no effect on labeling efficiency.
WGA-HRP was incubated on Expi293 cells for 0–30 min to determine optimal incubation time on ice before labeling. All tested times resulted in similar cell surface biotinylation efficiencies and signified that no incubation time was needed. Flow cytometry images are representative of one biological replicate.
Figure 2 with 6 supplements
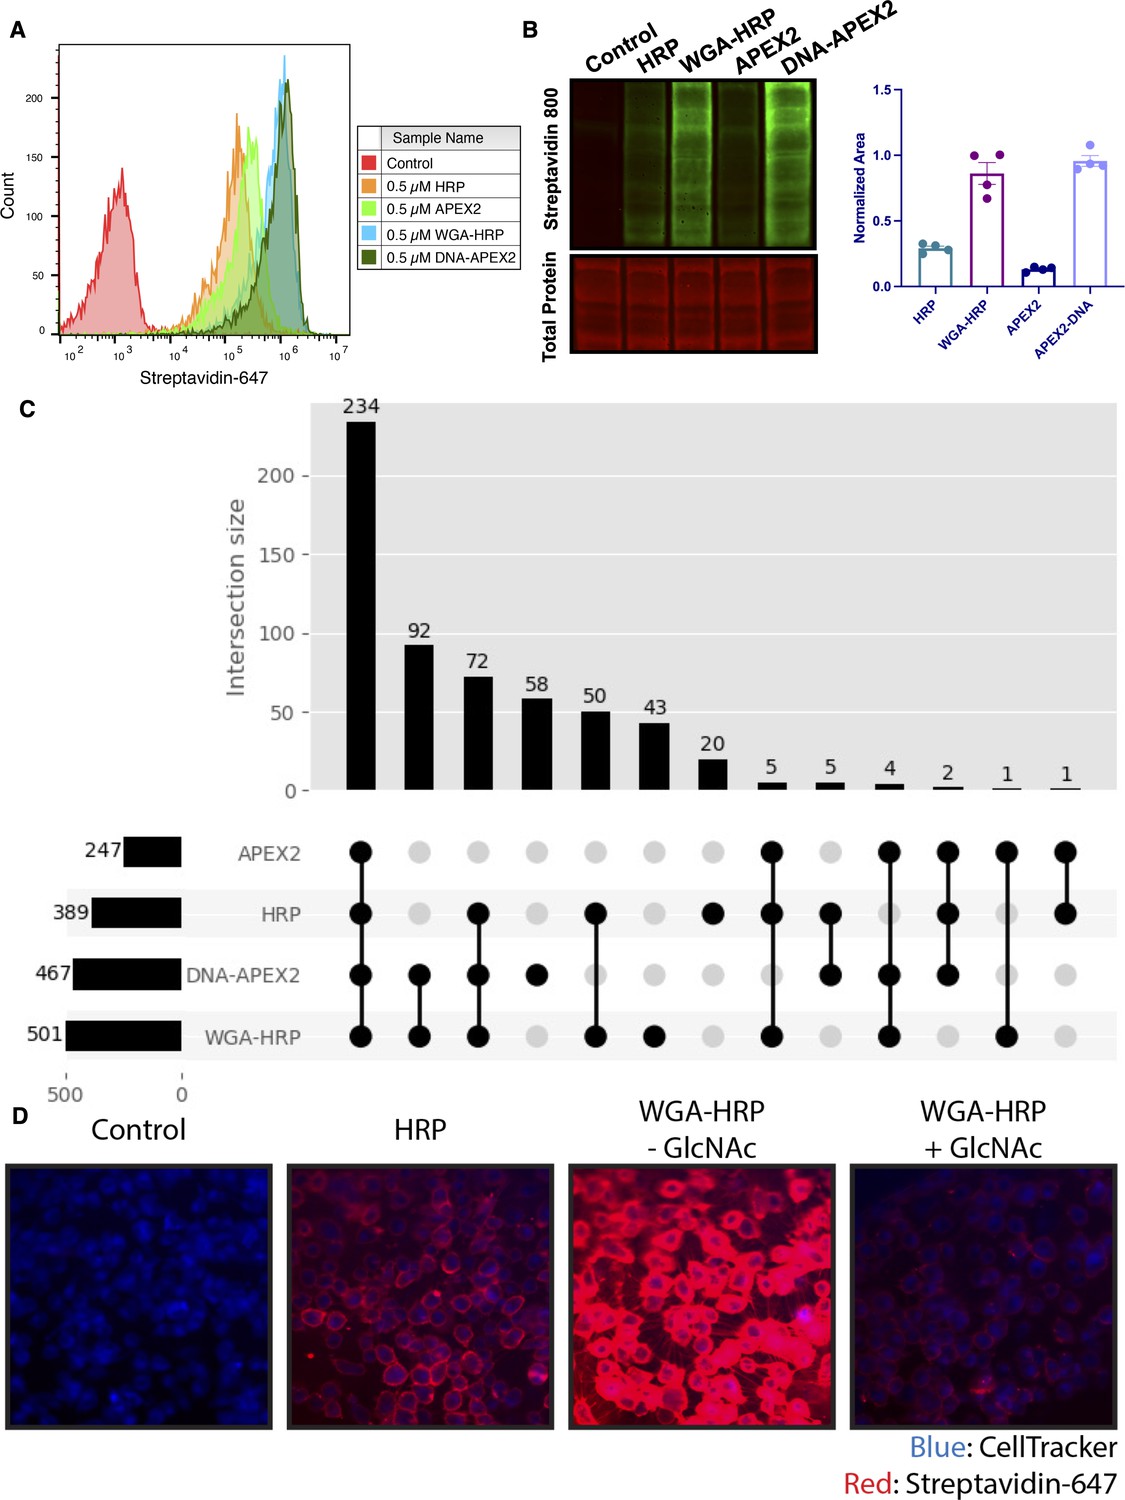
Membrane-localized peroxidases increases membrane proteome biotinylation compared to nontethered counterparts.
(A) Biotinylation of Expi293 cells treated with free enzyme (APEX2 or HRP) or cell-tethered enzyme (DNA-APEX2 or WGA-HRP) shown by flow cytometry. Signal is read out using Streptavidin-AlexaFluor-647. (B) Comparison of cell labeling with either free enzyme (APEX2 or HRP) or cell-tethered enzyme (DNA-APEX2 or WGA-HRP) shown by Streptavidin-800 western blot and total protein stain. Normalized area is plotted to the right. (C) Number of cell membrane proteins identified by mass spectrometry (>2 unique peptides, <1% FDR, found in both biological replicates) after treating 500,000 KP-4 pancreatic cancer cells with either free enzyme (APEX2 or HRP) or cell-tethered enzyme (DNA-APEX2 or WGA-HRP). (D) Microscopy images depicting extent of labeling with free HRP compared to WGA-HRP with and without the blocking sugar GlcNAc. All western blot images, microscopy images, mass spectrometry data, and flow cytometry data are representative of two biological replicates.
-
Figure 2—source data 1
Uncropped western blots.
- https://cdn.elifesciences.org/articles/73982/elife-73982-fig2-data1-v2.zip
-
Figure 2—source data 2
Mass spectrometry analysis results table.
- https://cdn.elifesciences.org/articles/73982/elife-73982-fig2-data2-v2.csv
Figure 2—figure supplement 1
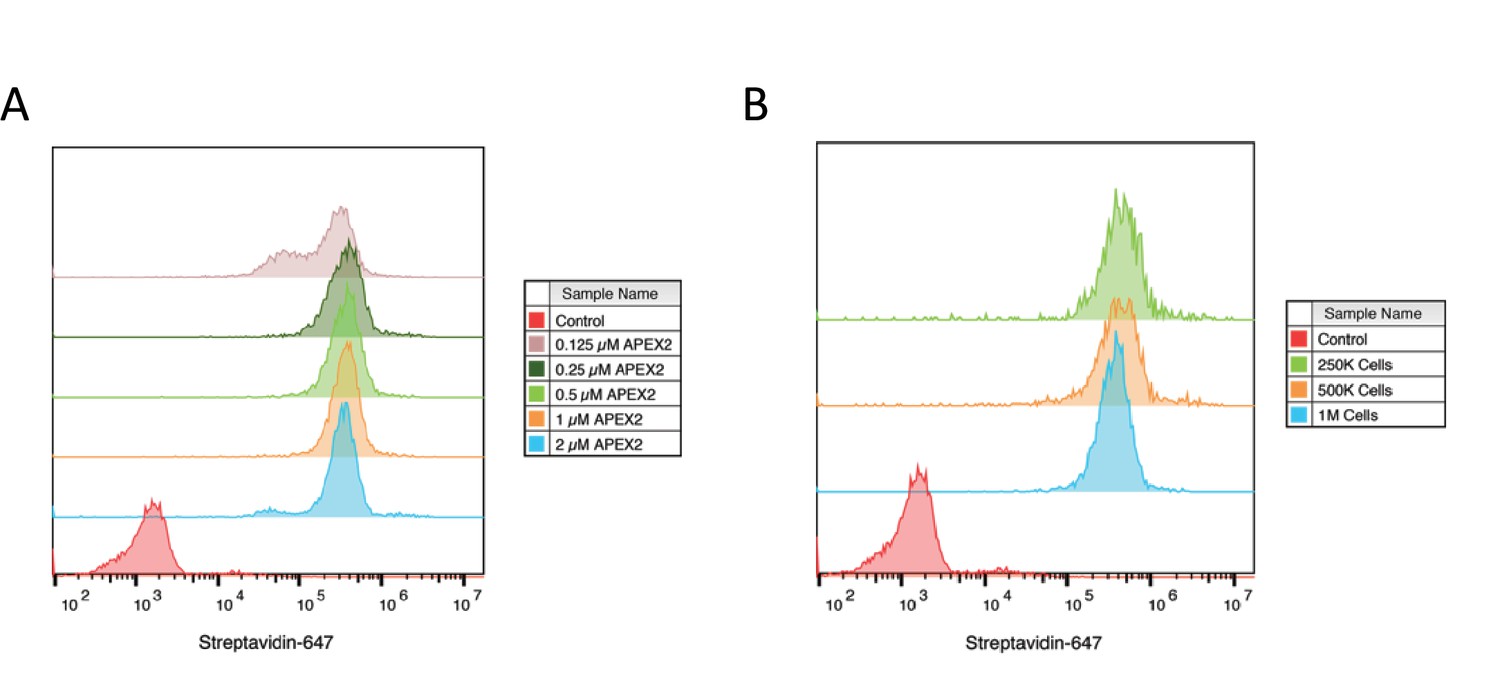
Optimization of APEX2 concentrations on cell by flow cytometry.
(A) 500,000 Expi293 cells were labeled for 2 min with increasing amounts of purified APEX2 enzyme and extent of labeling was quantified by flow cytometry staining with streptavidin-647. (B) Varying numbers of Expi293 cells were labeled for 2 min with 0.5 µM APEX2 to test range of cell numbers for labeling. Flow cytometry images are representative of one biological replicate.
Figure 2—figure supplement 2
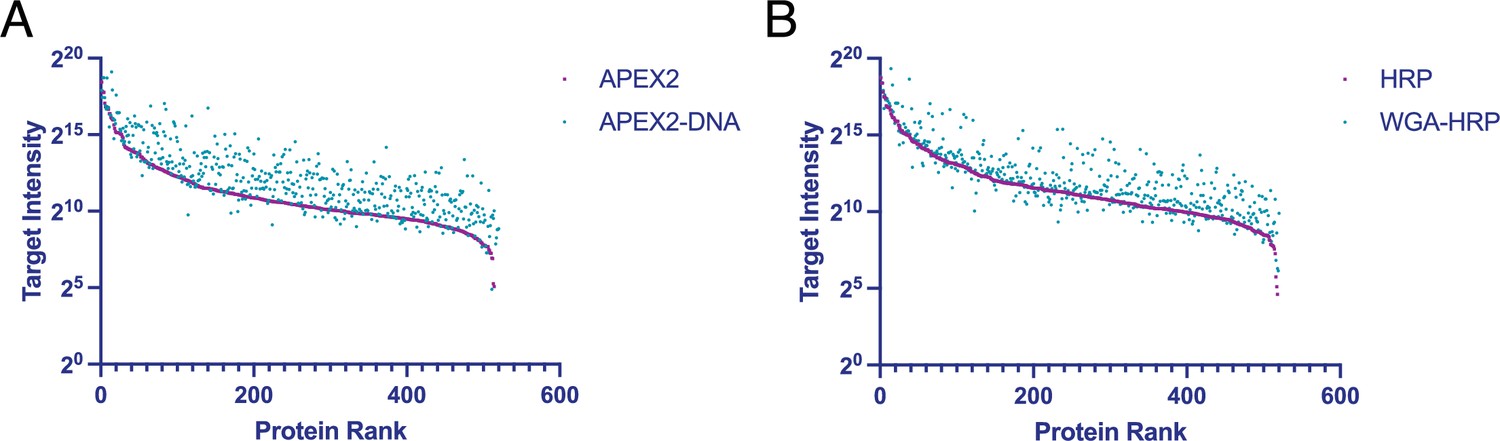
Rank ordered intensities for surface annotated proteins detected in tethered and untethered enzyme samples.
(A) A rank-ordered list of MS1 intensities (area) for surface annotated proteins found in APEX2 and DNA-APEX2 samples. (B) A rank-ordered list of MS1 intensities (area) for surface annotated proteins found in HRP and WGA-HRP samples. The average of two biological replicates is plotted.
Figure 2—figure supplement 3
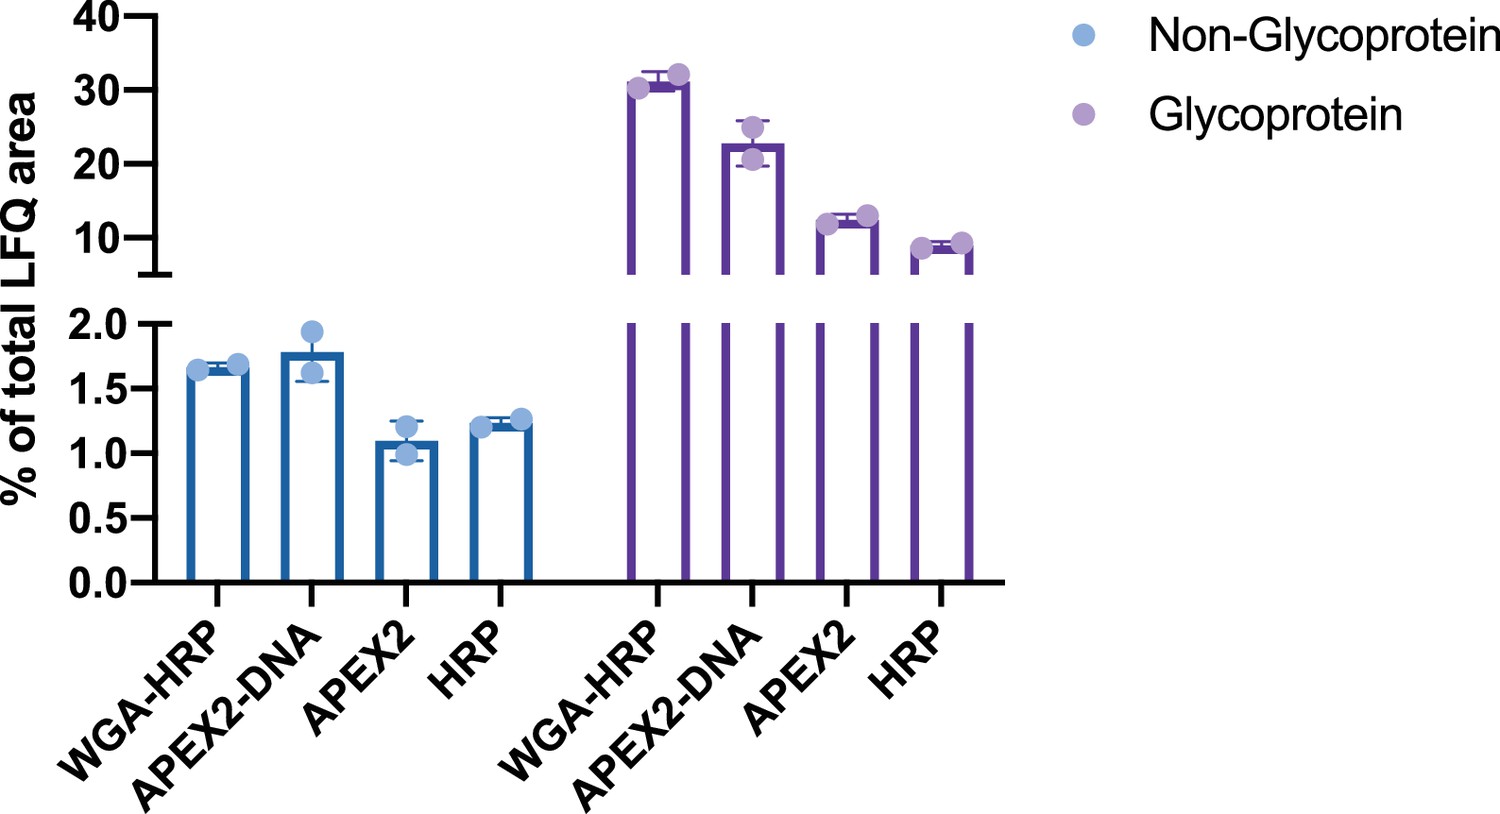
Comparison of enrichment for glycosylated and non-glycosylated proteins.
Total MS1 intensities (LFQ area) of Uniprot annotated glycoproteins compared to non-glycoproteins in the SURFY database for each labeling method compared to the total area sum intensity. LFQ, label-free quantification.
Figure 2—figure supplement 4
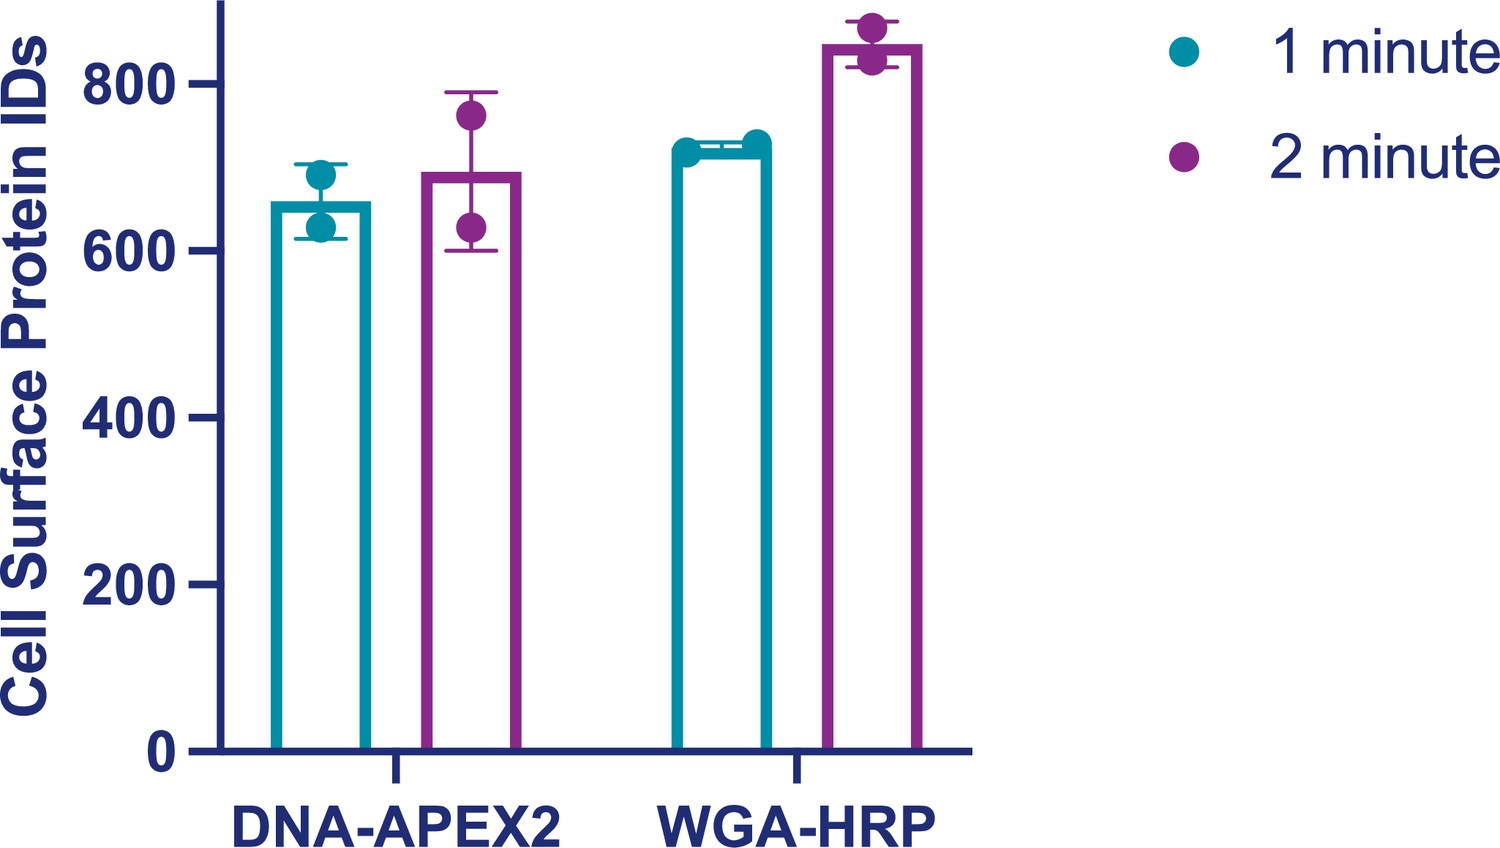
Total plasma membrane (PM) protein identifications for DNA-APEX2 and WGA-HRP labeling experiments as a function of time.
500,000 PaTu8902 pancreatic cancer cells were labeled with either 0.5 µM DNA-APEX2 or 0.5 µM WGA-HRP for 1 or 2 min at 37°C. After cell surface enrichment and mass spectrometry analysis, the PM-derived protein identifications were totaled. Two biological replicates are plotted.
-
Figure 2—figure supplement 4—source data 1
Mass spectrometry analysis results table.
- https://cdn.elifesciences.org/articles/73982/elife-73982-fig2-figsupp4-data1-v2.csv
Figure 2—figure supplement 5
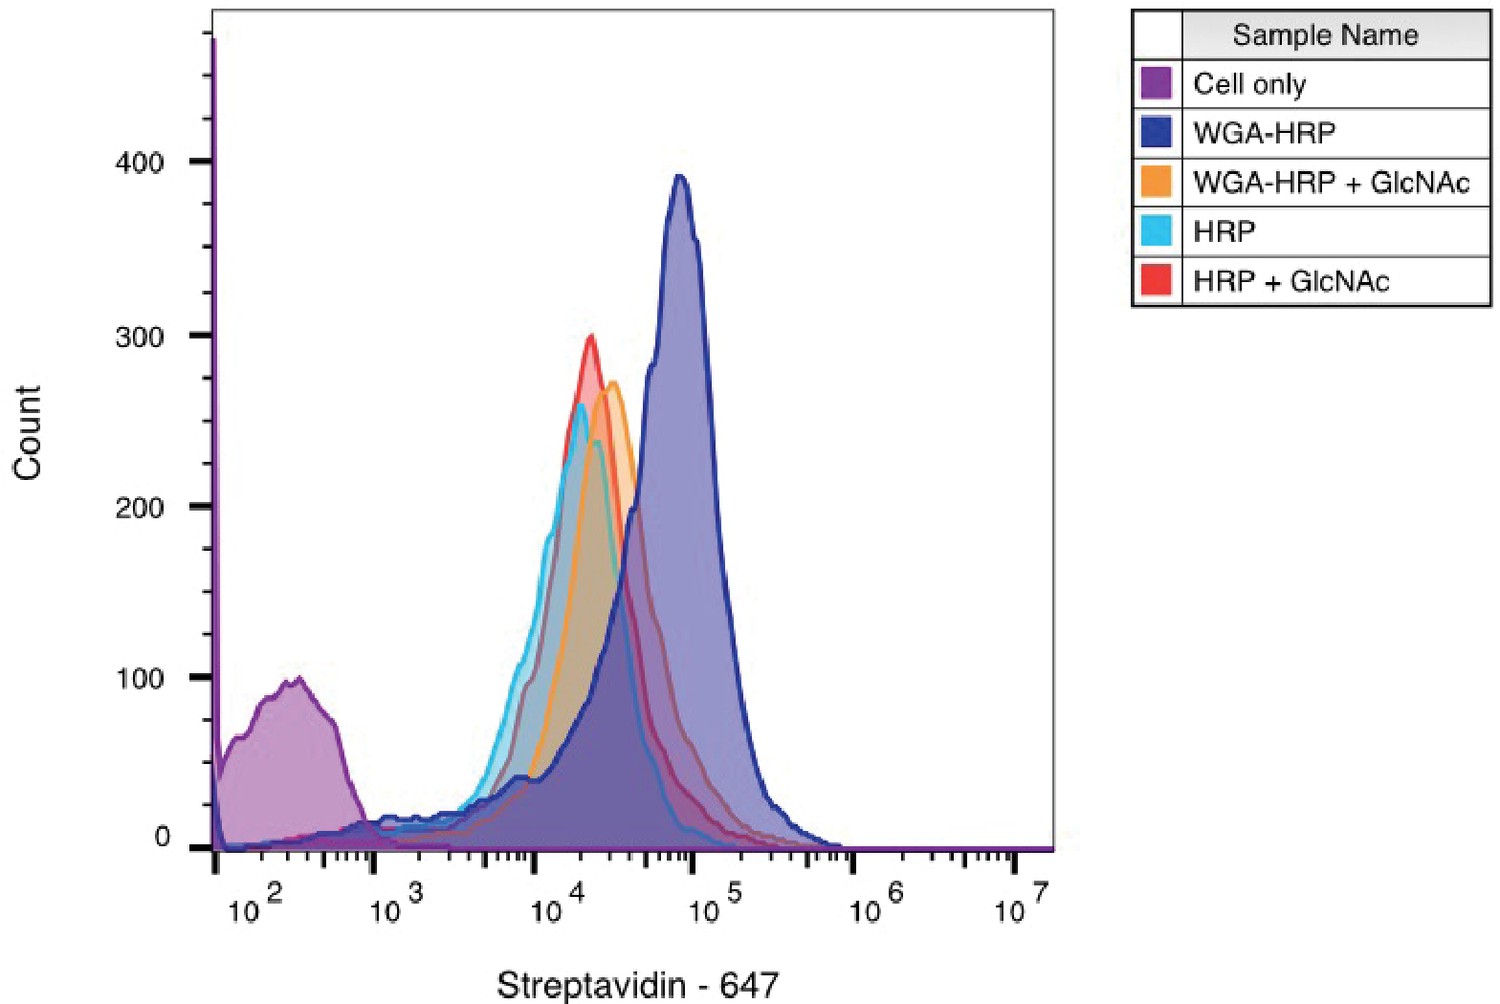
WGA-HRP labeling is N-acetyl-D-glucosamine (GlcNAc) dependent.
Biotinylation of RWPE-1 Myc cells with WGA-HRP was determined with (orange) and without (dark blue) 100 mg/ml GlcNAc. There is a significant leftward shift in the degree of labeling in the absence of competing GlcNAc, demonstrating that the enhanced labeling by WGA-HRP is GlcNAc dependent. The degree of labeling is similar to soluble HRP, as shown in light blue. Importantly, the presence of GlcNAc in solution did not generally affect HRP labeling as seen by the control in red. The data presented are from one biological replicate.
Figure 2—figure supplement 6
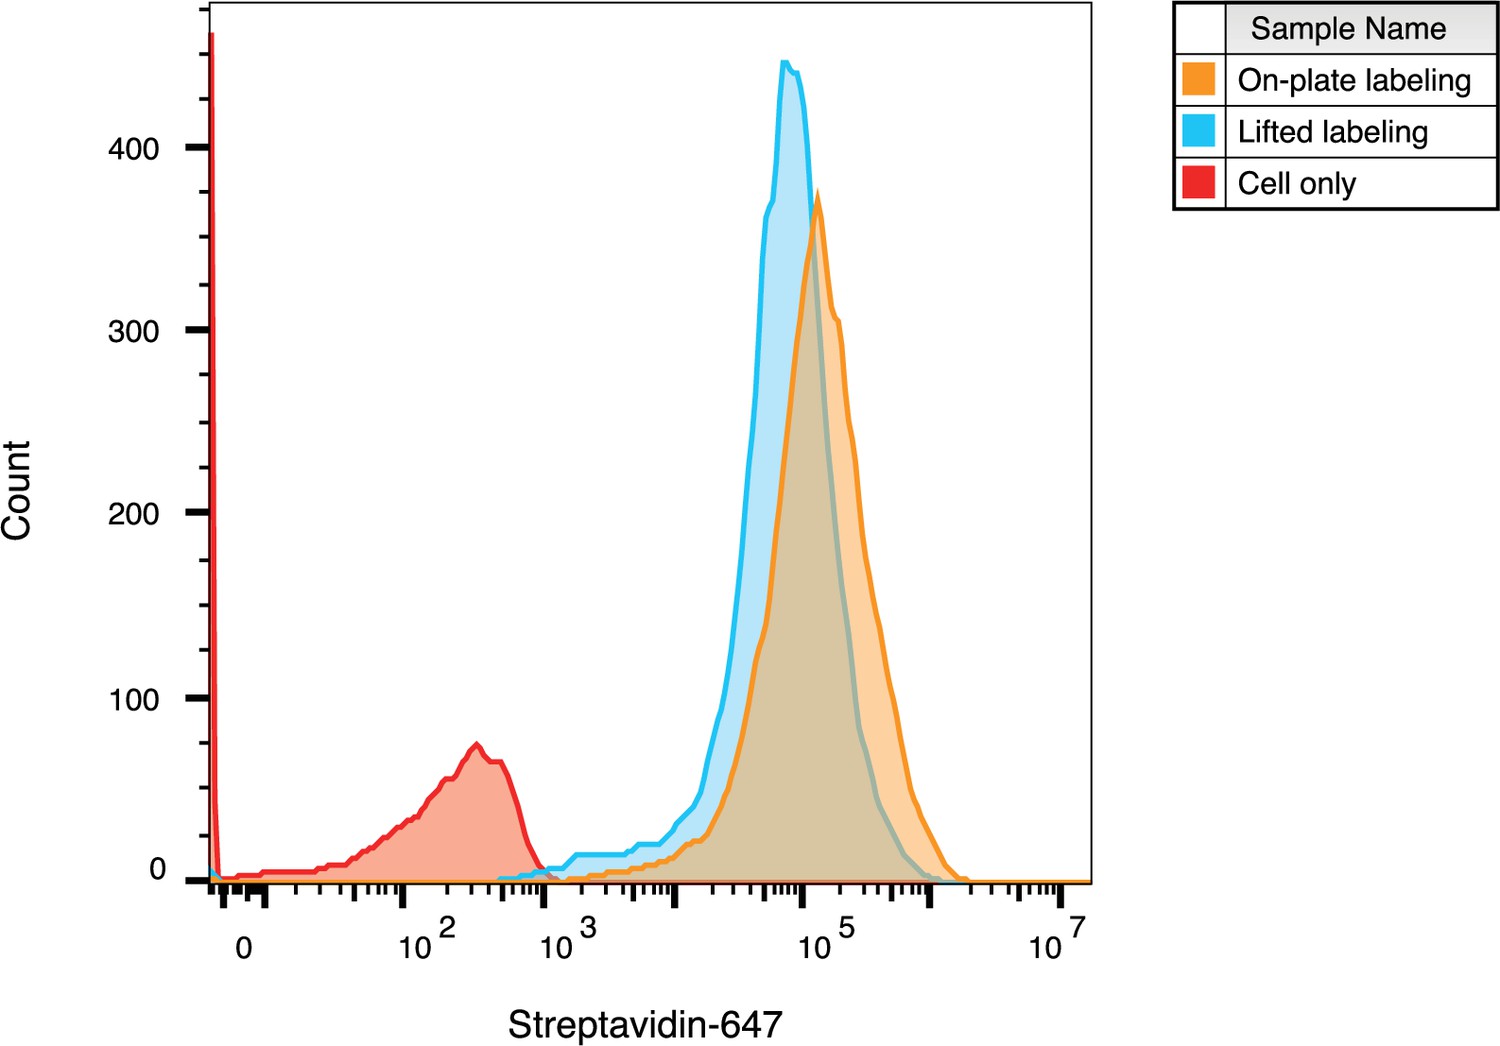
WGA-HRP can be used to label adherent cells on-plate.
Cell surface labeling was compared between labeling adherent cells on a tissue culture plate versus lifting cells and then performing labeling. Cell surface biotinylation was detected by streptavidin-Alexa Fluor 647. The data presented are from one biological replicate.
Figure 3 with 2 supplements
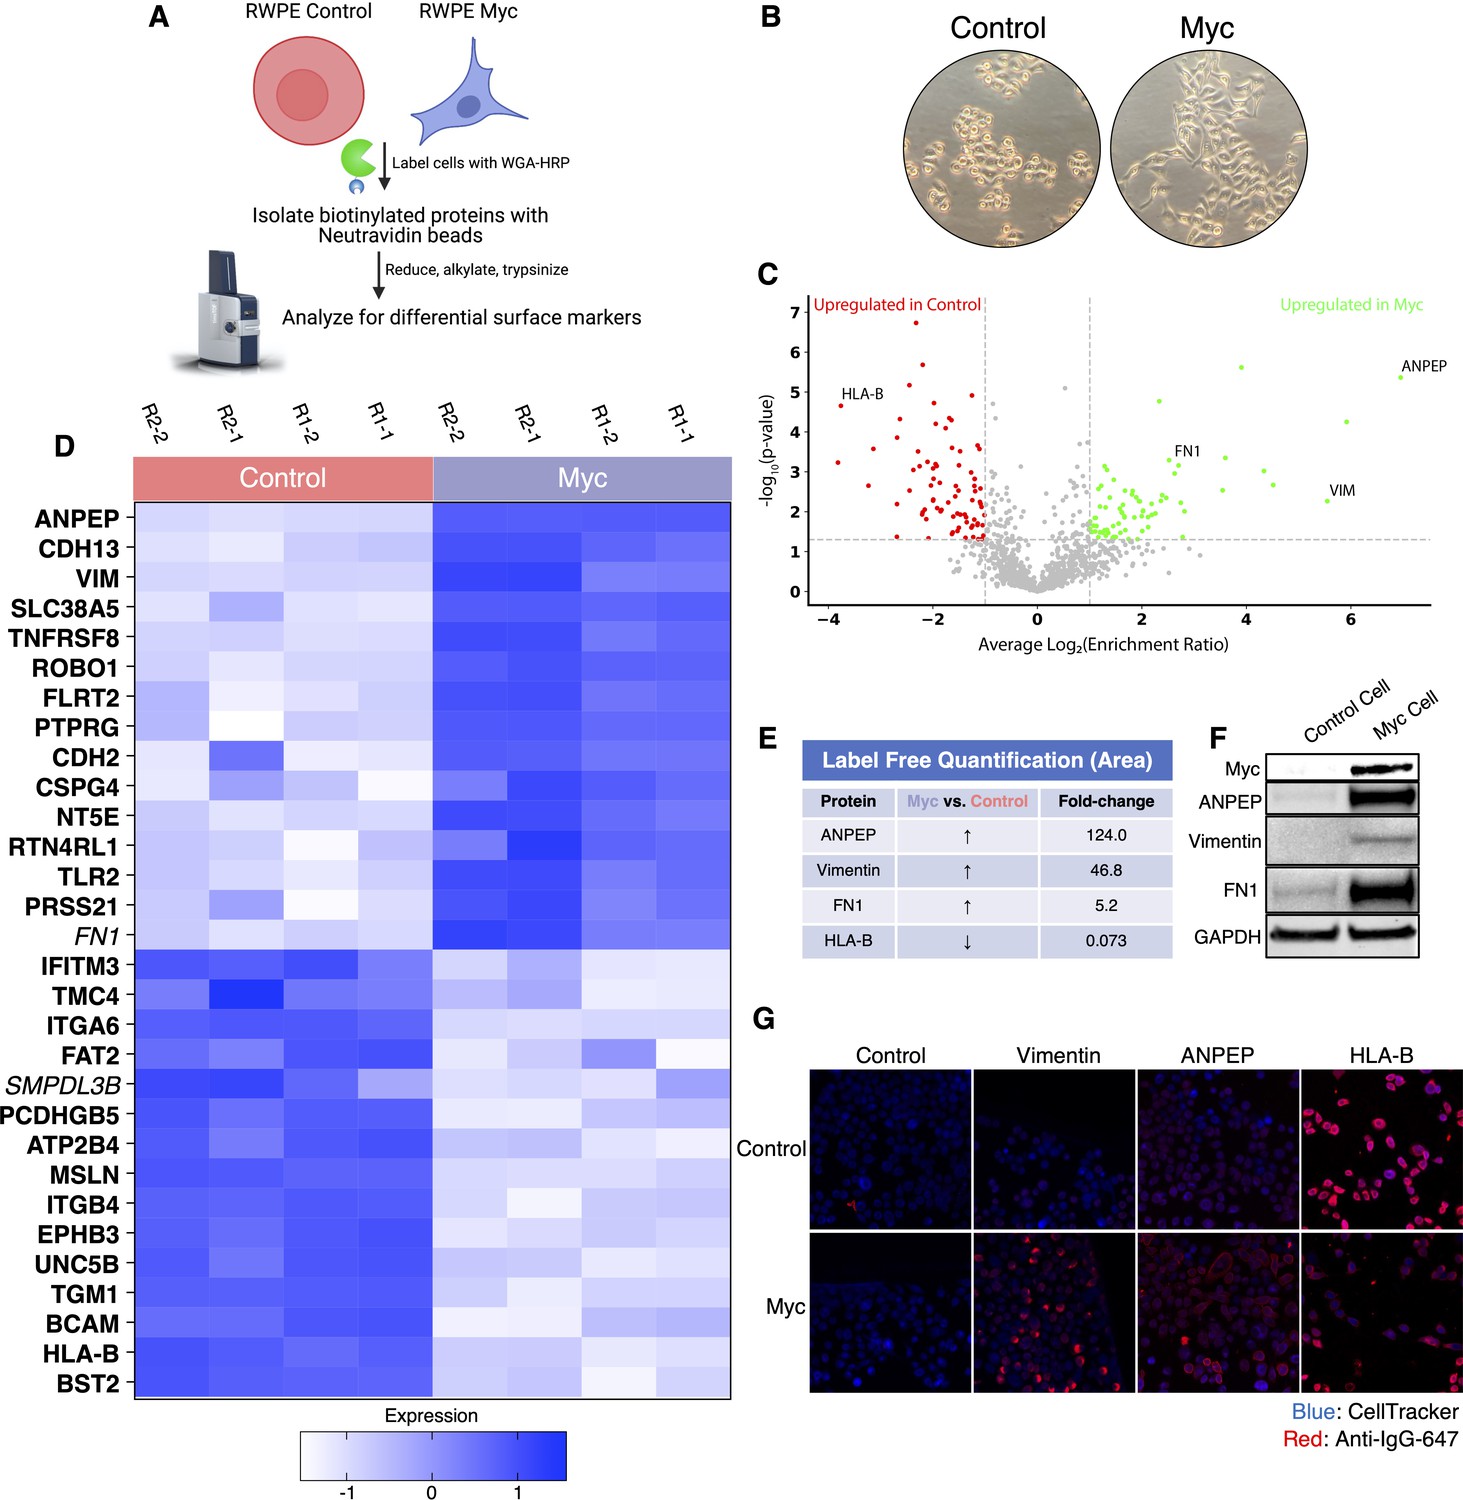
WGA-HRP identifies a number of enriched markers on Myc-driven prostate cancer cells.
(A) Overall scheme for biotin labeling, and label-free quantification (LFQ) by LC-MS/MS for RWPE-1 Control and Myc overexpression cells. (B) Microscopy image depicting morphological differences between RWPE-1 Control and RWPE-1 Myc cells after 3 days in culture. (C) Volcano plot depicting the LFQ comparison of RWPE-1 Control and Myc labeled cells. Red labels indicate upregulated proteins in the RWPE-1 Control cells over Myc cells and green labels indicate upregulated proteins in the RWPE-1 Myc cells over Control cells. All colored proteins are at least two-fold enriched in either dataset between four replicates (two technical, two biological, p<0.05). (D) Heatmap of the 30 most upregulated transmembrane (bold) or secreted (italics) proteins in either RWPE-1 Control or Myc cells. Scale indicates intensity, defined as (LFQ Area−Mean LFQ Area)/Standard Deviation. (E) Table indicating fold-change of most differentially regulated proteins by LC-MS/MS for RWPE-1 Control and Myc cells. (F) Upregulated proteins in RWPE-1 Myc cells (Myc, ANPEP, Vimentin, and FN1) are confirmed by western blot. (G) Upregulated surface proteins in RWPE-1 Myc cells (Vimentin, ANPEP, and FN1) are detected by immunofluorescence microscopy. The downregulated protein HLA-B by Myc overexpression was also detected by immunofluorescence microscopy. All western blot images and microscopy images are representative of two biological replicates. Mass spectrometry data is based on two biological and two technical replicates (N=4).
-
Figure 3—source data 1
Uncropped western blots.
- https://cdn.elifesciences.org/articles/73982/elife-73982-fig3-data1-v2.png
-
Figure 3—source data 2
Mass spectrometry analysis results table.
- https://cdn.elifesciences.org/articles/73982/elife-73982-fig3-data2-v2.xlsx
-
Figure 3—source data 3
List of proteins comparing enriched targets (>2-fold) in Myc cells versus Control cells.
- https://cdn.elifesciences.org/articles/73982/elife-73982-fig3-data3-v2.xlsx
Figure 3—figure supplement 1
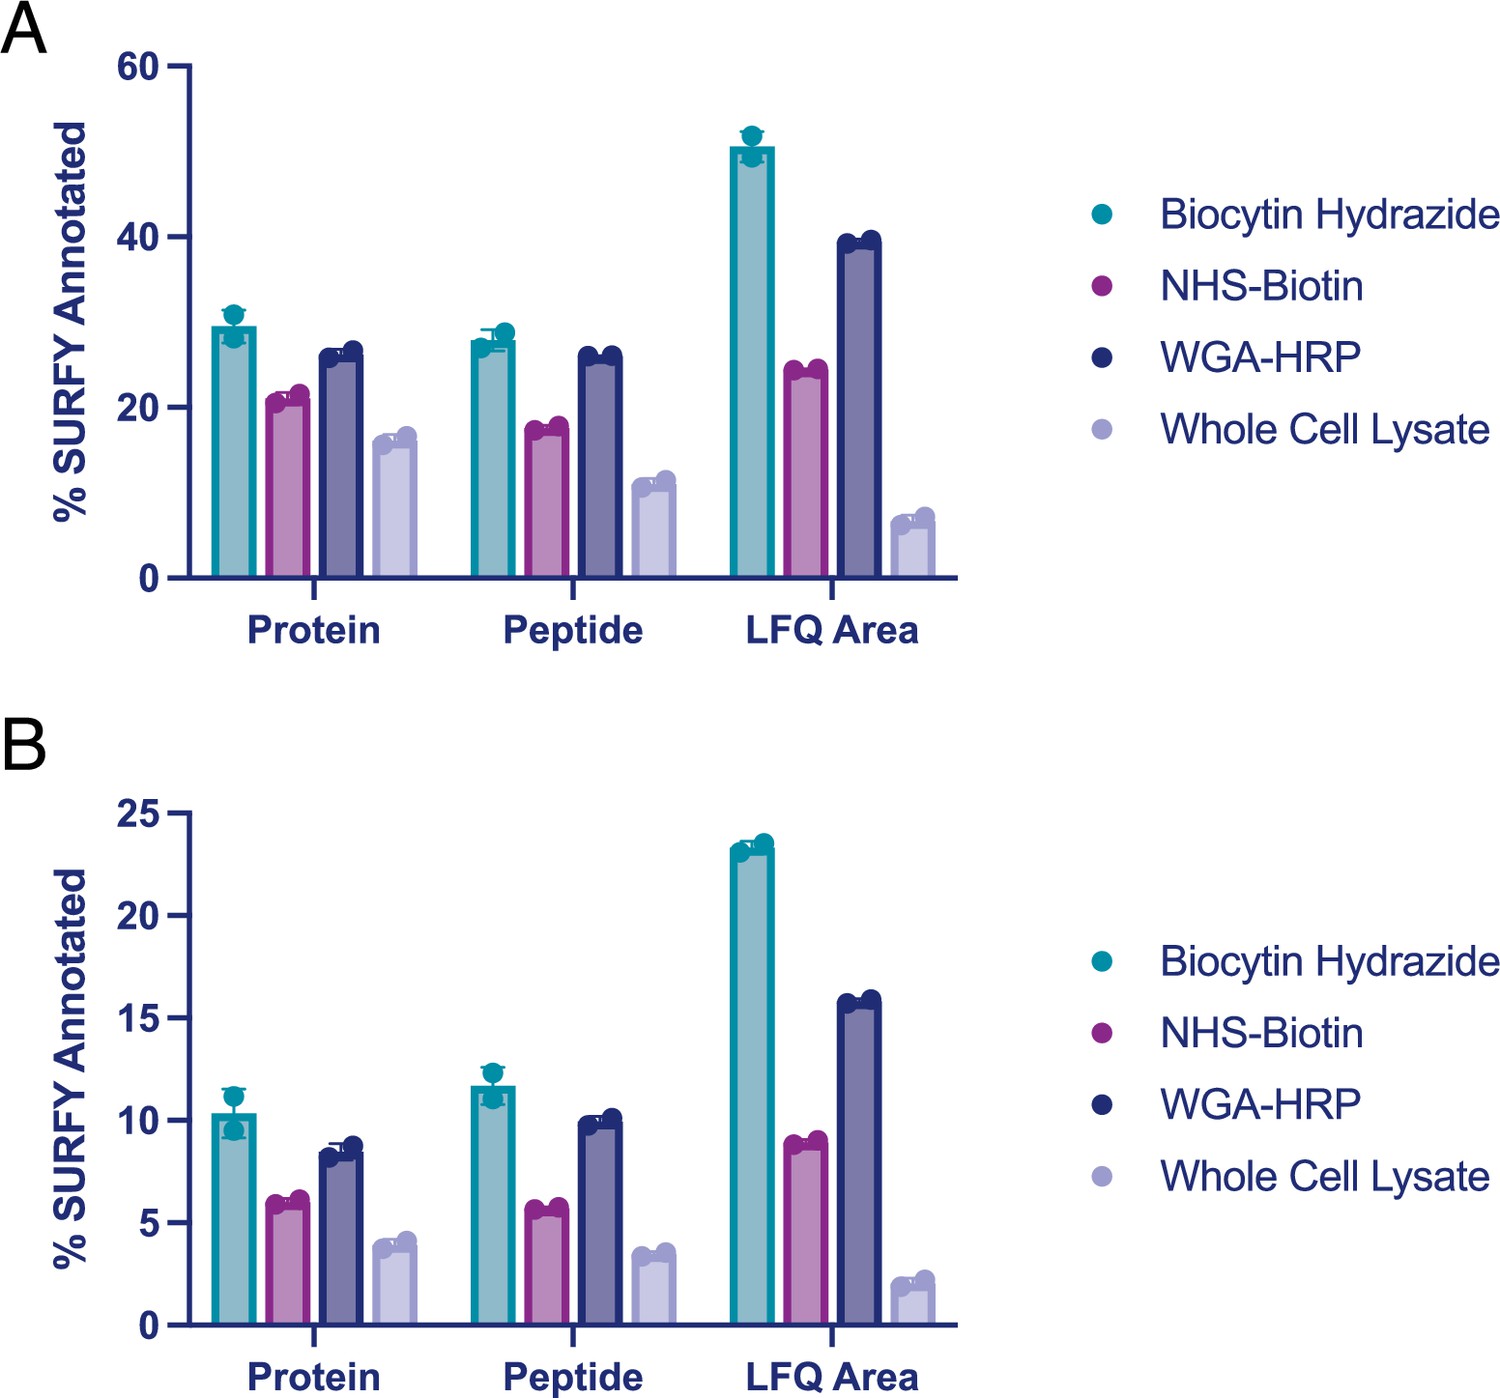
Comparison of surface enrichment between replicates for different mass spectrometry methods.
(A) The top three methods (NHS-Biotin, Biocytin Hydrazide, and WGA-HRP) were compared for their ability to enrich cell surface proteins on 1.5 M RWPE-1 Control cells by LC-MS/MS after being searched with the Uniprot GOCC Plasma Membrane database. Shown are enrichment levels on the protein, peptide, and average MS1 intensity of top three peptides (LFQ area) levels. (B) The top three methods (NHS-Biotin, Biocytin Hydrazide, and WGA-HRP) were compared for their ability to enrich cell surface proteins on 1.5 M RWPE-1 Control cells by LC-MS/MS after being searched with the entire human Uniprot database. Shown are enrichment levels on the protein, peptide, and average MS1 intensity of top three peptides (LFQ area) levels. Proteins or peptides detected from cell surface annotated proteins (determined by the SURFY database) were divided by the total number of proteins or peptides detected. LFQ areas corresponding to cell surface annotated proteins (SURFY) were divided by the total area sum intensity for each sample. The corresponding percentages for two biological replicates were plotted. LFQ, label-free quantification.
-
Figure 3—figure supplement 1—source data 1
Mass spectrometry analysis results.
- https://cdn.elifesciences.org/articles/73982/elife-73982-fig3-figsupp1-data1-v2.csv
Figure 3—figure supplement 2
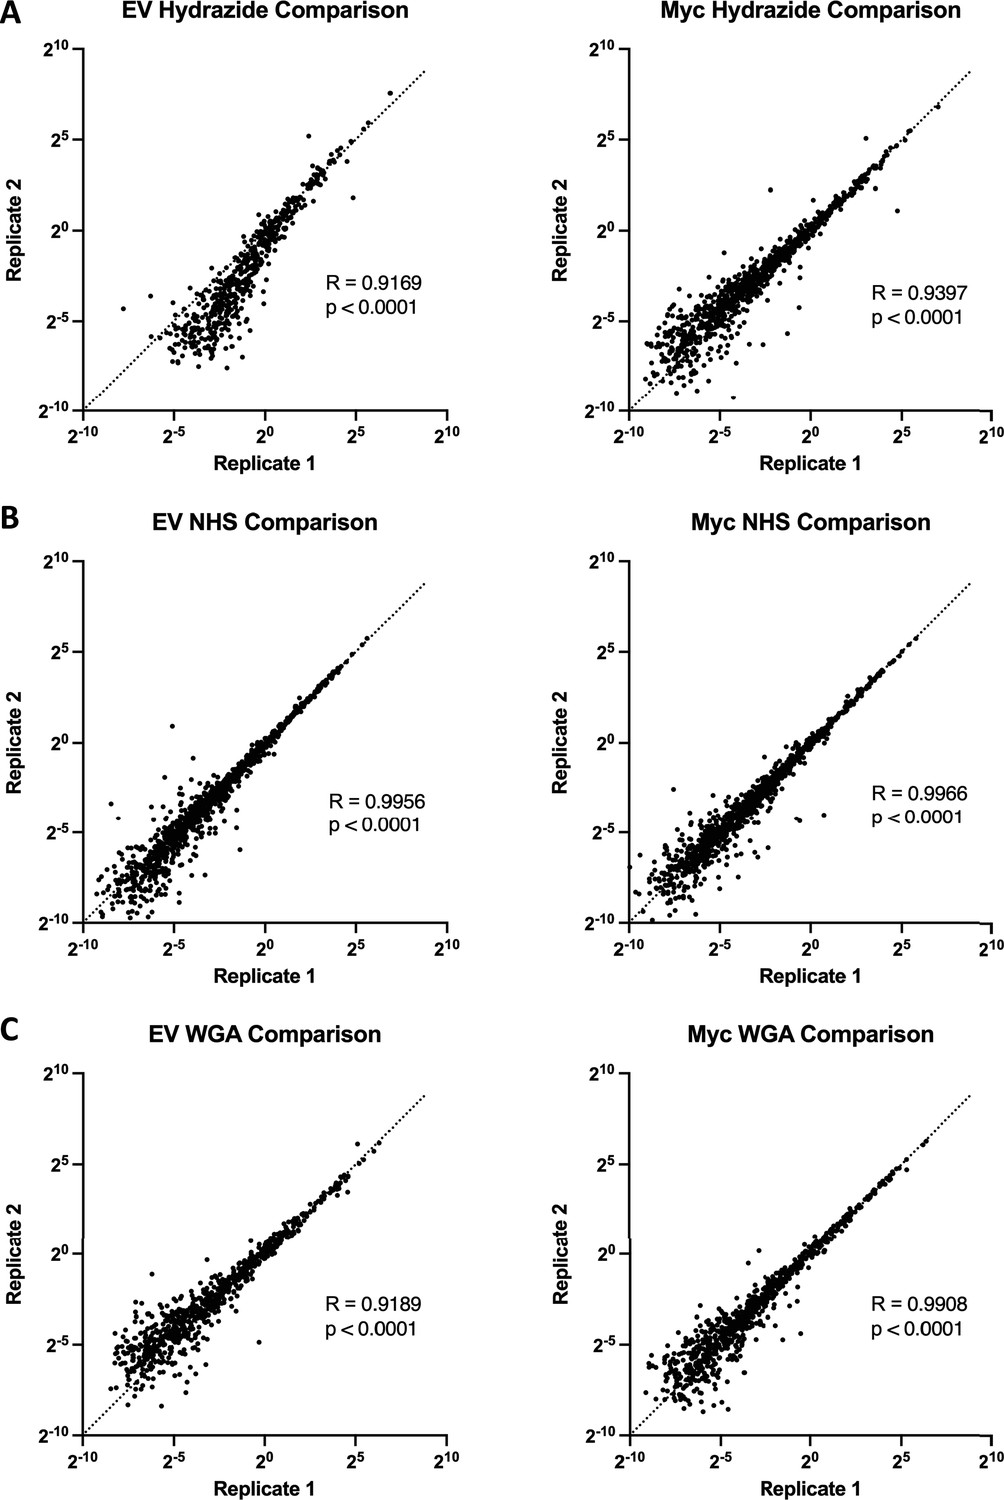
Comparison of replicates for different mass spectrometry methods shows that WGA-HRP has comparable reproducibility to NHS-Biotin and Hydrazide labeling.
(A) Spearman correlations of total area sum intensity normalized data from replicates of Hydrazide Control and Myc cells. (B) Spearman correlations of total area sum intensity normalized data from replicates of NHS Control and Myc cells. (C) Spearman correlations of total area sum intensity normalized data from replicates of WGA Control and Myc cells.
Figure 4 with 1 supplement

WGA-HRP identifies a number of enriched markers on Myc-driven prostate cancer EVs.
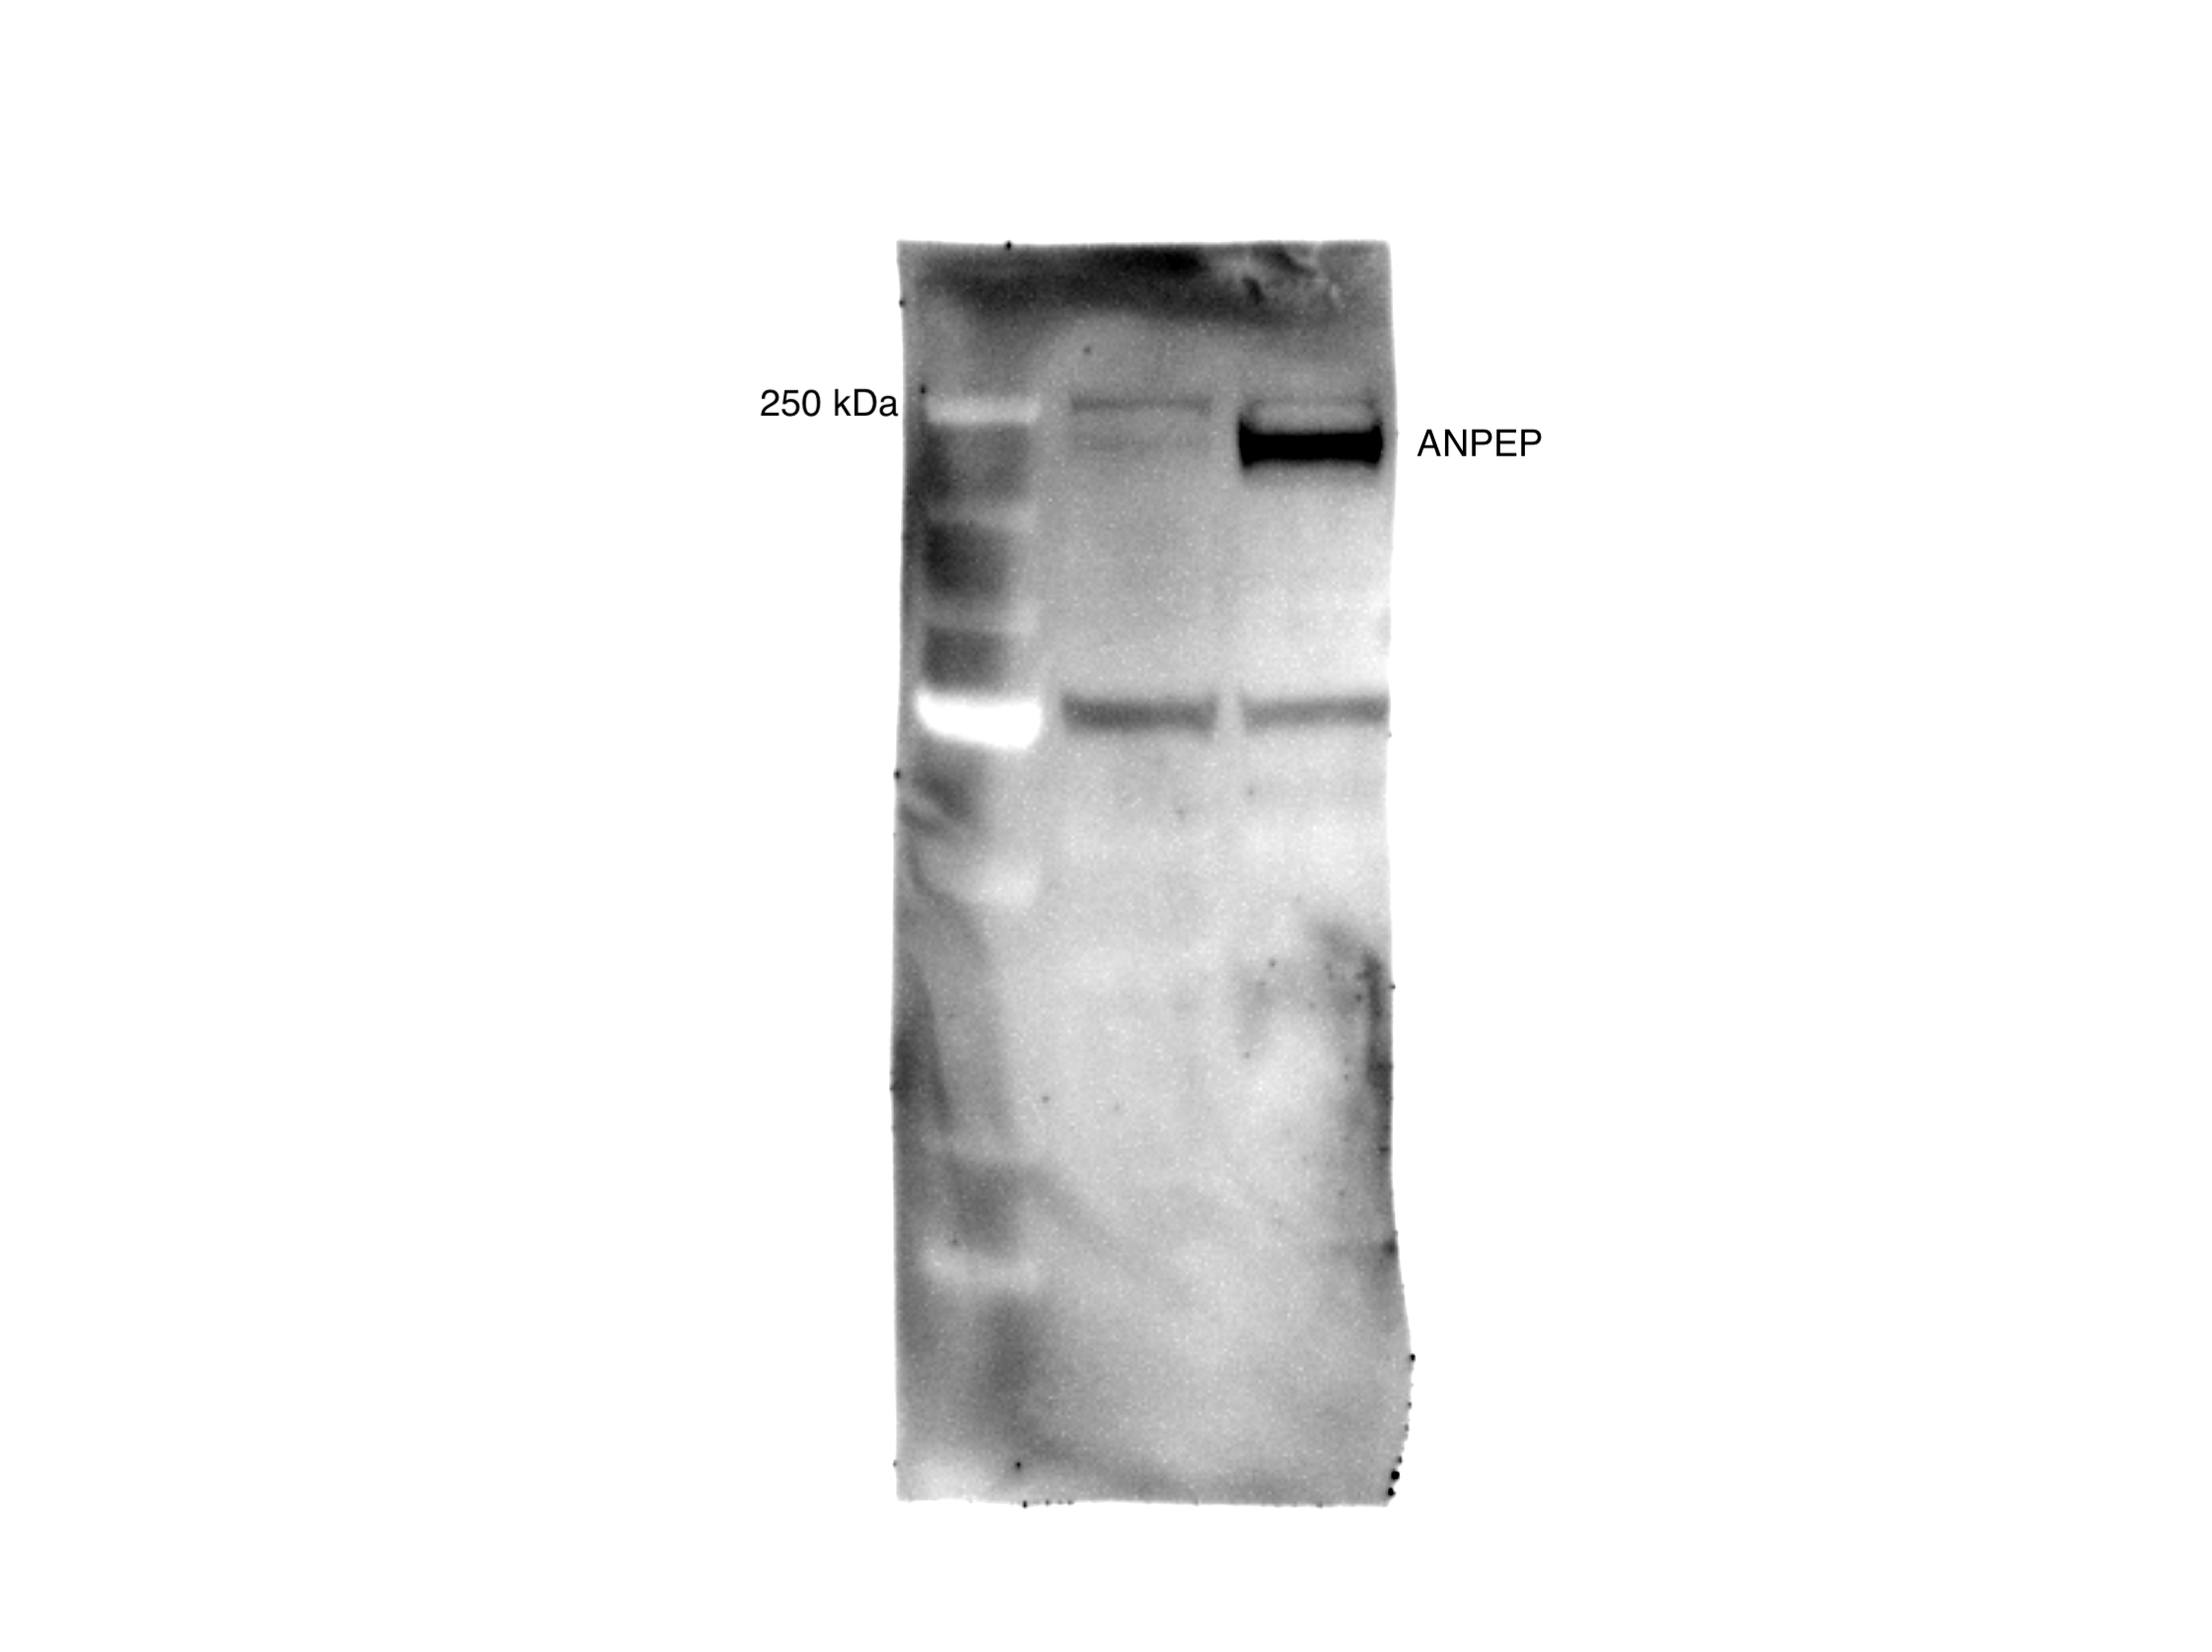
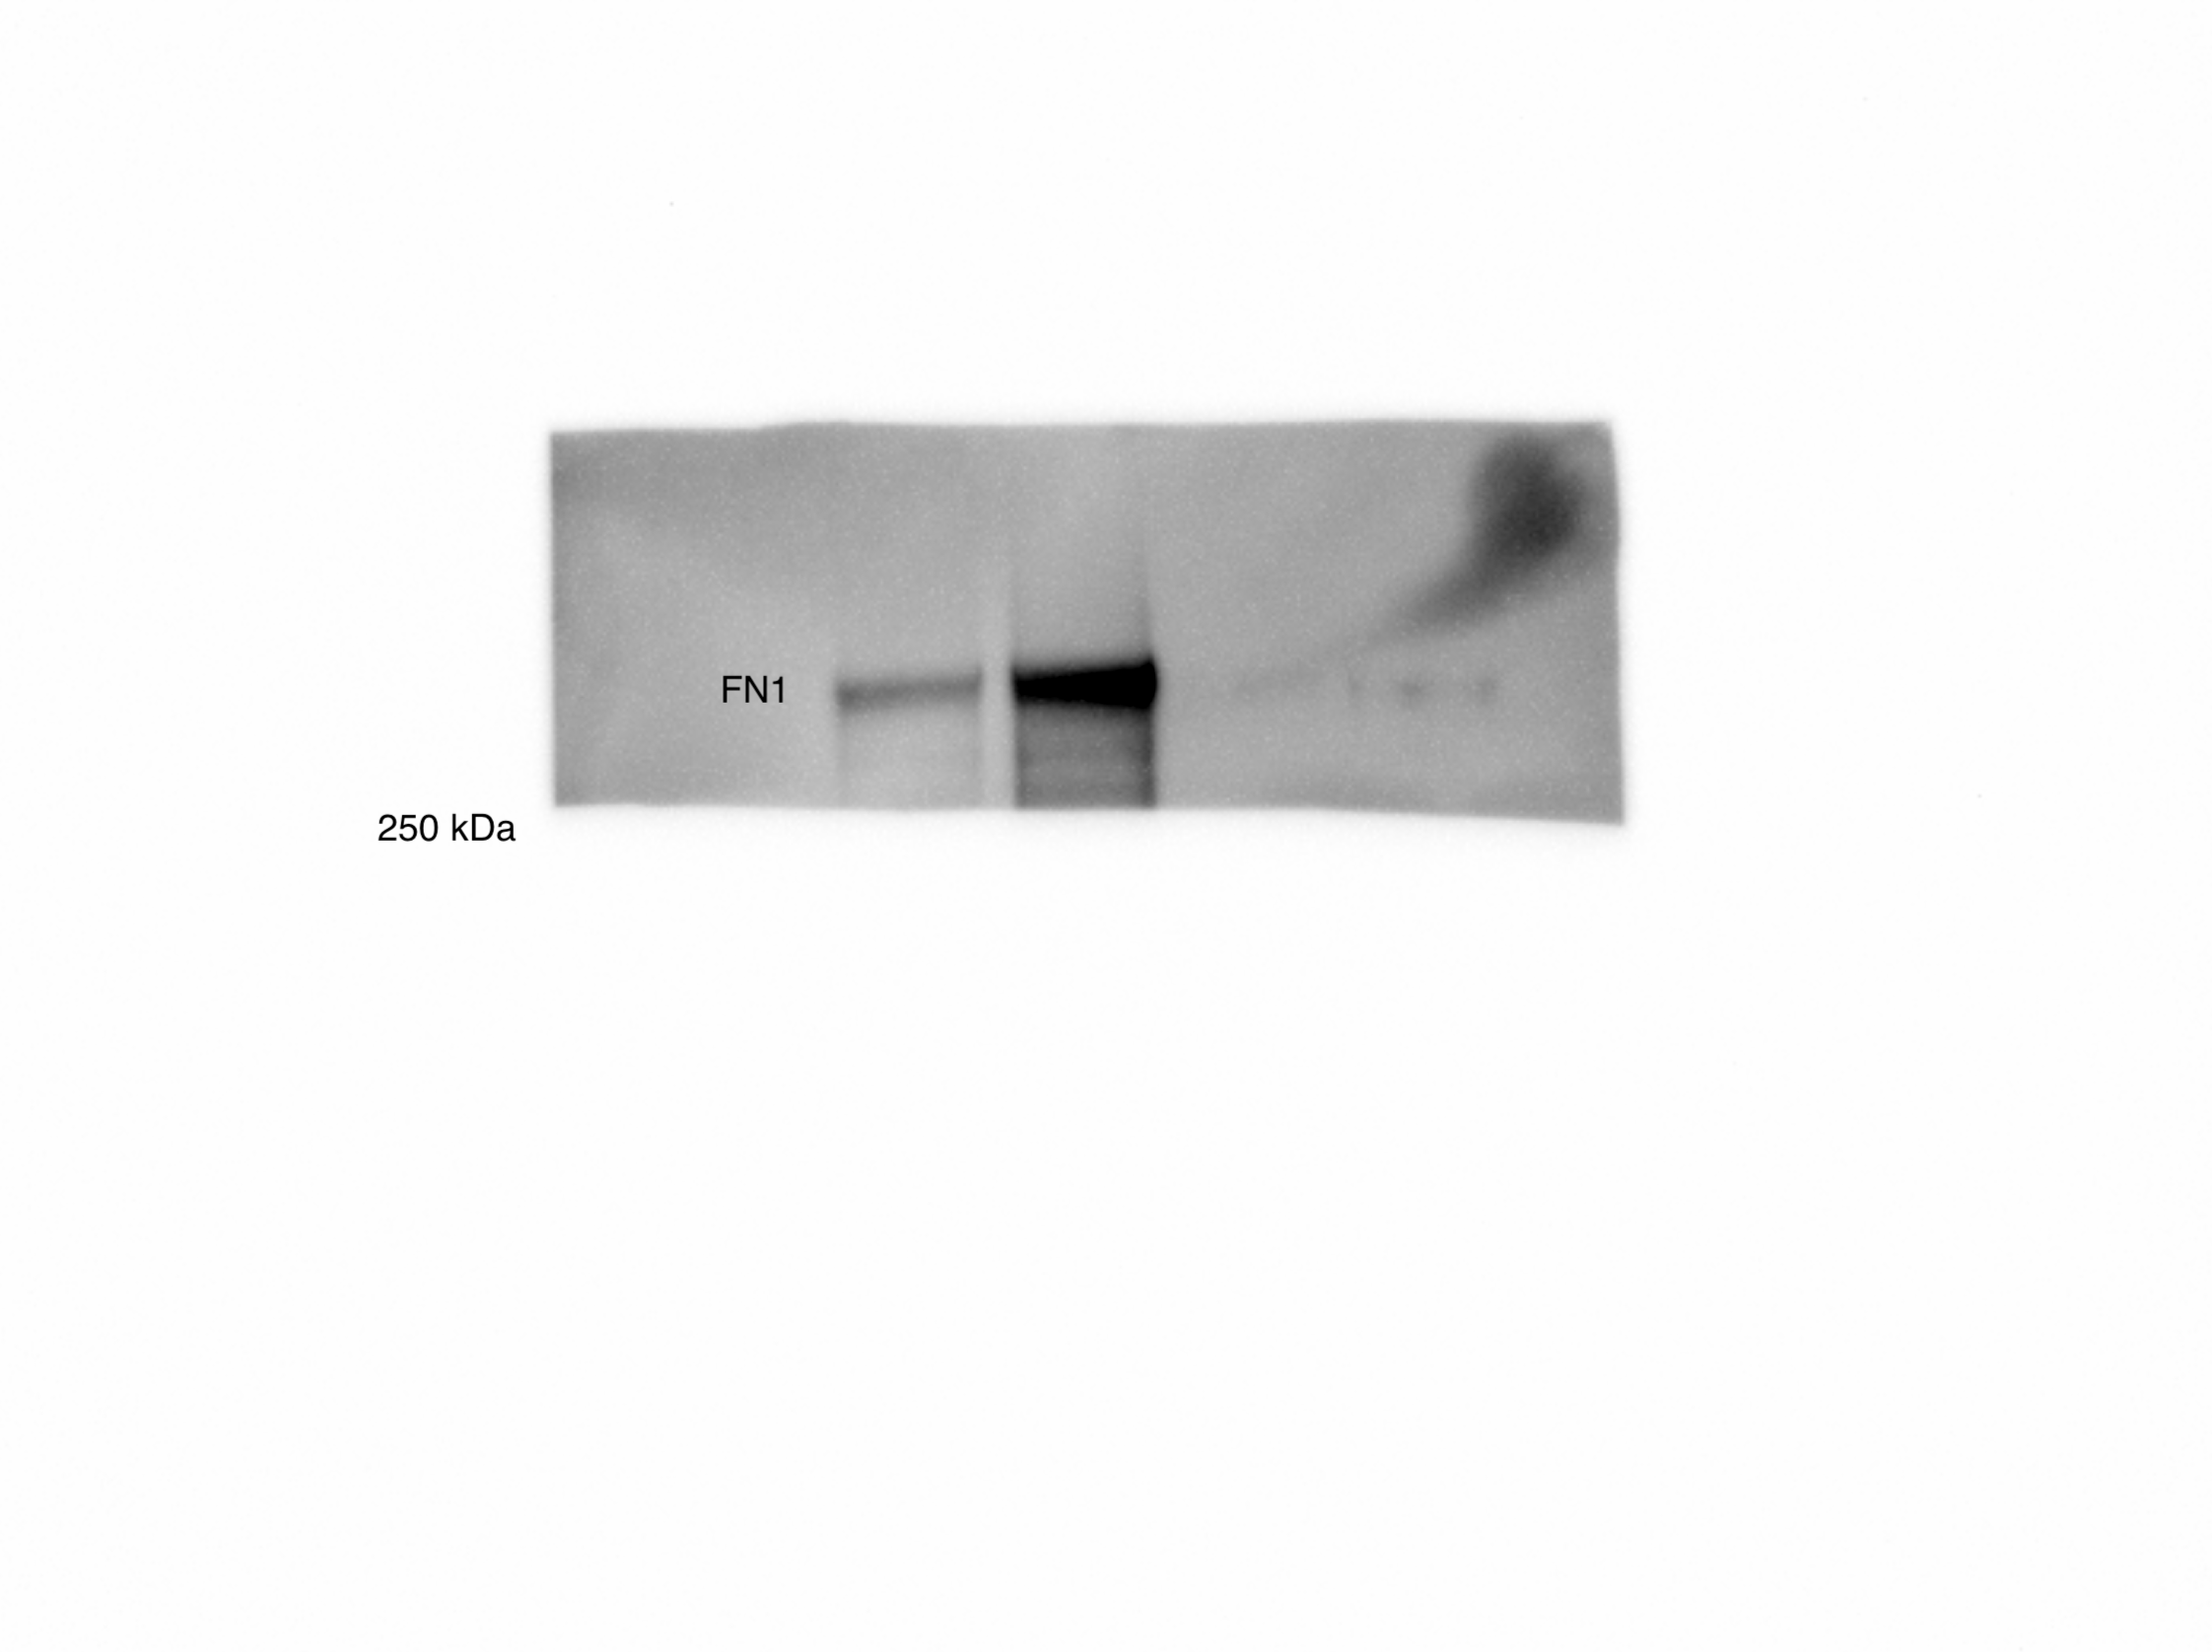
(A) Workflow for small EV isolation from cultured cells. (B) Labeled proteins indicating canonical exosome markers (ExoCarta Top 100 List) detected after performing label-free quantification (LFQ) from whole EV lysate. The LFQ intensities were averaged for Control and Myc EVs, and the resulting protein list is graphed from least abundant to most abundant. (C) Workflow of EV labeling and preparation for mass spectrometry. (D) Heatmap of the 30 most upregulated proteins in either RWPE-1 Control or Myc EVs. Scale indicates intensity, defined as (LFQ Area−Mean LFQ Area)/Standard Deviation. (E) Table indicating fold-change of most differentially regulated proteins by LC-MS/MS for RWPE-1 Control and Myc cells. (F) Upregulated proteins in RWPE-1 Myc EVs (ANPEP and FN1) are confirmed by western blot. Mass spectrometry data is based on two biological and two technical replicates (N=4). Due to limited sample yield, one replicate was performed for the EV western blot. EV, extracellular vesicle.
-
Figure 4—source data 1
Uncropped western blots.
- https://cdn.elifesciences.org/articles/73982/elife-73982-fig4-data1-v2.png
-
Figure 4—source data 2
Whole EV mass spectrometry analysis results table.
- https://cdn.elifesciences.org/articles/73982/elife-73982-fig4-data2-v2.xlsx
-
Figure 4—source data 3
Mass spectrometry analysis results table.
- https://cdn.elifesciences.org/articles/73982/elife-73982-fig4-data3-v2.xlsx
-
Figure 4—source data 4
List of proteins comparing enriched targets (>1.5-fold) in Myc EVs versus Control EVs.
- https://cdn.elifesciences.org/articles/73982/elife-73982-fig4-data4-v2.xlsx
Figure 4—figure supplement 1
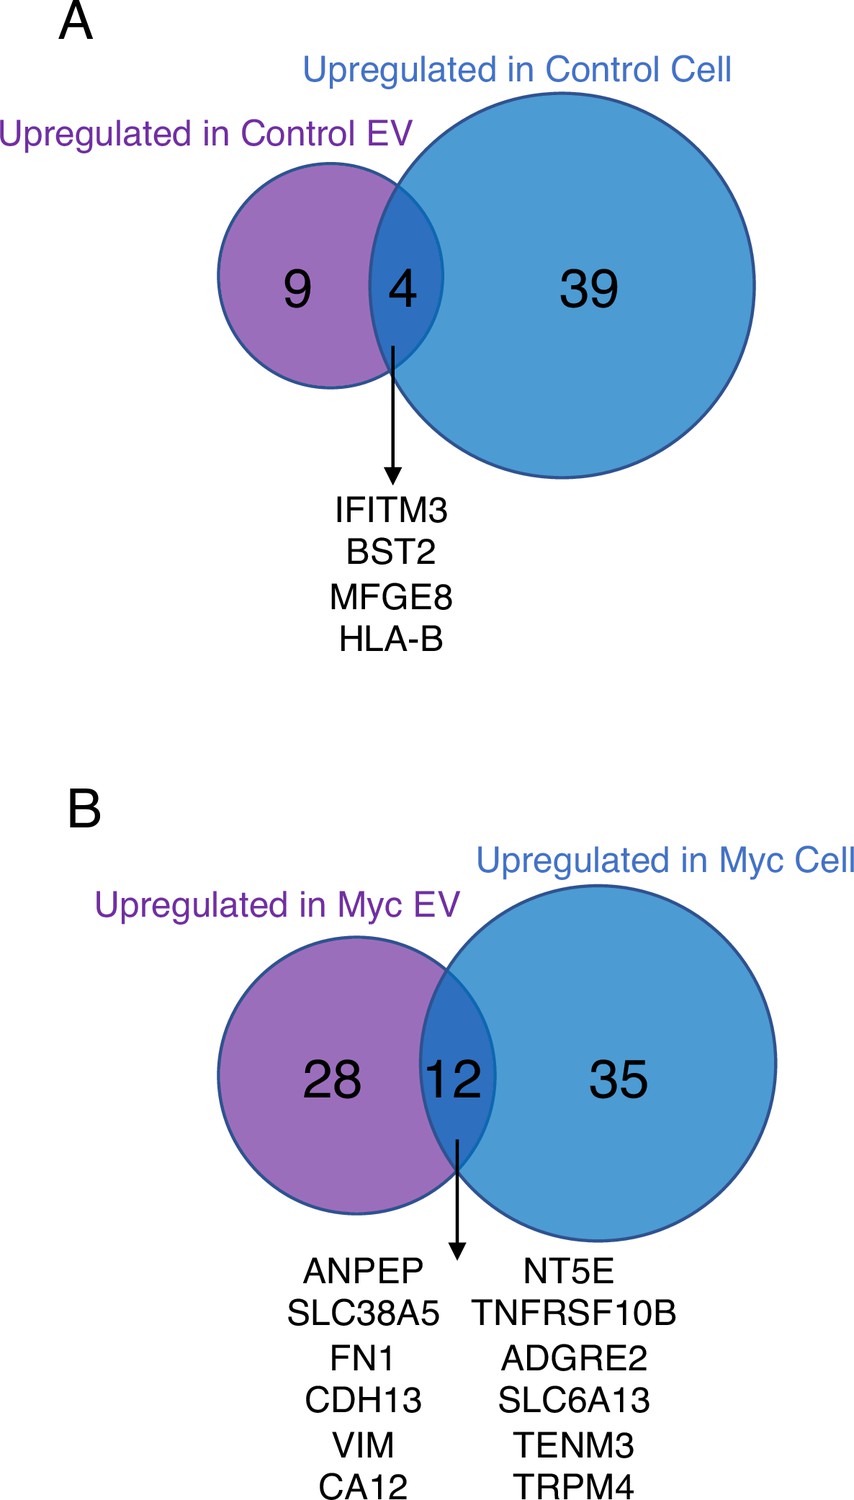
Venn diagram comparing enriched targets (>2-fold) in cells and EVs.
(A) Surface and secreted targets were found enriched in the Control EVs (purple) and Control cells (blue) when each is separately compared to Myc EVs and Myc cells, respectively. The four overlapping enriched targets in common between Control cells and Control EVs are listed in the center. (B) Surface and secreted targets were found enriched in the Myc EVs (purple) and Myc cells (blue) when each is separately compared to Control EVs and Control cells, respectively. The 12 overlapping enriched targets in common between Myc cells and Myc EVs are listed in the center.
Figure 5 with 1 supplement
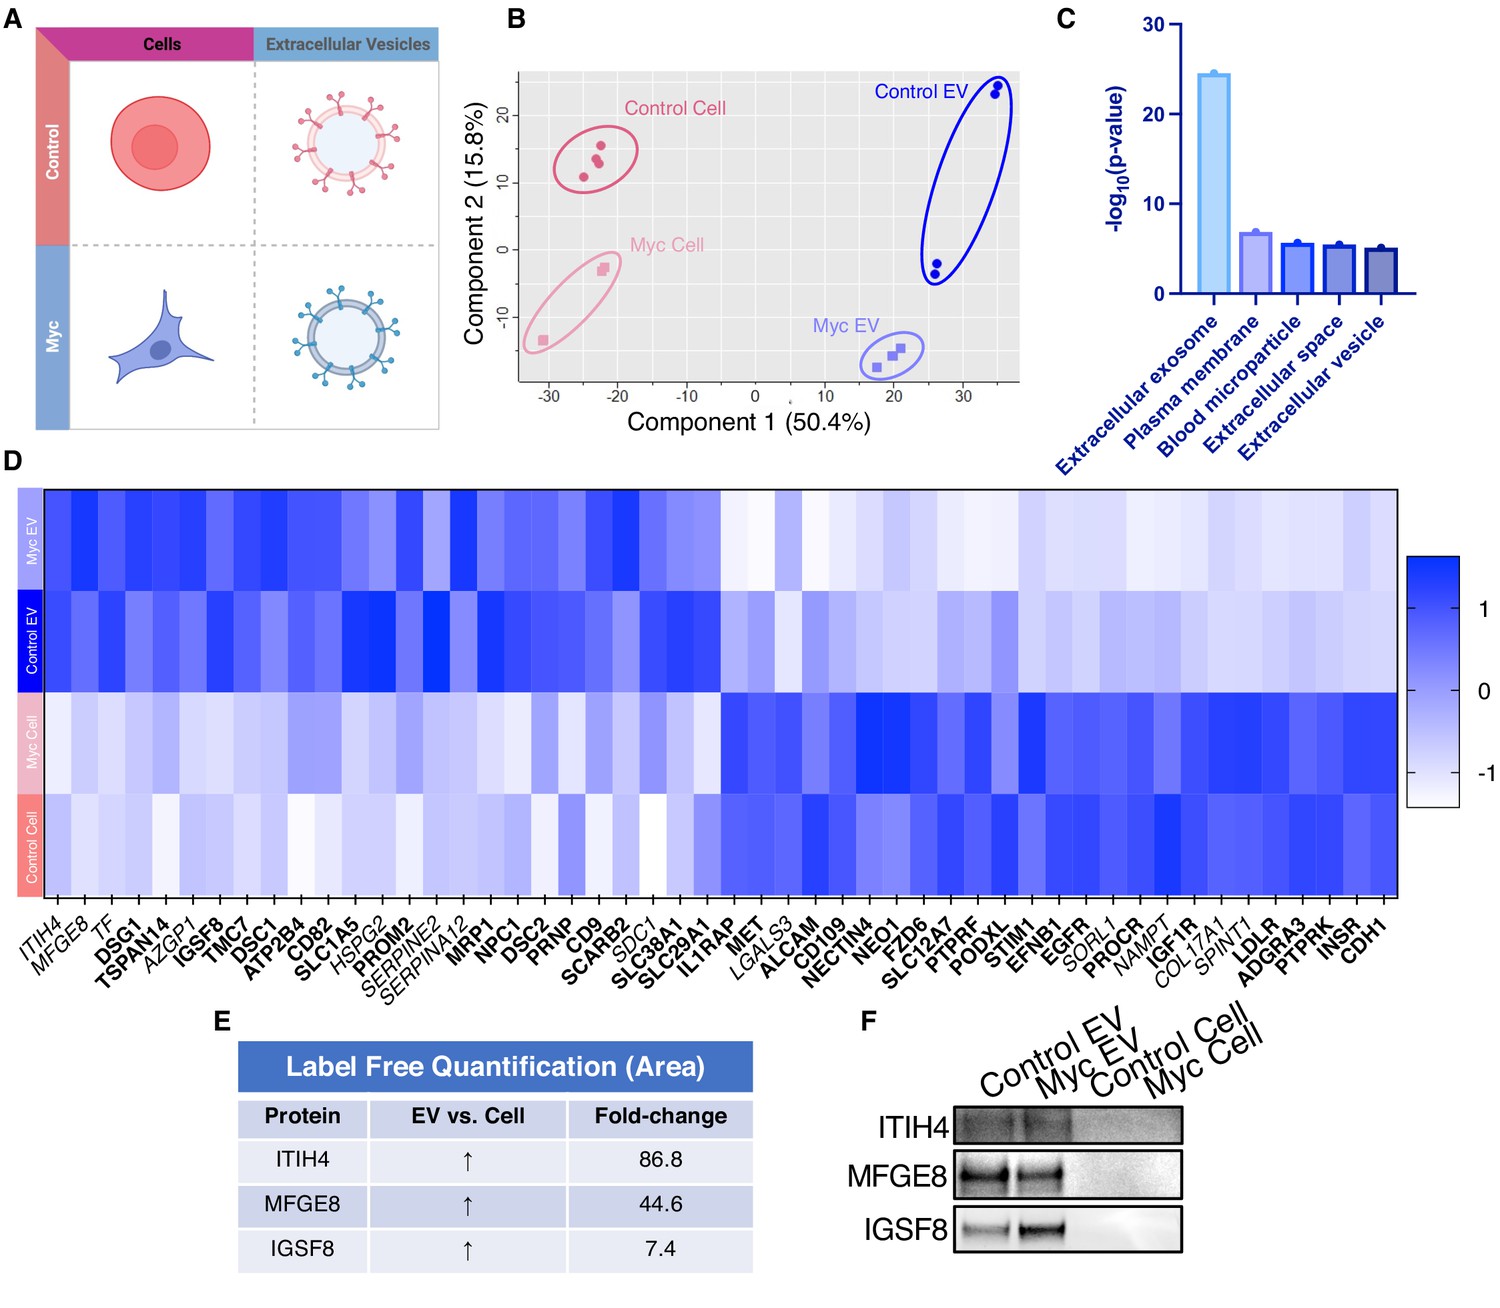
WGA-HRP identifies a number of EV-specific markers that are present regardless of oncogene status.
(A) Matrix depicting samples analyzed during LFQ comparison–Control and Myc cells, as well as Control and Myc EVs. (B) Principle component analysis (PCA) of all four groups analyzed by LFQ. Component 1 (50.4%) and component 2 (15.8%) are graphed. (C) Functional annotation was performed for each gene cluster using DAVID Bioinformatics Resource 6.8 and the highest ranking annotation features for the EV-specific gene cluster are shown. (D) Heatmap of the 50 most upregulated proteins in either RWPE-1 cells or EVs. Proteins are listed in decreasing order of expression with the most highly expressed proteins in EVs on the far left and the most highly expressed proteins in cells on the far right. Averages from all four replicates of each sample type are graphed. Scale indicates intensity, defined as (LFQ Area−Mean LFQ Area)/Standard Deviation. Extracellular proteins with annotated transmembrane domains are bolded and annotated secreted proteins are italicized. (E) Table indicating fold-change of most differentially regulated proteins by LC-MS/MS for RWPE-1 EVs compared to parent cells. (F) Western blot showing the EV-specific marker ITIH4, IGSF8, and MFGE8. Mass spectrometry data is based on two biological and two technical replicates (N=4). Due to limited sample yield, one replicate was performed for the EV western blot. EV, extracellular vesicle; LFQ, label-free quantification.
-
Figure 5—source data 1
Uncropped western blots.
- https://cdn.elifesciences.org/articles/73982/elife-73982-fig5-data1-v2.png
-
Figure 5—source data 2
Mass spectrometry analysis results table.
- https://cdn.elifesciences.org/articles/73982/elife-73982-fig5-data2-v2.xlsx
-
Figure 5—source data 3
List of proteins comparing enriched targets (>2-fold) in Control EVs versus Control cells and Myc EVs versus Myc cells.
- https://cdn.elifesciences.org/articles/73982/elife-73982-fig5-data3-v2.xlsx
Figure 5—figure supplement 1
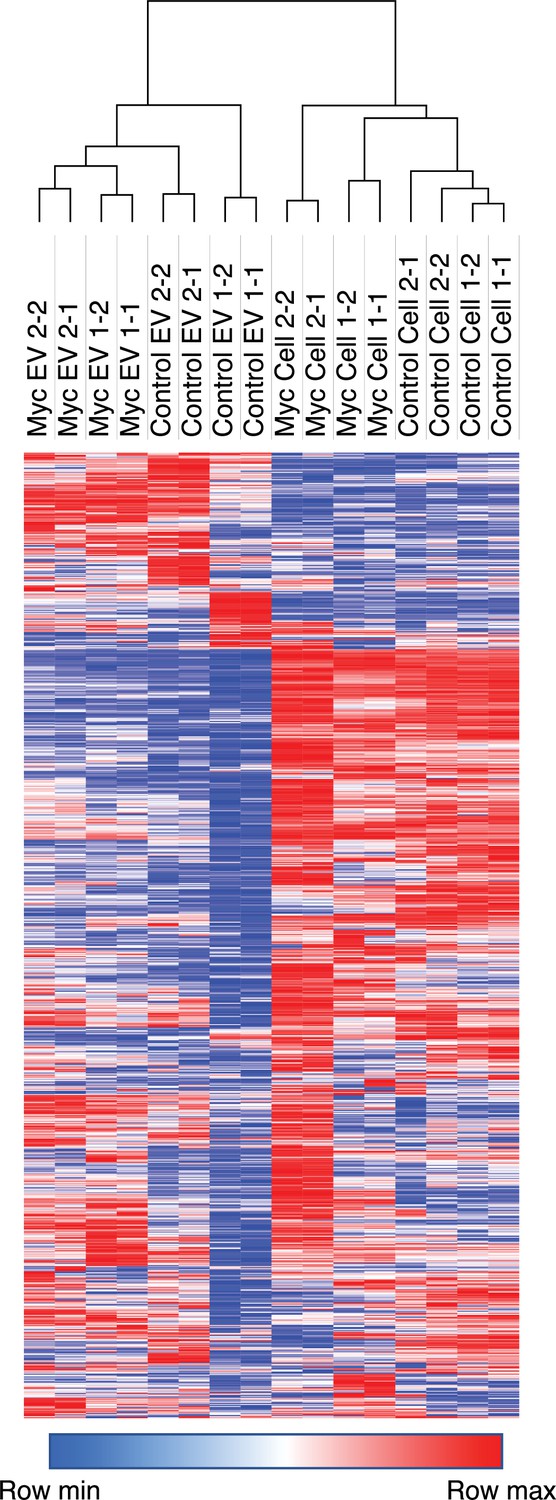
Heatmap comparison of biological and technical replicates of RWPE-1 Control/Myc cells and EVs.
Biological and technical replicates cluster together based on both oncogene status and compartment for EV or cell surface. Proteins with no area values were assigned an imputed value using Perseus. Heatmap clustering is based off of the Pearson correlation between all replicates on both columns and rows. Heatmap was produced using Morpheus, https://software.broadinstitute.org/morpheus. The first number following the sample name denotes the biological replicated and second number denotes the technical replicate.
Tables
Table 1
Current methods available for cell surface biotinylation.
| Method | Protocol length (time) | Selectivity | Sample size requirement |
|---|---|---|---|
| Biocytin hydrazide | +++ | +++ | +++ |
| Sulfo-NHS-LC-LC-biotin | ++ | + | + |
| APEX2/HRP | + | + | + |
Key resources table
| Reagent type (species) or resource | Designation | Source or reference | Identifiers | Additional information |
|---|---|---|---|---|
| Strain, strain background (Escherichia coli) | BL21(DE3)pLysS | Promega | L1195 | – |
| Cell line (human) | Expi293F | Thermo Fisher Scientific | A14527 | – |
| Cell line (human) | PaTu8902 | https://doi.org/10.7554/eLife.45313.001 | – | – |
| Cell line (human) | KP-4 | https://doi.org/10.7554/eLife.45313.001 | – | – |
| Cell line (human) | RWPE-1 | https://doi.org/10.1073/pnas.2018861118 | – | Control and Myc overexpression lines |
| Antibody | Anti-HisTag-650 (mouse monoclonal) | Invitrogen | MA1-21315-D650 | 1:100, flow cytometry, immunocytochemistry |
| Antibody | Biotin-conjugated anti-HRP (rabbit polyclonal) | Rockland | 200-4638-0100 | 1:100, flow cytometry, immunocytochemistry |
| Antibody | Anti-ANPEP (sheep polyclonal) | R&D Systems | AF3815 | 1:1000 |
| Antibody | Anti-Vimentin (rabbit monoclonal) | Cell Signaling Technology | 5741S | 1:1000 |
| Antibody | Anti-FN1 (rabbit polyclonal) | Abcam | ab2413 | 1:1,000 |
| Antibody | Anti-HLA-B (rabbit polyclonal) | ProteinTech | 17260-1-AP | 1:1,000 |
| Antibody | Anti-ITIH4 (rabbit polyclonal) | Atlas antibodies | HPA003948 | 1:1,000 |
| Antibody | Anti-MFGE8 (rabbit polyclonal) | Thermo Fisher Scientific | PA5-82036 | 1:1,000 |
| Antibody | Anti-IGSF8 (goat polyclonal) | R&D Systems | AF3117-SP | 1:1,000 |
| Antibody | Goat Anti-Rabbit HRP (goat polyclonal) | Thermo Fisher Scientific | 31460 | 1:10,000 |
| Antibody | Rabbit Anti-Sheep HRP (rabbit polyclonal) | Thermo Fisher Scientific | 31480 | 1:10,000 |
| Recombinant DNA reagent | APEX2 | Twist Biosciences | – | – |
| Sequence-based reagent | DBCO-DNA (Conjugated to APEX2) | IDT | – | – |
| Sequence-based reagent | Lipid DNA (Anchor and Co-Anchor) | https://doi.org/10.1038/s41592-019-0433-8 | – | – |
| Peptide, recombinant protein | HRP, Peroxidase | Thermo Fisher Scientific | 31,490 | – |
| Peptide, recombinant protein | WGA, Peroxidase (WGA-HRP) | Vector Laboratories | PL-1026-2 | – |
| Peptide, recombinant protein | IRDye 800CW Streptavidin | Li-Cor | 926-32230 | 1:10,000 |
| Peptide, recombinant protein | IRDye 680RD Donkey anti-Goat IgG | Li-Cor | 925-68074 | 1:10,000 |
| Commercial assay or kit | BCA assay | Thermo Fisher Scientific | 23228 | – |
| Commercial assay or kit | Preomics iST kit | PreOmics | P.O.00027 | – |
| Commercial assay or kit | Pierce quantitative colorimetric peptide assay | Thermo Fisher Scientific | 23275 | – |
| Commercial assay or kit | Expi293 media | Thermo Fisher Scientific | A1435101 | – |
| Commercial assay or kit | Keratinocyte SFM media (1×) | Thermo Fisher Scientific | 17005042 | – |
| Commercial assay or kit | MycoAlert PLUS mycoplasma detection kit | Lonza | LT07-703 | – |
| Chemical compound, drug | Trolox | Fisher Scientific | 501176131 | – |
| Chemical compound, drug | Sodium Ascorbate | Sigma-Aldrich | A4034-100G | – |
| Chemical compound, drug | N-acetyl-D-glucosamine | Sigma-Aldrich | A3286-5G | – |
| Chemical compound, drug | H2O2 (1×) | Sigma-Aldrich | H1009-100ML | – |
| Chemical compound, drug | Hemin-Cl | Sigma-Aldrich | 51280-1G | – |
| Chemical compound, drug | Maleimide DBCO | Click Chemistry Tools | A108P-10 | – |
| Chemical compound, drug | Biotin Tyramide | Sigma-Aldrich | SML2135-50MG | – |
| Chemical compound, drug | Sodium Pyruvate | Sigma-Aldrich | S8636-100ML | – |
| Chemical compound, drug | Sodium Periodate | Sigma-Aldrich | 311448-5G | – |
| Chemical compound, drug | Biocytin Hydrazide | Biotium | 90060 | – |
| Chemical compound, drug | Aniline | Sigma-Aldrich | 242284 | – |
| Chemical compound, drug | Protease Inhibitor Cocktail | Sigma-Aldrich | P8340-1ML | – |
| Chemical compound, drug | High Capacity Neutravidin Resin | Thermo Fisher Scientific | 29204 | – |
| Chemical compound, drug | Poly-D-lysine | Thermo Fisher Scientific | A3890401 | – |
| Chemical compound, drug | Sulfo NHS LC-LC Biotin | Thermo Fisher Scientific | A35358 | – |
| Software, algorithm | FlowJo | FlowJo (https://www.flowjo.com) | RRID:SCR_008520 | – |
| Software, algorithm | GraphPad Prism | Prism (https://www.graphpad.com/scientific-software/prism/) | RRID:SCR_002798 | – |
| Software, algorithm | Morpheus | Morpheus (https://software.broadinstitute.org/morpheus/) | – | – |
| Software, algorithm | FIJI | FIJI (https://fiji.sc) | RRID:SCR_002285 | – |
| Other | Penicillin/streptomycin | Thermo Fisher Scientific | 15-140-122 | – |
| Other | Fetal bovine serum | Gemini Bio-Products | 100-106 | – |
| Other | Trypsin (0.05%) | Life Technologies | 25300054 | – |
Additional files
-
Transparent reporting form
- https://cdn.elifesciences.org/articles/73982/elife-73982-transrepform1-v2.docx
-
Source data 1
Raw and Uncropped Western Blots.
- https://cdn.elifesciences.org/articles/73982/elife-73982-data1-v2.zip
Download links
A two-part list of links to download the article, or parts of the article, in various formats.
Downloads (link to download the article as PDF)
Open citations (links to open the citations from this article in various online reference manager services)
Cite this article (links to download the citations from this article in formats compatible with various reference manager tools)
Cell-surface tethered promiscuous biotinylators enable comparative small-scale surface proteomic analysis of human extracellular vesicles and cells
eLife 11:e73982.
https://doi.org/10.7554/eLife.73982


