Mycobacterium tuberculosis canonical virulence factors interfere with a late component of the TLR2 response
- The Ragon Institute, Massachusetts General Hospital, United States
- Department of Infectious Diseases and Global Health, Tufts University Cummings School of Veterinary Medicine, United States
- The Division of Infectious Diseases, Massachusetts General Hospital, United States
- Department of Medicine, Harvard Medical School, United States
Figures
Figure 1 with 1 supplement
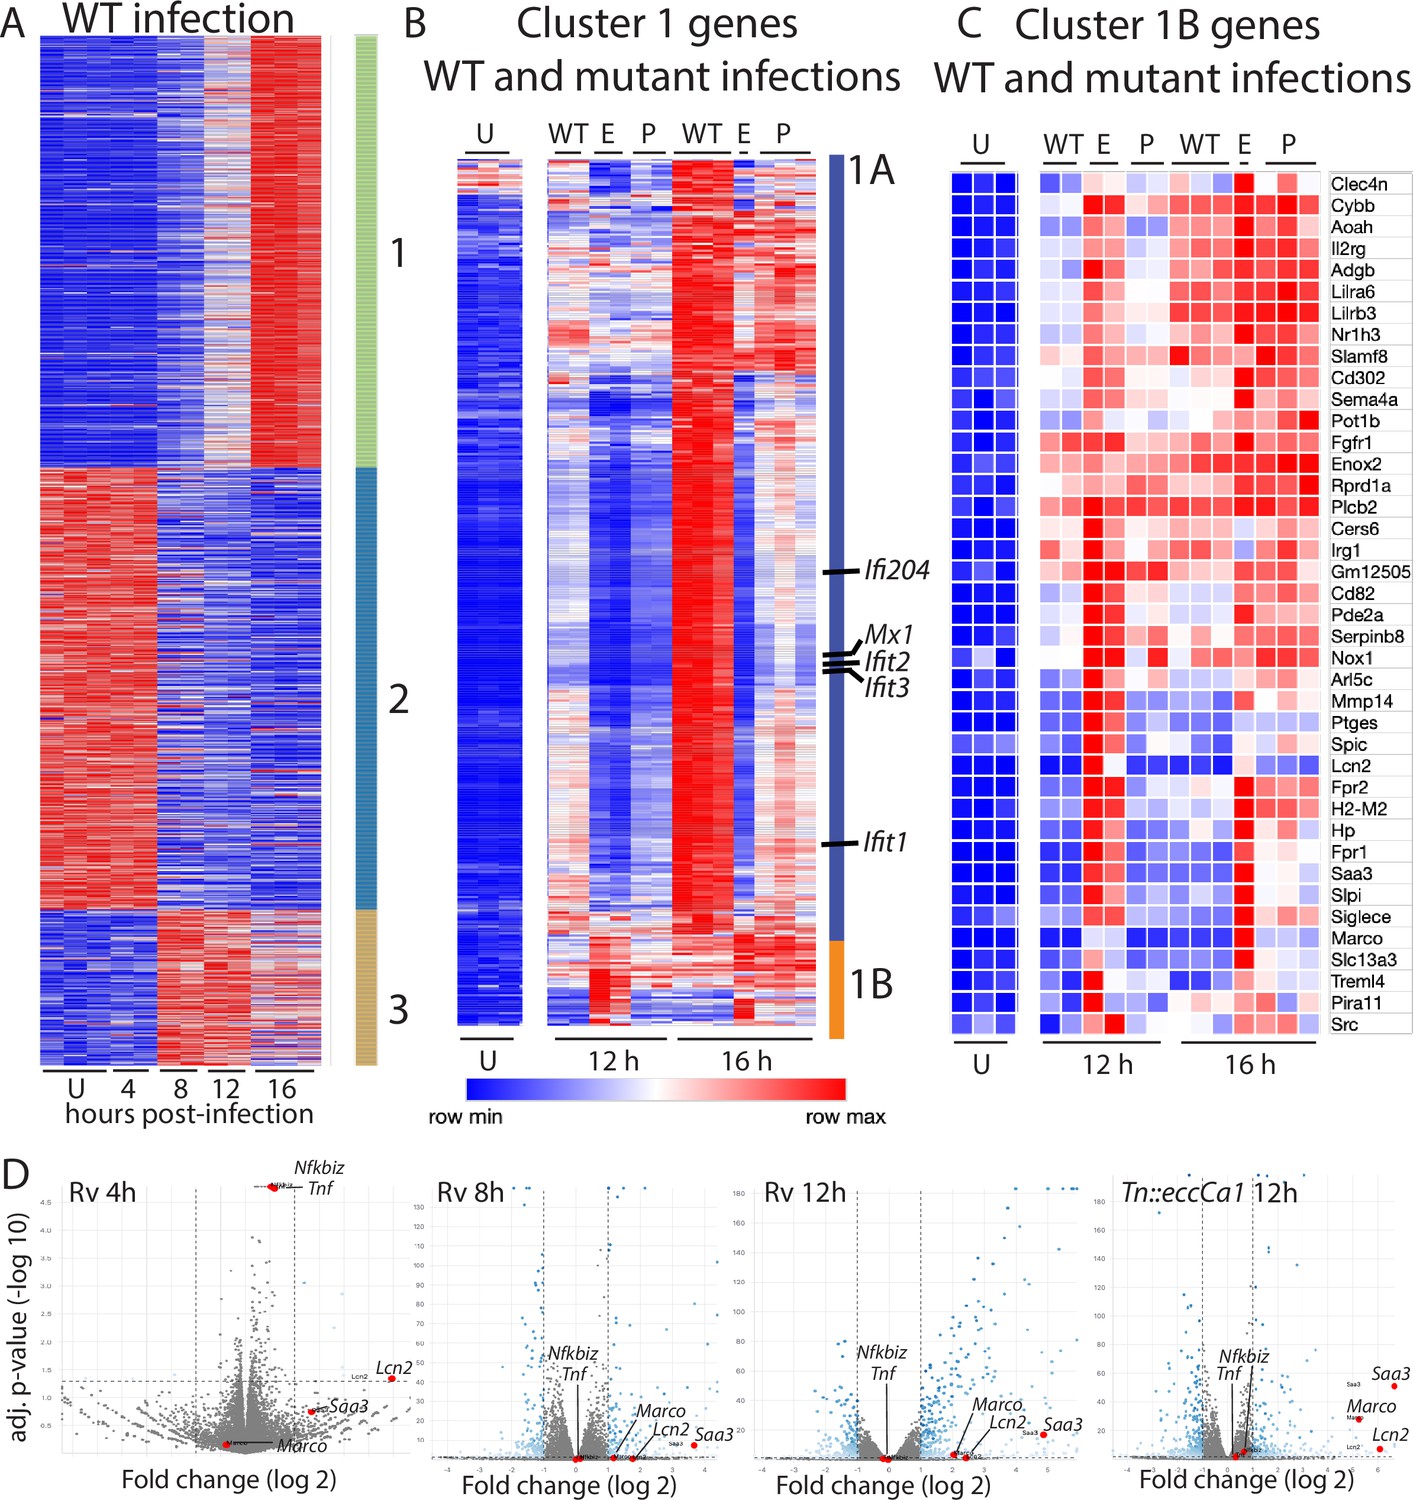
Macrophage infection with Mycobacterium tuberculosis (Mtb) phthiocerol dimycocerosate (PDIM) or ESX-1 mutants reveals two subclusters of genes differentially expressed relative to infection with wild-type Mtb.
(A–C) C57BL/6J bone marrow-derived macrophages (BMDM) were infected with wild-type Mtb H37Rv (‘WT’), the ESX-1 core complex mutant Tn::eccCa1 (‘E’), or the PDIM production mutant mas (‘P’) at an MOI of 2:1. At 4, 8, 12, and 16 hr post-infection, RNA was harvested for RNAseq. Sequencing libraries not passing QC metrics were excluded from further analysis. (A) Genes were clustered based on similarity of expression in response to wild-type (WT) Mtb. (B, C) Cluster 1 genes from A were subclustered based on the response to WT Mtb and the mutants. Uninfected, 12 hr, and 16 hr timepoints shown. (A–C) Blue-red gradient reflects relative expression within each row. (D) Volcano plots for the indicated conditions. Tnf and co-regulated gene Nfkbiz and subcluster 1B genes Saa3, Marco, Lcn2 are indicated on each graph. RNAseq experiment performed once.
Figure 1—figure supplement 1
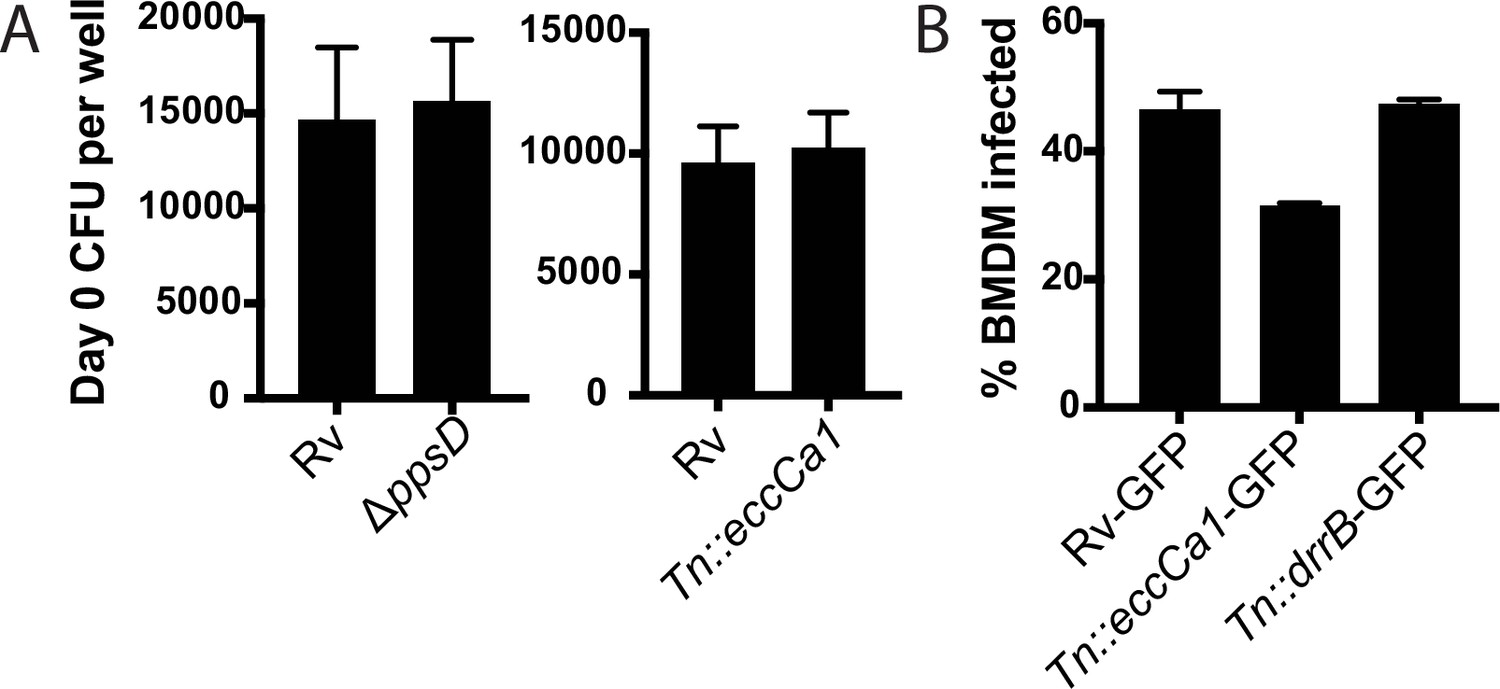
Wild-type and mutant Mtb strains are taken up into macrophages at similar rates.
(A) C57BL/6J bone marrow-derived macrophages (BMDM) were infected with Mycobacterium tuberculosis (Mtb) at an MOI of 2:1. After 4 hr of phagocytosis, cells were washed, lysed, and plated for CFU. (B) C57BL/6J BMDM were infected with the indicated Mtb strains expressing GFP at an MOI of 5:1. After 4 hr of phagocytosis, BMDM were washed and analyzed by flow cytometry to quantitate the percent of cells with detectable Mtb-GFP signal. (A) Mean ± SD for four replicates. (B) Mean ± SD for three replicates.
Figure 2 with 1 supplement
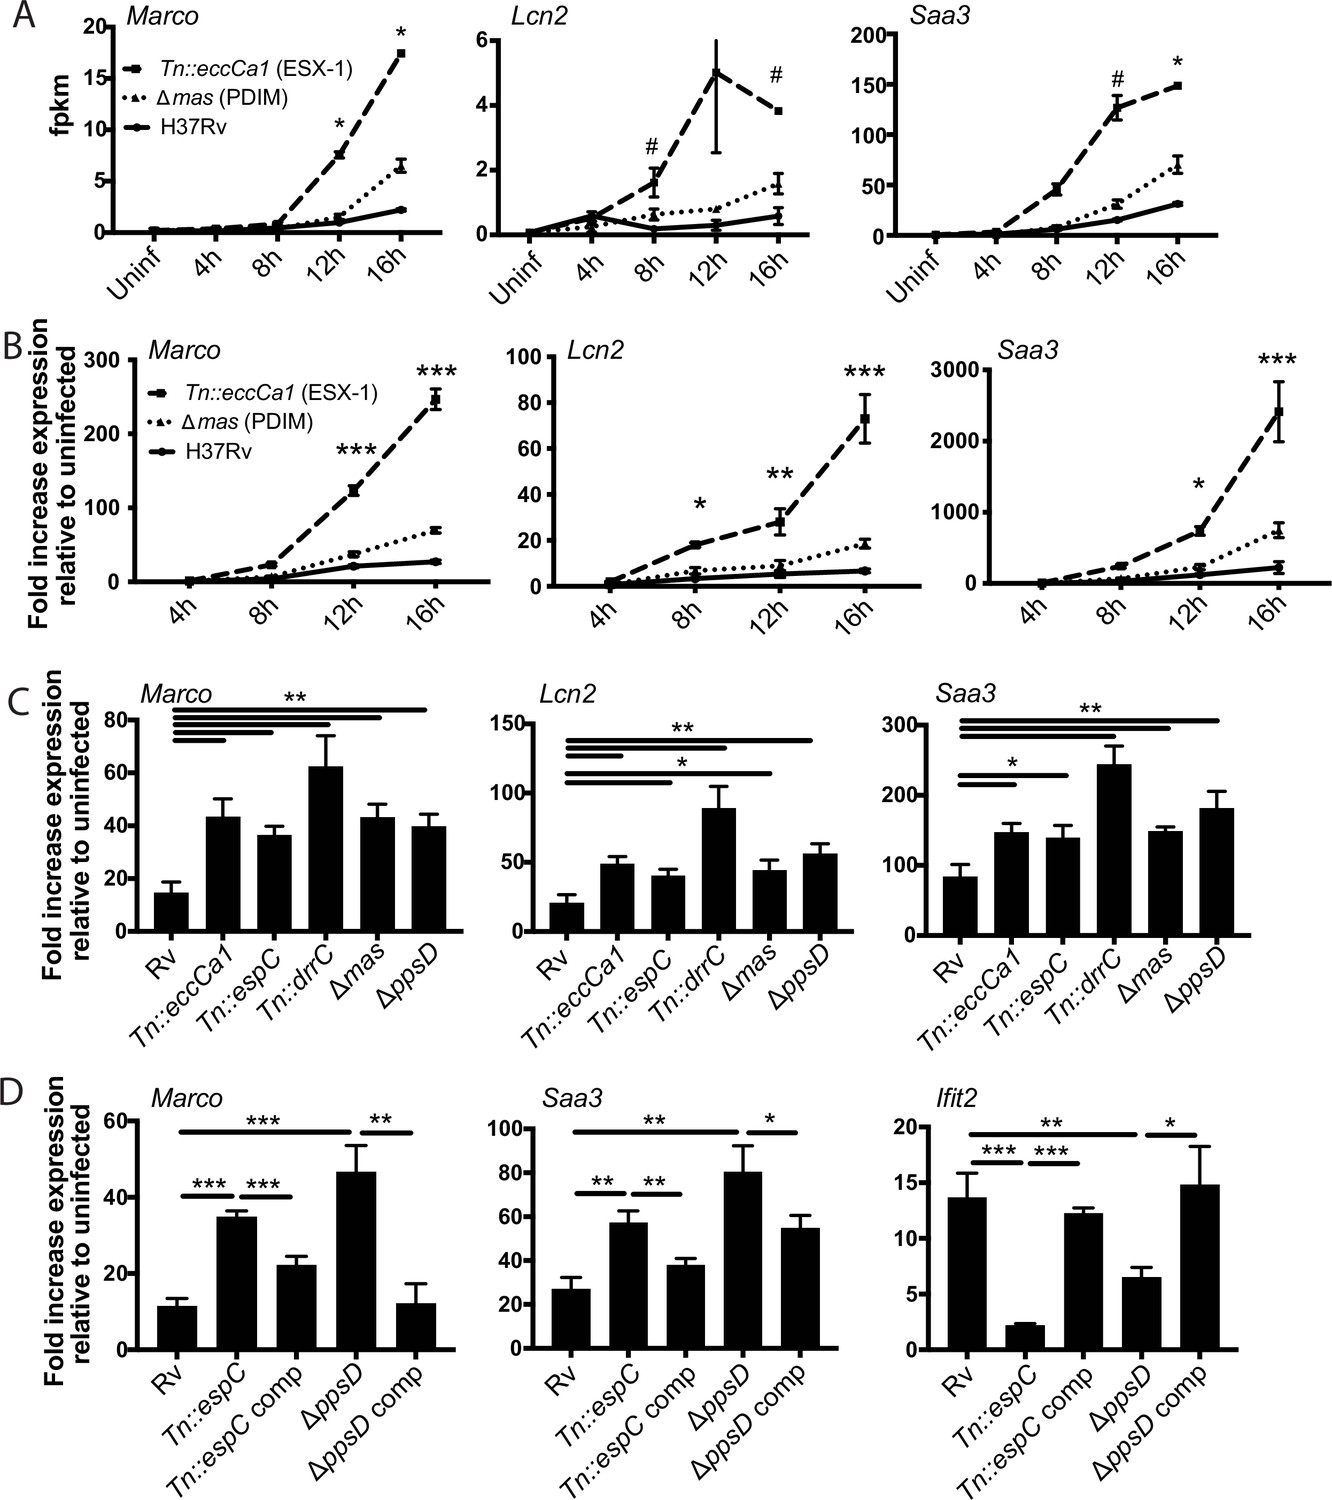
Infection with Mycobacterium tuberculosis (Mtb) phthiocerol dimycocerosate (PDIM) or ESX-1 mutants elicits enhanced expression of an inflammatory transcriptional program.
(A) FPKM from RNAseq data (MOI 2:1) for representative genes from subcluster 1B. *p-value < 0.01 or #p-value < 0.05 for the comparison of PDIM (16 hr) or ESX-1 (12 hr) mutant-infected with Rv-infected, unpaired two-tailed t-test. (B) C57BL/6J bone marrow-derived macrophages (BMDM) were infected with the indicated strains at an MOI of 10:1. RNA was harvested at the indicated timepoints, and expression of the indicated genes was profiled by qPCR relative to GAPDH control. (C–D) C57BL/6J BMDM were infected with the indicated Mtb strains at an MOI of 2:1. RNA was harvested 24 hr post-infection, and expression of the indicated genes relative to GAPDH control was profiled using qPCR. (B–D) Mean ± SD of four replicates. *p-value < 0.01, **p-value < 0.001, ***p-value < 0.0001 unpaired two-tailed t-test. RNAseq experiment (A) performed once, (B) one of two independent experiments, (C–D) one of three independent experiments.
Figure 2—figure supplement 1
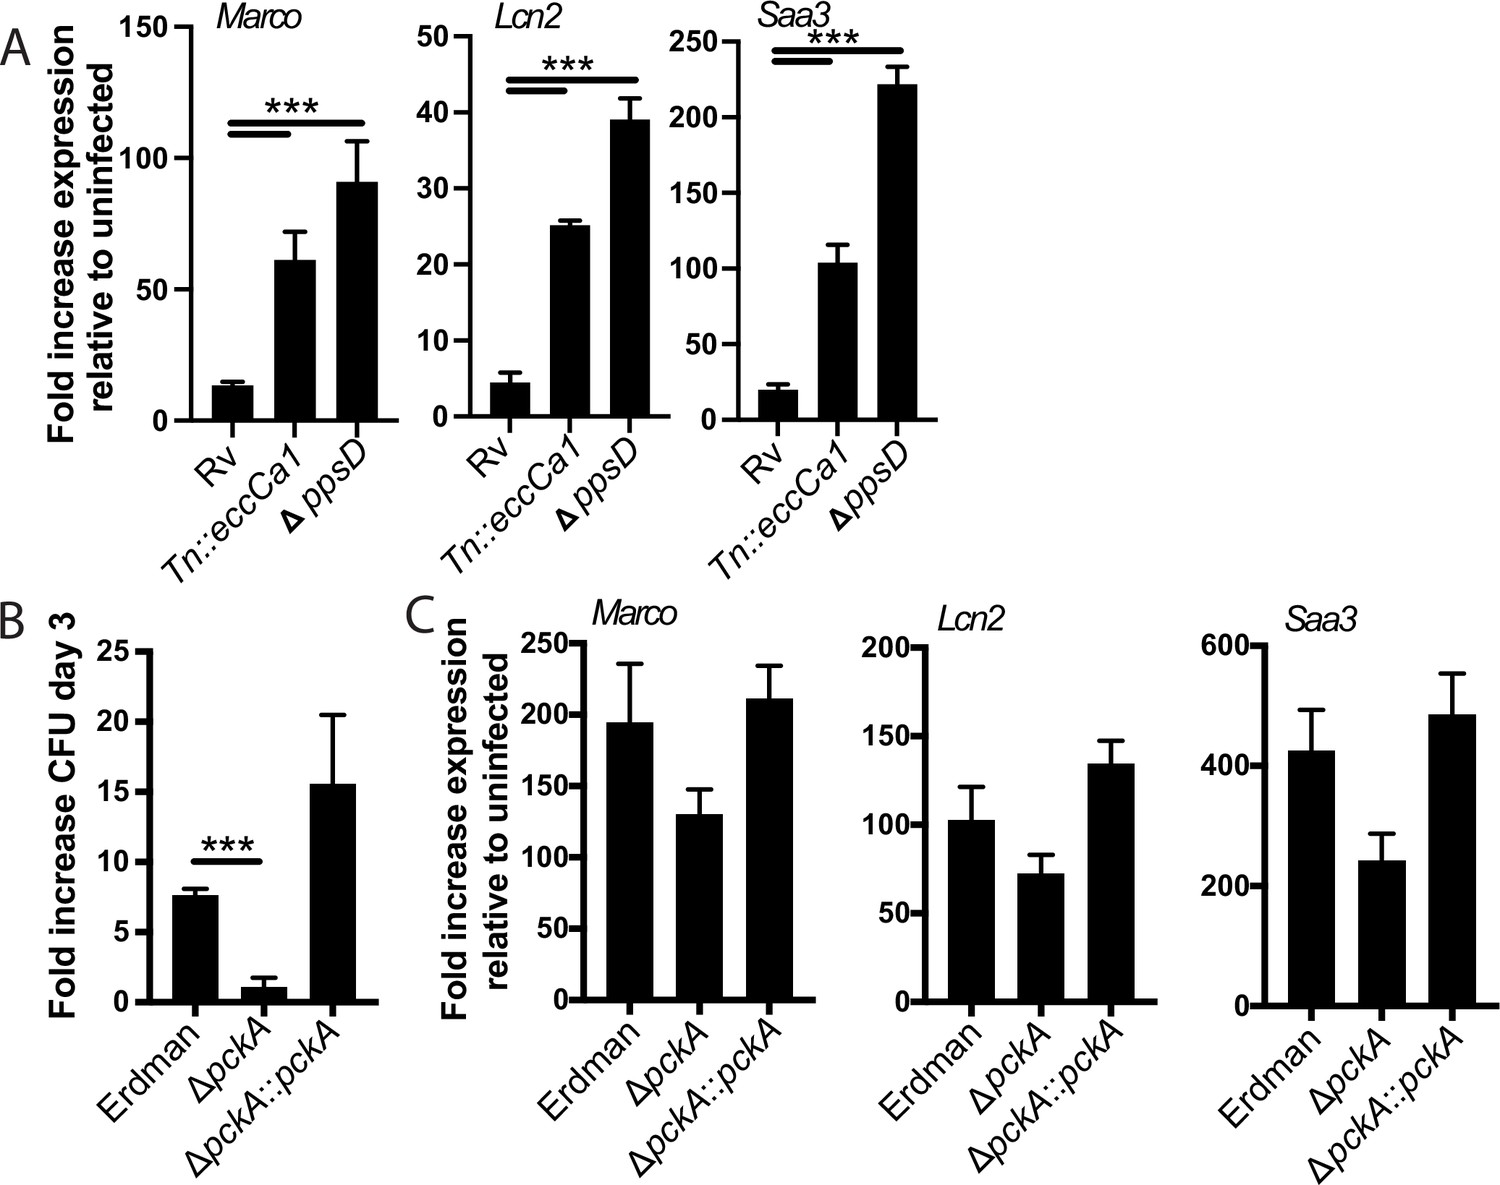
Enhanced expression is independent of BMDM mouse strain and specific to PDIM and ESX-1 mutants.
(A, C) BALB/c (A) or C57BL/6J (C) bone marrow-derived macrophages (BMDM) were infected with the indicated Mycobacterium tuberculosis (Mtb) strains at an MOI of 2:1. RNA was harvested 24 hr post-infection, and expression of the indicated genes was quantified by qPCR relative to GAPDH control. (B) J774 cells were infected with the indicated Mtb strains at an MOI of 2:1. Cells were lysed at day 0 and day 3; lysates were plated for CFU. (C) C57BL/6J BMDM were infected with the indicated Mtb strains at an MOI of 2:1. (A–C) Mean ± SD for four replicates. ***p-value < 0.0001 unpaired two-tailed t-test.
Figure 3 with 1 supplement
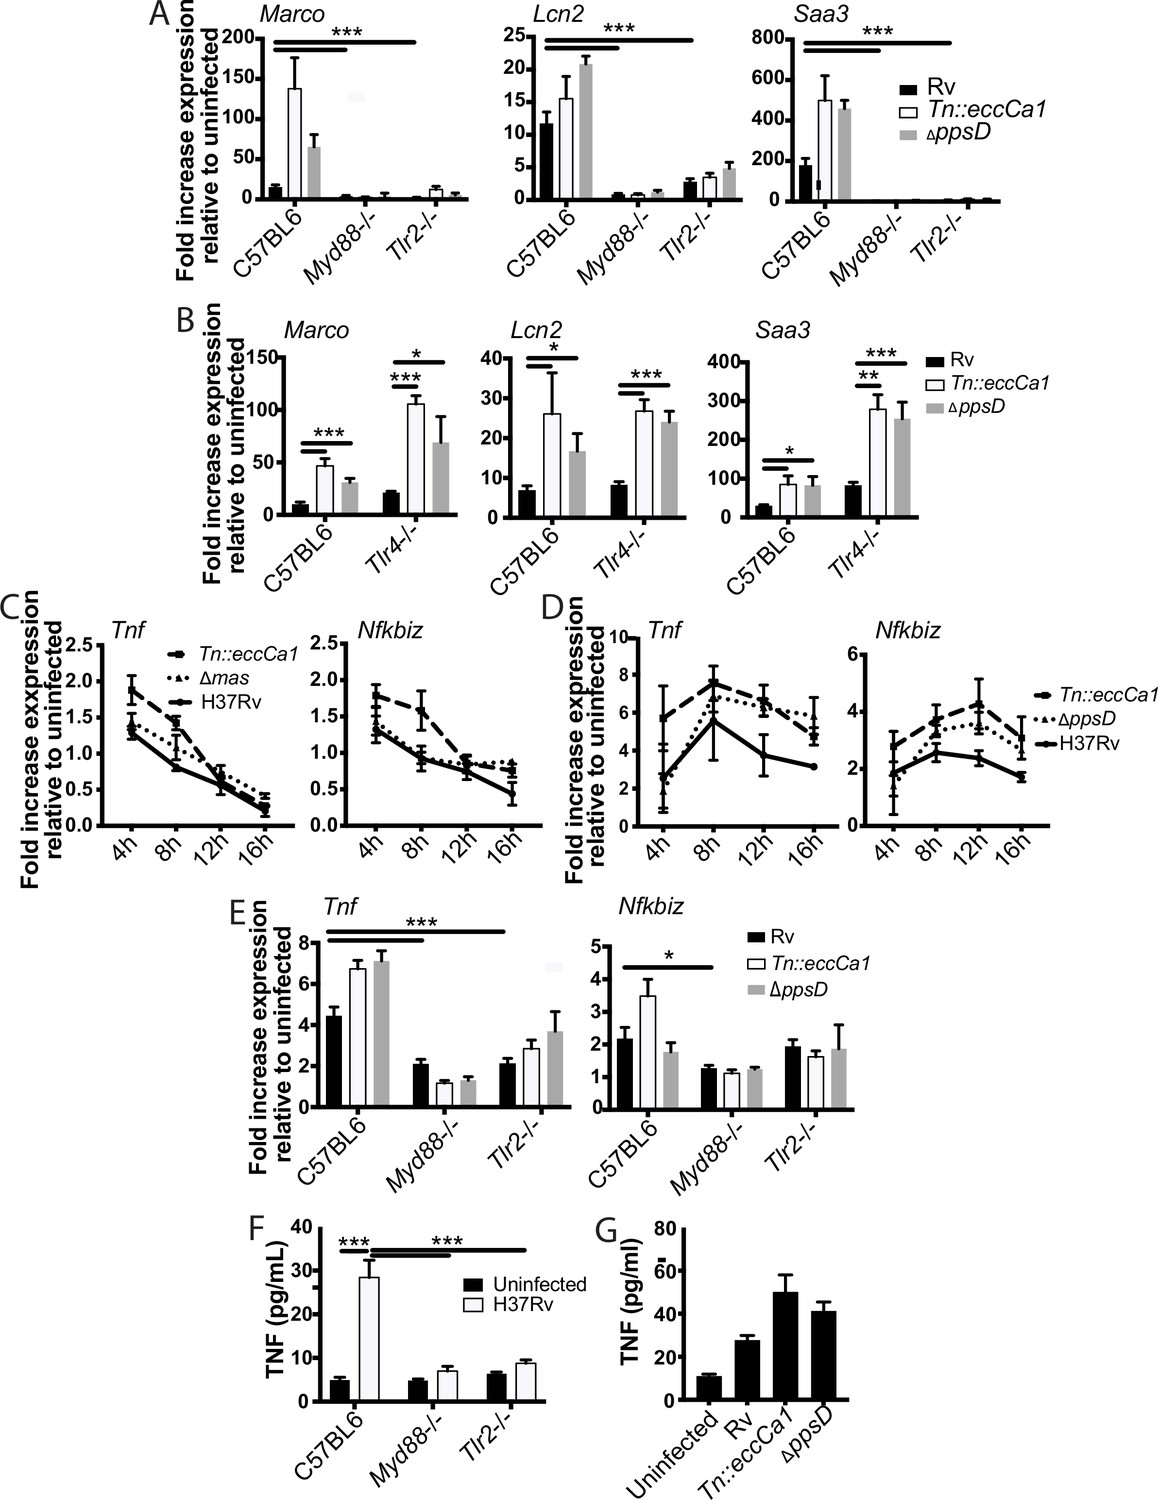
The identified two-component inflammatory response to Mycobacterium tuberculosis (Mtb) is dependent upon MYD88 and TLR2.
(A–B) The indicated bone marrow-derived macrophages (BMDM) were infected with the indicated Mtb strains at an MOI of 2:1. RNA was harvested 24 hr post-infection. (C–D) C57BL/6J BMDM were infected with the indicated Mtb strains at an MOI of 2:1 (C) or 10:1 (D). RNA was harvested at the indicated timepoints post-infection. (E) The indicated BMDM were infected with the indicated Mtb strains at an MOI of 5:1. RNA was harvested 6 hr after infection. (F–G) The indicated (F) or C57BL/6J (G) BMDM were infected with the indicated Mtb strains at an MOI of 5:1. Supernatants were harvested 24 hr post-infection, and TNF was quantified by ELISA. Mean ± SD of four replicates. *p-value < 0.01, ***p-value < 0.0001 unpaired two-tailed t-test. (A, C, E) one of three independent experiments, (B, D, F–G) one of two independent experiments.
Figure 3—figure supplement 1
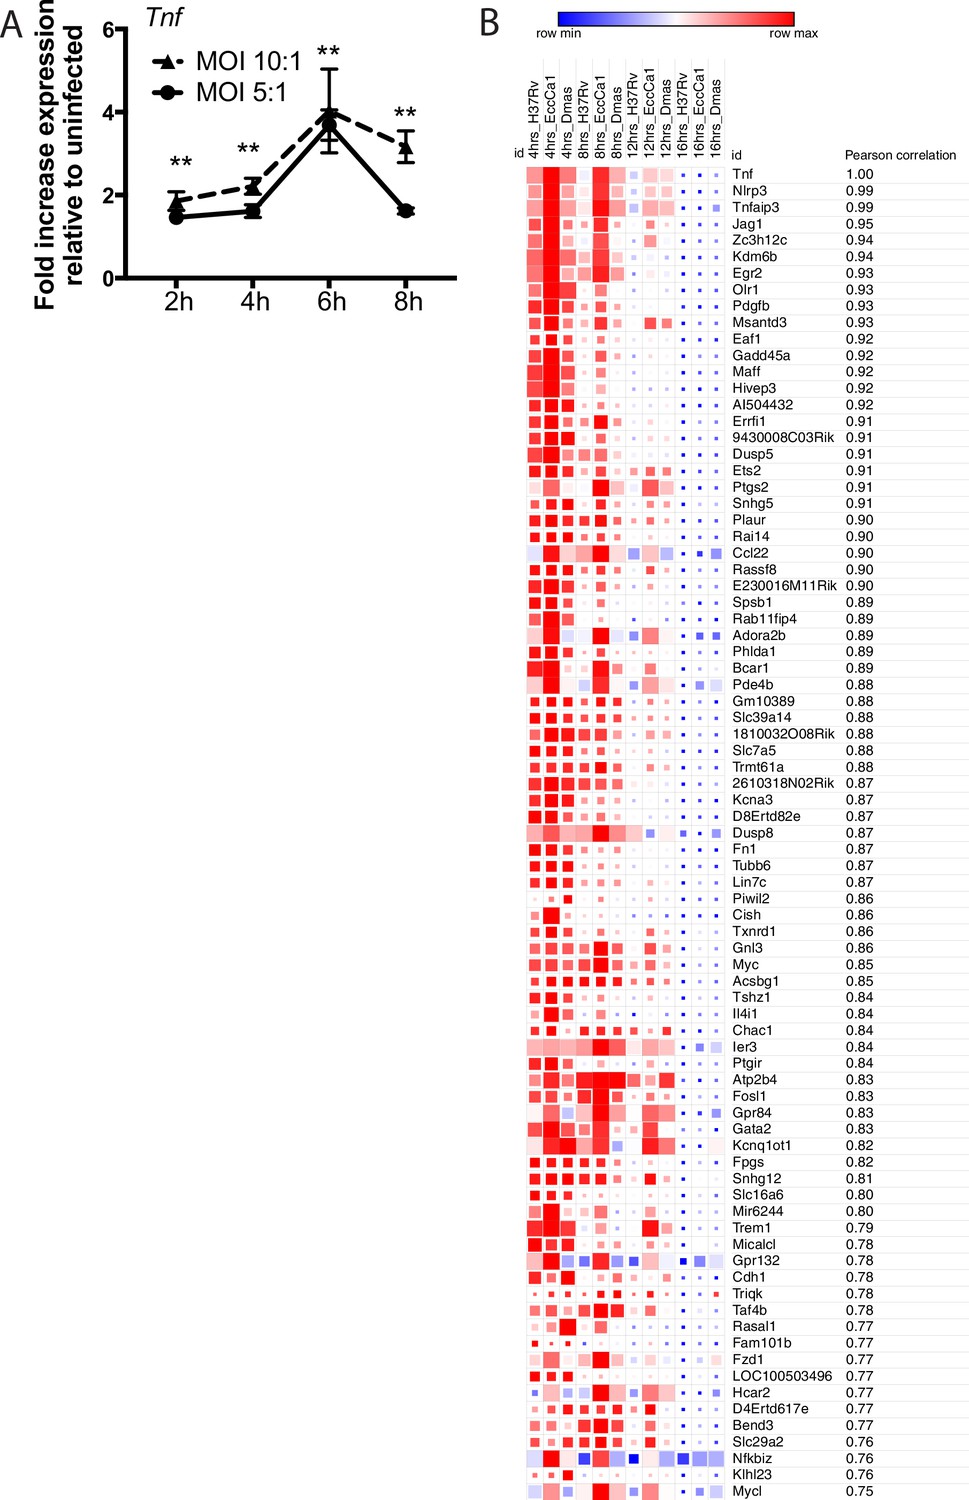
Expression of Tnf and co-regulated genes over time post-infection.
(A) C57BL/6J bone marrow-derived macrophages (BMDM) were infected with H37Rv at the indicated MOI. RNA was harvested at the indicated timepoints. Expression of Tnf relative to GAPDH control was profiled using qPCR. **p-value < 0.001 for the comparison of either MOI with uninfected at a given timepoint. (B) Correlation analysis for genes co-expressed with Tnf was performed on the RNAseq dataset; 81 genes with a Pearson correlation co-efficient ≥ 0.75 were identified. Blue-red gradient reflects row minimum to row maximum expression; box size represents reflects absolute expression level.
Figure 4 with 1 supplement
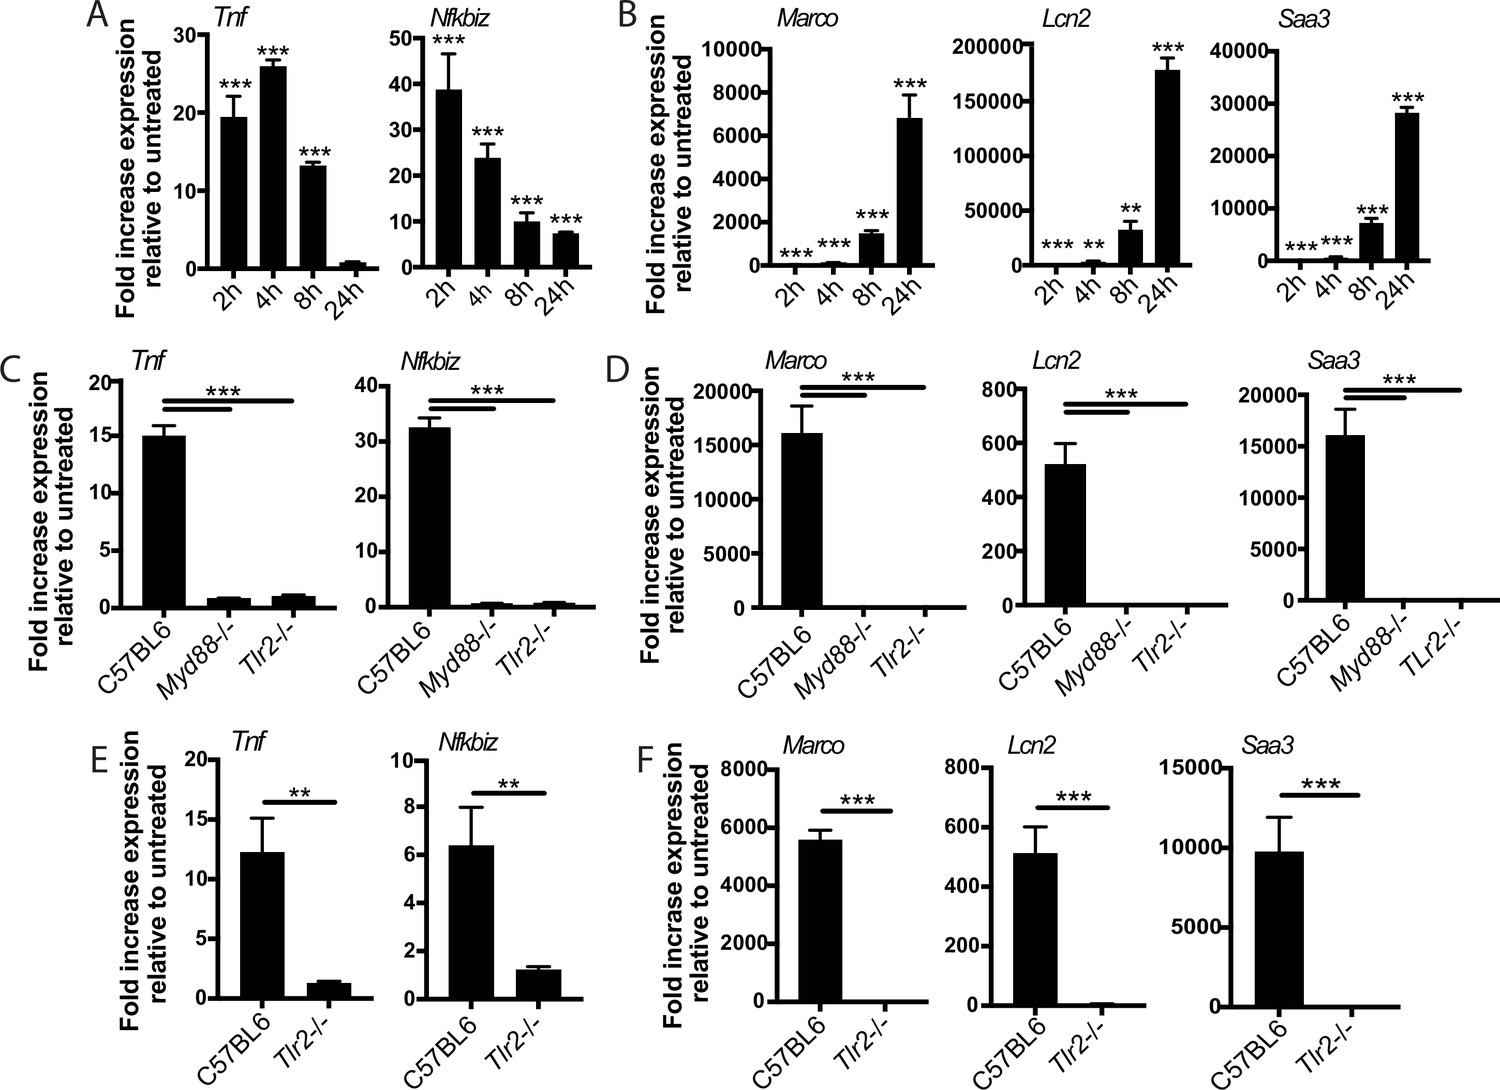
The two-component response is a fundamental feature of TLR2 activation.
C57BL/6J (A–B) or the indicated (C–F) bone marrow-derived macrophages (BMDM) were treated with PAM3CSK 1 mu-g/ml (A–D) or PIM6 1 mu-g/ml (E–F) and RNA was harvested at the indicated timepoints (A–B), 2 hr (C, E), or 24 hr (D, F). qPCR was performed to quantitate expression of the indicated genes relative to GAPDH control. Mean ± SD for four replicates. **p-value < 0.001, ***p-value < 0.0001 unpaired two-tailed t-test. (A–B) One of two independent experiments, (C–F) one of three independent experiments.
Figure 4—figure supplement 1
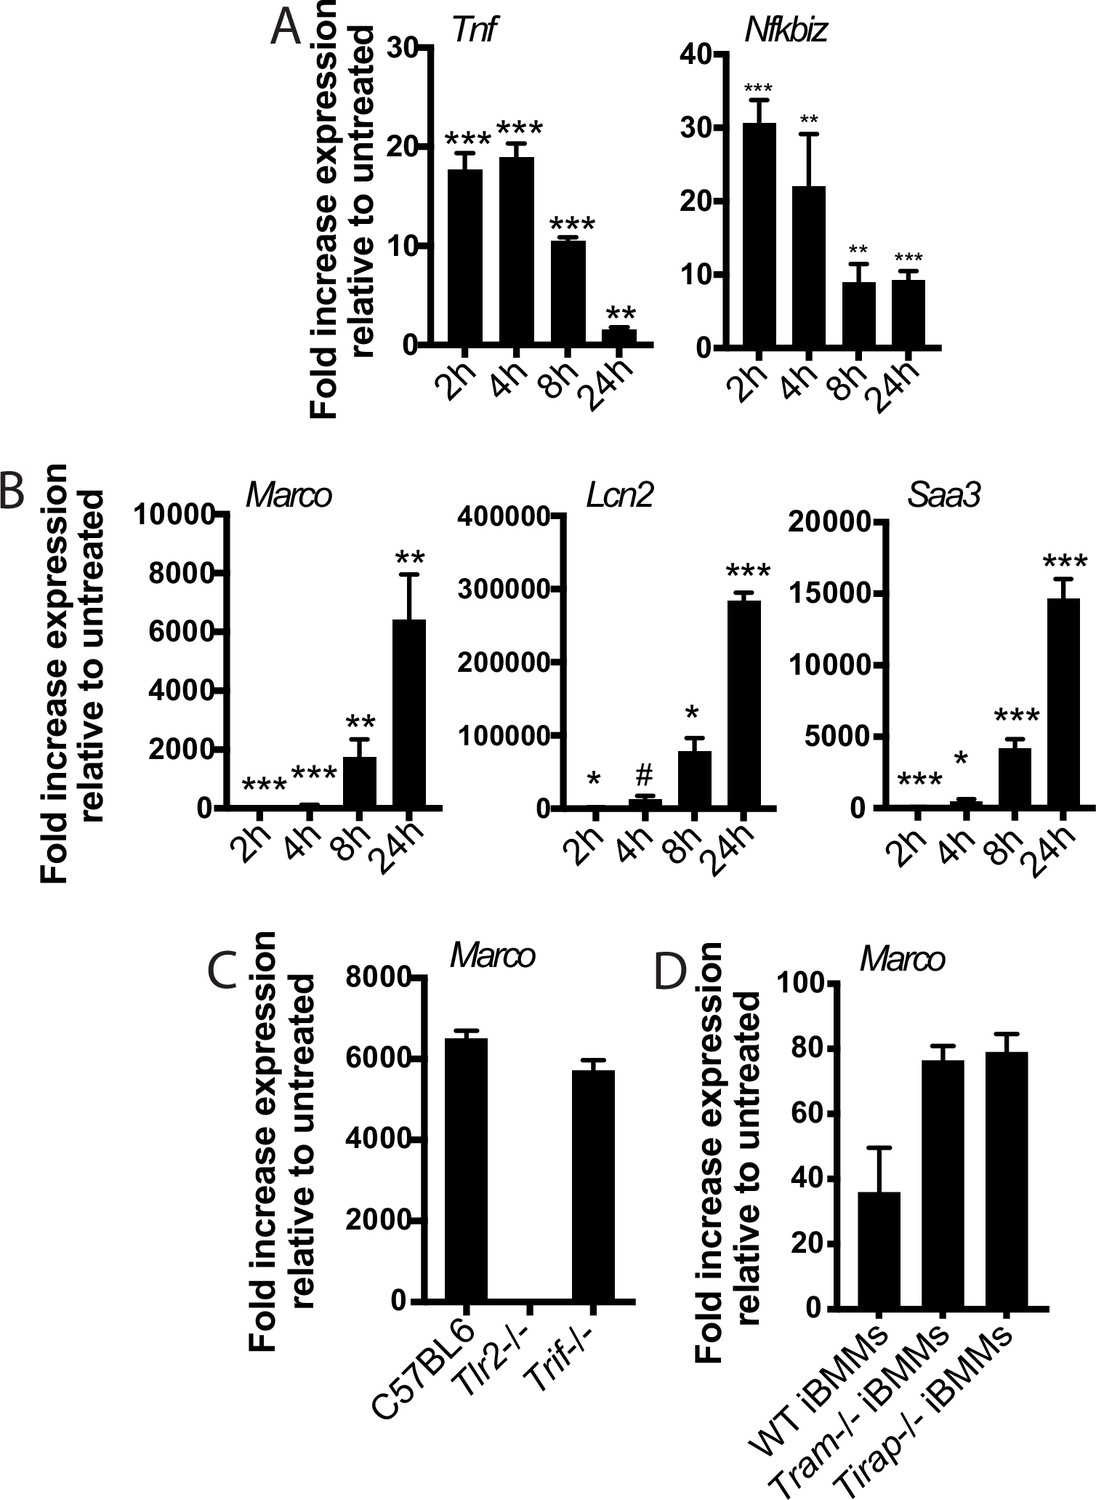
PAM2CSK elicits the same two-component transcriptional response.
(A–B) C57BL/6J bone marrow-derived macrophages (BMDM) were treated with PAM2CSK 1 mu-g/ml and RNA was harvested at the indicated timepoints. (C) The indicated BMDM were treated with PAM3CSK 1 mu-g/ml and RNA was harvested at 24 hr. (D) The indicated iBMM were treated with PAM3CSK 1 mu-g/ml and RNA was harvested at 24 hr. (A–D) qPCR was performed to quantify expression of the indicated genes relative to GAPDH control. Mean ± SD for four replicates. #p-value < 0.05, *p-value < 0.01, **p-value < 0.001, ***p-value < 0.0001, unpaired two-tailed t-test for the comparison with untreated.
Figure 5 with 2 supplements
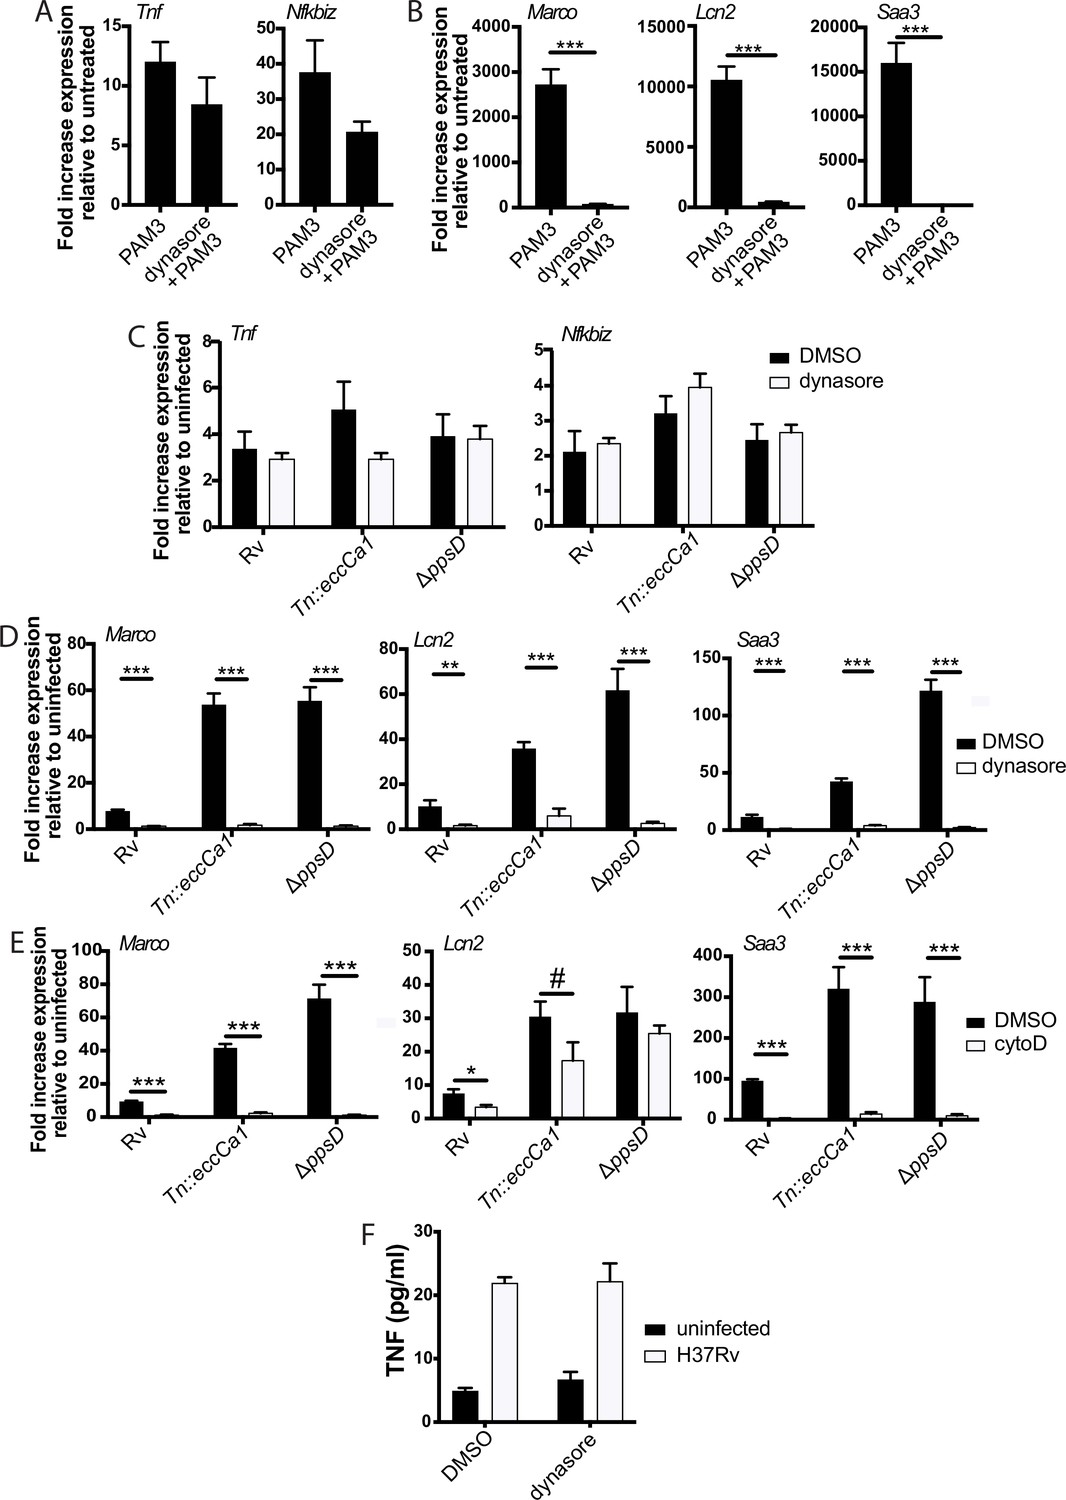
The later component of the TLR2-dependent transcriptional response requires endosomal uptake.
Where indicated, C57BL/6J bone marrow-derived macrophages (BMDM) were pre-treated with dynasore 80 µM or cytochalasin D 10 µM. Cells were then treated with PAM3CSK4 1 µg/ml (A–B) or infected with the indicated Mycobacterium tuberculosis (Mtb) strains at an MOI of 5:1 (C) or 2:1 (D–E). RNA was harvested at 2 hr (A) 6 hr (C), or 24 hr (B,D–E). qPCR was performed to quantitate expression of the indicated genes relative to GAPDH control. (E, F) BMDM were infected with the indicated Mtb strains at an MOI of 5:1. Supernatants were harvested 24 hr post-infection, and TNF was quantified by ELISA. Mean ± SD for four replicates. #p-value < 0.05, *p-value < 0.01, ***p-value < 0.0001 unpaired two-tailed t-test. (A–E) One of three independent experiments, (F) one of two independent experiments.
Figure 5—figure supplement 1
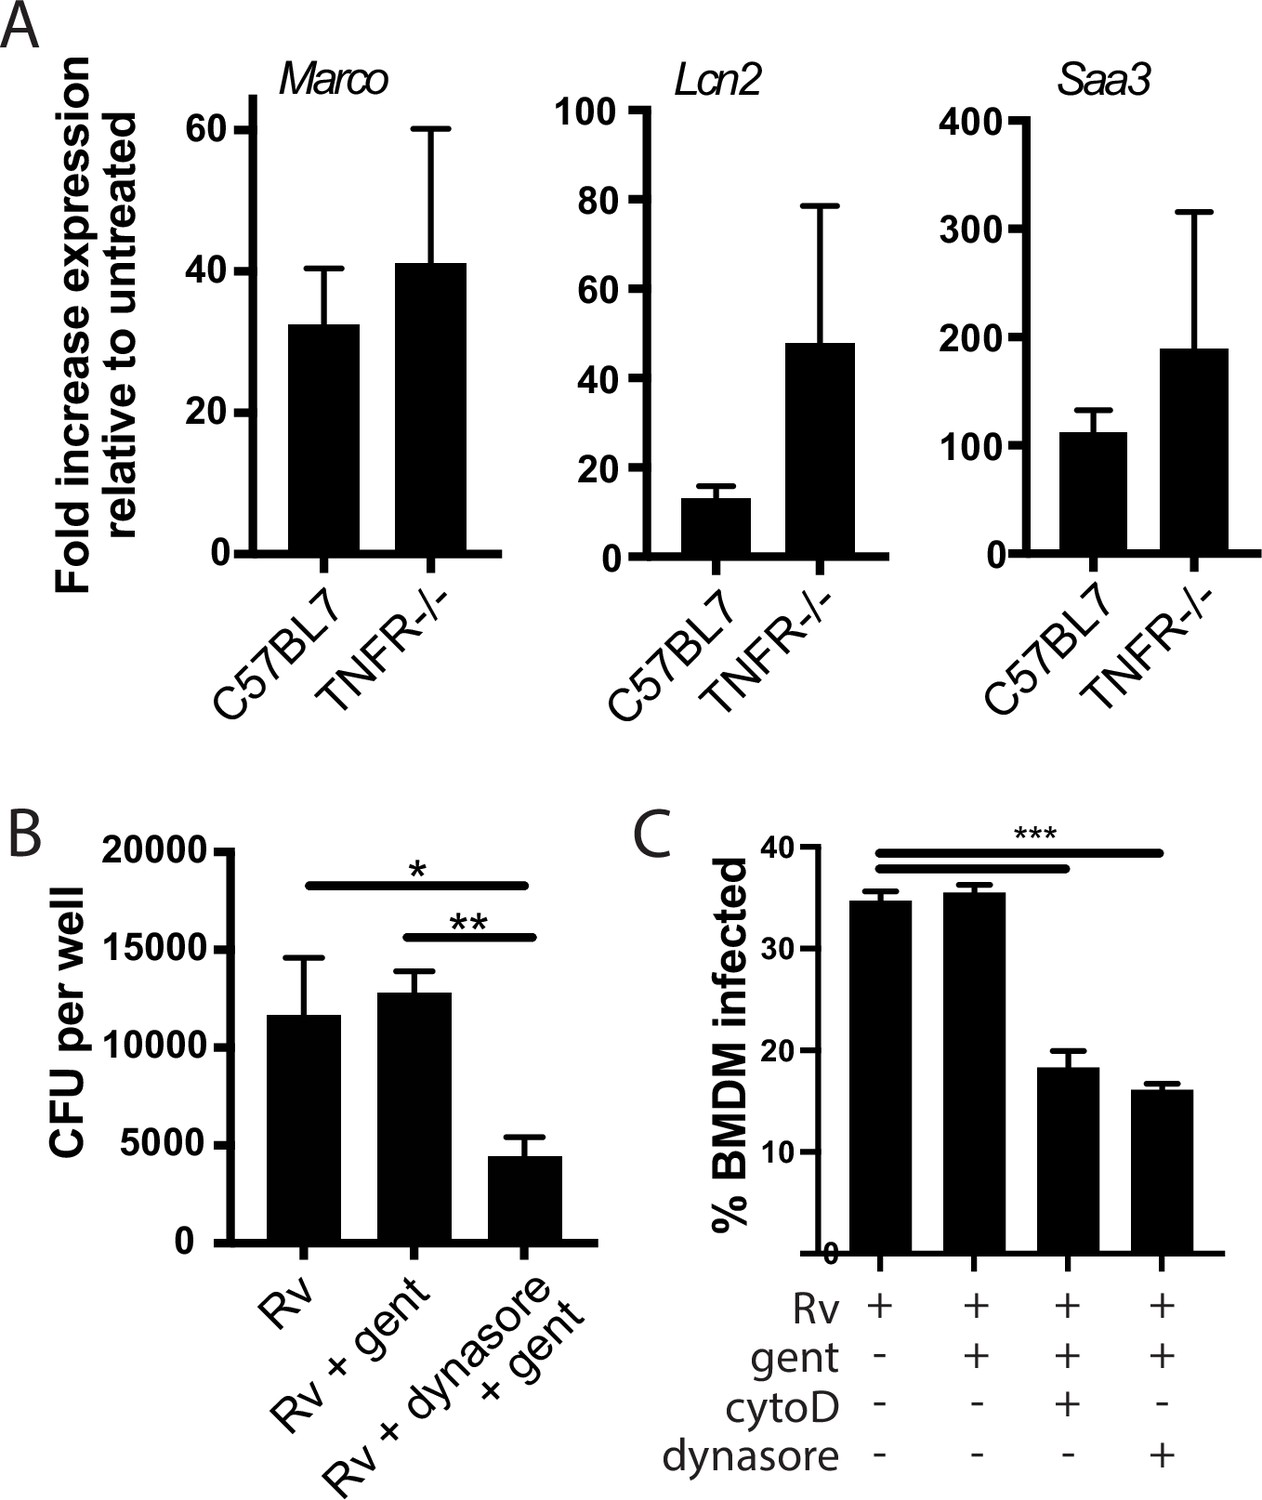
The later component of the TLR2-dependent transcriptional response is independent of TNF signaling.
(A) The indicated bone marrow-derived macrophages (BMDM) were infected with H37Rv at an MOI of 2:1. RNA was harvested 24 hr post-infection. Expression of the indicated genes was quantified by qPCR relative to GAPDH control. (B) C57BL/6J BMDM were pre-treated with dynasore (80 µM) where indicated for 30 min prior to infection. Cells were then infected with H37Rv at an MOI of 2:1. Following 4 hr of phagocytosis, cells were washed in PBS with gentamicin (32 mu-g/ml) and resuspended in media with gentamicin (32 mu-g/ml) for 2 hr. Cells were then washed with PBS, lysed, and plated for CFU. Mean ± SD of four replicates. (C) C57BL/6J BMDM were pre-treated with cytochalasin D (10 µM), or dynasore (80 µM) where indicated. Cells were then infected with Rv-GFP at an MOI of 5:1. Following 4 hr of phagocytosis, cells were washed in PBS and resuspended in media with gentamicin (32 mu-g/ml) for 4 hr. Cells were again washed with PBS, fixed, and analyzed by flow cytometry. Gates for Mtb-GFP uptake were set based on an uninfected control. Mean ± SD for three replicates. *p-value < 0.01, **p-value < 0.001, unpaired two-tailed t-test.
Figure 5—figure supplement 2
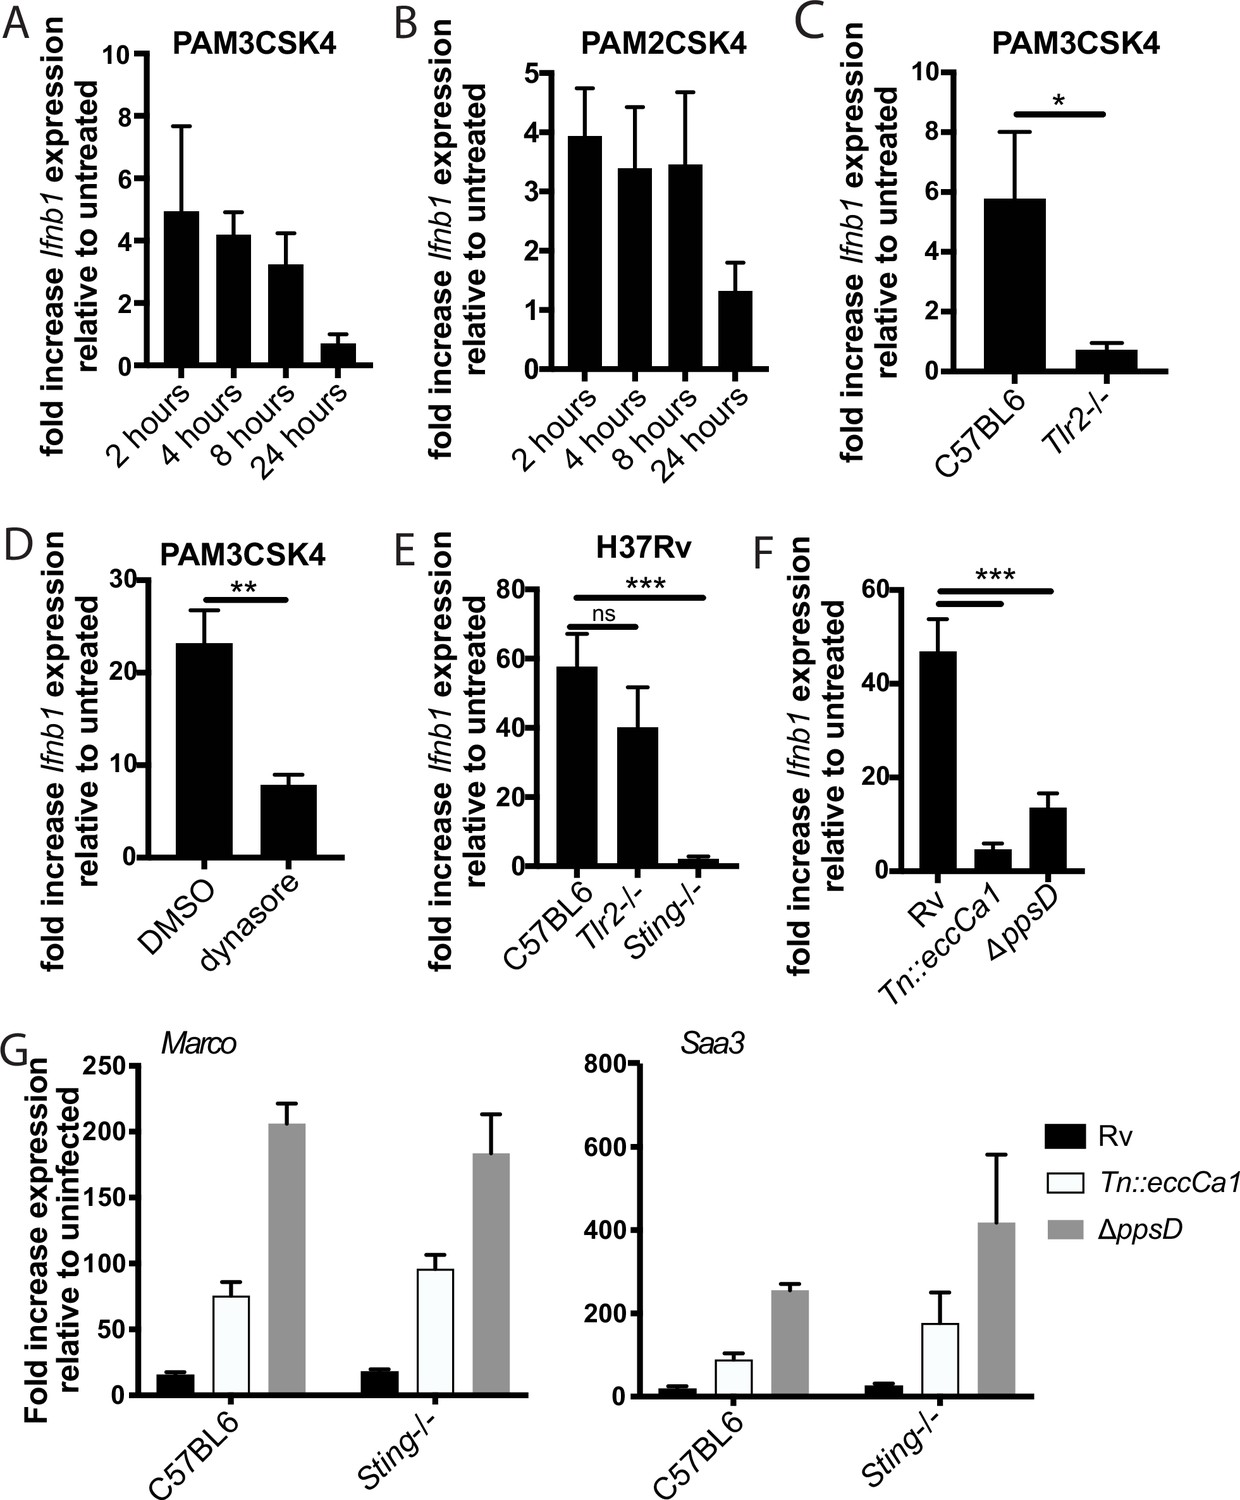
The enhanced TLR2-dependent response to PDIM and ESX-1 mutants is independent of the type I IFN response.
(A–D) The indicated bone marrow-derived macrophages (BMDM) were treated with PAM2CSK4 (100 ng/ml) as indicated. (D) Cells were pre-treated with dynasore (80 µM) for 15 min prior to ligand treatment. (E–G) The indicated BMDM (E, G) or C57BL/6J BMDM (F) were infected with the indicated Mycobacterium tuberculosis (Mtb) strains at an MOI of 5:1 (E–F) or 2:1 (G). RNA was harvested at the indicated times (A–B), at 2 hr (C–D), at 6 hr post-infection (E–F), or at 24 hr post-infection (G). Expression of the indicated genes relative to GAPDH control was quantified by qPCR. Mean ± SD for four replicates. *p-value < 0.01, **p-value < 0.001, ***p-value < 0.0001, unpaired two-tailed t-test.
Figure 6 with 1 supplement
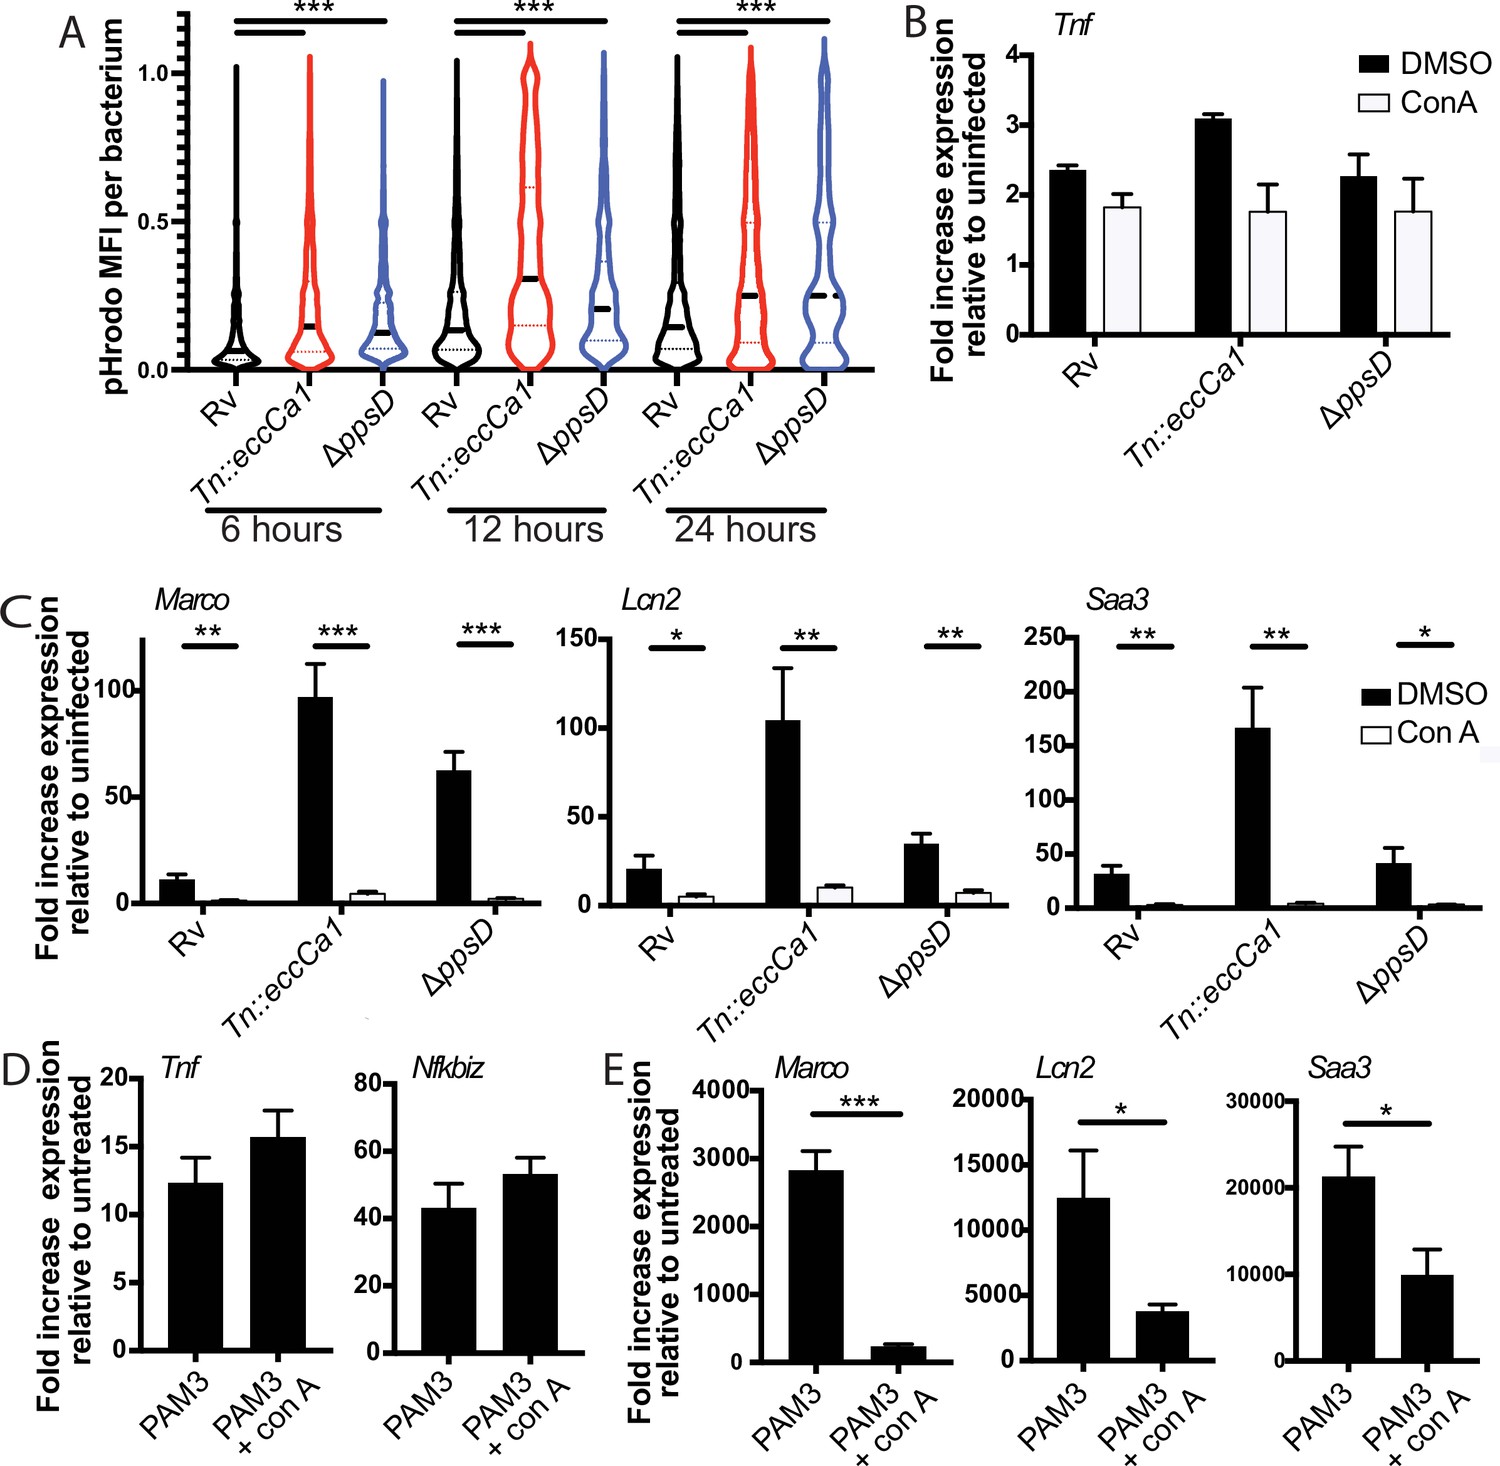
Full activation of the endosome-specific TLR2 response is dependent upon phagosome acidification.
(A) The indicated Mycobacterium tuberculosis (Mtb) strains expressing GFP were labeled with pHrodo and used to infect C57BL/6J bone marrow-derived macrophages (BMDM) at an MOI of 3:1. After 4 hr, cells were washed to remove extracellular bacteria. Cells were fixed at 6, 12, and 24 hr post-infection and imaged. Bacteria were identified based on GFP signal, and pHrodo mean fluorescence intensity was measured around each bacterium. A minimum of 1703 bacteria were analyzed per group. (B–C) C57BL/6J BMDM were pre-treated with concanamycin A 50 µM, then infected with the indicated Mtb strains at an MOI of 5:1 (B) or 2:1 (C). (C, D) C57BL/6J BMDM were pre-treated with concanamycin A 50 µM, then stimulated with PAM3CSK4 1 mu-g/ml. RNA was harvested at 6 (B), 24 , (C, E) or 2 hr (D) post-infection. qPCR was performed to quantitate expression of the indicated genes relative to GAPDH control. Mean ± SD for four replicates. #p-value < 0.03, *p-value < 0.01, **p-value < 0.001, ***p-value < 0.0001, unpaired two-tailed t-test. (A–E) One of three independent experiments.
Figure 6—figure supplement 1
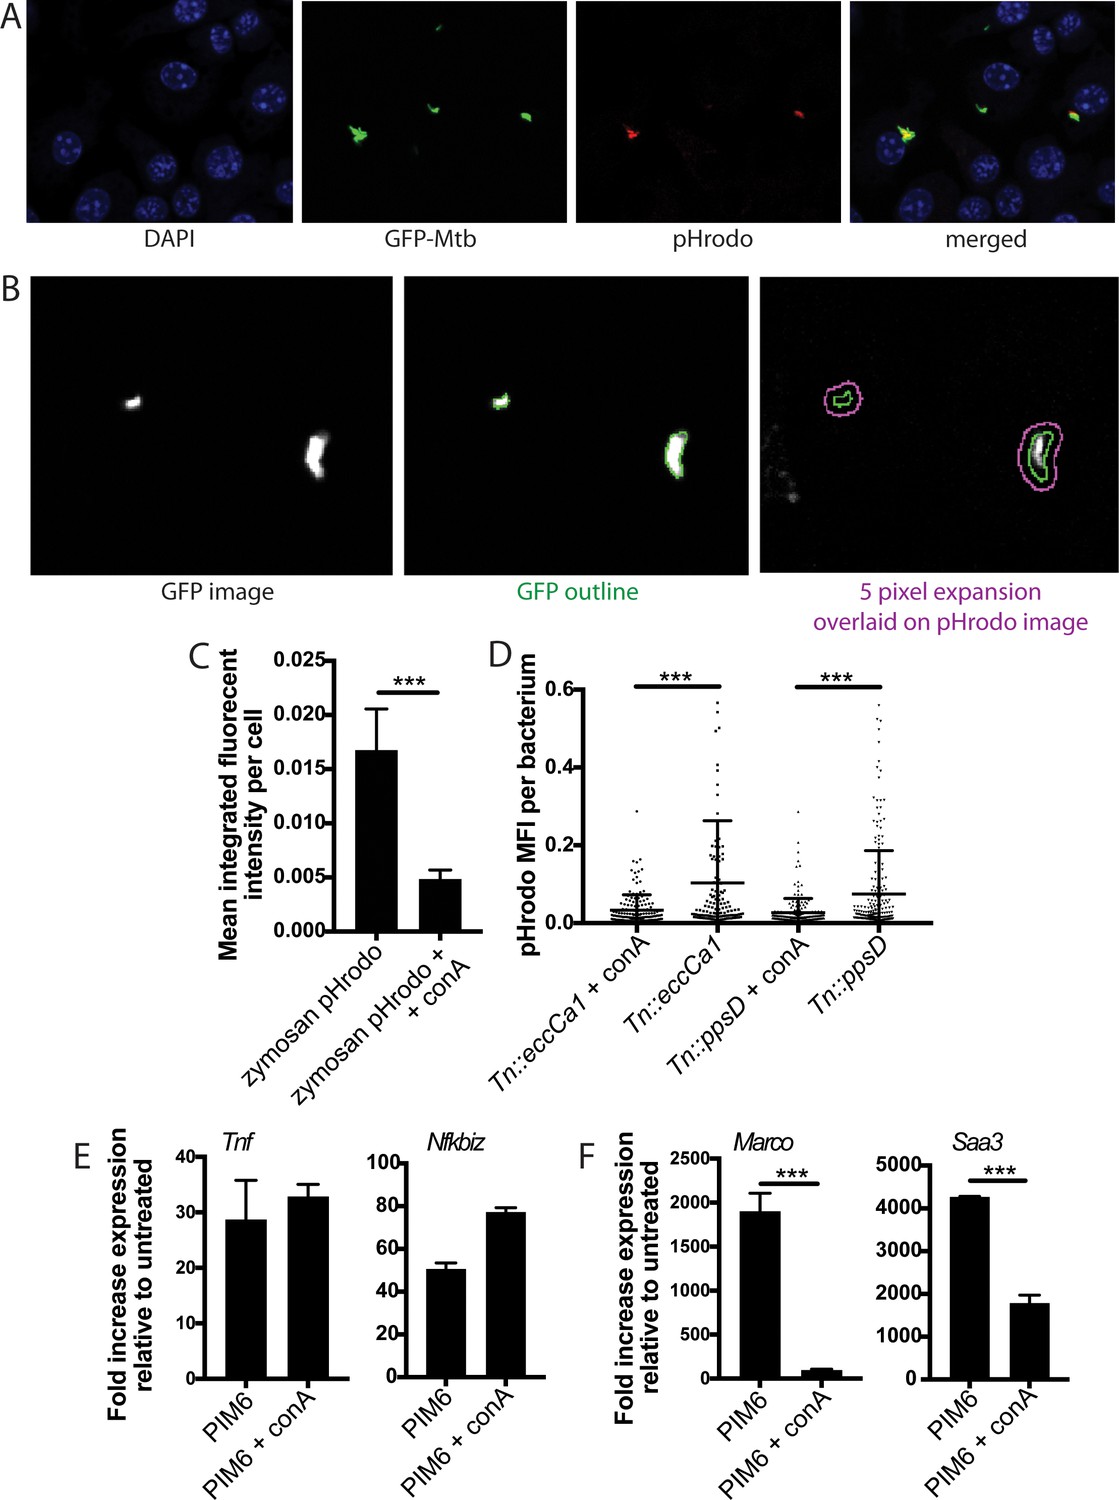
Concanamycin A blocks phagosome acidification.
(A–B) C57BL/6J bone marrow-derived macrophages (BMDM) were infected with pHrodo-labeled GFP-Mycobacterium tuberculosis (Mtb). (A) Example DAPI, GFP, and pHrodo images. (B) CellProfiler automated identification of GFP bacteria and expansion of five pixels around the GFP outline to capture all relevant pHrodo signal. (C–D) C57BL/6J BMDM were pre-treated with concanamycin A (50 µM) or DMSO carrier as indicated. (C) pHrodo-labeled zymosan bioparticles were then added to the cells in BMDM media containing concanamycin A or carrier. Phagocytosis was allowed to proceed for 2 hr; cells were then fixed and imaged using a Zeiss Elyra PS.1 with a 20 × objective. CellProfiler image analysis was used to quantitate integrated fluorescent intensity per cell. (D) The indicated Mtb strains expressing GFP were labeled with pHrodo and used to infect C57BL/6J BMDM at an MOI of 3:1. Cells were fixed 24 hr post-infection and imaged. Bacteria were identified based on GFP signal, and pHrodo mean fluorescence intensity was measured around each bacterium (as in Queval et al., 2017). A minimum of 128 bacteria (D) were analyzed per group. Mean ± SD for five fields per condition. (E–F) C57BL/6J BMDM were pre-treated with concanamycin A (50 µM) or carrier for 15 min, then treated with PIM6 (1 mu-g/ml) in the presence of concanamycin A (50 M). RNA was harvested at 2 (E) or 24 hr (F) and expression of the indicated genes relative to GAPDH control was quantified by qPCR. Mean ± SD of four replicates. ***p-value < 0.0001, unpaired two-tailed t-test.
Figure 7 with 1 supplement
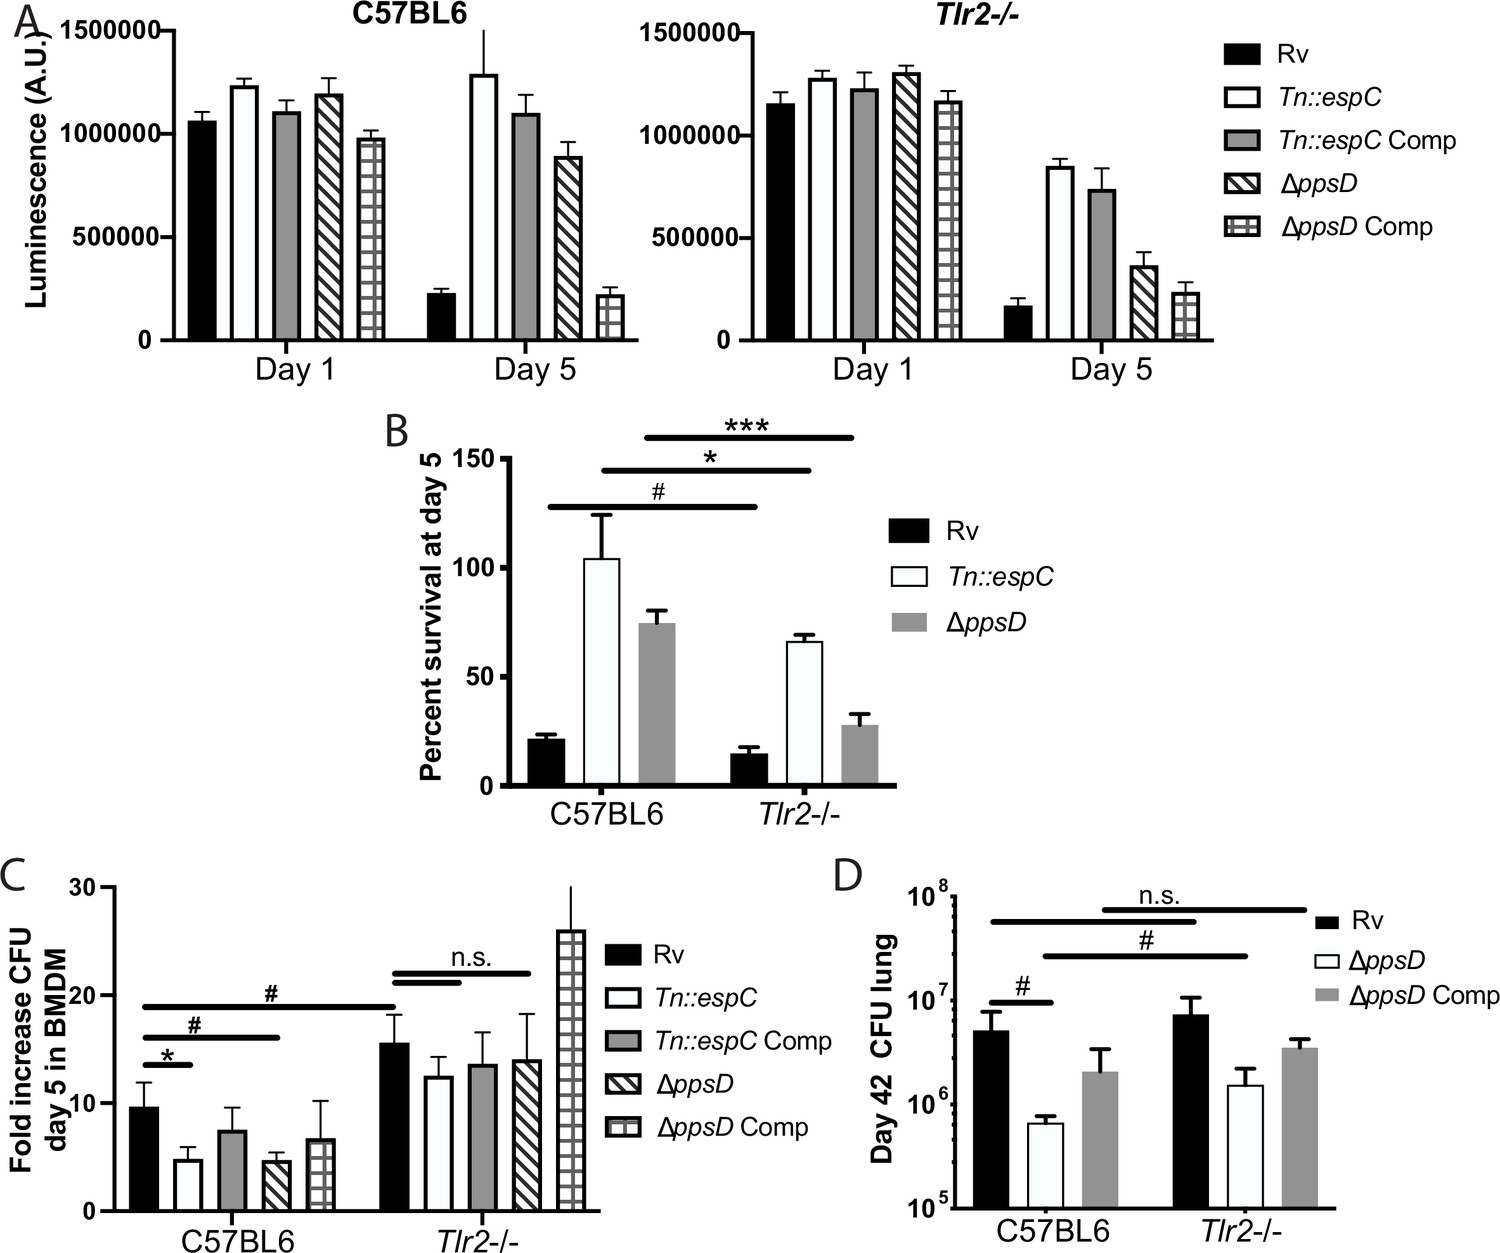
Phthiocerol dimycocerosate (PDIM) and ESX modulate TLR2-dependent infection outcomes in macrophages and mice.
(A–C) The indicated bone marrow-derived macrophages (BMDM) were infected with the indicated Mycobacterium tuberculosis (Mtb) strains at an MOI of 5:1 (A–B) or 2:1 (C). (A–B) Cell survival was determined using a CellTiterGlo luminescence assay at the indicated days post-infection. (C) At day 5 post-infection, cells were washed, lysed, and plated for CFU. (A–C) Mean ± SD for four replicates. #p-value < 0.05, *p-value < 0.01 unpaired two-tailed t-test. (D) C57BL/6J or Tlr2-/- mice were infected with ~200 cfu of the indicated Mtb strains; 42 days post-infection, mice were euthanized and lungs were harvested and plated in serial dilutions to determine CFU Mean ± SD for five mice per condition (one C57BL6/ppsD plate discarded for mold contamination – four replicates for that condition). #p-value < 0.05, unpaired two-tailed t-test. (A–C) One of three independent experiments, (D) one of two independent experiments.
Figure 7—figure supplement 1

The indicated mouse strains were infected with the indicated Mycobacterium tuberculosis (Mtb) strains via low-dose aerosol infection.
(A) Lungs were harvested after infection and plated on day 0 for CFU. Mean ± SD for three to five mice per condition. (B–C) Lungs were fixed in formalin, embedded in paraffin, and sectioned. Sections were stained by hematoxylin and eosin and imaged on a TissueFACS Slide Scanner using a 20× objective. (B) Overview of all fields for a sectioned lung. (C) Individual fields of view for areas of cellular infiltration in each lung. Arrows: Areas of dense inflammatory cell infiltration. Arrow heads: areas of foamy macrophages. #p-value < 0.05, unpaired two-tailed t-test.
Additional files
-
Supplementary file 1
Table of FPKM values for RNAseq data used to generate the heatmap for Figure 1.
- https://cdn.elifesciences.org/articles/73984/elife-73984-supp1-v2.xlsx
-
Transparent reporting form
- https://cdn.elifesciences.org/articles/73984/elife-73984-transrepform1-v2.pdf
Download links
A two-part list of links to download the article, or parts of the article, in various formats.
Downloads (link to download the article as PDF)
Open citations (links to open the citations from this article in various online reference manager services)
Cite this article (links to download the citations from this article in formats compatible with various reference manager tools)
Mycobacterium tuberculosis canonical virulence factors interfere with a late component of the TLR2 response
eLife 10:e73984.
https://doi.org/10.7554/eLife.73984


