Xbp1 and Brachyury establish an evolutionarily conserved subcircuit of the notochord gene regulatory network
- Department of Molecular Pathobiology, New York University College of Dentistry, United States
Figures
Figure 1
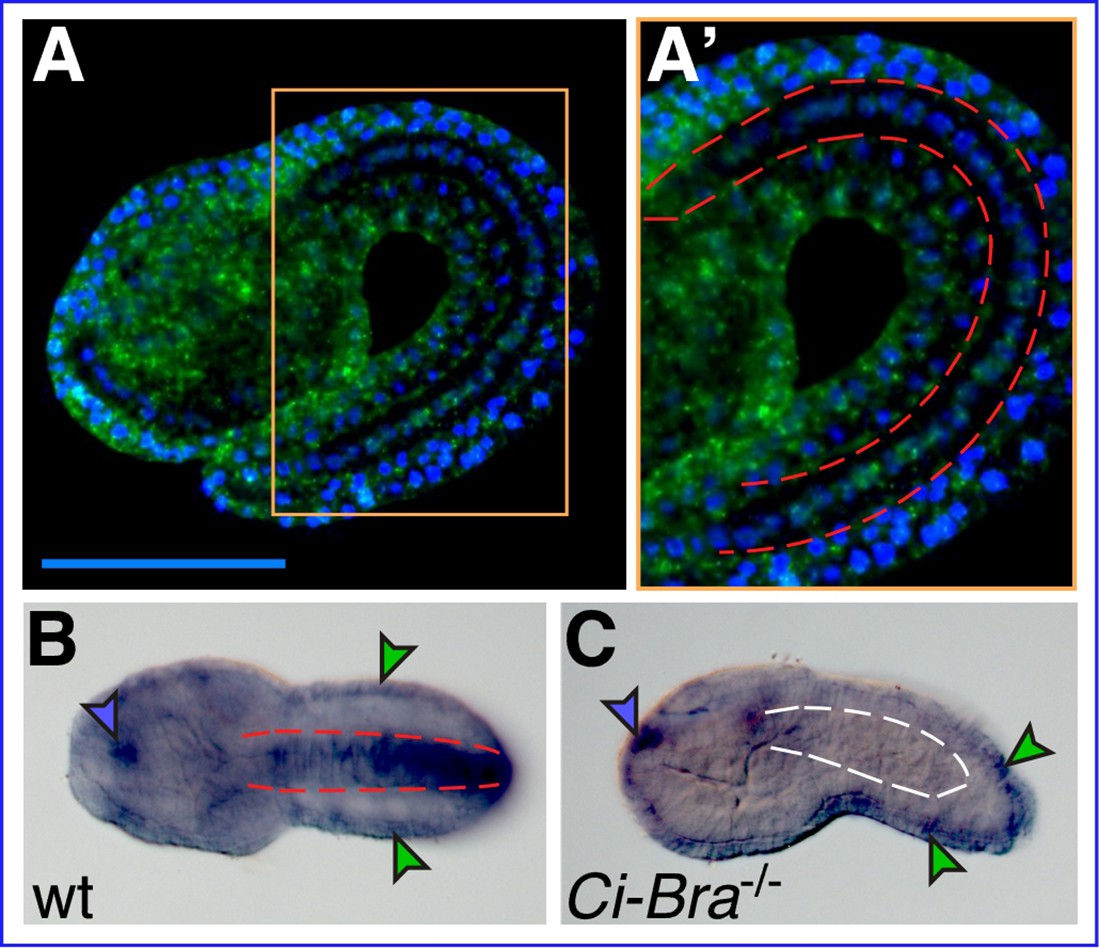
Xbp1 notochord expression is dependent upon Ci-Bra.
(A) Whole-mount in situ hybridization (WMISH) of a wild-type Ciona robusta embryo at the mid-tailbud II stage (Hotta et al., 2007) with a fluorescent antisense RNA probe specific for Cr-Xbp1. Hybridization signal (green) is visible in both epidermis and notochord cells. (A’) Higher-magnification view of the area boxed in light orange in (A). The notochord is delineated on both sides by dashed red lines. Nuclei are stained by DAPI (blue; see Materials and methods). Scale bar: 50 µm. (B) WMISH of a wild-type C. robusta embryo (dorsal view), carried out with a digoxigenin-labeled antisense RNA probe specific for Cr-Xbp1. Staining is visible in epidermis (green arrowheads), anterior sensory vesicle (blue arrowhead), and notochord (delineated by dashed red lines). Both RNA probes were synthesized from EST 26p13. (C) WMISH of a Ci-Bra-/- mutant C. robusta embryo (lateral view) with the same probe described in (B). Staining is unaffected in the epidermis (green arrowheads) and sensory vesicle (blue arrowhead), but is lost from the disrupted notochord territory (delineated by dashed white lines).
Figure 2 with 1 supplement
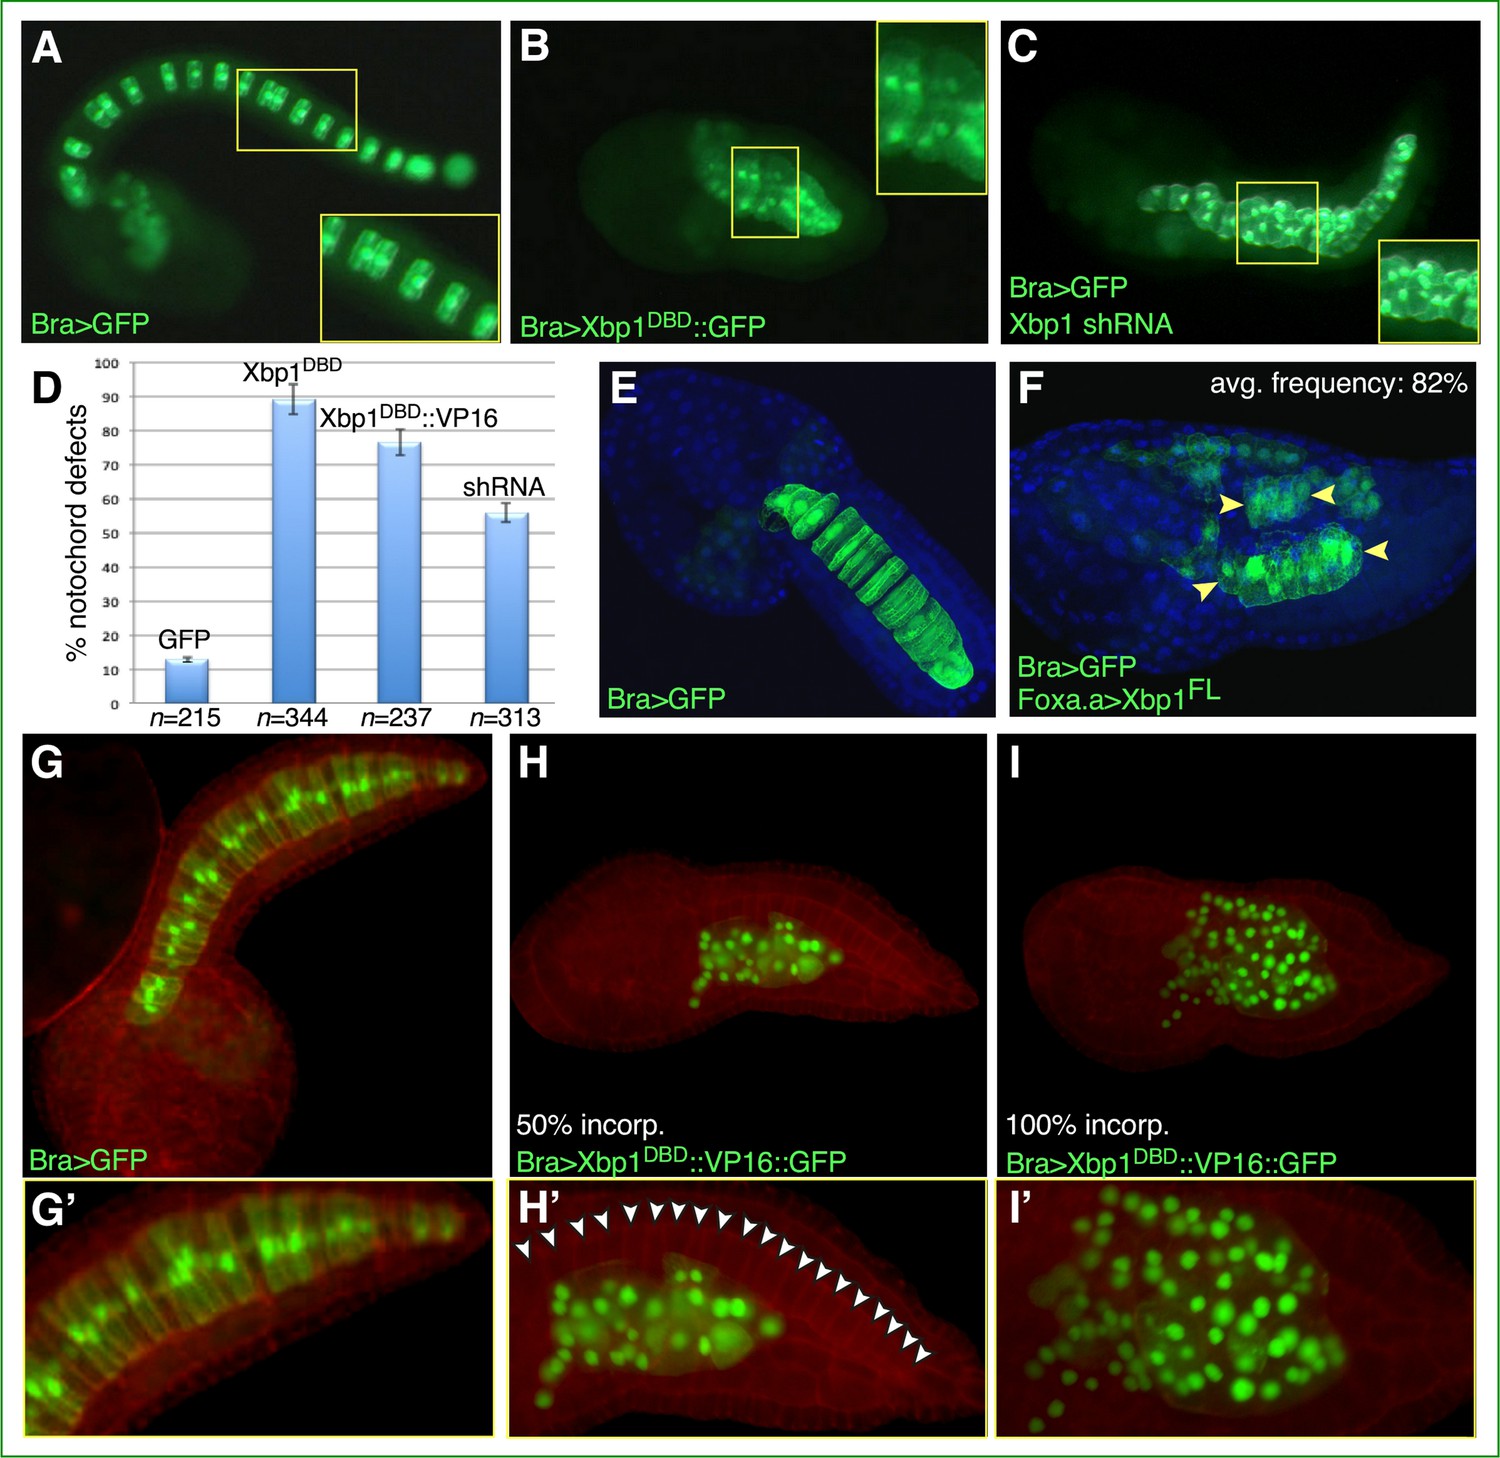
Functional analysis of Ciona Xbp1.
Microphotographs of late-tailbud II (A–C), mid-tailbud I (E, F), and late-tailbud I (G–I’) C. robusta transgenic embryos, electroporated at the 1-cell stage with 50 µg of each of the plasmids indicated in the bottom-left corner of each panel. (A, E, G) Control embryos electroporated with the notochord marker plasmid Bra>GFP, which does not interfere with development (Corbo et al., 1997). (B) Embryo electroporated with Bra>Xbp1DBD::GFP, showing a short tail due to an arrest in notochord development. (C) Embryo co-electroporated with Bra>GFP and a construct able to express Xbp1 shRNA in the notochord (see Materials and methods), incubated in parallel with the embryos in (A) and (B), showing a nearly complete tail elongation but defective notochord formation. Insets in (A–C) show higher-magnification views of the regions of the notochord boxed by yellow rectangles; all insets display approximately 10 notochord cells, even though in (A) mosaic incorporation of the marker plasmid allows clear visualization of only 6 of the 10 selected notochord cells. (D) Graph displaying the percentage of embryos showing defective notochord development in Bra>GFP control embryos (abbreviated as GFP) and in transgenic embryos carrying Bra>Xbp1DBD::GFP (abbreviated as Xbp1DBD), Bra>Xbp1DBD::VP16::GFP (abbreviated as Xbp1DBD::VP16), or a Cr-Xbp1 shRNA construct (abbreviated as shRNA). The total number (n) of fully developed transgenic embryos that were scored per each transgene is reported underneath their respective bars. (E, F) Effects of the ectopic/overexpression of Xbp1 in CNS, notochord, and endoderm driven by the Foxa.a promoter region. Embryos were stained with DAPI. Avg., average. (H, I) Representative embryos carrying the Bra>Xbp1DBD::VP16::GFP transgene, stained with rhodamine-phalloidin (red). (H) Embryo displaying incorporation (incorp.) of the fluorescent transgene in 50% of the notochord cells. (I) Representative embryo showing transgene incorporation in the entire notochord lineage (100% incorp.) (G’, H’, I’) Higher-magnification views of the notochord territory of the embryos in (G), (H), and (I), respectively. In (H’), white arrowheads indicate the 20 notochord cells (out of 40 total) that have not incorporated the transgene and display a normal morphology.
Figure 2—figure supplement 1
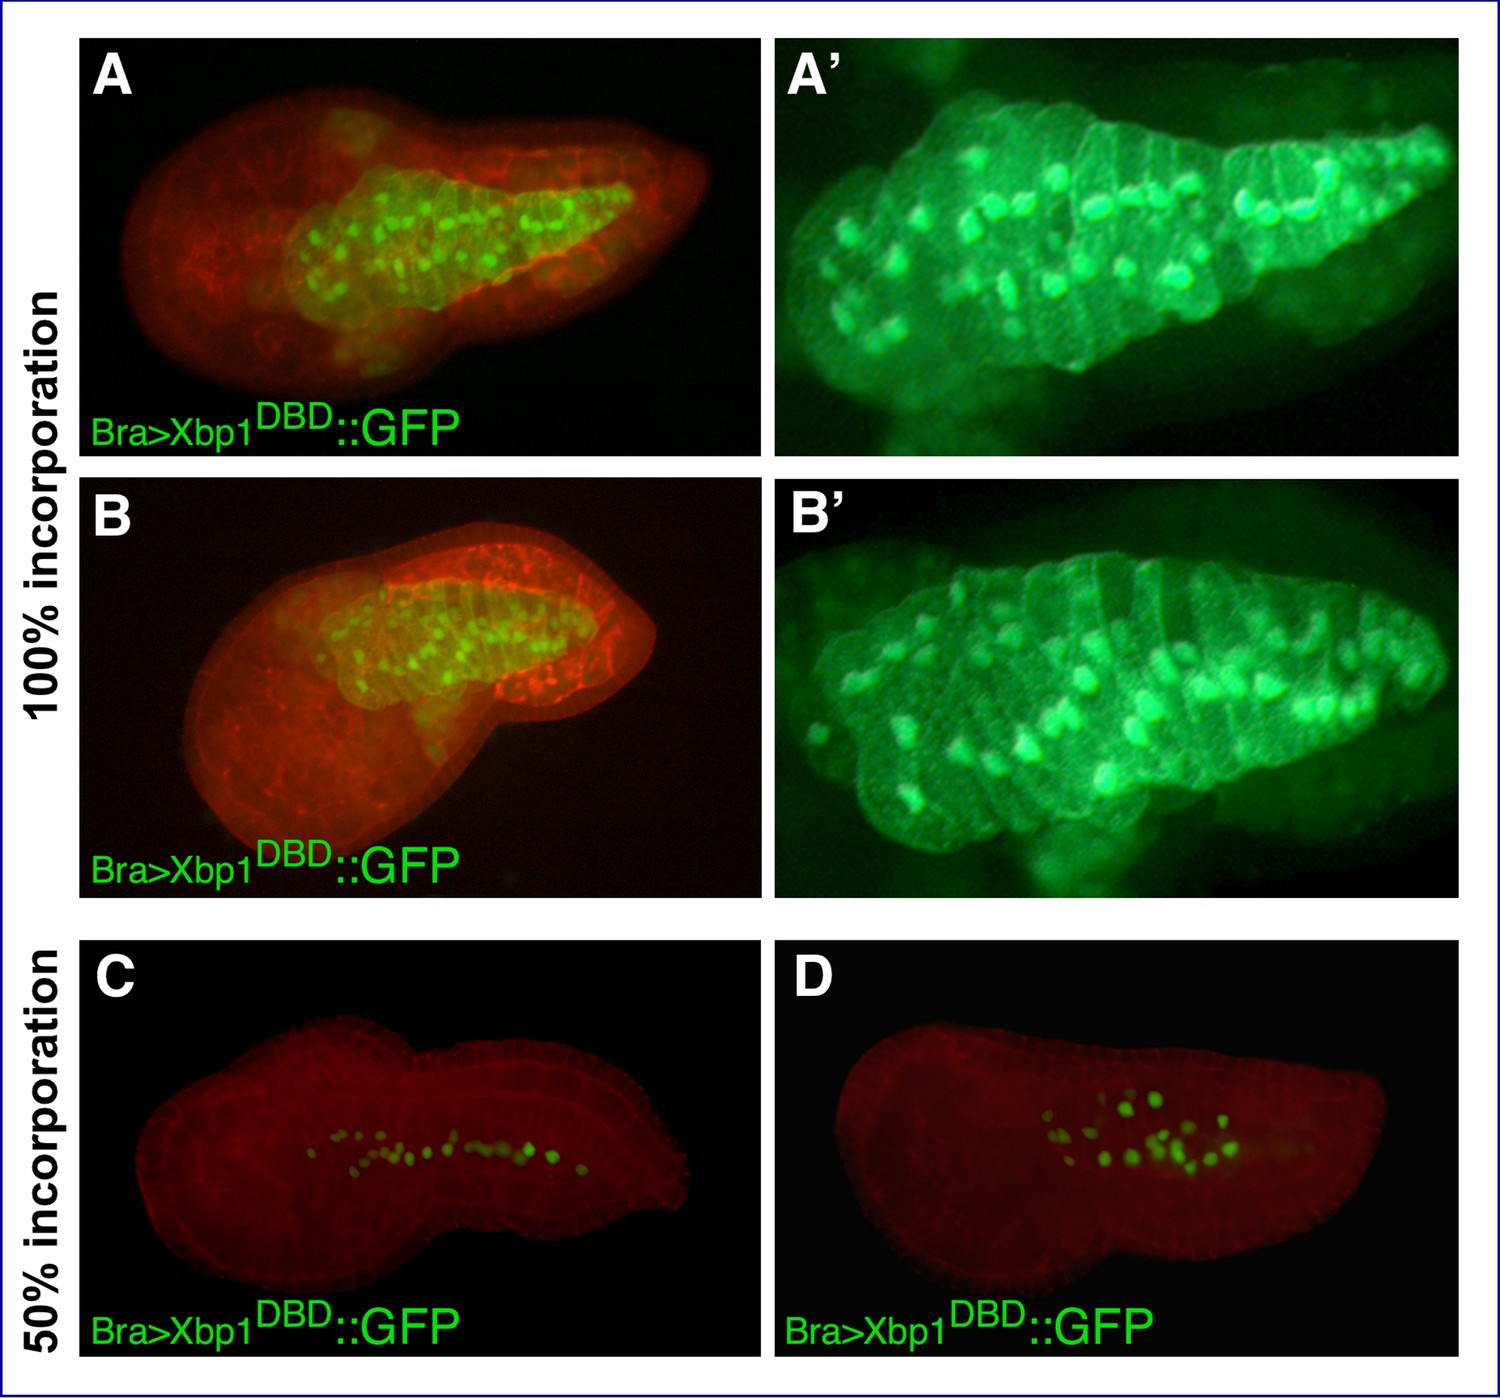
Additional images of Xbp1DBD and Xbp1DBD::VP16 transgenic embryos.
Confocal microphotographs of Ciona embryos electroporated with the transgenes indicated in each panel. Anterior is to the left. (A–B’) Transgenic embryos displaying 100% incorporation of the transgene, stained with rhodamine-phalloidin; merged images from red and green channels (A, B) and higher-magnification views of the notochord cells in the green channel (A’, B’). (C, D) Representative transgenic embryos displaying 50% transgene incorporation, stained with rhodamine-phalloidin.
Figure 3 with 3 supplements

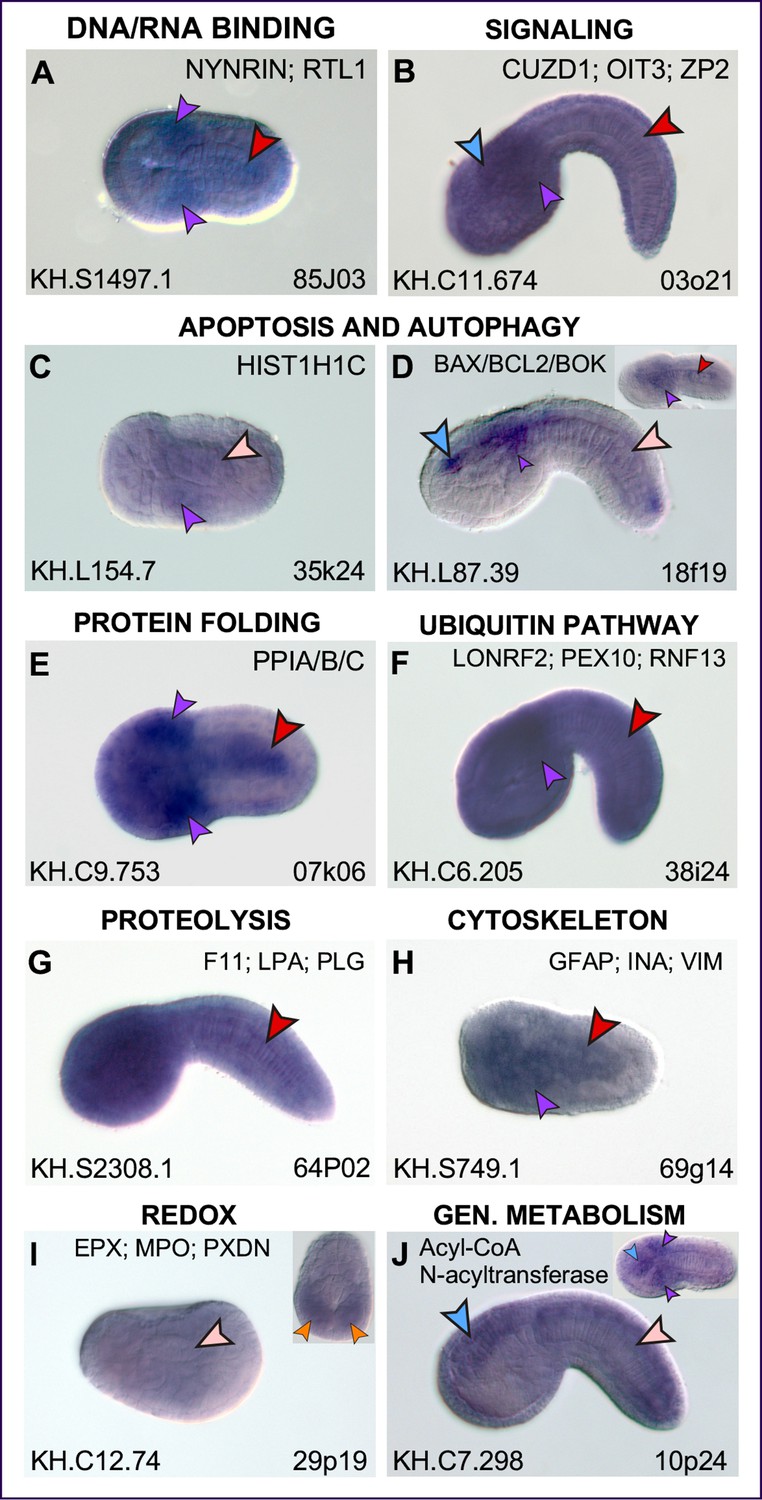
Expression patterns of putative Cr-Xbp1 notochord targets.
(A–X) Whole-mount in situ hybridization (WMISH) of Ciona embryos ranging from early gastrula to late tailbud for the genes reported on top of each panel, with digoxigenin-labeled antisense RNA probes synthesized from either the ESTs reported in the lower-right corner of each panel or from gene-specific PCR-amplified products. Gene models are indicated in the bottom-left corners. Insets show either embryos at different developmental stages (D, P, V, W, X) or optical cross sections of the tails of embryos hybridized with the same probes as those in the main panels (G, M, S, T, U). Inset in (N) shows a higher magnification of the trunk region of the same embryo, to display staining in the anterior-most notochord cells. Gene ontologies are reported on top of the panel(s) that they refer to (Supplementary file 1). Stained territories are denoted by arrowheads, color-coded as follows: red, notochord; blue, CNS; green, epidermis; yellow, endoderm; purple, mesenchyme; orange, muscle; aqua, bipolar tail neuron(s). (Y) Pie graph summarizing the gene ontologies of 53 of the 71 potential Cr-Xbp1-downstream genes expressed in the Ciona notochord. (Z) Schematic representation of the Bra-Xbp1 subcircuit identified by this study and of the processes that it influences in Ciona. Filled arrowheads indicate activation of target gene expression, light yellow arrowheads indicate either positive or negative regulation of the genes belonging to each group; slanting parallel lines symbolize that the interactions could be either direct or indirect.
Figure 3—figure supplement 1
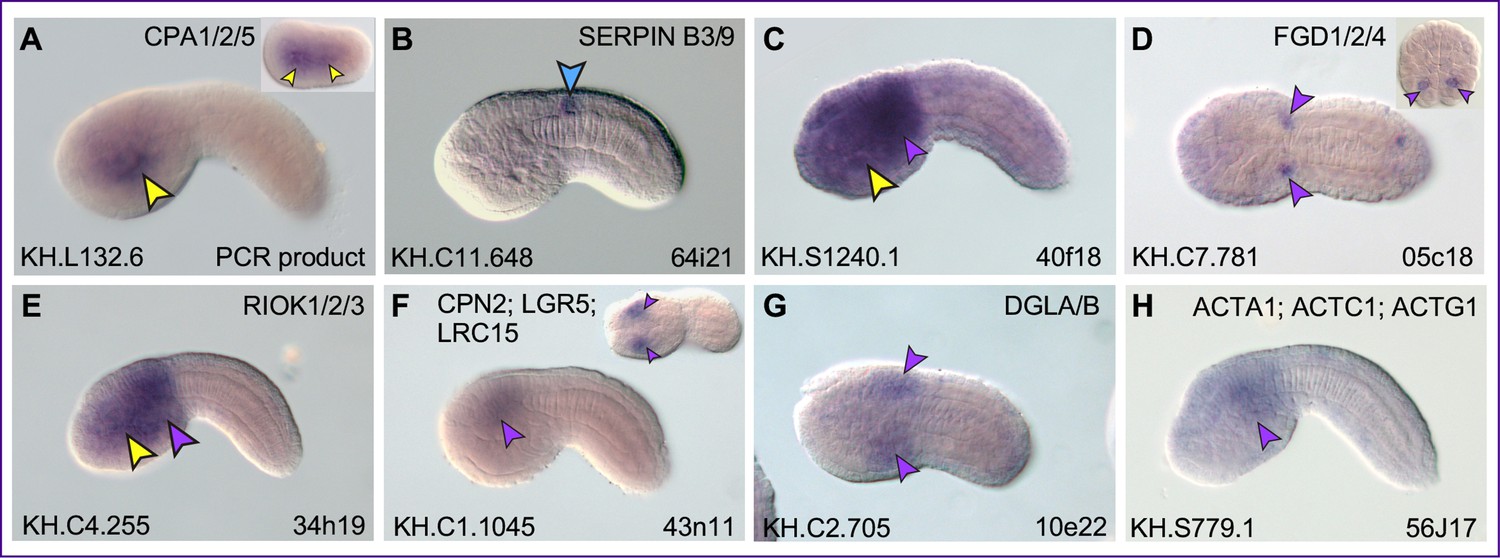
Additional expression patterns of putative Cr-Xbp1 notochord targets.
(A-J) Whole-mount in situ hybridization (WMISH) of late gastrula to late-tailbud Ciona robusta embryos for the genes reported on top of each panel, carried out with digoxigenin-labeled antisense RNA probes synthesized from either the ESTs reported in the lower-right corner of each panel or from gene-specific PCR-amplified regions. Gene models are indicated in the bottom-left corners. Insets show expression at different developmental stages. Gene ontologies are reported on top of the panel(s) that they refer to. Stained territories are denoted by arrowheads, color-coded as in Figure 3; light pink arrowheads indicate weak notochord staining.
Figure 3—figure supplement 2
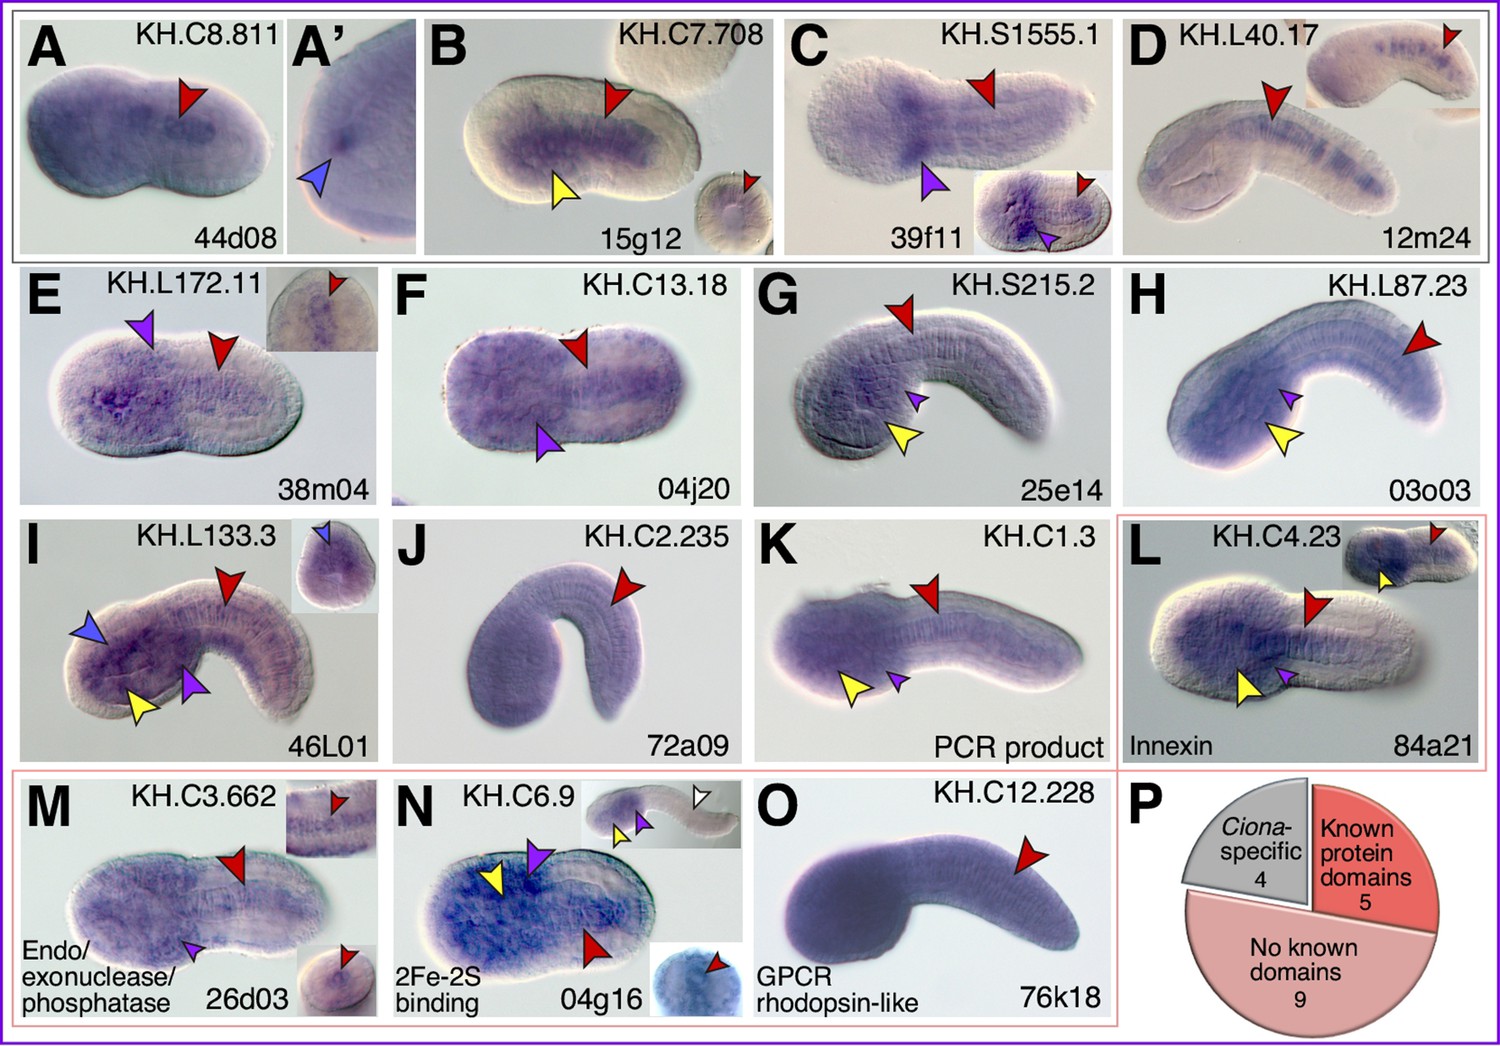
Ciona-/ascidian-specific notochord genes regulated by Xbp1.
(A–O) Whole-mount in situ hybridization (WMISH) of Ciona robusta embryos ranging from early gastrula (inset in B) to mid-tailbud II (top inset in N) for the genes reported on top of each panel, carried out with antisense RNA probes synthesized from either the ESTs reported in the lower-right corner of each panel or from PCR-amplified gene-specific regions. (P) These genes currently appear to be either Ciona-specific (gray slice) or present only in Ciona and other ascidian species (i.e., ascidian-specific; light pink and coral red sections). A fraction of the ascidian-specific genes encode for proteins that contain recognizable domains (coral red section), while the remaining genes do not contain recognizable domains. Insets show different stages (A’, B, C, D, I, L, M, N) and/or optical cross sections of the tail (inset in E and bottom insets in M, N). Top inset in (M) shows a different plan of focus of the late-tailbud II embryo shown in partial cross section in the bottom inset. Arrowheads are color-coded as in Figure 3; the white arrowhead in the top inset in (N) indicates lack of notochord staining.
Figure 3—figure supplement 3
Putative Xbp1 targets expressed in tissues other than the notochord.
Whole-mount in situ hybridization (WMISH) of Ciona robusta embryos ranging from 76 cell (inset in D) to mid-tailbud II (H) for the genes reported on top of each panel, carried out with antisense RNA probes synthesized from either the ESTs reported in the lower-right corner of each panel or from PCR-amplified gene-specific regions. Expression is detected in trunk endoderm (A, C), CNS (B), and in regions of the mesenchyme of variable extent (C–H). Arrowheads are color-coded as in Figure 3.
Figure 4 with 2 supplements
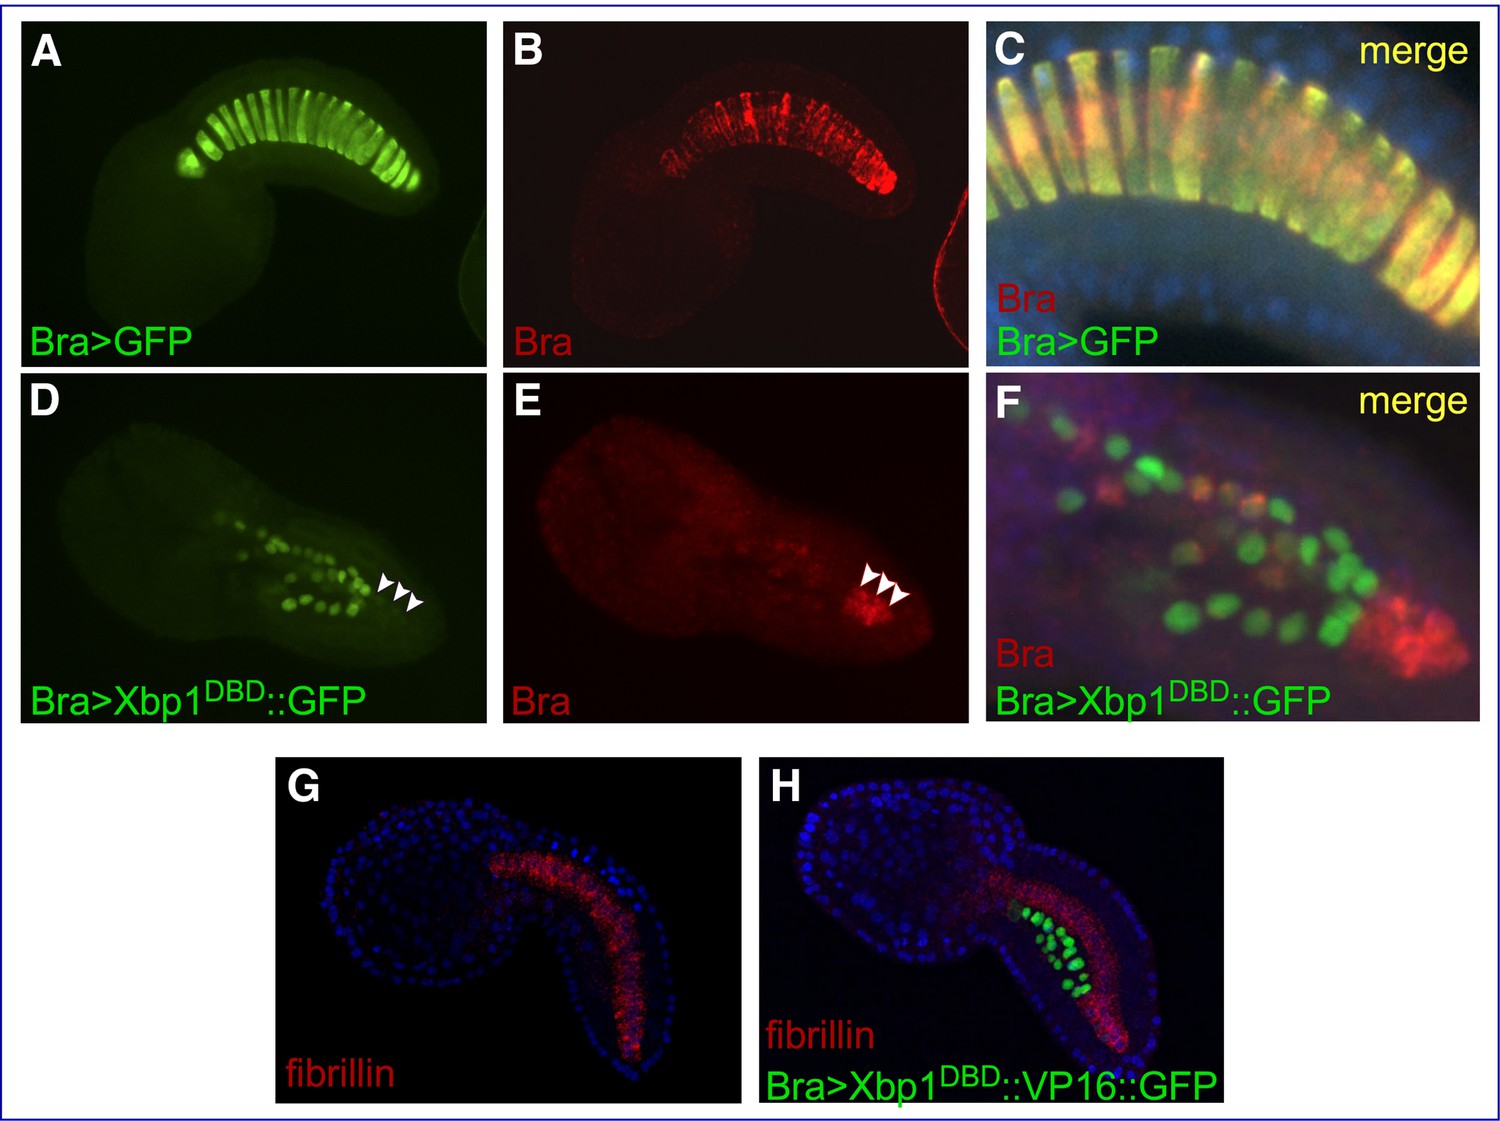
Effects of Cr-Xbp1 transgenes on the expression of Ci-Bra and fibrillin.
Mid-tailbud I C. robusta embryos electroporated with the transgenes reported in green font and hybridized in situ with fluorescent antisense RNA probes (red font). (A, B) Bra>GFP transgenic embryo, photographed in the green (A) and red (B) channels. (C) Higher-magnification view of the notochord of the embryo in (A, B), obtained after merging the green and red images and the blue channel (DAPI). The Bra>GFP plasmid (green) has been incorporated in 20 of the definitive 40 notochord cells (50% incorporation) (A). Ci-Bra transcripts (red) are detected in all 40 notochord cells (B, C). (D, E) Bra>Xbp1DBD::GFP transgenic embryo displaying mosaic incorporation, photographed in the green (D) and red (E) channels. White arrowheads indicate a cluster of non-transgenic notochord cells that express Ci-Bra (red). (F) Higher-magnification view of the notochord of the embryo in (D, E), obtained after merging the green and red images. Expression of Ci-Bra is unperturbed in non-transgenic cells (red) and downregulated in transgenic notochord cells (green). (G, H) Control wild-type (G) and transgenic Bra>Xbp1DBD::VP16::GFP (H) mid-tailbud I embryos, hybridized in situ with a TRITC-labeled antisense RNA probe for fibrillin (gene model: KH.C3.225; EST: 02k18) and counterstained with DAPI. The embryo in (H) shows 50% incorporation of the transgene, incomplete notochord intercalation, and downregulation of fibrillin in the transgenic notochord cells.
Figure 4—video 1
X-projection of confocal images of the embryo in Figure 4C.
Figure 4—video 2
X-projection of confocal images of the embryo in Figure 4F.
Figure 5 with 1 supplement
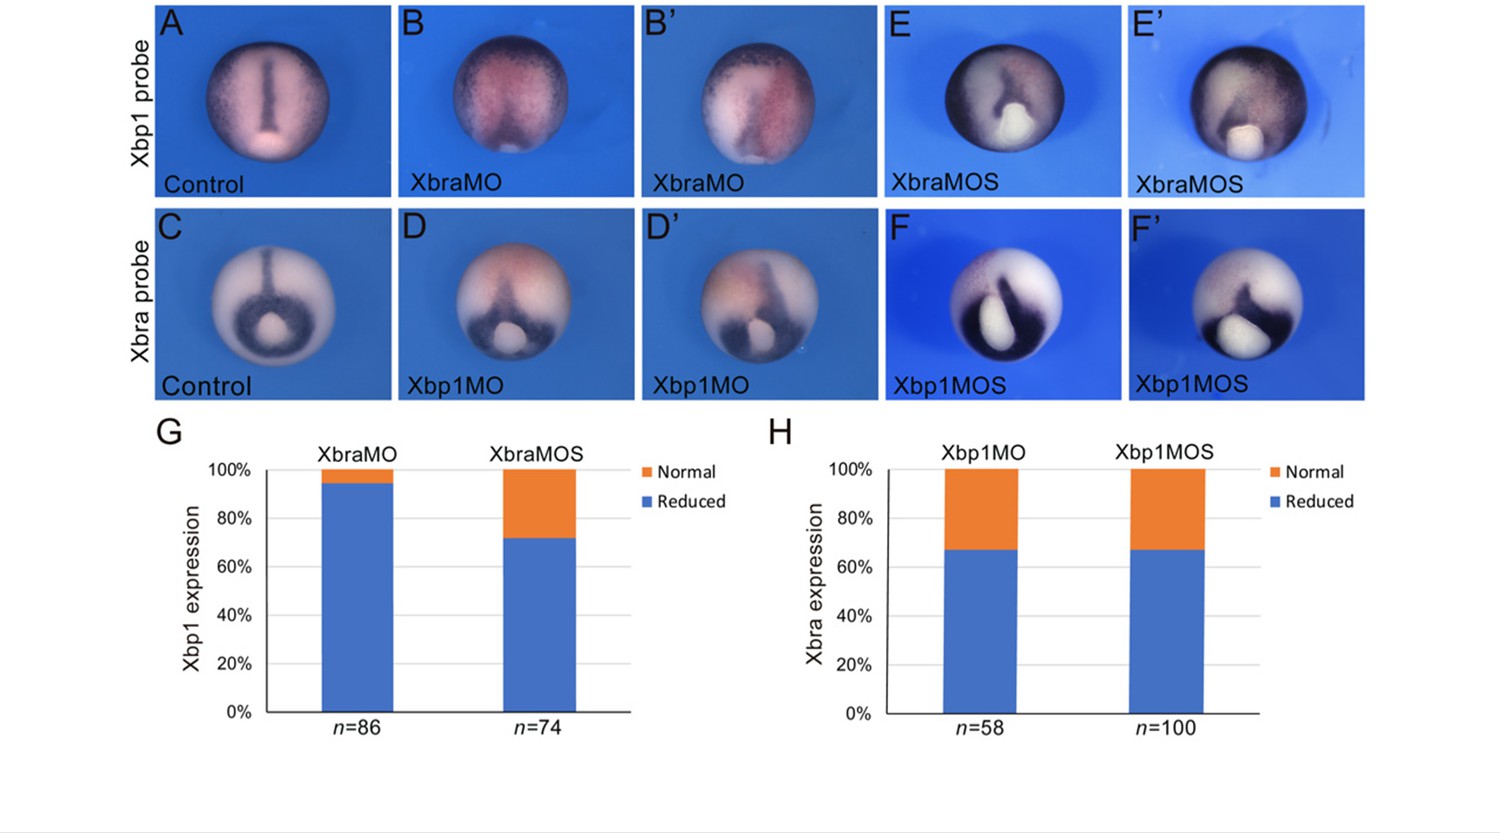
Cross-regulation between Brachyury and Xbp1 in the dorsal mesoderm and developing notochord of Xenopus.
(A–F’) Xenopus laevis embryos at the late gastrula stage (NF stage 12), control (A, C), and morphants (B, B’, D, D’, E, E’, F, F’). Injection of the Xbra translation-blocking MO (XbraMO; Shi et al., 2011) caused a reduction of Xbp1 expression in nearly all embryos analyzed (G). Xbra splice-blocking MO (XbraMOS) resulted in a similar phenotype, although at a lower frequency, affecting ~70% of the morphant embryos (G). Both Xbp1 translation-blocking MO (Xbp1MO; Yuan et al., 2008; Tanegashima et al., 2009) and splice-blocking MO (XbpMOS) caused a similar reduction of Xbra expression in approximately 65% of the morphant embryos (H). Embryos are shown as dorsal/vegetal views, anterior to top. The number of embryos analyzed (n) is indicated underneath each bar.
Figure 5—figure supplement 1
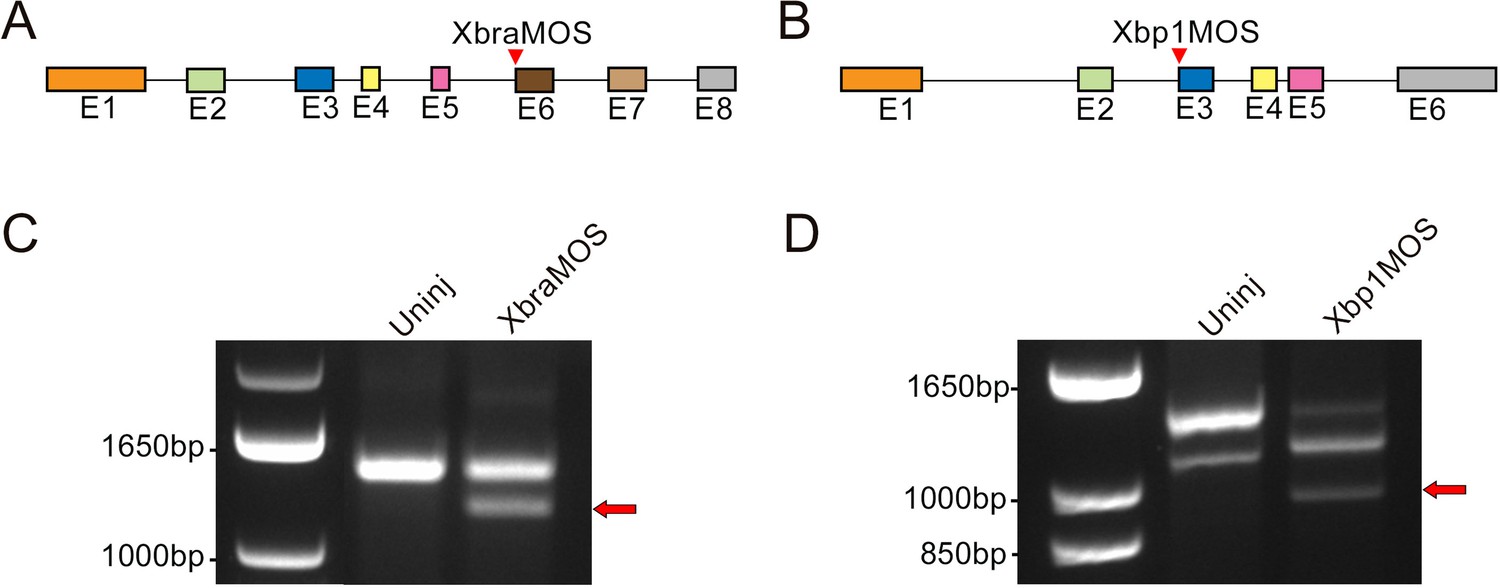
Evaluation of the effects of splice-blocking morpholino oligonucleotides on Xbra and Xbp1 transcripts.
(A, B) Schematic representation of the Xbra (A) and Xbp1 (B) gene structure. Exons (abbreviated as E) are depicted as colored boxes. For each gene, the target site of the splice-blocking MOs (XbraMOS and Xbp1MOS) is indicated (red arrowheads). The RT-PCR primers used to assess the efficacy of the MOs span the entire coding region of each gene. (C) In XbraMOS-injected embryos, a shorter transcript (red arrow) is detected by gel electrophoresis due to the exclusion of exon 6 (E6). (D) In Xbp1MOS-injected embryos, a shorter transcript is produced (red arrow) due to the exclusion of exon 3 (E3). These aberrant transcripts are not detected in uninjected embryos (Uninj). Left lanes in (C, D) contain a standard molecular weight marker for double-stranded DNA (1 Kb Plus DNA Ladder, Thermo Fisher Scientific, Waltham, MA).
-
Figure 5—figure supplement 1—source data 1
Original images of the unedited gels presented in Figure 5—figure supplement 1.
- https://cdn.elifesciences.org/articles/73992/elife-73992-fig5-figsupp1-data1-v2.pdf
-
Figure 5—figure supplement 1—source data 2
Original images of the uncropped gels presented in Figure 5—figure supplement 1 with the relevant bands labeled.
- https://cdn.elifesciences.org/articles/73992/elife-73992-fig5-figsupp1-data2-v2.pdf
Figure 6 with 1 supplement
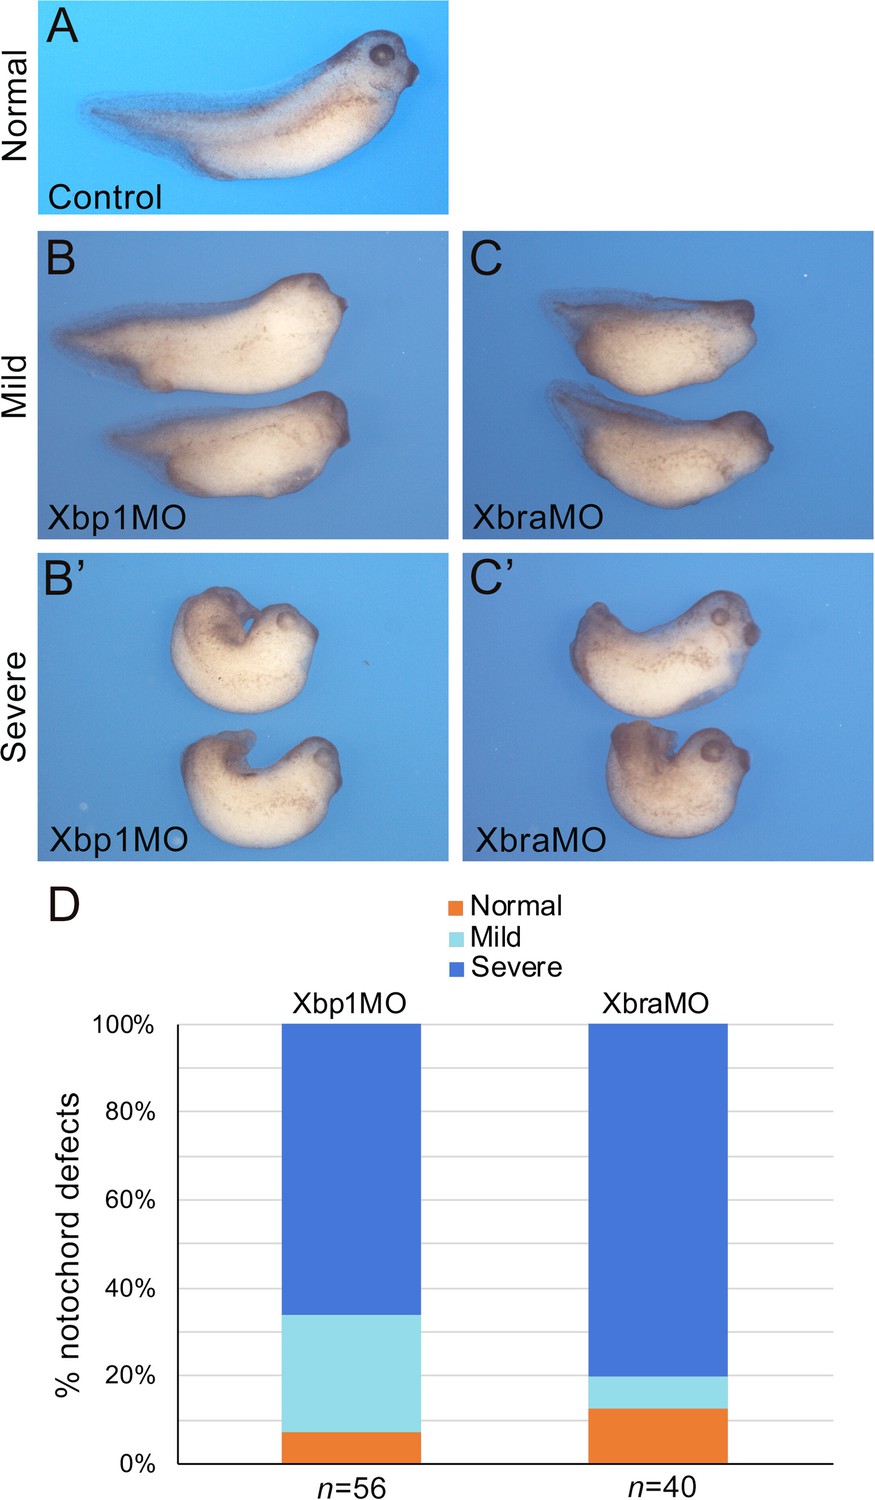
Xbra and Xbp1 morpholino-mediated knockdowns result in axis truncation.
Xbra (XbraMO) and Xbp1 (Xbp1MO) knockdowns cause comparable anterior-posterior axis elongation defects and posterior truncations. (A–C’) Xenopus embryos at NF stage 35/36. (A) Control embryo. (B, C) Morphant embryos injected with Xbp1MO (B) and XbraMO (C), displaying a mild notochord phenotype. (B’, C’) Morphant embryos injected with Xbp1MO (B’) and XbraMO (C’), displaying a severe notochord phenotype. Embryos are shown in lateral views, anterior to the right, dorsal on top. (D) Quantification of the notochord defects in Xbp1MO and XbraMO embryos. The number of embryos analyzed (n) is indicated underneath each bar.
Figure 6—figure supplement 1
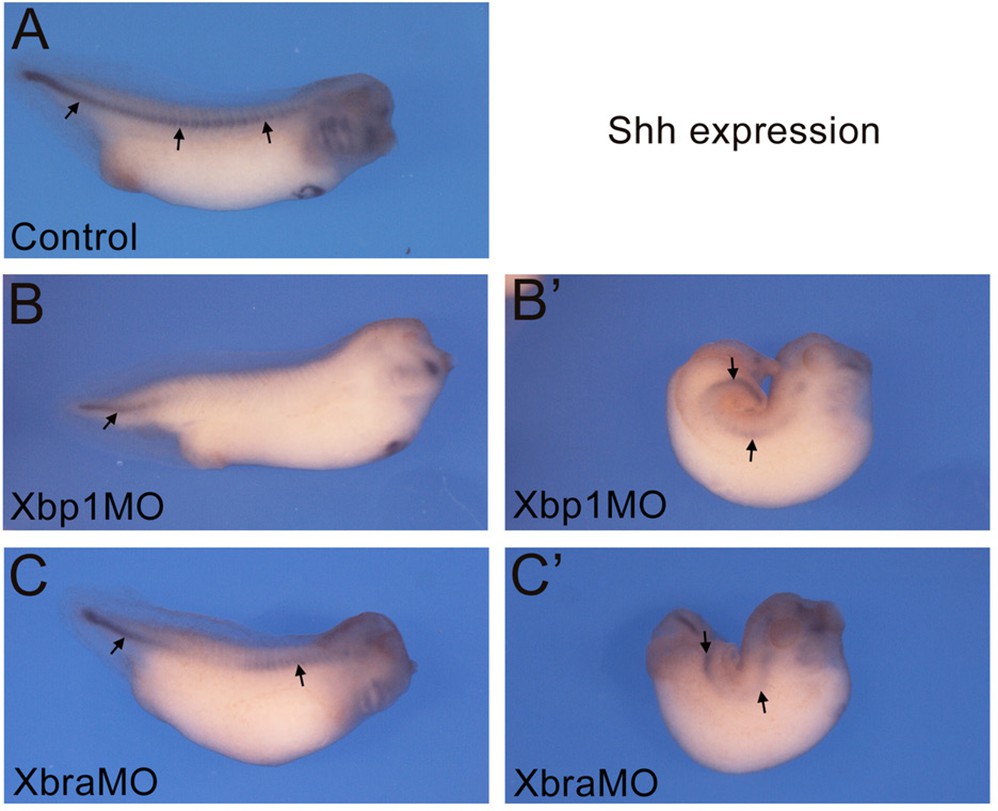
Notochord formation in Xbra and Xbp1 morphant embryos monitored through the expression of Shh.
Xenopus embryos at NF stage 35/36. (A) Control embryo. (B–C’) Morphant embryos injected with Xbp1MO (B, B’) and XbraMO (C, C’), displaying either mild (B, C) or severe (B’, C’) notochord phenotypes. Shh expression (black arrows) is uninterrupted along the entire length of the notochord in control embryos (A), and discontinuous in morphant embryos (B–C’). Embryos are shown in lateral views, anterior to the right and dorsal on top.
Additional files
-
Supplementary file 1
Ciona Xbp1 putative target genes expressed in the notochord.
- https://cdn.elifesciences.org/articles/73992/elife-73992-supp1-v2.xlsx
-
Supplementary file 2
Ciona Xbp1 putative target genes expressed in tissues other than the notochord.
- https://cdn.elifesciences.org/articles/73992/elife-73992-supp2-v2.xlsx
-
Supplementary file 3
Expression of Xenopus orthologs of Ciona Xbp1 notochord target genes.
- https://cdn.elifesciences.org/articles/73992/elife-73992-supp3-v2.xlsx
-
Transparent reporting form
- https://cdn.elifesciences.org/articles/73992/elife-73992-transrepform1-v2.pdf
Download links
A two-part list of links to download the article, or parts of the article, in various formats.
Downloads (link to download the article as PDF)
Open citations (links to open the citations from this article in various online reference manager services)
Cite this article (links to download the citations from this article in formats compatible with various reference manager tools)
Xbp1 and Brachyury establish an evolutionarily conserved subcircuit of the notochord gene regulatory network
eLife 11:e73992.
https://doi.org/10.7554/eLife.73992


