Proper migration of lymphatic endothelial cells requires survival and guidance cues from arterial mural cells
- Uppsala University, Immunology Genetics and Pathology, Sweden
- Department of Molecular Pathophysiology, Institute of Advanced Medical Sciences, Nippon Medical School, Japan
- Institute of Cardiovascular Organogenesis and Regeneration, Faculty of Medicine, WWU Münster, Germany
- Department of Cell Biology, National Cerebral and Cardiovascular Center Research Institute, Japan
- Department of Immunology, Genetics and Pathology, Rudbeck Laboratory, Uppsala University, Sweden
- Department of Medicine Huddinge (MedH), Karolinska Institutet, Campus Flemingsberg, Sweden
- Department of Molecular, Cellular, and Cancer Biology, University of Massachusetts Medical School, United States
Figures
Figure 1 with 8 supplements
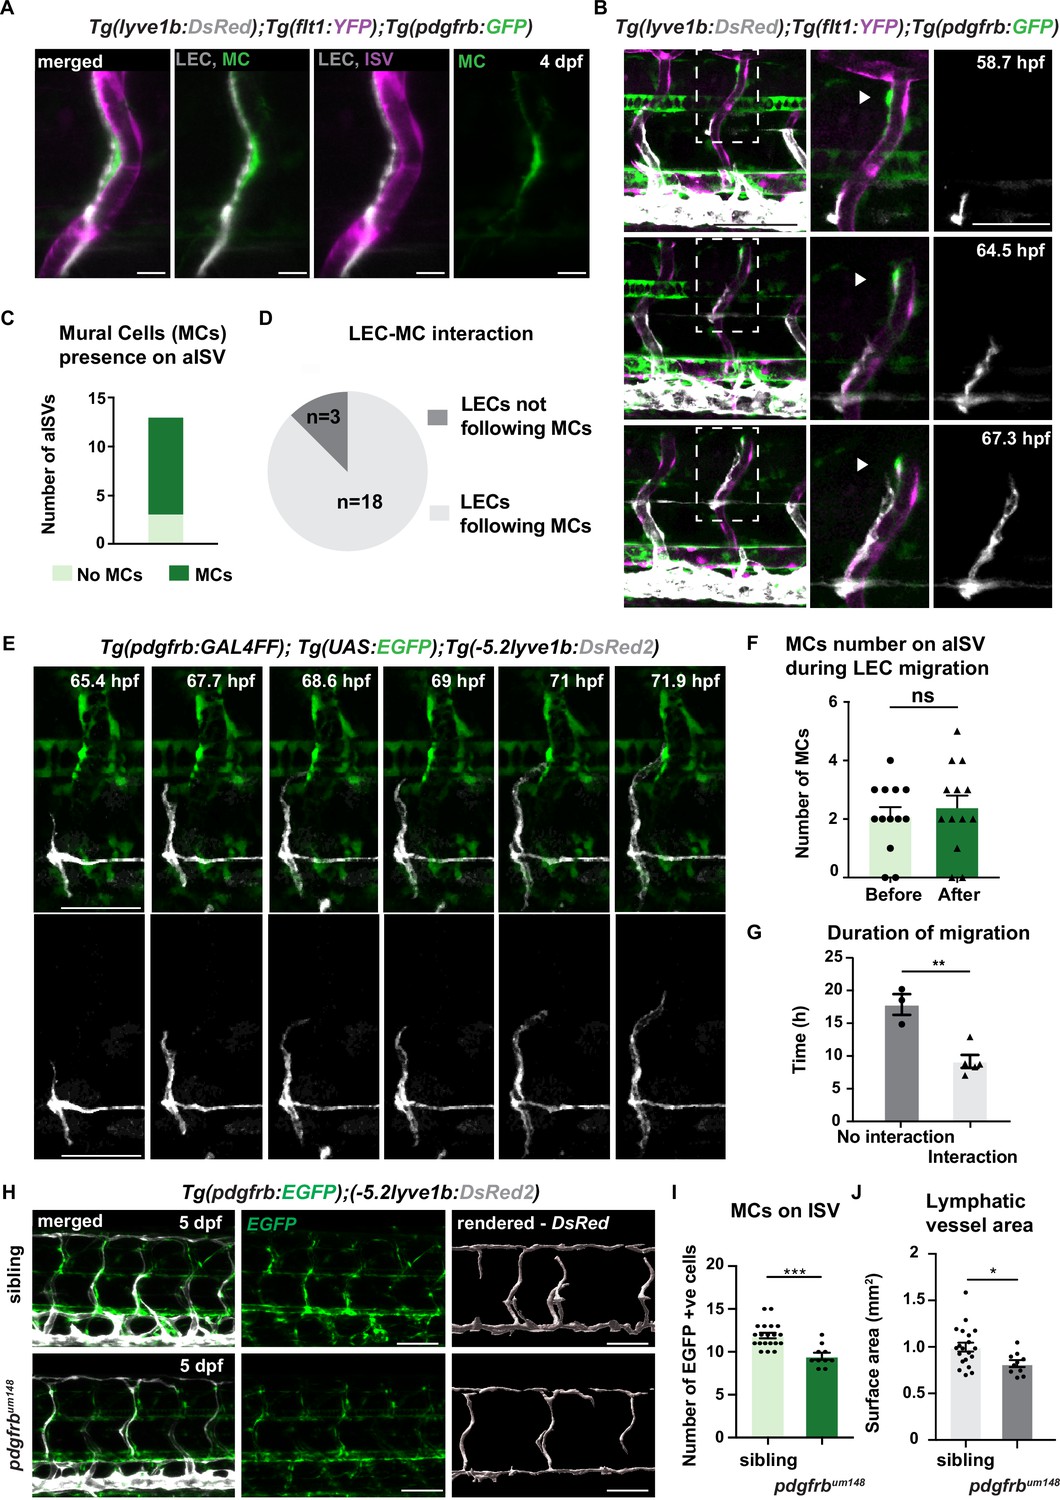
pdgfrbhigh mural cells (MCs) emerge around arterial intersegmental vessels (aISVs) prior to lymphatic endothelial cell (LEC) migration and provide guidance.
(A) Confocal stack image of trunk aISV in 4 dpf Tg(flt1:YFP); Tg(-5.2lyve1b:DsRed2);TgBAC(pdgfrb:GFP) of lymphatic endothelial cells (grey, LEC), arterial intersegments vessels (magenta, aISV) and mural cells (green, MC). Scale bar; 10 μm. (B) Confocal stack images from time-lapse images in the trunk of 2 dpf Tg(flt1:YFP); Tg(-5.2lyve1b:DsRed2); TgBAC(pdgfrb:GFP) embryos (LECs in grey). Boxed regions are enlarged (right panels). Arrowheads indicate pdgfrb+ MCs (green) next to aISVs (magenta during LEC migration). Scale bars; 100 μm or 50 μm (enlarged image). (C) Quantification of aISVs with (n=10) or without (n=3) MCs presence from n=7 embryos when LECs left HM for time lapse videos as in (E). (D) Quantification of LEC and MC interaction during migration (n=10 embryos, with four somites counted per embryo). Migrating following MC n=18, migrating not following MC n=3 from time lapse videos in (E). (E) Confocal stack images from time lapse movies of LEC migration. TgBAC(pdgfrb:GAL4FF);(UAS:GFP) in green and Tg(-5.2lyve1b:DsRed2) in grey. Scale bar: 50 μm (F) Quantification of MC number around aISVs (n=14) from n=7 embryos at the start and end of the migration, quantified from time lapse videos in (E). Data are presented as mean ± SEM, unpaired two-tailed Student’s t-test was used. Ns, no significance. (G) Quantification of duration of LEC migration with (n=5) or without (n=3) contacting MCs from n=6 embryos. Data are presented as mean ± SEM. unpaired two-tailed Student’s t-test was used. **p<0.005 (H) Confocal stack images of Tg(pdgfrb:GAL4FF); Tg(UAS:GFP) (green) and Tg(-5.2lyve1b:DsRed2) (grey) in the trunk of sibling (top) and pdgfrbum148 mutant (bottom) embryos at 5 dpf. Lymphatic vessle are rendered using lyve1b:DsRed2 channel in IMARIS s structure is rendered with lyve1b:DsRed2 channel in IMARIS (right panel). Scale bar: 100 μm. (I) Quantification of pdgfrb+ mural cell numbers around ISVs in siblings (n=20) and pdgfrbum148 mutants (n=10). Data are presented as mean ± SEM, Mann Whitney test was used. ***p<0.0001. (J) Quantification of surface area of lymphatic vasculature in siblings (n=20) and pdgfrbum148 mutants (n=10). Data are presented as mean ± SEM, unpaired two-tailed Student’s t-test was used. *p<0.05.
-
Figure 1—source data 1
Mural cells presence on arterial intersegmental vessel (aISV) at the start of lymphatic endothelial cell (LEC) migration.
- https://cdn.elifesciences.org/articles/74094/elife-74094-fig1-data1-v3.xlsx
-
Figure 1—source data 2
Lymphatic endothelial cell (LEC)-mural cell (MC) interaction during LEC migration.
- https://cdn.elifesciences.org/articles/74094/elife-74094-fig1-data2-v3.xlsx
-
Figure 1—source data 3
Number of mural cells (MCs) on arterial intersegmental vessel (aISV) during lymphatic endothelial cell (LEC) migration.
- https://cdn.elifesciences.org/articles/74094/elife-74094-fig1-data3-v3.xlsx
-
Figure 1—source data 4
Duration of migration with or without interaction with mural cells (MCs).
- https://cdn.elifesciences.org/articles/74094/elife-74094-fig1-data4-v3.xlsx
-
Figure 1—source data 5
Number of pdgfrb+ mural cells around intersegmental vessels (ISVs) in pdgfrbum148 mutant and siblings.
- https://cdn.elifesciences.org/articles/74094/elife-74094-fig1-data5-v3.xlsx
-
Figure 1—source data 6
Surface area of lymphatic vessels in pdgfrbum148 mutant and siblings.
- https://cdn.elifesciences.org/articles/74094/elife-74094-fig1-data6-v3.xlsx
-
Figure 1—source data 7
Mural cell (MC) relocation during lymphatic endothelial cell (LEC) migration.
- https://cdn.elifesciences.org/articles/74094/elife-74094-fig1-data7-v3.xlsx
-
Figure 1—source data 8
Total lymphatic endothelial cell (LEC) number in control and AG1296-treated embryos.
- https://cdn.elifesciences.org/articles/74094/elife-74094-fig1-data8-v3.xlsx
Figure 1—figure supplement 1
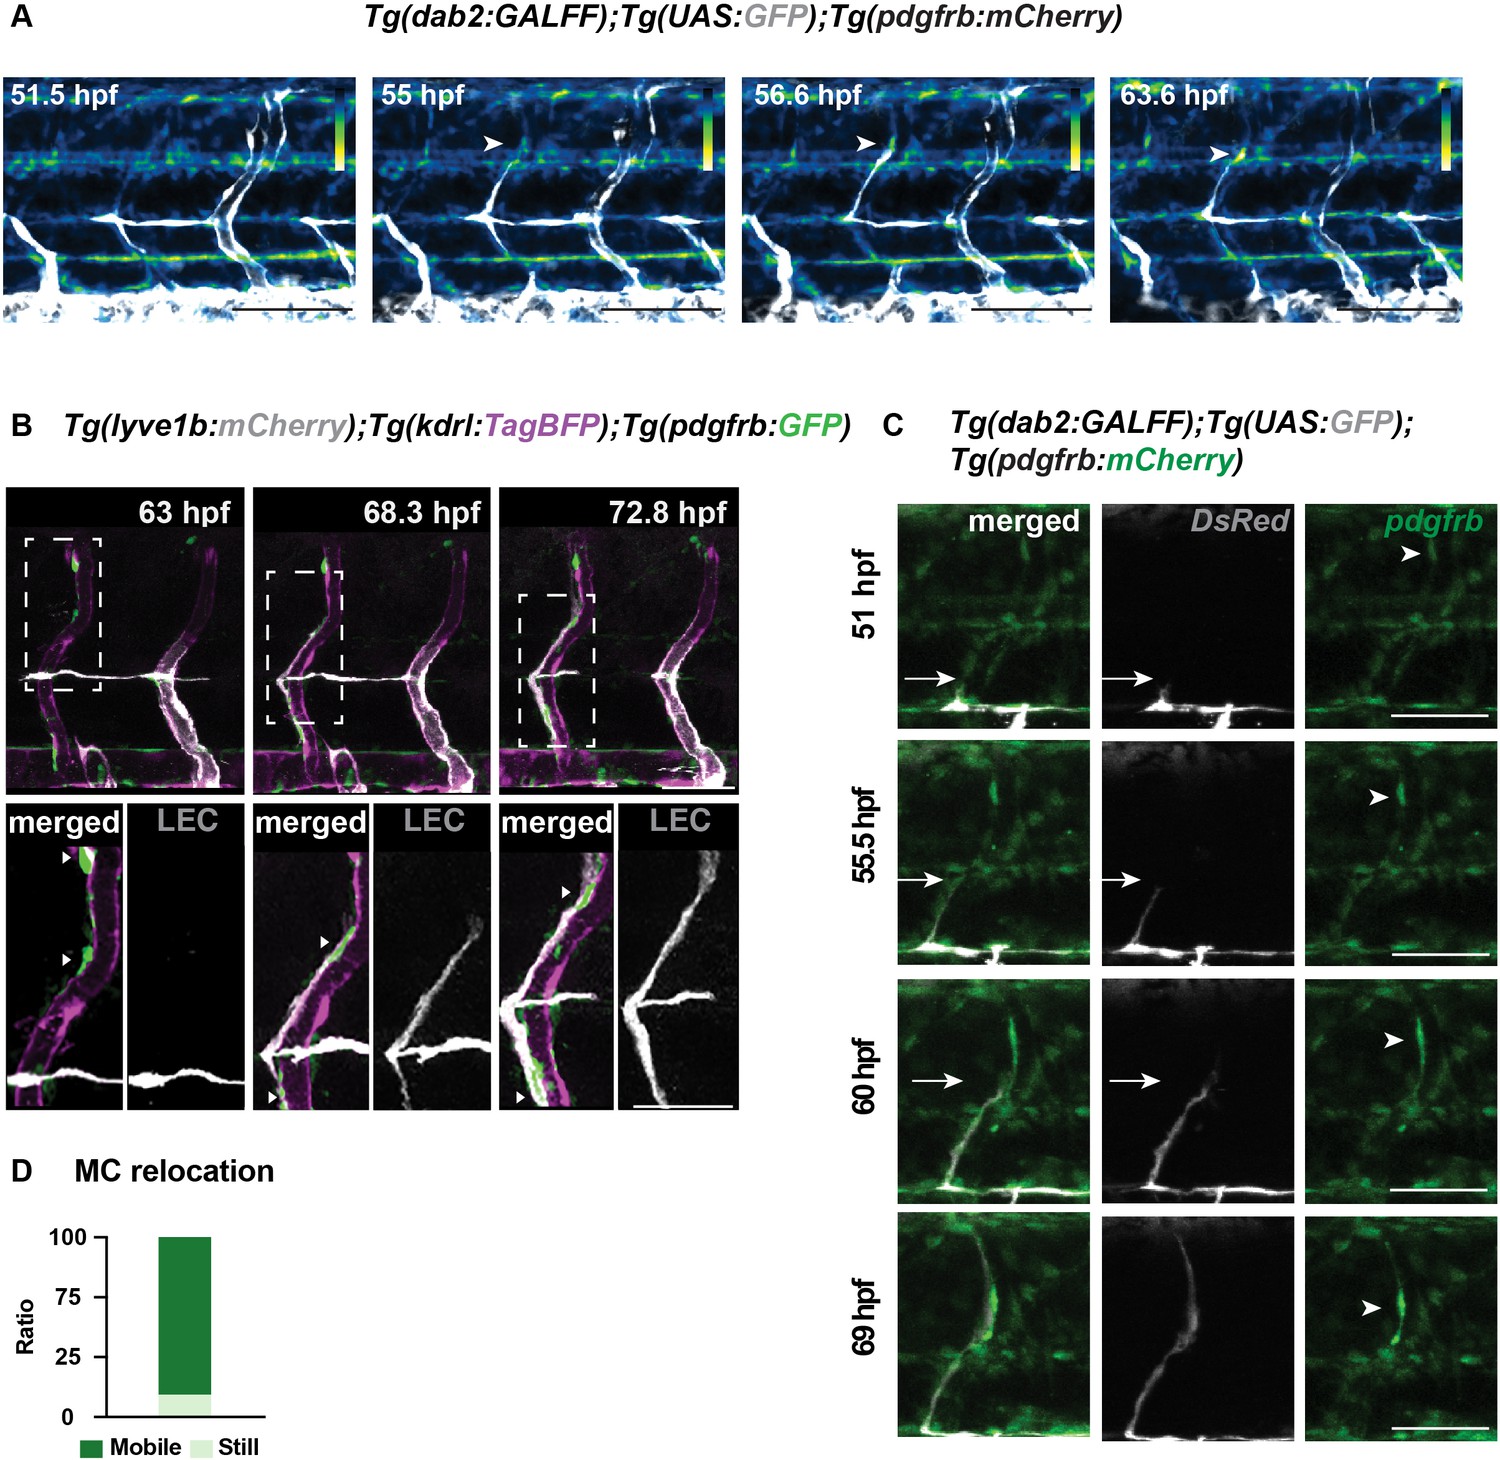
pdgfrb high mural cells (MCs) emerge around arterial intersegmental vessels (aISVs) prior to lymphatic endothelial cell (LEC) migration and provide guidance.
(A) Heatmap generated with confocal z-stack images from time-lapse images in the trunk of 2 days post fertilization (dpf) Tg(dab2:GALFF);Tg(UAS:GFP); Tg(pdgfrb:mCherry) embryos. Heatmap was generated based on the intensity of mCherry. Arrow indicates pdgfrbhigh MC around aISV. (B) Confocal z-stack images from time-lapse images in the trunk of 2 dpf Tg(lyve1b: mCherry);Tg(kdrl:TagBFP);TgBAC(pdgfrb:GFP) embryo. Boxed regions are enlarged in the bottom. Arrowheads indicate pdgfrb+ MCs (green) around aISV (magenta) prior to (bottom left) and during (bottom middle and right) LEC (grey) migration. Scale bars: 50 or 30 μm (enlarged image). (C) Confocal z-stack images from time-lapse images in the trunk of Tg(dab2:GALFF);Tg(UAS:GFP) (grey);Tg(pdgfrb:mCherry) (green) in left panels and TgBAC(pdgfrb:GAL4FF);(UAS:GFP) in right panels (green) and Tg(dab2:GALFF);Tg(UAS:GFP) (grey) in middle panels. White arrow heads, MCs appear around aISV. Arrow, sprouting front of migrating LEC. Scale bar: 100 μm. (D) Quantification of MC (n = 30) movement from n = 7 embryos as still (n = 26) and mobile (n = 4) during the time-lapse videos as in (Figure 1E). Data are presented as ratio of total number of cells counted.
Figure 1—figure supplement 2
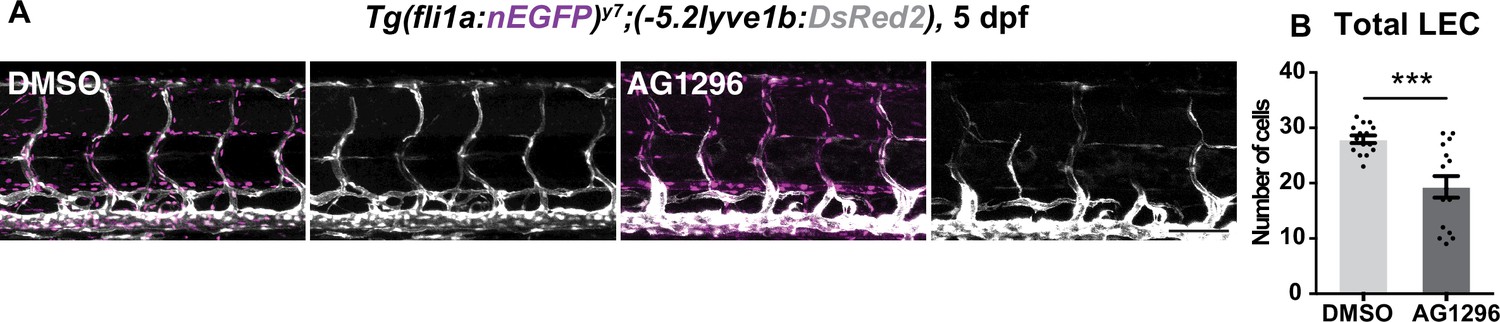
Trunk of 5 days post fertilization (dpf) control and PDGFRβ inhibitor-treated embryos.
(A) Confocal z-stack images of 5 dpf Tg(fli1a:nEGFP);(–5.2lyve1b:DsRed2) treated with 20 μM PDGFR inhibitor AG1296 (n = 15) or DMSO (n = 15) from 48 hours post fertilization (hpf). Scale bar: 100 μm. (B) Quantification of total lymphatic endothelial cell (LEC) number in (C). Data are presented as mean ± SEM, Mann-Whitney test was used. ***p < 0.0005.
Figure 1—video 1
Confocal time-lapse imaging in trunk in 2 days post fertilization Tg(flt1:YFP); Tg(-5.2lyve1b:DsRed2); TgBAC(pdgfrb:GFP) embryos corresponding to Figure 1B (embryos n = 10).
Figure 1—video 2
Confocal time-lapse imaging in trunk in 2 days post fertilization Tg(lyve1b: mCherry), Tg(kdrl:TagBFP), TgBAC(pdgfrb:GFP) embryo corresponding to Figure 1—figure supplement 1 (embryos n > 5 embryos ).
Figure 1—video 3
Confocal time-lapse imaging of Tg(dab2:GALFF);Tg(UAS:GFP);Tg(pdgfrb:mCherry) in trunk from 2 days post fertilization, embryo corresponding to Figure 1—figure supplement 1C (embryos n > 5 embryos).
Figure 1—video 4
Confocal time-lapse imaging in trunk in 2 days post fertilization TgBAC(pdgfrb:GAL4FF);(UAS:GFP), Tg(–5.2lyve1b:DsRed2) embryos corresponding to Figure 1E.
Figure 1—video 5
Representative confocal time-lapse imaging of lymphatic endothelial cell migrating and interacting with mural cels (corresponding to Figure 1G) in trunk at 2 days post fertilization.
Figure 1—video 6
Representative confocal time-lapse imaging of lymphatic endothelial cell migrating without mural cell interaction (corresponding to Figure 1G) in trunk at 2 days post fertilization.
Figure 2 with 8 supplements
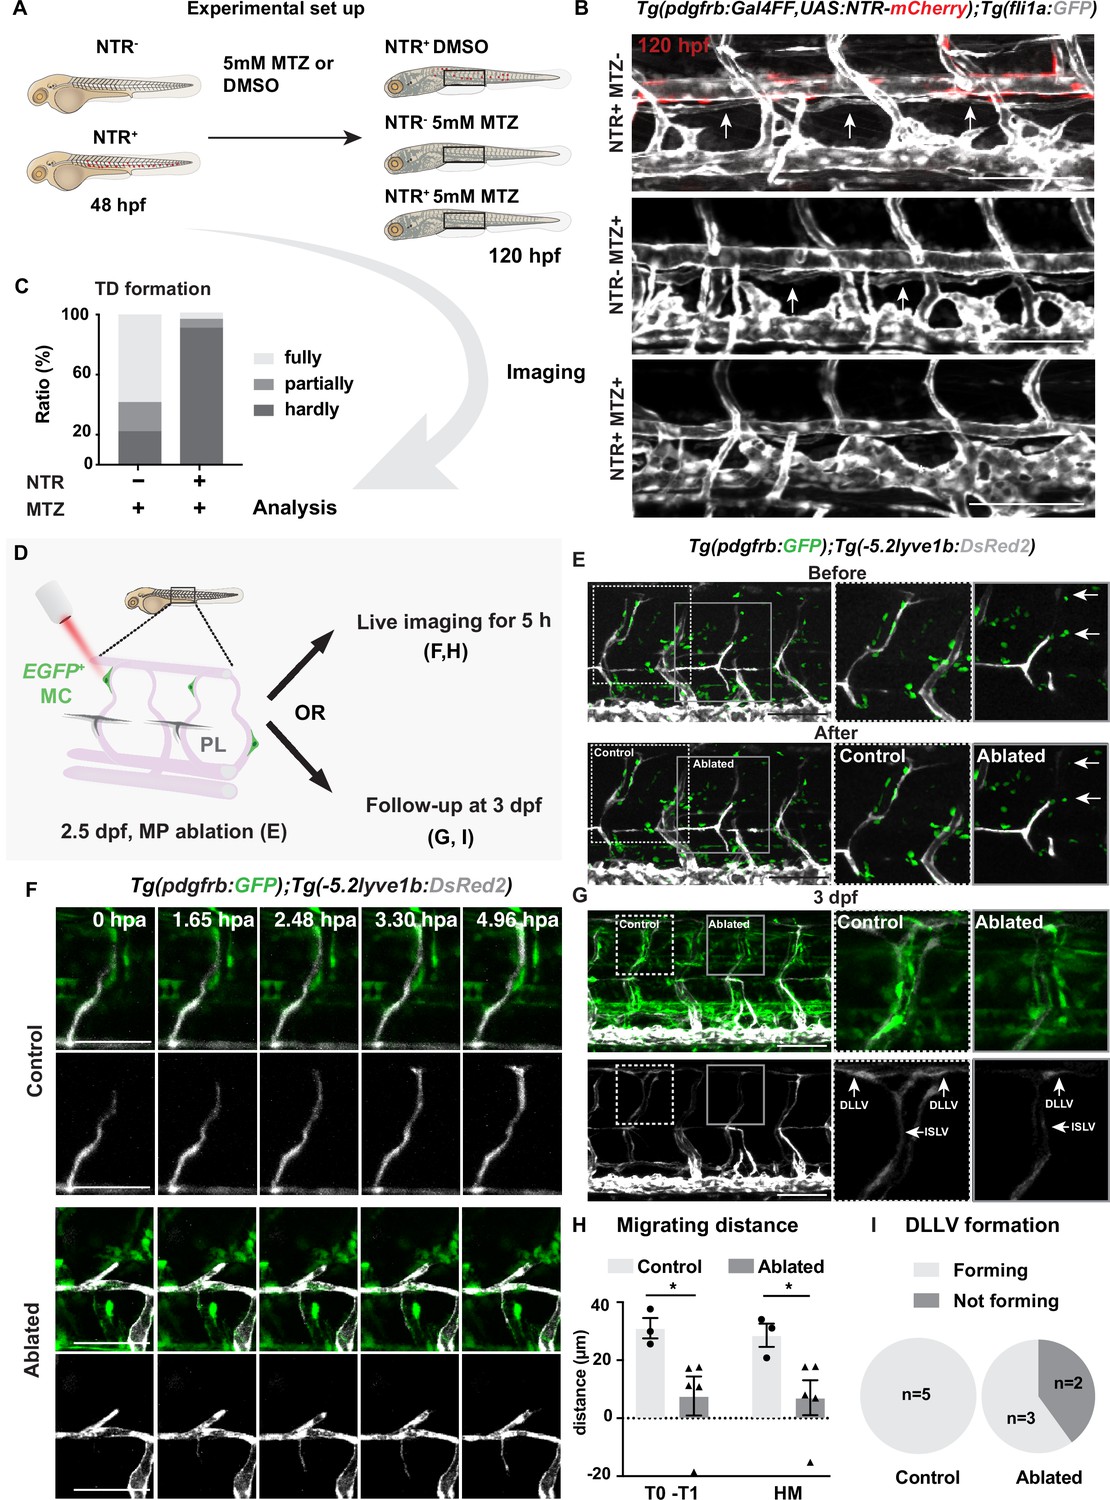
Mural cells are required for formation of lymphatic vascular bed.
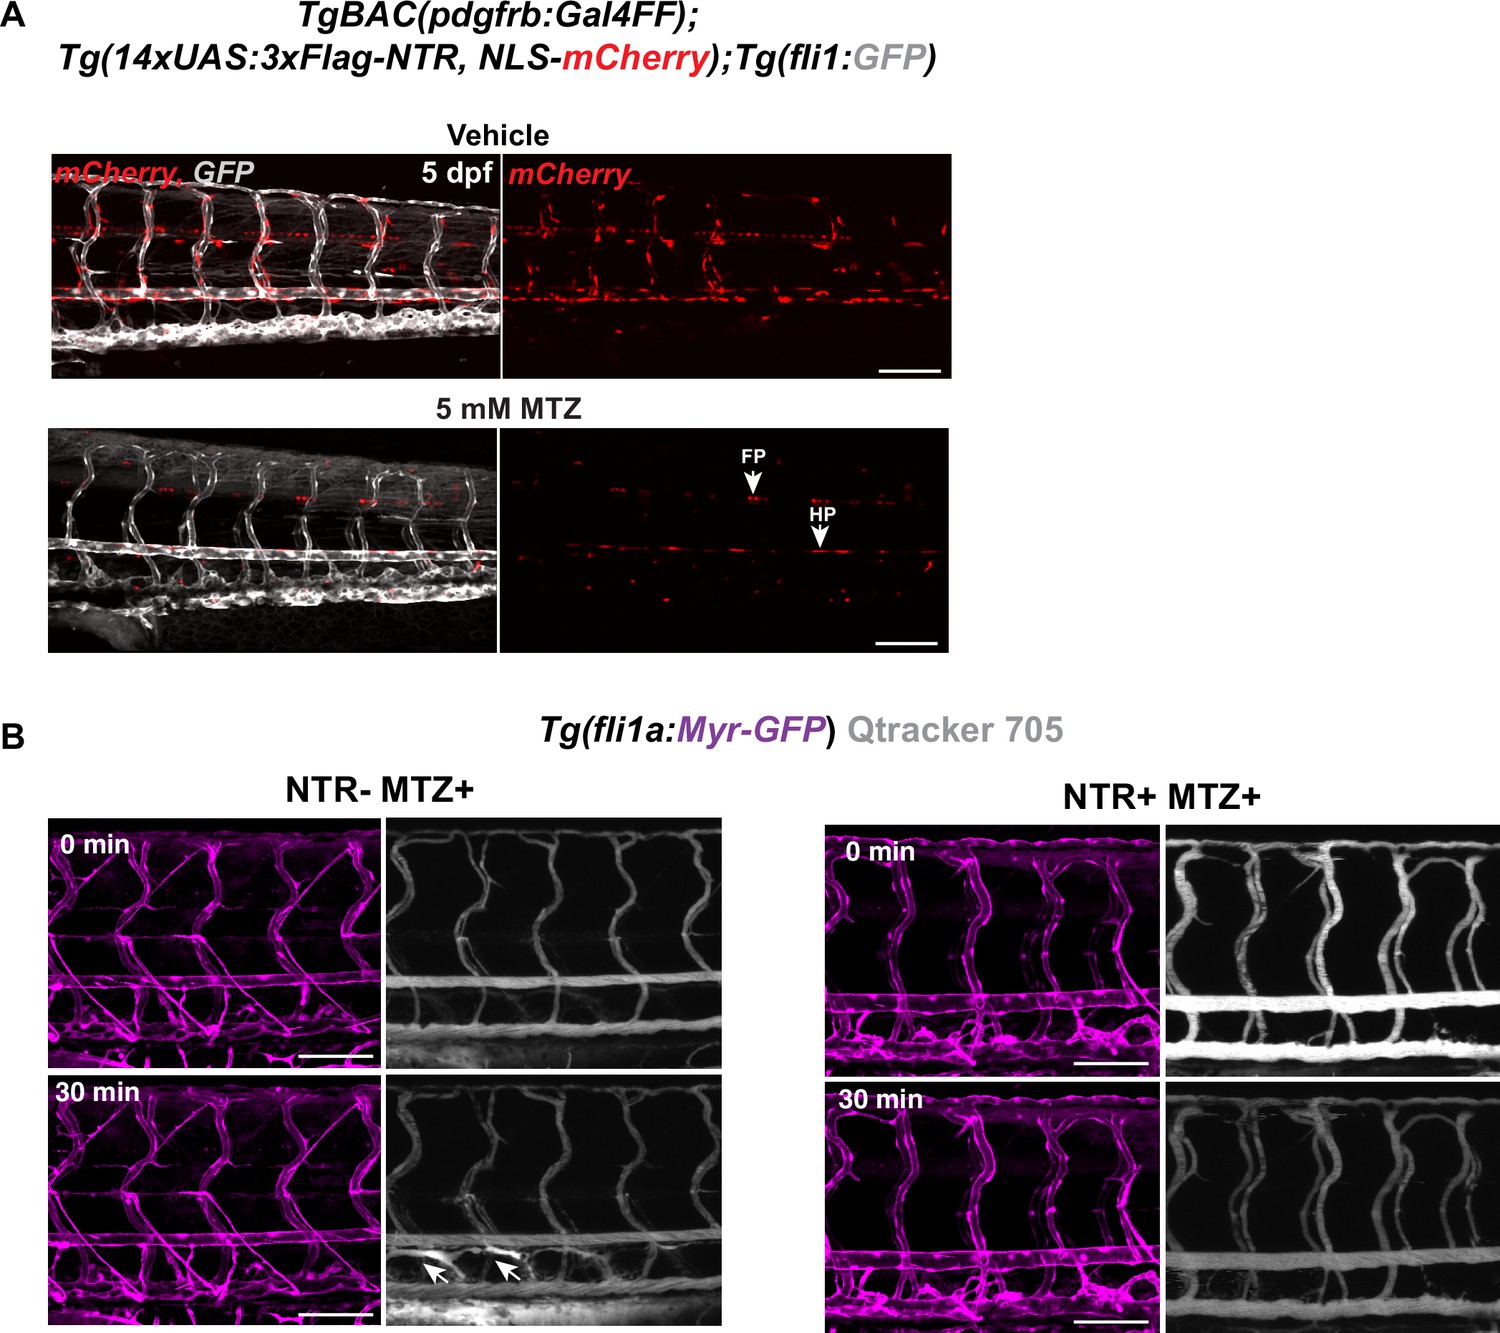
(A) Work flow of cell ablation by the nitroreductases (NTR)-metorodinazole (MTZ) system. Tg(pdgfrb:Gal4FF);Tg(14xUAS:3xFLAG-NTR,NLS-mCherry) (red) and Tg(fli1a:GFP) (grey) were imaged at 120 hours post fertilization (hpf) after treatment with DMSO or 5 mM MTZ from 48 hpf, and the formation of thoracic duct (TD) was analysed. (B) Confocal stack images of the trunk in 5 days post fertilization (dpf) embryos treated as described in (A). Arrows indicates TD forming beneath dorsal aorta. Asterisks indicate the absence of TD. Scale bar: 100 μm. (C) Quantification of (B). Embryos were scored as fully (completely connected TD), partially (partially formed TD) and hardly (almost or no TD visible) formed based on the TD development. In the NTR- MTZ+ group (n = 36), n = 21 embryos with fully formed TD, n = 7 embryos with partly formed TD, n = 8 embryos with hardly formed TD were identified. In the NTR+ MTZ+ group (n = 34), n = 1 embryo with fully formed TD, n = 2 embryos with partly formed TD, n = 31 embryos with hardly formed TD were identified. Data were presented as ratio to total number of embryos analysed. (D) Work flow of cell ablation by multi-photon microscopy. Mural cells (MCs, green) labelled by TgBAC(pdgfrb:GAL4FF; UAS:GFP) and lymphatic endothelial cells (LECs) by Tg(–5.2lyve1b:DsRed2) (grey). MCs on intersegmental vessel in proximity to sprouting LEC were ablated at 57 hpf. For analysis, ablation was either followed by time-lapse imaging or confocal imaging at 3 dpf. (E) Confocal stack images before and after ablation. Control ablation (dashed box) in the adjacent region of GFP+ MCs and GFP+ MC on arterial intersegmental vessel (aISV) (solid grey box) was performed in the same embryos. Arrows indicate ablated GFP-positive cells. Scale bar: 100 μm. Middle and right panels, zoom-in images cropped in z-stacks. (F) Live imaging of lymphatic endothelial cell migration in the context of control (top images) and GFP+ MC on aISV (bottom images) after ablation, with confocal stack images from time lapse at selected timepoints from 0 to 4.96 hpa. Scale bar: 50 μm. (G) Confocal stack images of 3 dpf embryos in (E). Dashed box, control ablation. Solid grey box, MC ablation. DLLV, dorsal longitudinal lymphatic vessel; ISLV, intersegmental lymphatic vessel. Scale bar: 100 μm. (H) Quantification of migration distance from time-lapse videos corresponding to (F). Distance was calculated as both T0-T1 and the perpendicular distance between the T1 and HM for embryos with (n = 4) or without (control, n = 3) ablation. T0, the sprouting front of LECs at the start of video; T1, sprouting front of LECs at the end of video. Data are presented as mean ± SEM, unpaired two-tailed Student’s t-test or Mann-Whitney test was used on two types of measurements respectively. *p < 0.05. (I) Quantification of DLLV formation at 3 dpf. DLLV forming (n = 3), not forming (n = 2) in the ablated group and DLLV forming (n = 5) in the control group.
-
Figure 2—source data 1
Thoracic duct (TD) formation at 120 hours post fertilization (hpf) presented as ratio of total.
- https://cdn.elifesciences.org/articles/74094/elife-74094-fig2-data1-v3.xlsx
-
Figure 2—source data 2
Migration distance in control and ablated lymphatic endothelial cell (LEC).
- https://cdn.elifesciences.org/articles/74094/elife-74094-fig2-data2-v3.xlsx
-
Figure 2—source data 3
Follow-up of dorsal longitude lymphatic vessel (DLLV) formation at 3 days post fertilization (dpf).
- https://cdn.elifesciences.org/articles/74094/elife-74094-fig2-data3-v3.xlsx
-
Figure 2—source data 4
Migrating distance of lymphatic endothelial cell (LEC) and arterial intersegmental vessel (aISV) post arterial endothelial cell (aEC) ablation.
- https://cdn.elifesciences.org/articles/74094/elife-74094-fig2-data4-v3.xlsx
Figure 2—figure supplement 1
Ablation with nitroreductases (NTR)-metorodinazole (MTZ) system.
(A) Representative confocal stack images of 5 days post fertilization (dpf) TgBAC(pdgfrb:Gal4FF);Tg(14xUAS:3xFlag-NTR, NLS-mCherry);Tg(fli1:GFP) treated with 5 mM MTZ or vehicle for 16 hr. NTR expression was highly selective on mural cells (MCs) population. MCs were ablated after 16 hours of 5 mM MTZ treatment. Arrows indicate floorplate (FP) and hyperchord (HP) were not ablated by the treatment despite the expression of NTR. Scale bar: 100 μm. (B) Confocal stack images from Tg(fli1a:Myr-GFP) in control and ablated embryos described in Figure 2A post injection of Qtracker 705 vascular labels (shown in grey) into common cardinal vein. Arrows indicate lymphatic vessels labelled by leaked dye when injected or during the circulation in the control but not in the MC-ablated larva. Scale bar: 100 μm.
Figure 2—figure supplement 2
Mural cells (MCs) ablation with nitroreductases (NTR)-metorodinazole (MTZ) system.
(A) Confocal stack images with transmitted light channel as in Figure 2F. Black arrows indicate erythrocytes in the blood flow, white arrowheads indicate the ablating sites. Scale bar: 50 μm.
Figure 2—figure supplement 3
Aterial endothelial cells (aECs) ablation with multi-photon laser.
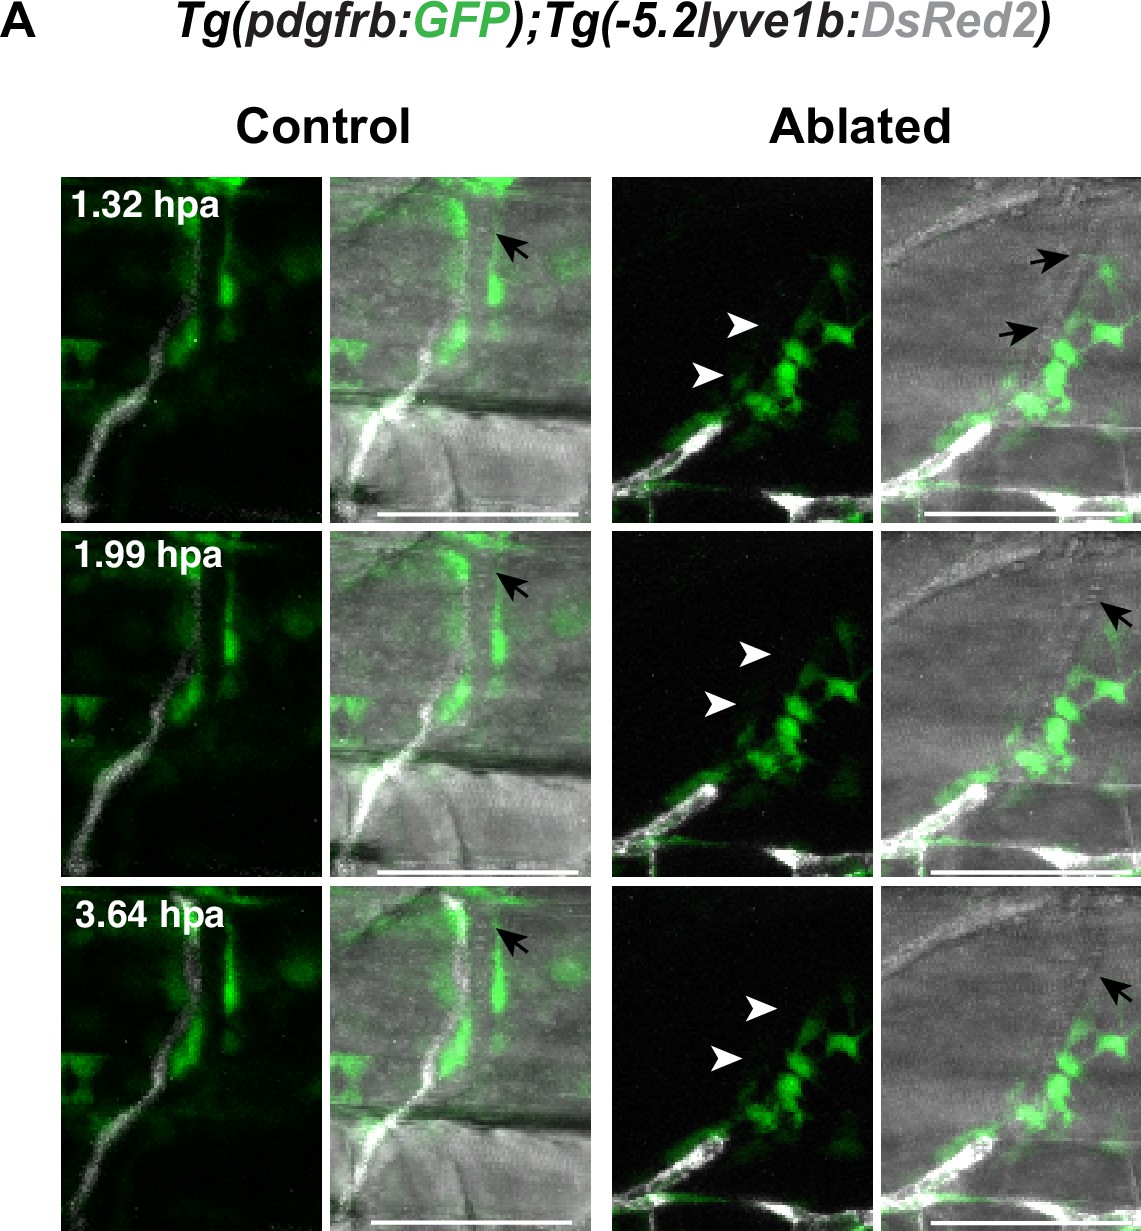
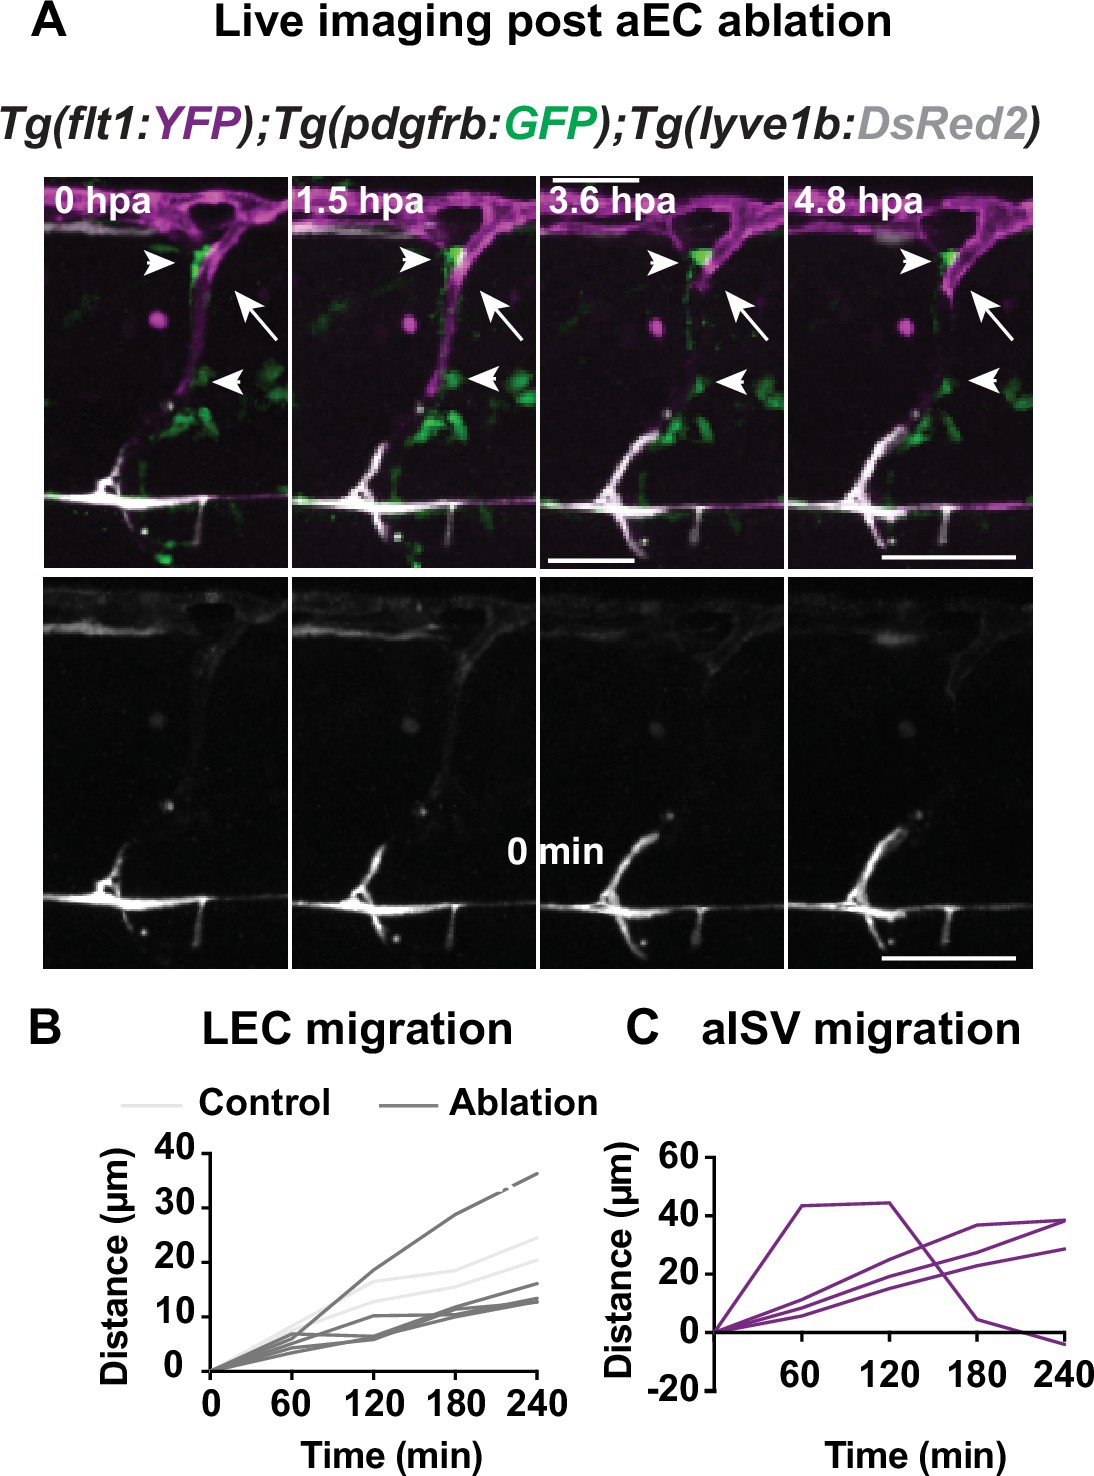
(A) Confocal stack images from time-lapse post multi-photon laser ablation in 2 days post fertilization (dpf) Tg(flt1:YFP) (magenta); TgBAC(pdgfrb:GFP) (green) and Tg(–5.2lyve1b:DsRed2) (grey) embryos. Arrowheads indicate remained GFP+ MCs without arterial intersegmental vessel (aISV). White arrows indicate the ablated site of aISV. Scale bar: 50 μm (Figure 2—figure supplement 2); arterial endothelial cell (aEC) ablation with multi-photon laser. (A–B) Quantification of lymphatic endothelial cell (LEC) (n = 4) and aISV (n = 4) migration distance post two-photon laser ablation.
Figure 2—video 1
Control ablation representative confocal time-lapse imaging of two-photon cell ablation in TgBAC(pdgfrb:GAL4FF);(UAS:GFP);Tg(–5.2lyve1b:DsRed2), corresponding Figure 2F.
Figure 2—video 2
Mural cell ablation, representative confocal time-lapse imaging of two-photon mural cell ablation in TgBAC(pdgfrb:GAL4FF);(UAS:GFP);Tg(–5.2lyve1b:DsRed2), corresponding Figure 2F.
Figure 2—video 3
Representative confocal time-lapse imaging of two-photon ablation of mural cell in TgBAC(pdgfrb:GAL4FF);(UAS:GFP);Tg(–5.2lyve1b:DsRed2) with transmitted light channel.
Figure 2—video 4
Representative confocal time-lapse imaging of two-photon ablation of contol cell in TgBAC(pdgfrb:GAL4FF);(UAS:GFP);Tg(–5.2lyve1b:DsRed2) with transmitted light channel.
Figure 2—video 5
Representative confocal time-lapse imaging of two-photon ablation of arterial intersegmental vessels (aISV) in Tg(flt1:YFP);TgBAC(pdgfrb:GFP);Tg(–5.2lyve1b:DsRed2), corresponding Figure 2—figure supplement 3.
Figure 3 with 3 supplements
Mural cells (MCs) express chemokines and growth factors.
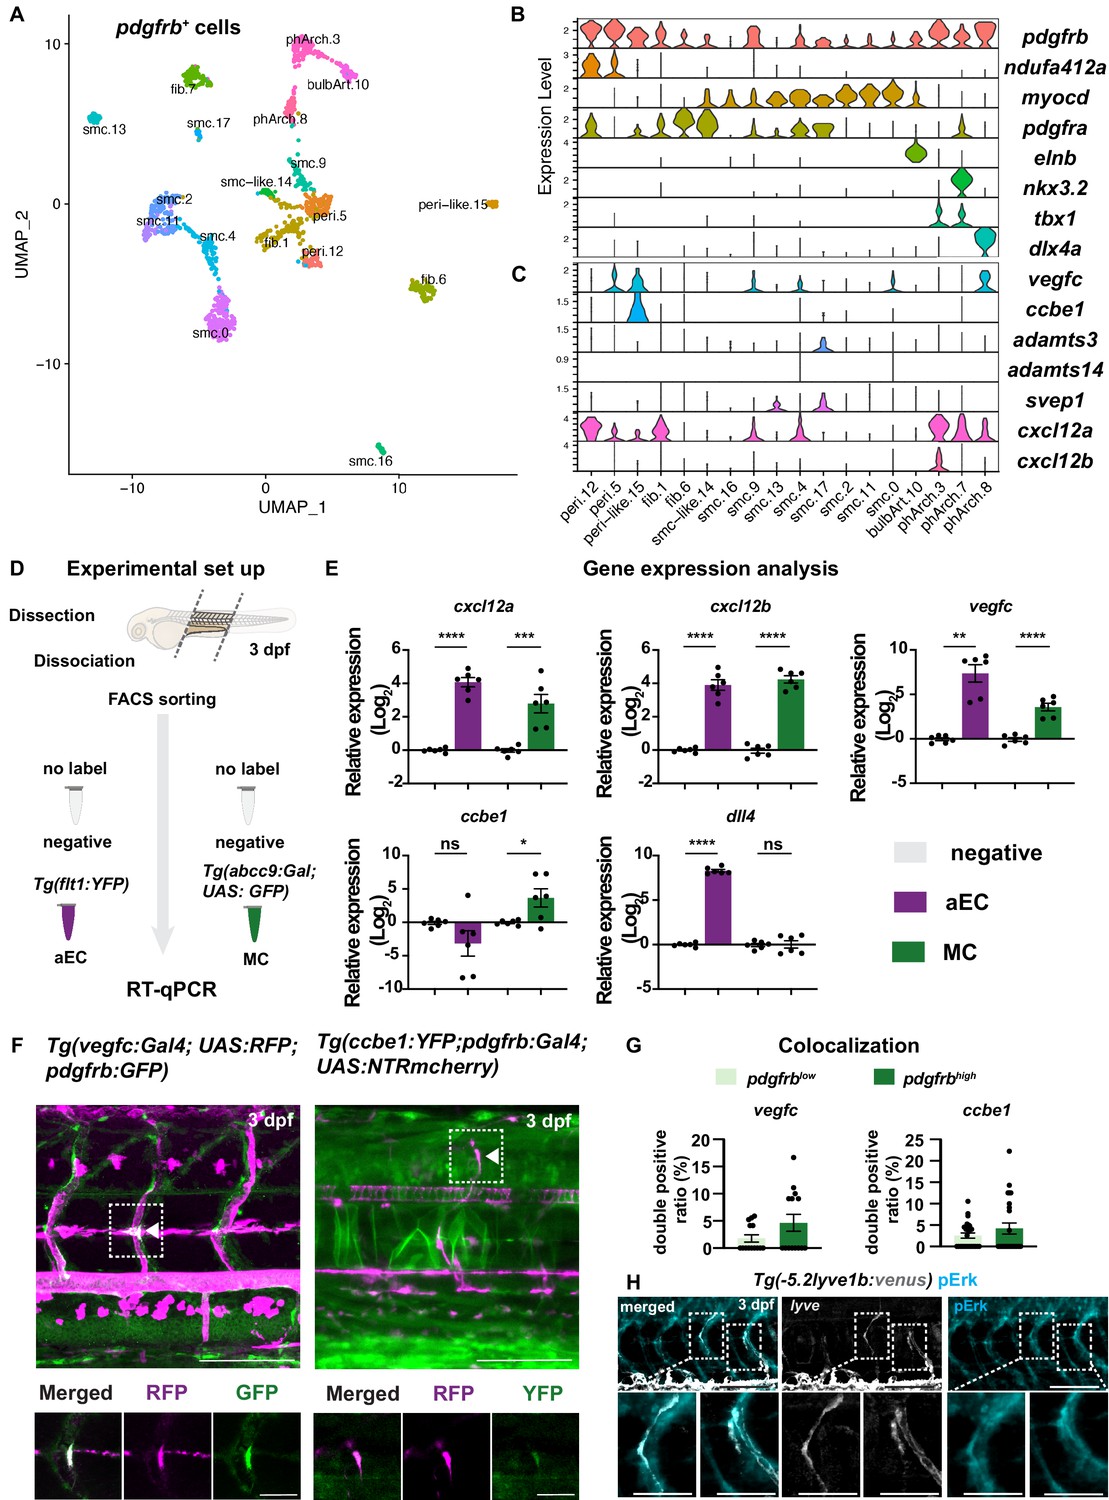
(A) Uniform Manifold Approximation and Projection (UMAP) plot of smooth muscle cells and pericytes subclustered from 5 days post fertilization (dpf) pdgfrb:egfp-positive cells. bulbArt – bulbous arteriosus, fib – fibroblast, peri – pericyte, peri-like – pericyte-like, phArch – pharyngeal arch mesenchymal cell, smc – smooth muscle cell. (B) Violin plot showing markers for pericytes (pdgfrb, ndufa4l2a), smooth muscle (myocd), fibroblasts (pdgfra), bulbous arteriosus (elnb), and pharyngeal arch mesenchyme (nkx3.2, tbx1, dlx4a). (C) Violin plot showing expression of known non-autonomous pro-lymphatic factors. Expression level values are log2 normalized across all cells. (D) Illustration of fluorescence activated cell sorting (FACS) and qPCR analysis on 3 dpf embryos. (E) qRT-qPCR of cxcl12a, cxcl12b, vegfc, ccbe1, and dll4 in FACS sorted trunk arterial endothelial cells (aECs) and MCs cells at 3 dpf as described in (D). Graph represents gene expression relative to geometric average of rpl13 and β-actin from three biological repeats (mean ± SEM). Unpaired two-tailed Student’s t-test or Mann-Whitney test was used. No significance (ns), p ≥ 0.5. *p < 0.05, ***p < 0.0005, ****p < 0.0001. (F) Confocal z-projections for immunohistochemistry of fluorescent proteins in trunks of Tg(vegfc:Gal4; UAS:RFP; pdgfrb:GFP) and confocal image of Tg(ccbe1:YFP;pdgfrb:Gal4; UAS:NTRmcherry) embryos at 3 dpf. Scale bar: 100 μm; 50 μm in enlarged images. (G) Left panel, quantification of colocalization of vegfc+ and pdgfrb+ cells based on immunohistochemistry in (F). Right panel, quantification of colocalization of ccbe1+ and pdgfrb+ cells based on confocal images in (F), data presented as double positive ratio (mean ± SEM). Ns, no significance. (H) Confocal z-projections for immunohistochemistry of endogenous pERK (cyan, right) in migrating lymphatic endothelial cells (LECs) in trunks of Tg(–5.2lyve1b:venus) embryos (α-GFP, grey, middle) (n = 10) at 3 dpf. Scale bar: 100 μm; 50 μm in enlarged images.
-
Figure 3—source code 1
SeuratCommands in R studio.
- https://cdn.elifesciences.org/articles/74094/elife-74094-fig3-code1-v3.zip
-
Figure 3—source data 1
Gene expression analysis on fluorescence activated cell sorting (FACS) sorted arterial endothelial cells (aECs) and mural cells (MCs).
- https://cdn.elifesciences.org/articles/74094/elife-74094-fig3-data1-v3.xlsx
-
Figure 3—source data 2
Colocalization of vegfc and ccbe1 in pdgfrblow and pdgfrbhigh cells.
- https://cdn.elifesciences.org/articles/74094/elife-74094-fig3-data2-v3.xlsx
-
Figure 3—source data 3
Colocalization of svep1 in pdgfrb+.
- https://cdn.elifesciences.org/articles/74094/elife-74094-fig3-data3-v3.xlsx
-
Figure 3—source data 4
Gene expression analysis on fluorescence activated cell sorting (FACS) sorted lymphatic endothelial cells (LECs).
- https://cdn.elifesciences.org/articles/74094/elife-74094-fig3-data4-v3.xlsx
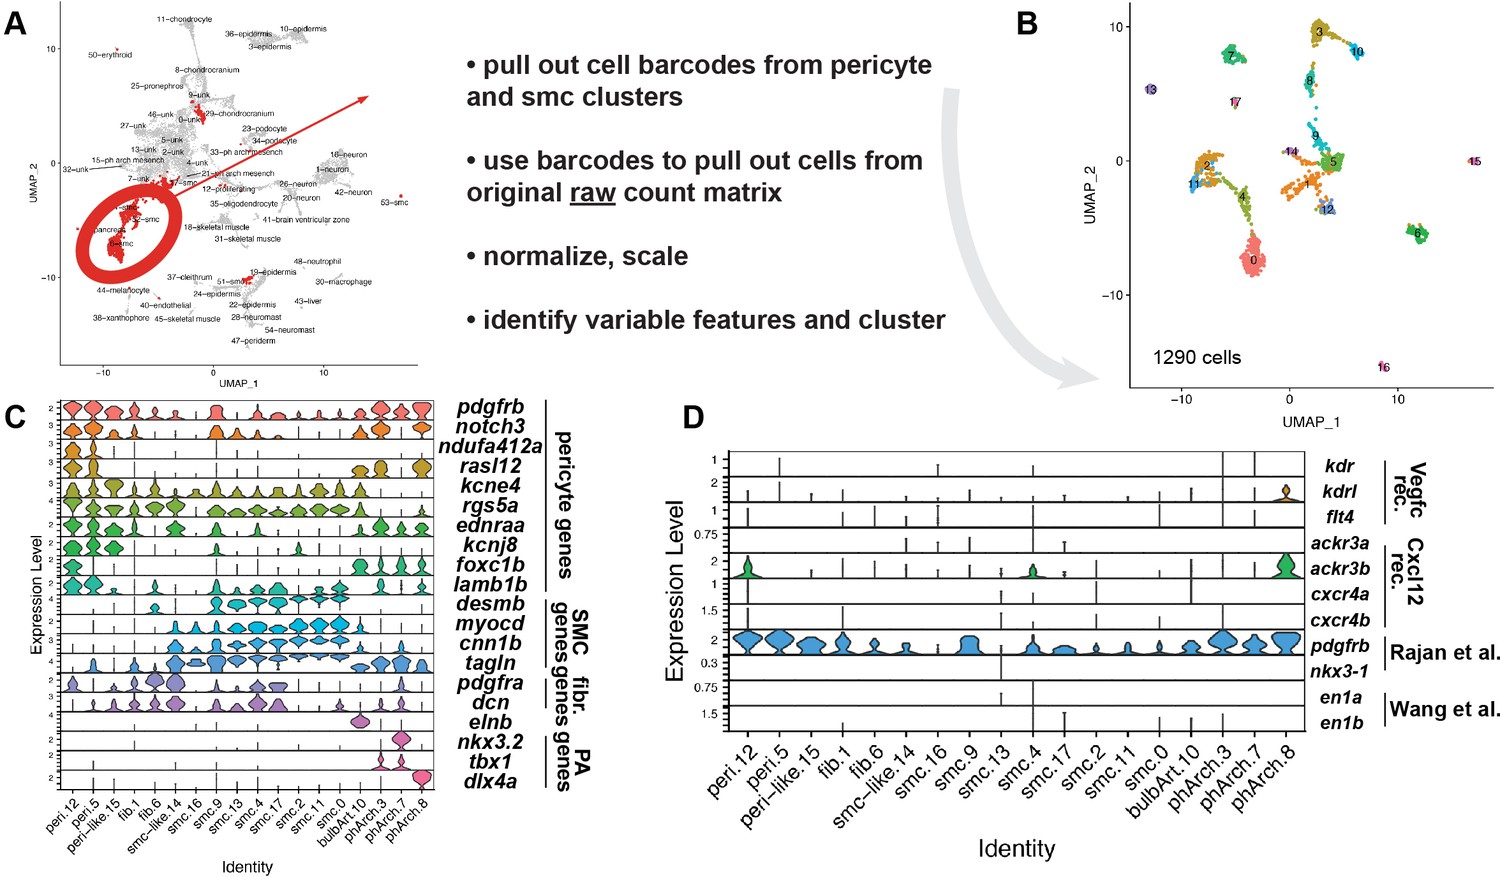
Figure 3—figure supplement 1
Mural cells express chemokines and growth factors.
(A–D) Re-clustering of prospective mural cells from published pdgfrb:egfp scRNA-seq. (A) Uniform Manifold Approximation and Projection (UMAP) plot of previously described clustering for cells isolated from TgBAC(pdgfrb:egfp) cells at 5 days post fertilization (dpf). Highlighted cells are those used for re-clustering. Adjacent text summarizes steps used for re-clustering. See Materials and methods section of additional details. (B) UMAP plot following analysis of cell highlighted in (A). (C) Violin plot showing markers used to assign cell identity to clusters identified in (B). (D) Violin plot showing expression of genes encoding receptors for Vegfc and Cxc12. Also shown are definitive markers for perivascular fibroblasts identified in previous studies.
Figure 3—figure supplement 2
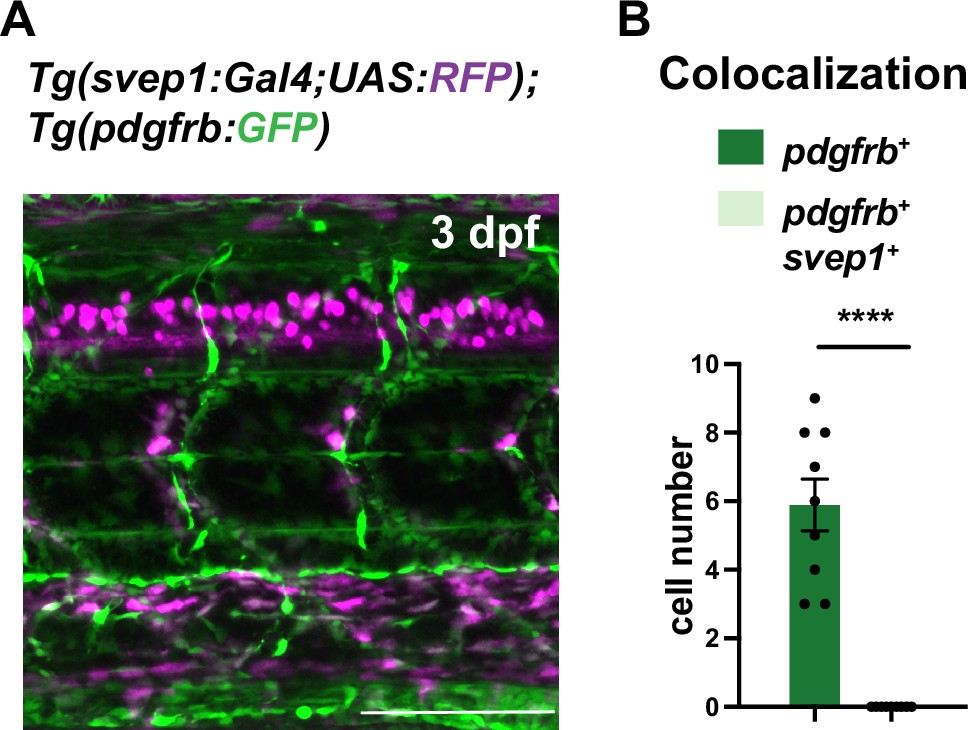
Colocalization of svep1 in pdgfrb+ cells.
(A) Confocal z-projections of Tg(svep1:Gal4;UAS:RFP); Tg(pdgfrb:GFP) at 3 days post fertilization (dpf). Scale bar: 100 μm. (B) Quantification of colocalization of pdgfrb-positive and svep1-positive cells based on confocal images from (A). Data presented as mean ± SEM. Unpaired two-tailed Student’s t-test was used. ****p < 0.0001.
Figure 3—figure supplement 3
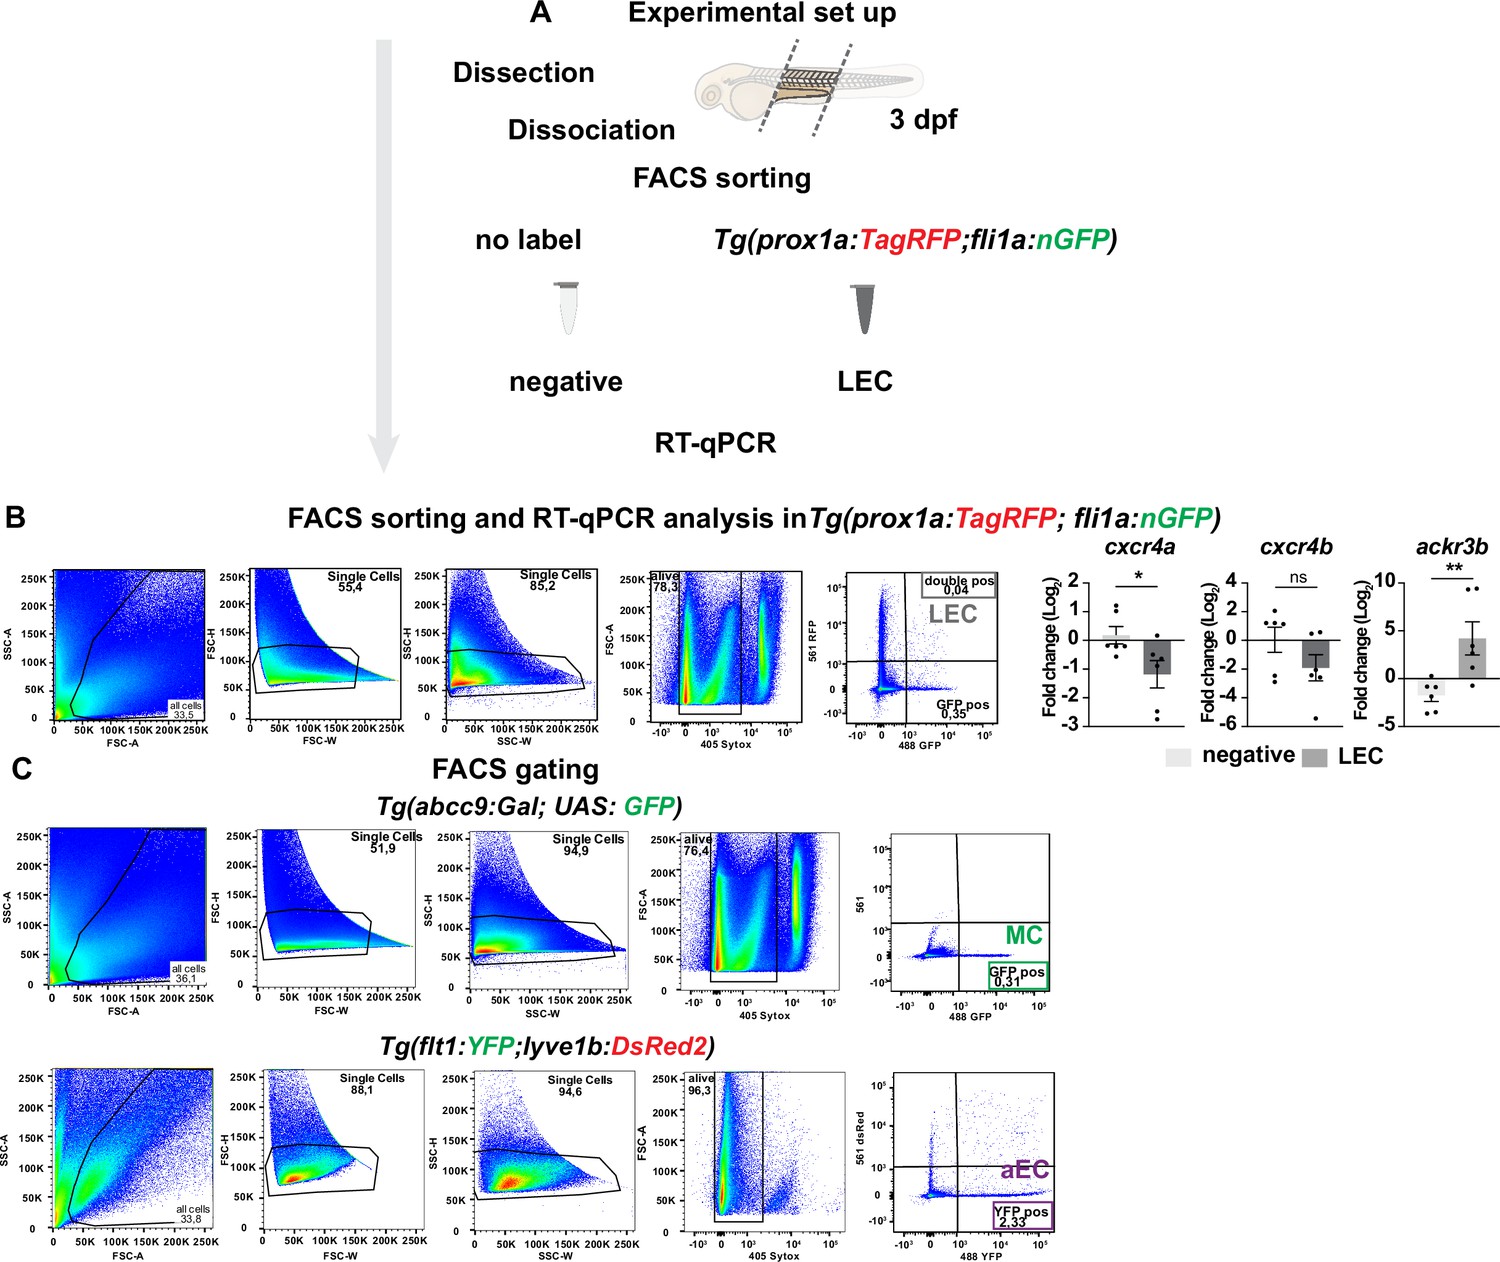
Gating strategies of fluorescence activated cell sorting (FACS) and gene analysis of chemokine receptor on sorted lymphatic endothelial cell (LEC).
(A) Illustration of FACS and qPCR analysis on 3 days post fertilization (dpf) Tg(prox1a:TagRFP; fli1a:nGFP) embryos. (B) (Left) Gating strategy for FACS sort of Tg(prox1a:TagRFP; fli1a:nGFP) as described in Figure 3—figure supplement 3A. Sorting was performed on all singlet, alive cells according to their expression of DsRed (red, 561 nm) and GFP/ YFP (green, 488 nm). (Right) RT-qPCR of cxcr4a, cxcr4b, and ackr3b expression in trunk LECs at 3 dpf. Graph represents gene expression relative to geometric average of kdrl and β-actin from three biological repeats (mean ± SEM). Unpaired two-tailed Student’s t-test or Mann-Whitney test was used. *p < 0.05, **p < 0.001. Ns, no significance. (C) Gating strategy for FACS sort of Tg(flt1:YFP) and Tg (abcc9:Gal;UAS:GFP) as described in Figure 3D. Sorting was performed on all singlet, alive cells according to their expression of GFP/ YFP (green, 488 nm).
Figure 4 with 14 supplements
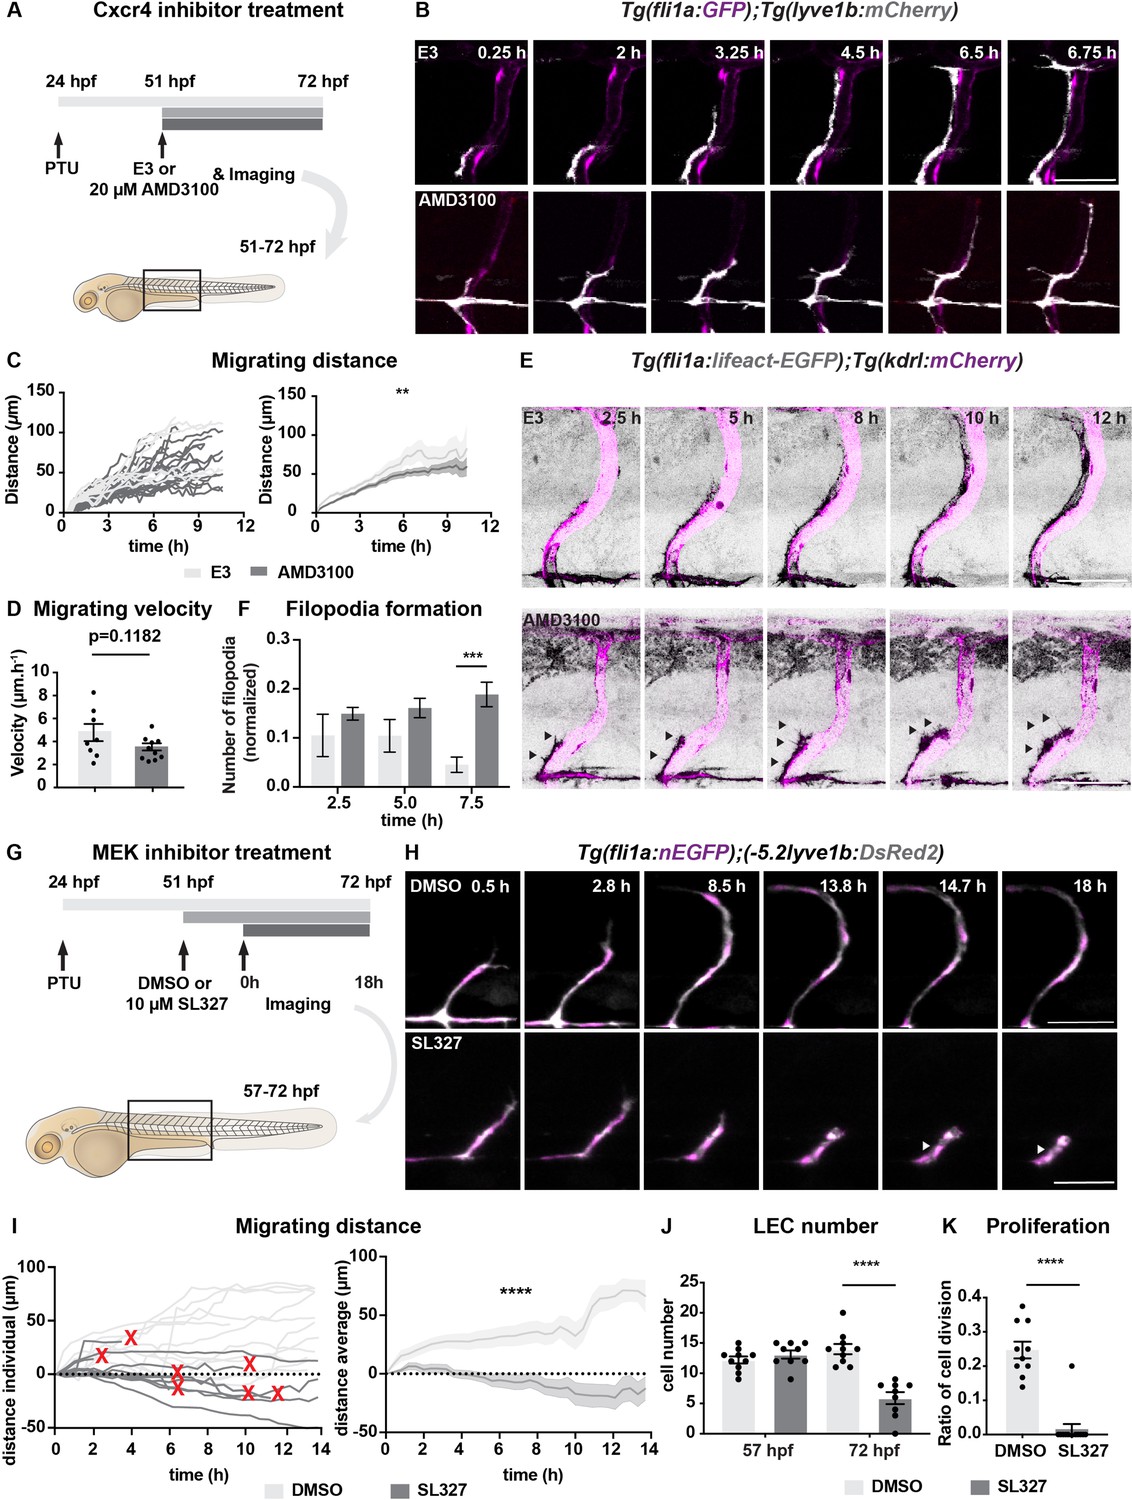
Chemokines and growth factor signalling promotes lymphatic endothelial cell (LEC) migration and survival.
(A) Work flow of Cxcr4 inhibitor treatment. Tg(fli1:GFP);Tg(lyve1b:mCherry) embryos were grown in PTU (1-phenyl 2-thiourea) from 24 hours post fertilization (hpf) to prevent pigment formation, then changed to 20 μM AMD3100 or E3 water (embryo medium) at 51 hpf. (B) Confocal stack images from time-lapse imaging of Tg(fli1a:GFP; lyve1b:mCherry) embryos as indicated in (A). Scale bar: 50 μm. (C) (Left) Quantification of dorso-ventral migration showing individual tracks for the sprouting LECs in embryos (n = 6) in E3 water or embryos (n = 10) in AMD3100. (Right) Quantification of dorso-ventral migration showing average (mean from single tracks; left) of tracks in E3 and AMD3100-treated groups. Data are presented as mean ± SEM, unpaired two-tailed Student’s t-test was used. **p < 0.005. (D) Quantification of velocity of dorso-ventral migration from time-lapse video described in (B). Sprouting front of LECs in E3 water (n = 6) and AMD3100- (n = 10) treated embryos were tracked and the distance between starting and end position of sprouting front was measured and subsequently divided by duration. Data are presented as mean ± SEM. Unpaired two-tailed Student’s t-test was used. Ns, no significance, p > 0.1. (E) Confocal stack images from time-lapse imaging of Tg(fli1a:lifeact-EGFP);Tg(kdrl:mCherry) as indicated in (A). Arrows indicate dynamic filopodia formation during LEC migration. Scale bar: 50 μm. (F) Quantification of frequency of filopodia formation from time-lapse video from (E). Number of protrusions in LEC sprouts were counted and normalized to the sprout length, control (E3, sprouts n = 8 from 8 embryos) and treated (AMD3100, n = 12 from 10 embryos) embryos. Data are presented as mean ± SEM. Unpaired two-tailed Student’s t-test was used. ***p < 0.0005. (G) Work flow of MEK inhibitor treatment. Tg(fli1:GFP);Tg(lyve1b:mCherry) embryos were grown in PTU from 24 hpf, then changed to 10 μM SL327, a MEK inhibitor, or DMSO at 51 hpf. Time-lapse imaging was started at 57 hpf. (H) Confocal z-stack images from time lapse of 57 hpf Tg(fli1a:nEGFP)y7 (green) and Tg(–5.2lyve1b:DsRed2) (grey) embryos treated with DMSO or 10 μM SL327 from 51 hpf. Grey arrowheads indicate cell death. Scale bar: 50 μm. (I) (Left) Quantification of dorso-ventral migration showing individual cell tracks for nuclei of sprouting LECs in DMSO- (embryos, n = 10; left panel) and SL327- (embryos, n = 9; right panel) treated embryos as described in (H). Red cross indicates cell death at the end of tracking. (Right) Average (mean) of tracks in DMSO- and SL327-treated groups. Data are presented as mean ± SEM, unpaired two-tailed Student’s t-test was used. ****p < 0.0001. (J) Quantification of total LEC numbers at beginning (T0) and end (T1) of the time lapse of embryos (n = 10) in DMSO- and SL327-treated embryos (n = 9); data are presented as mean ± SEM. T0 DMSO vs. T1 SL327 p < 0.0001, T0 SL327 vs. T1 SL327 p < 0.0001, T1 DMSO vs. T1 SL327 p < 0.0001. Other comparisons were ns. One-way ANOVA with Tukey’s post hoc test for statistical analysis. ****p < 0.0001. (K) Quantification of cell proliferation in DMSO (n = 9) and SL327-treated (n = 13) embryos as described in (E). Nuclear marker in green was used to count cell division events. Data are presented as mean ± SEM, Mann-Whitney test was used. ****p < 0.0001.
-
Figure 4—source data 1
Migrating distance quantified from control and AMD3100-treated embryos.
- https://cdn.elifesciences.org/articles/74094/elife-74094-fig4-data1-v3.xlsx
-
Figure 4—source data 2
Migrating velocity quantified from control and AMD3100-treated embryos.
- https://cdn.elifesciences.org/articles/74094/elife-74094-fig4-data2-v3.xlsx
-
Figure 4—source data 3
Filopodia formation quantified from control and AMD3100-treated embryos.
- https://cdn.elifesciences.org/articles/74094/elife-74094-fig4-data3-v3.xlsx
-
Figure 4—source data 4
Migrating distance quantified from control and SL327-treated embryos.
- https://cdn.elifesciences.org/articles/74094/elife-74094-fig4-data4-v3.xlsx
-
Figure 4—source data 5
Lymphatic endothelial cell (LEC) number before and after migration in control and SL327-treated embryos.
- https://cdn.elifesciences.org/articles/74094/elife-74094-fig4-data5-v3.xlsx
-
Figure 4—source data 6
Lymphatic endothelial cell (LEC) proliferation in control and SL327-treated embryos.
- https://cdn.elifesciences.org/articles/74094/elife-74094-fig4-data6-v3.xlsx
-
Figure 4—source data 7
Positive signal in TUNEL staining from control and SL327-treated embryos.
- https://cdn.elifesciences.org/articles/74094/elife-74094-fig4-data7-v3.xlsx
Figure 4—figure supplement 1
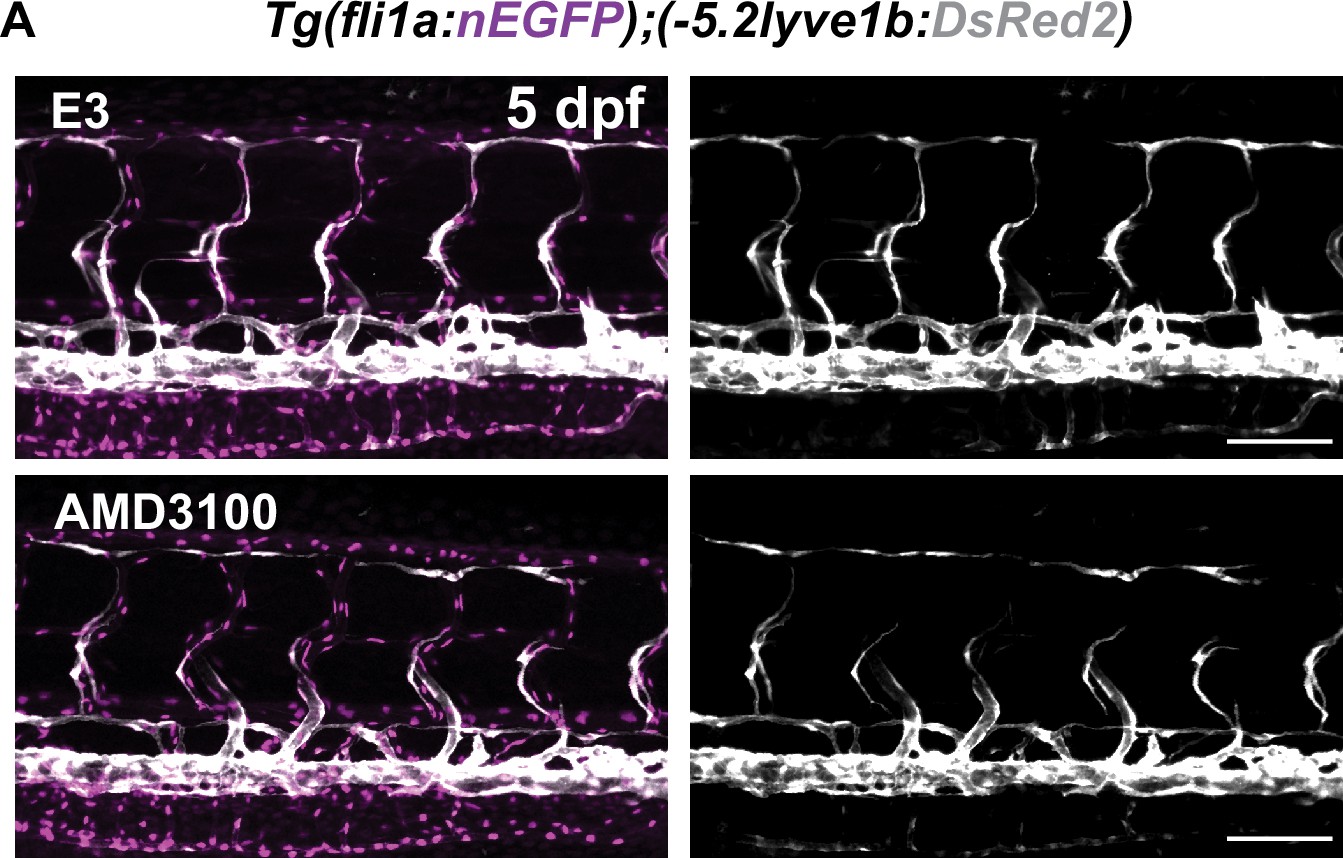
Trunk of 5 days post fertilization (dpf) control and Cxcr4 inhibitor-treated embryos.
(A) Confocal z-stack images of embryos as described in Figure 3A treated with 20μM AMD3100 or E3 water from 51 to 120 hpf. Scale bar: 100 μm.
Figure 4—figure supplement 2
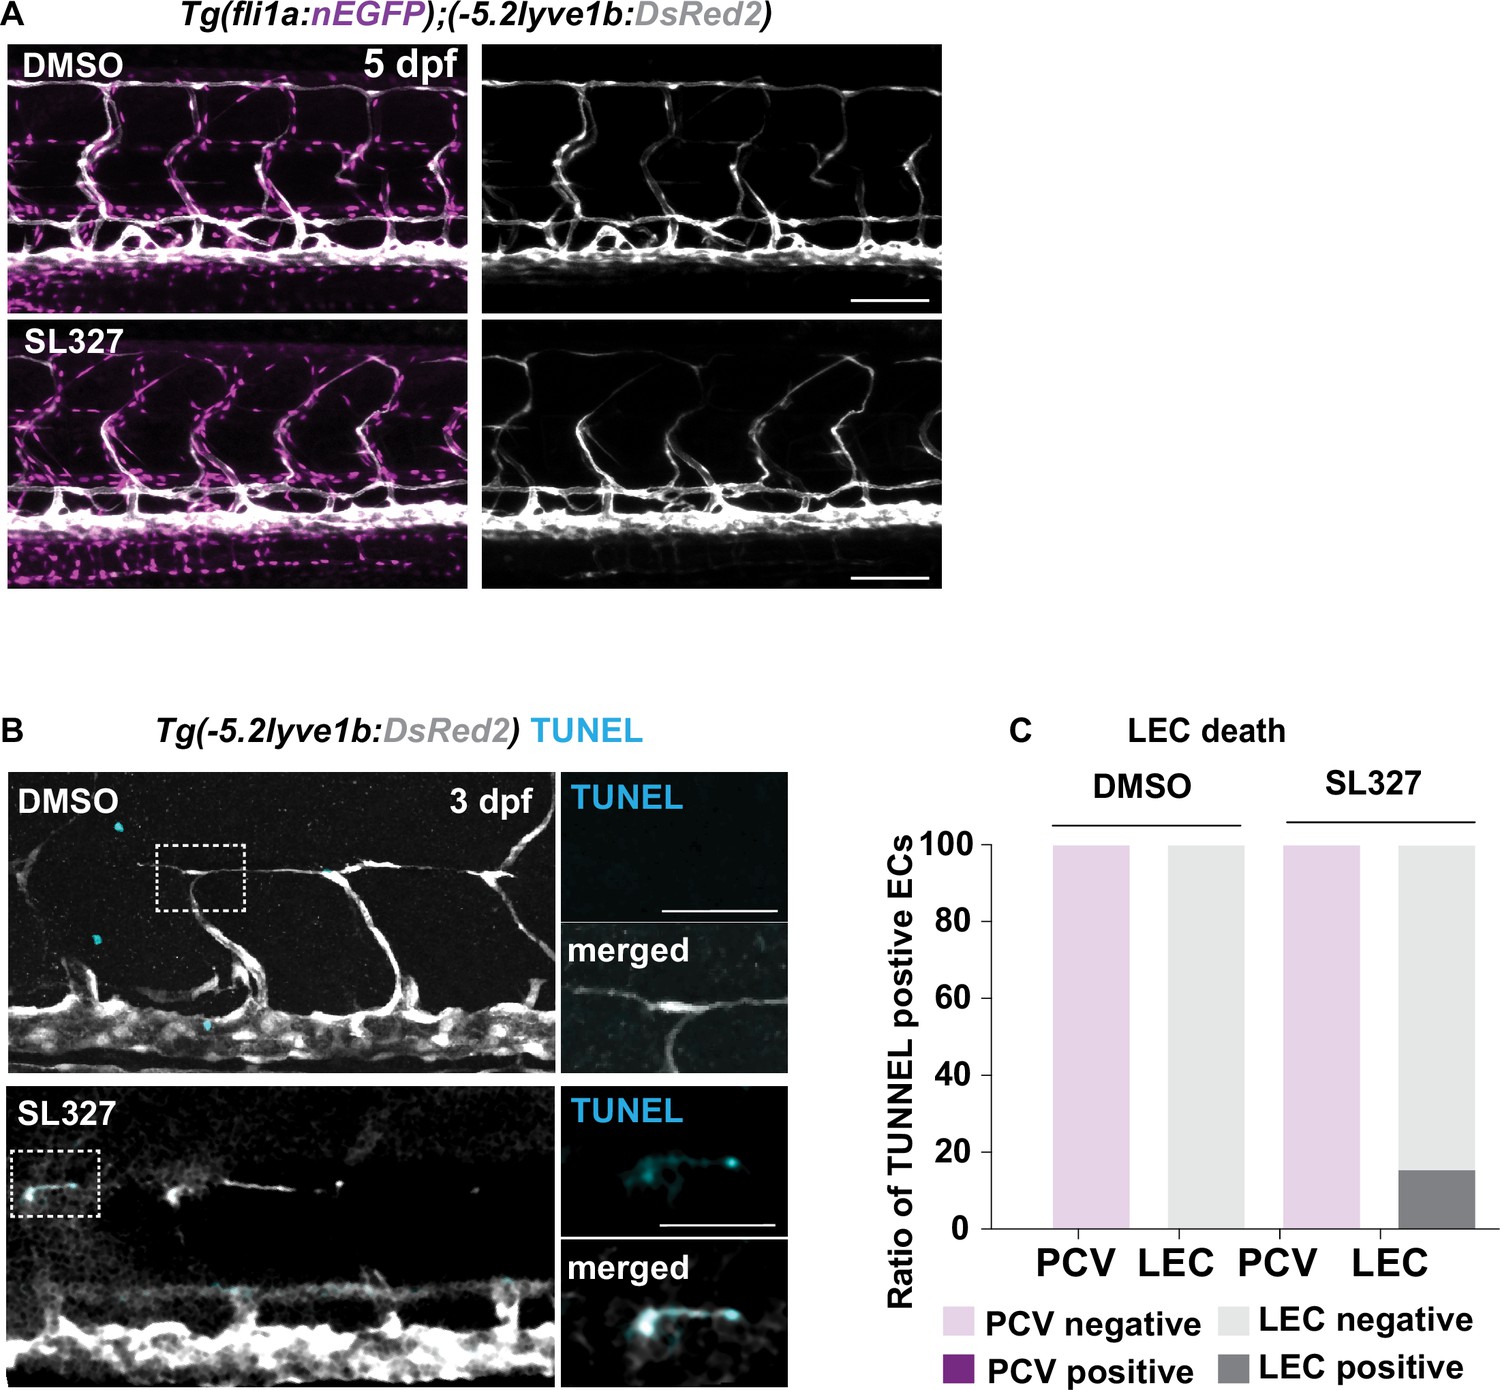
Cell death in control and SL327-treated embryos by TUNEL staining.
(A) Confocal z-stack images of embryos as described in Figure 4G treated with 4 μM SL327 or DMSO from 51 to 120 hours post fertilization (hpf). Scale bar: 100 μm. (B) Confocal z-stack image of embryos treated with DMSO or SL327 as described in Figure 4G. Embryos were fixed at 3 days post fertilization (dpf) and used for TUNEL (cyan) and α-DsRed staining (grey). Zoom-in single slice images of TUNEL staining in merged and TUNEL channel showing the colocalization of the signal. Scale bar: 100 μm, 30 μm (enlarged images). (C) Corresponding quantification of TUNEL signal from (C). In SL327-treated group (n = 45), lymphatic endothelial cell (LEC) showed a positive TUNEL staining rate of 15.56% while it was 0% in DMSO-treated group (n = 45).
Figure 4—video 1
Representative confocal time-lapse imaging of Tg(fli1a:GFP);Tg(lyve1b:mCherry)in E3 water zoom-in view of Figure 4—video 2, ,imaging from 51 hours post fertilization , embryo corresponding to Figure 4B.
Figure 4—video 2
Representative confocal time-lapse imaging of Tg(fli1a:GFP);Tg(lyve1b:mCherry) in E3 water, trunk overview.
Imaging from 51 hours post fertilization, embryos corresponding to Figure 4B.
Figure 4—video 3
Representative confocal time-lapse imaging of Tg(fli1a:GFP);Tg(lyve1b:mCherry) treated with 20 μM AMD3100 zoom-in view of Figure 4—video 4.
Imaging from 51 hours post fertilization, embryo corresponding to Figure 4B.
Figure 4—video 4
Representative confocal time-lapse imaging of Tg(fli1a:GFP);Tg(lyve1b:mCherry) treated with 20 μM AMD3100, trunk overview.
Imaging from 51 hours post fertilization, embryo corresponding to Figure 4B.
Figure 4—video 5
Representative confocal time-lapse imaging of Tg(fli1a:lifeact-EGFP);Tg(kdrl:mCherry) in E3 water zoom-in view of Figure 4—video 6 embryo corresponding to Figure 4E.
Figure 4—video 6
Representative confocal time-lapse imaging of Tg(fli1a:lifeact-EGFP);Tg(kdrl:mCherry) in E3 water, trunk overview, embryo corresponding to Figure 4E.
Figure 4—video 7
Representative confocal time-lapse imaging of Tg(fli1a:lifeact-EGFP);Tg(kdrl:mCherry) treated with 20 μM AMD3100 zoom-in view of Figure 4—video 8, embryo corresponding to Figure 4E.
Figure 4—video 8
Representative confocal time-lapse imaging of Tg(fli1a:lifeact-EGFP);Tg(kdrl:mCherry) treated with 20 μM AMD3100 trunk overview, embryo corresponding to Figure 4E.
Figure 4—video 9
Representative confocal time-lapse imaging of Tg(fli1a:nEGFP);Tg(–5.2lyve1b:DsRed2) treated with DMSO, zoom-in of Figure 4—video 10 . Imaging from 51 hourr post fertilization. Embryo corresponding to Figure 4H.
Figure 4—video 10
Representative confocal time-lapse imaging of Tg(fli1a:nEGFP);Tg(–5.2lyve1b:DsRed2) treated with DMSO, trunk overview.
Imaging from from 51 hours post fertilization hour post fertilization. Embryo corresponding to Figure 4H.
Figure 4—video 11
Representative confocal time-lapse imaging of Tg(fli1a:nEGFP);Tg(–5.2lyve1b:DsRed2) treated with 10 μM SL327, (zoom-in of Figure 4—video 12).
Imaging from 51 hours post fertilization hour post fertilization. Embryo corresponding to Figure 4H.
Figure 4—video 12
Representative confocal time-lapse imaging of Tg(fli1a:nEGFP);Tg(–5.2lyve1b:DsRed2) treated with 10 μM SL327, trunk overview.
Embryos corresponding to Figure 4H.
Figure 5 with 5 supplements
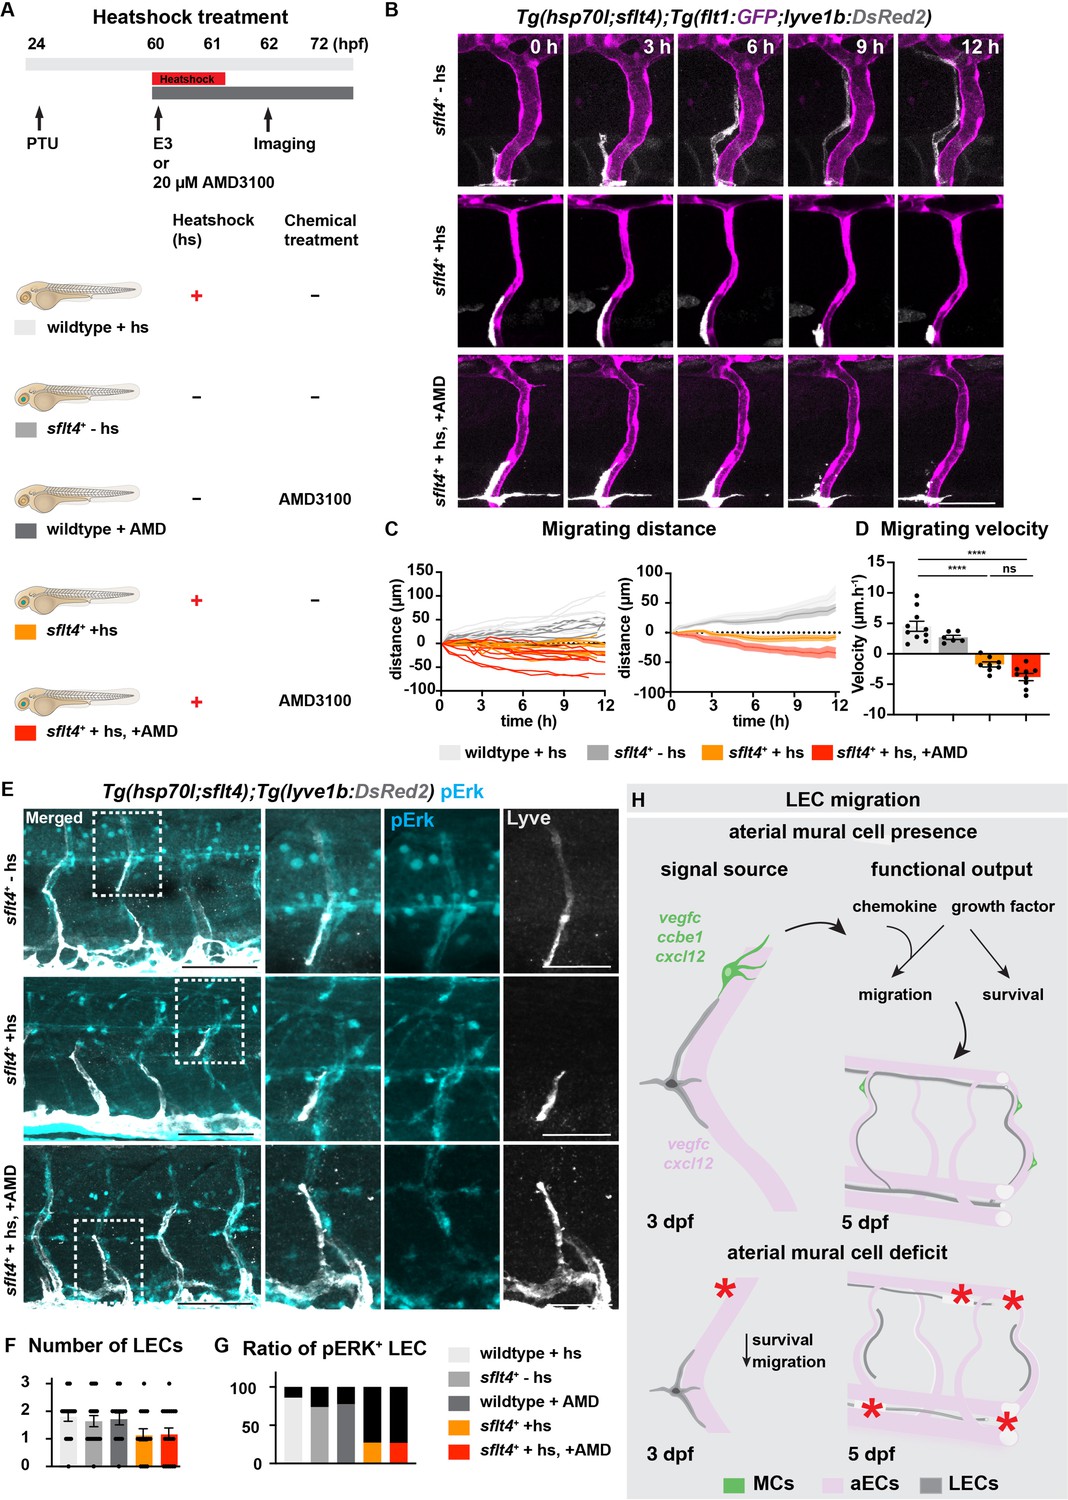
Vegfc-Vegfr together with Cxcl12-Cxcr4 coordinate lymphatic endothelial cell (LEC) migration.
-
Figure 5—source data 1
Migrating distance quantified from embryos without (-hs), or with heatshock (+hs), and with both heatshock and 20 μM AMD3100 (+hs, +AMD).
- https://cdn.elifesciences.org/articles/74094/elife-74094-fig5-data1-v3.xlsx
-
Figure 5—source data 2
Migrating velocity quantified from embryos without (-hs), or with heatshock (+hs), and with both heatshock and 20 μM AMD3100 (+hs, +AMD).
- https://cdn.elifesciences.org/articles/74094/elife-74094-fig5-data2-v3.xlsx
-
Figure 5—source data 3
Quantification of lymphatic endothelial cell (LEC) number in wildtype embryos with heatshock (+hs), sflt4+ without heatshock (-hs), wildtype embryos treated with AMD (+AMD), sflt4+ with heatshock (+hs) and sflt4+ with heatshock and AMD treatment (+hs, +AMD).
- https://cdn.elifesciences.org/articles/74094/elife-74094-fig5-data3-v3.xlsx
-
Figure 5—source data 4
Ratio of pERK+ lymphatic endothelial cell (LEC) quantified in wildtype embryos with heatshock (+hs), sflt4+ without heatshock (-hs), wildtype embryos treated with AMD (+AMD), sflt4+ with heatshock (+hs) and sflt4+ with heatshock and AMD treatment (+hs, +AMD).
- https://cdn.elifesciences.org/articles/74094/elife-74094-fig5-data4-v3.xlsx
-
Figure 5—source data 5
Lymphatic endothelial cell (LEC) fate quantified from embryos without (-hs), or with heatshock (+hs), and with both heatshock and 20 μM AMD3100 (+hs, +AMD).
- https://cdn.elifesciences.org/articles/74094/elife-74094-fig5-data5-v3.xlsx
Figure 5—figure supplement 1
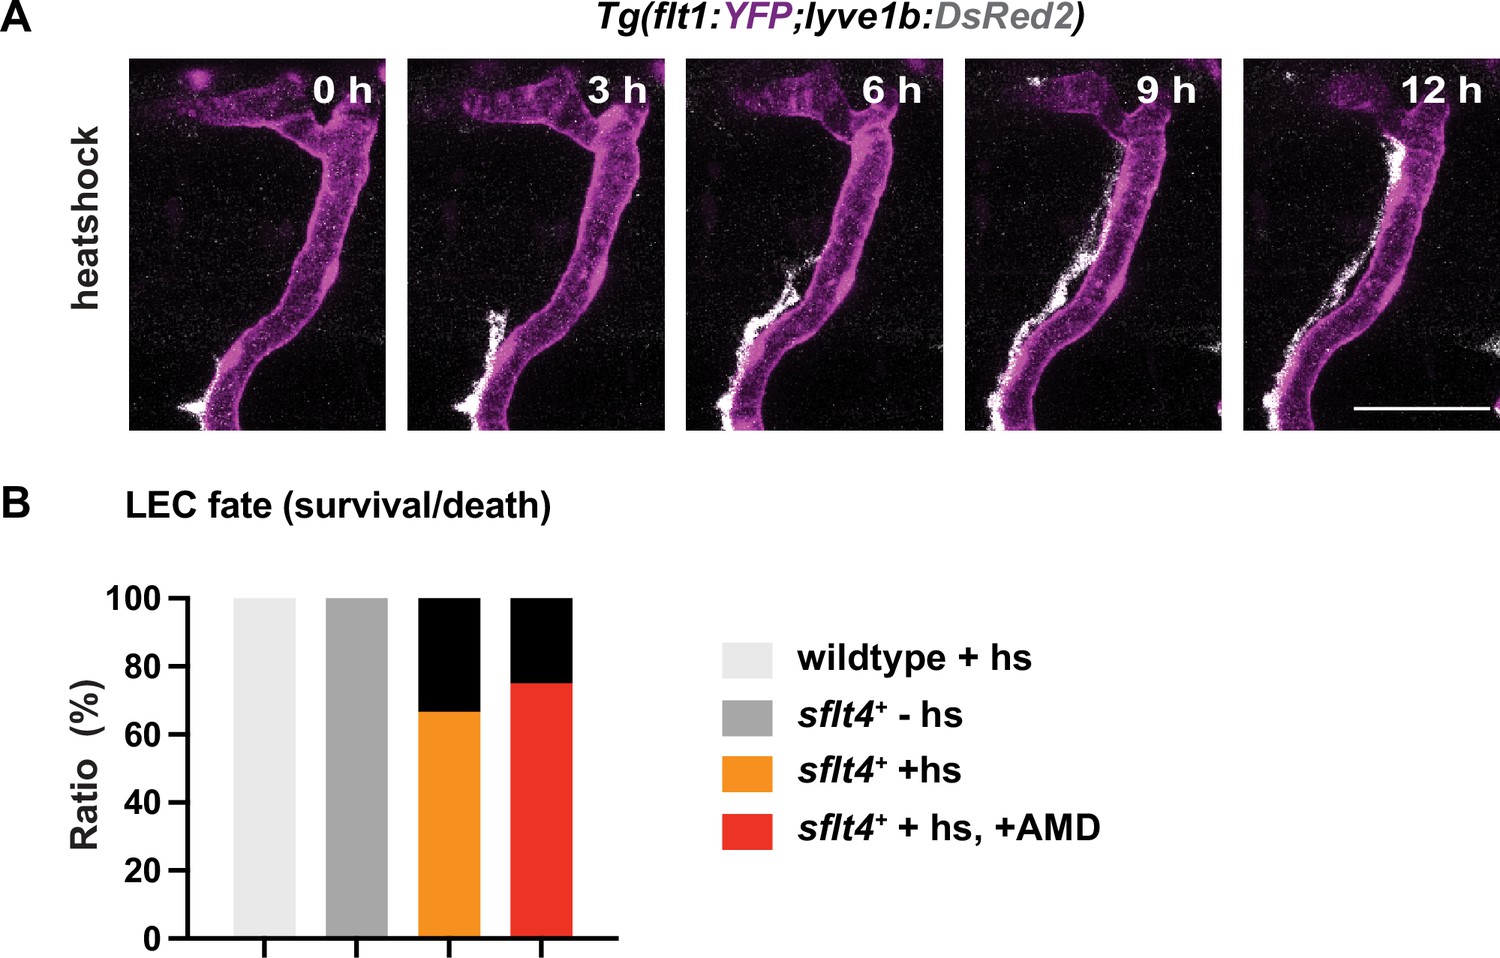
Additional confocal image and quantification of lymphatic endothelial cell (LEC) survival related to Figure 5A–B.
Figure 5—figure supplement 2
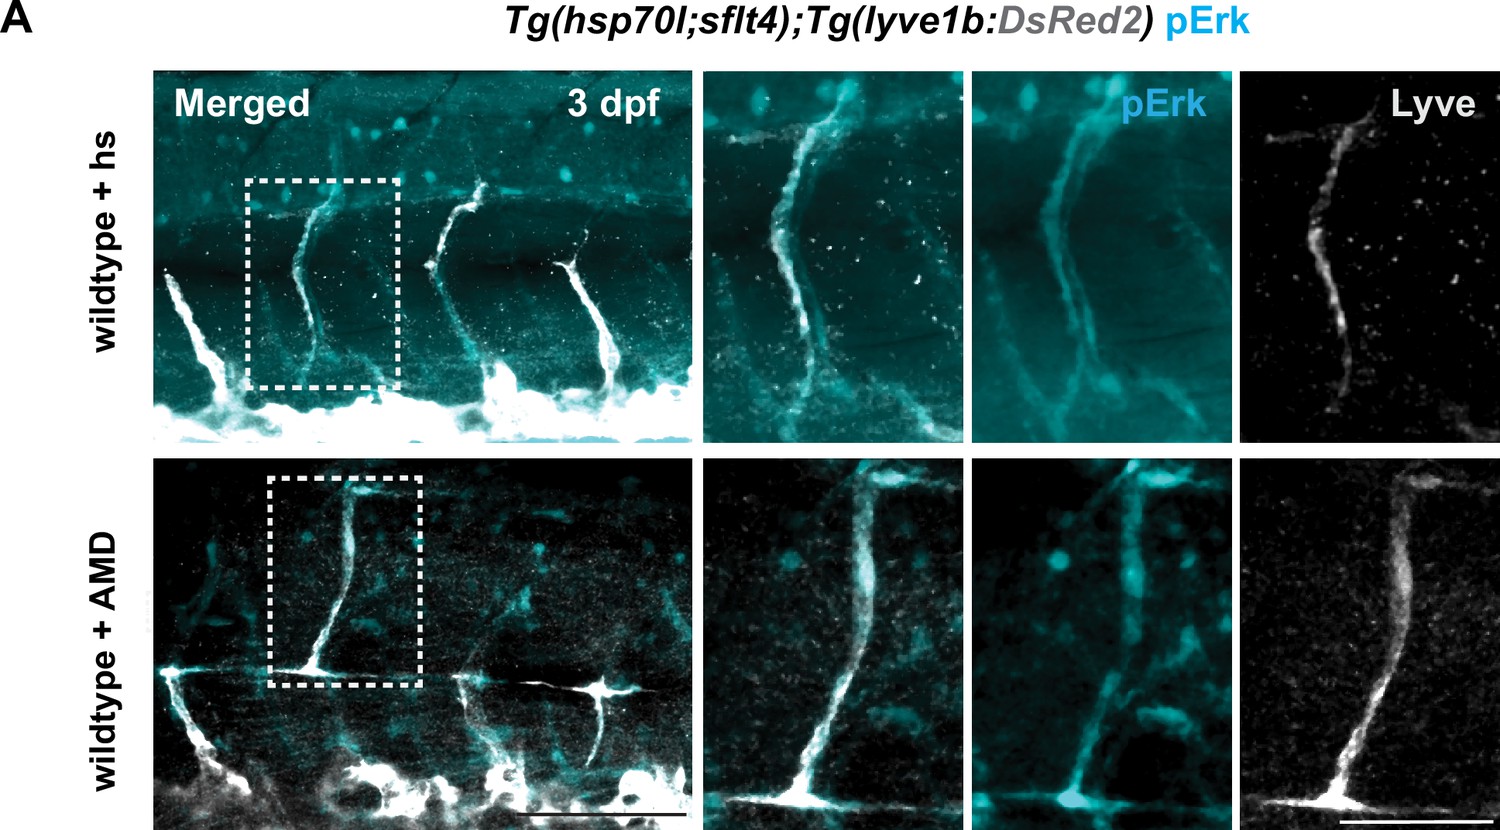
pERK in 3 days post fertilization (dpf) wildtype embryos with heatshock (+hs) and wildtype embryos treated with AMD (+AMD).
(A) Endogenous pERK (cyan) in migrating lymphatic endothelial cell (LEC) in trunk of 3 dpf Tg(hsp70l;sflt4, cryaa:Cerulean) and Tg(flt1:YFP;lyve1b:DsRed2) embryos (α-DsRed2, grey) with treatment as described in Figure 5A. Box indicates enlarged area. Scale bar: 100 μm; 50 μm in enlarged images.
Figure 5—video 1
Representative confocal time-lapse imaging of Tg(hsp70l:flt4,cryaa:Cerulean); Tg(flt1:GFP;lyve1b:DsRed2), from 60 hours post fertilization.
Embryo sflt4 + no heatshock in E3 water corresponding to Figure 5B.
Figure 5—video 2
Representative confocal time-lapse imaging of Tg(hsp70l:flt4,cryaa:Cerulean); Tg(flt1:GFP;lyve1b:DsRed2) from 60 hours post fertilization.
Embryo sflt4 + heatshocked in E3 water corresponding to Figure 5B.
Figure 5—video 3
Representative confocal time-lapse imaging of Tg(hsp70l:flt4,cryaa:Cerulean); Tg(flt1:GFP;lyve1b:DsRed2) from 60 hours post fertilization.
Embryo sflt4 + heatshoed in 20μM AMD3100, corresponding to Figure 5B.
Author response image 1
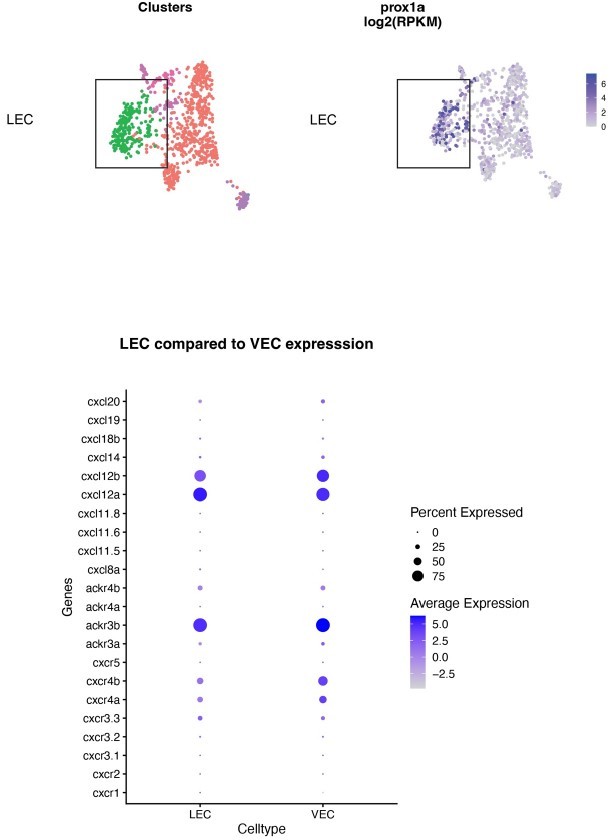
Single cell RNA-seq analysis of LEC and VEC populations at 5 dpf.
Top panel: clustering of cells, LECs marked by prox1a expression. Bottom: expression of chemokine ligands and receptors in LEC and VEC cell population.
Additional files
Download links
A two-part list of links to download the article, or parts of the article, in various formats.
Downloads (link to download the article as PDF)
Open citations (links to open the citations from this article in various online reference manager services)
Cite this article (links to download the citations from this article in formats compatible with various reference manager tools)
Proper migration of lymphatic endothelial cells requires survival and guidance cues from arterial mural cells
eLife 11:e74094.
https://doi.org/10.7554/eLife.74094


