Tonic inhibition of the chloride/proton antiporter ClC-7 by PI(3,5)P2 is crucial for lysosomal pH maintenance
- Membrane Transport Biophysics Section, National Institute of Neurological Disorders and Stroke, United States
Figures
Figure 1 with 2 supplements

Lysosomes swollen by PIKfyve inhibition are hyperacidic.
(A) Protocol timeline. U2OS cells were ‘lysosome-loaded’ with Oregon Green 488 dextran (OG loading) and treated for 3 hr with PIKfyve inhibitor apilimod (100 nM, red) or its vehicle (0.25% DMSO, control) before imaging. (B–E) A representative experiment. (B) Images of cells acquired by 445 nm laser excitation. Bright objects represent OG-positive lysosomes in control (left) versus apilimod (right) conditions. Dotted lines delineate cell outlines. (C) pH calibration curves obtained in control (gray empty circle) or apilimod (red triangle) conditions. Each symbol represents the averaged lysosomal 488/445 ratio of one cell (four cells per condition). (D) Lysosomal pH measured in control (left, gray empty circles, 16 cells, 4.40 ± 0.02) versus 100 µM apilimod (red triangles, 17 cells, 4.12 ± 0.03) for an individual experiment. Dark symbols represent averages over all cells in the experiment. Each pale symbol represents the averaged lysosomal pH of one cell. Unpaired t-test: p<0.0001. (E) Cumulative distribution of individual lysosomal pH for control (gray empty circle, 16 cells, 732 lysosomes) versus apilimod (red triangle, 17 cells, 628 lysosomes) conditions from the same experiment as in Figure 1D. Each symbol represents the fraction of lysosomes having a pH value below that represented in the abscissa. (F) Apilimod-induced pH shifts (–0.31 ± 0.04) from multiple independent experiments and corresponding fold changes in proton concentration (2.03 ± 0.17); 10 experiments (8–17 cells per condition in each experiment). Proton concentration change ([H+]change) was calculated from apilimod-induced pH shift (∆pH) using the following relation: . Paired t-test: p<0,0001. Dark symbols represent averages over all independent experiments. Each pale symbol represents the averaged lysosomal pH from multiple cells in one experiment. The dot delineated by a black box corresponds to the experiment presented in panels (B–E). Data are displayed as mean ± SEM.
Figure 1—figure supplement 1
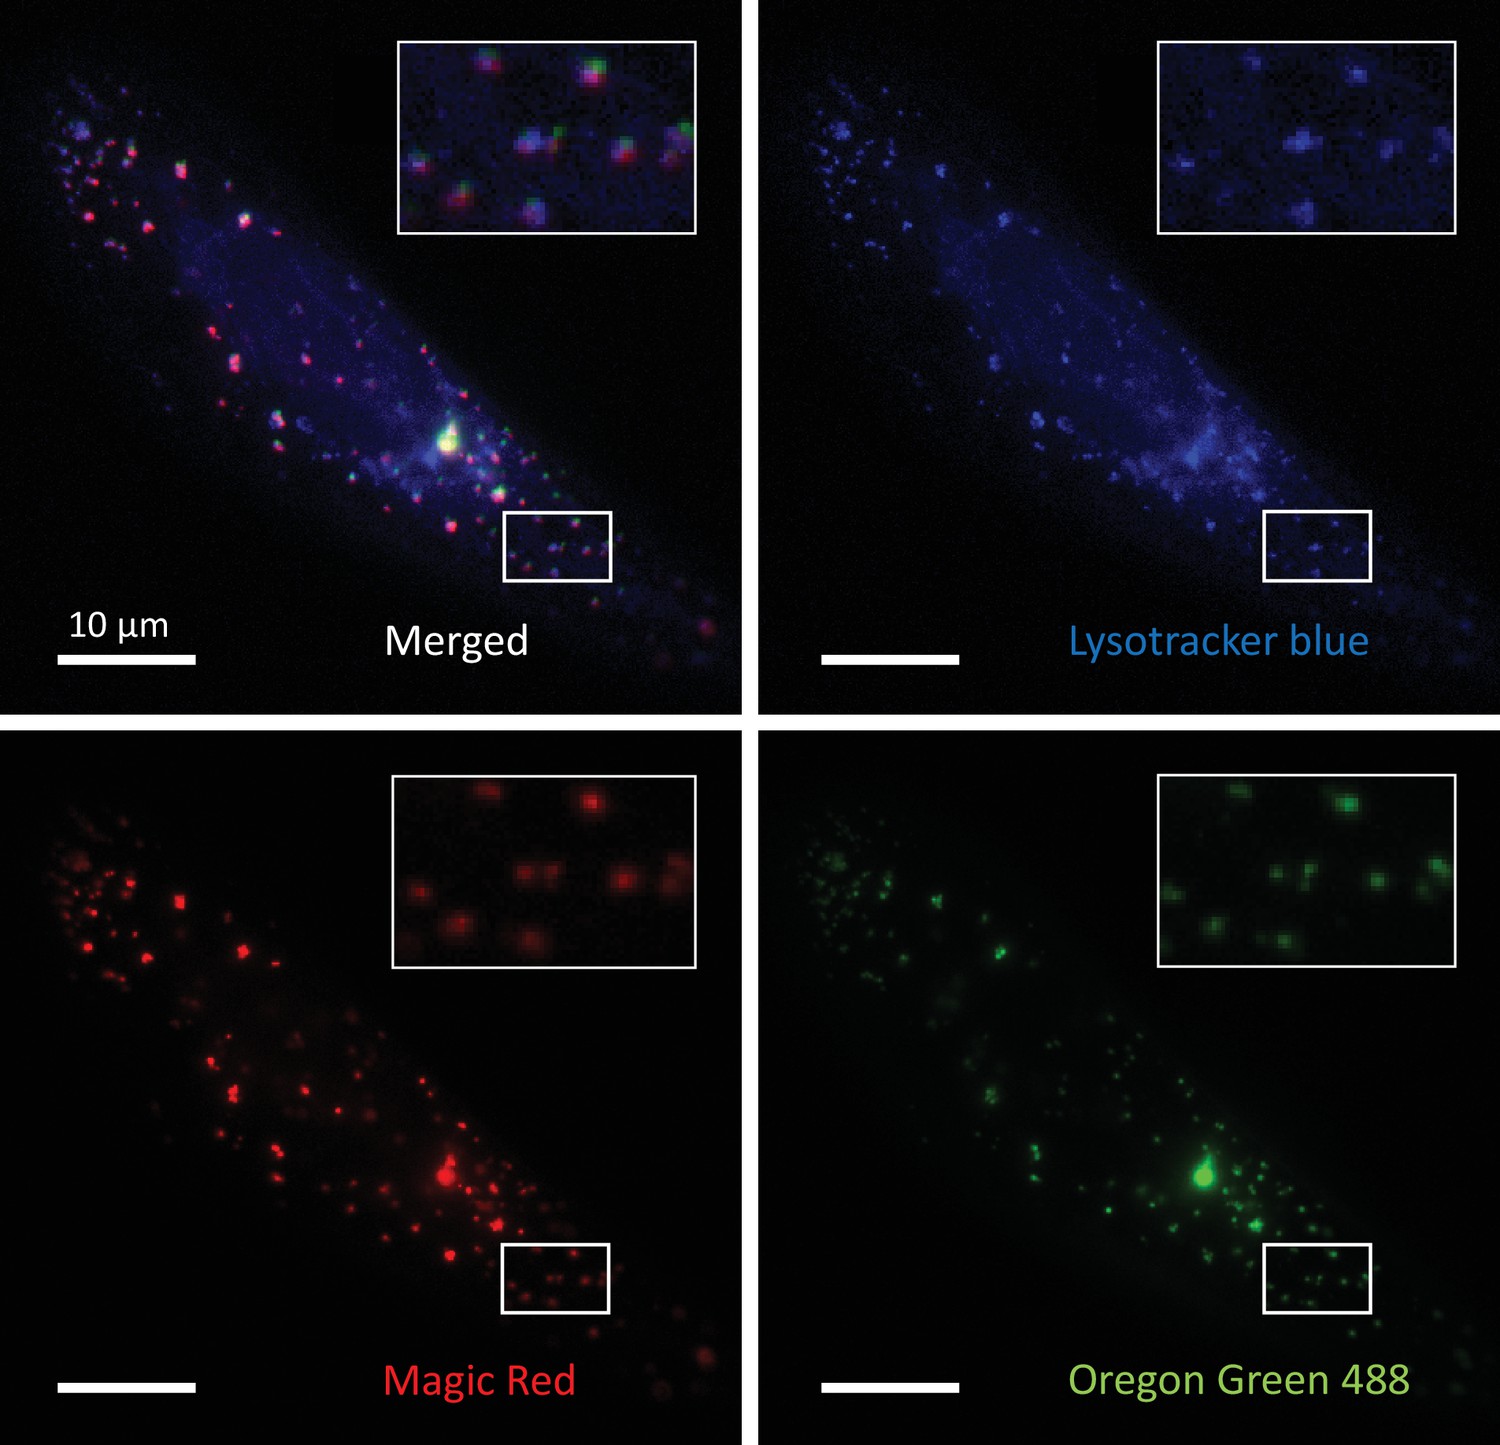
Oregon Green 488-dextran loaded vesicles represent most of the late endocytic and lysosomal compartments.
Three-channel colocalization images of a U2OS cell stained with LysoTracker Blue, Magic Red, and Oregon Green 488-dextran. LysoTracker Blue and Magic Red stain cell’s acidic compartments and cathepsin-B-positive compartments, respectively.
Figure 1—figure supplement 2
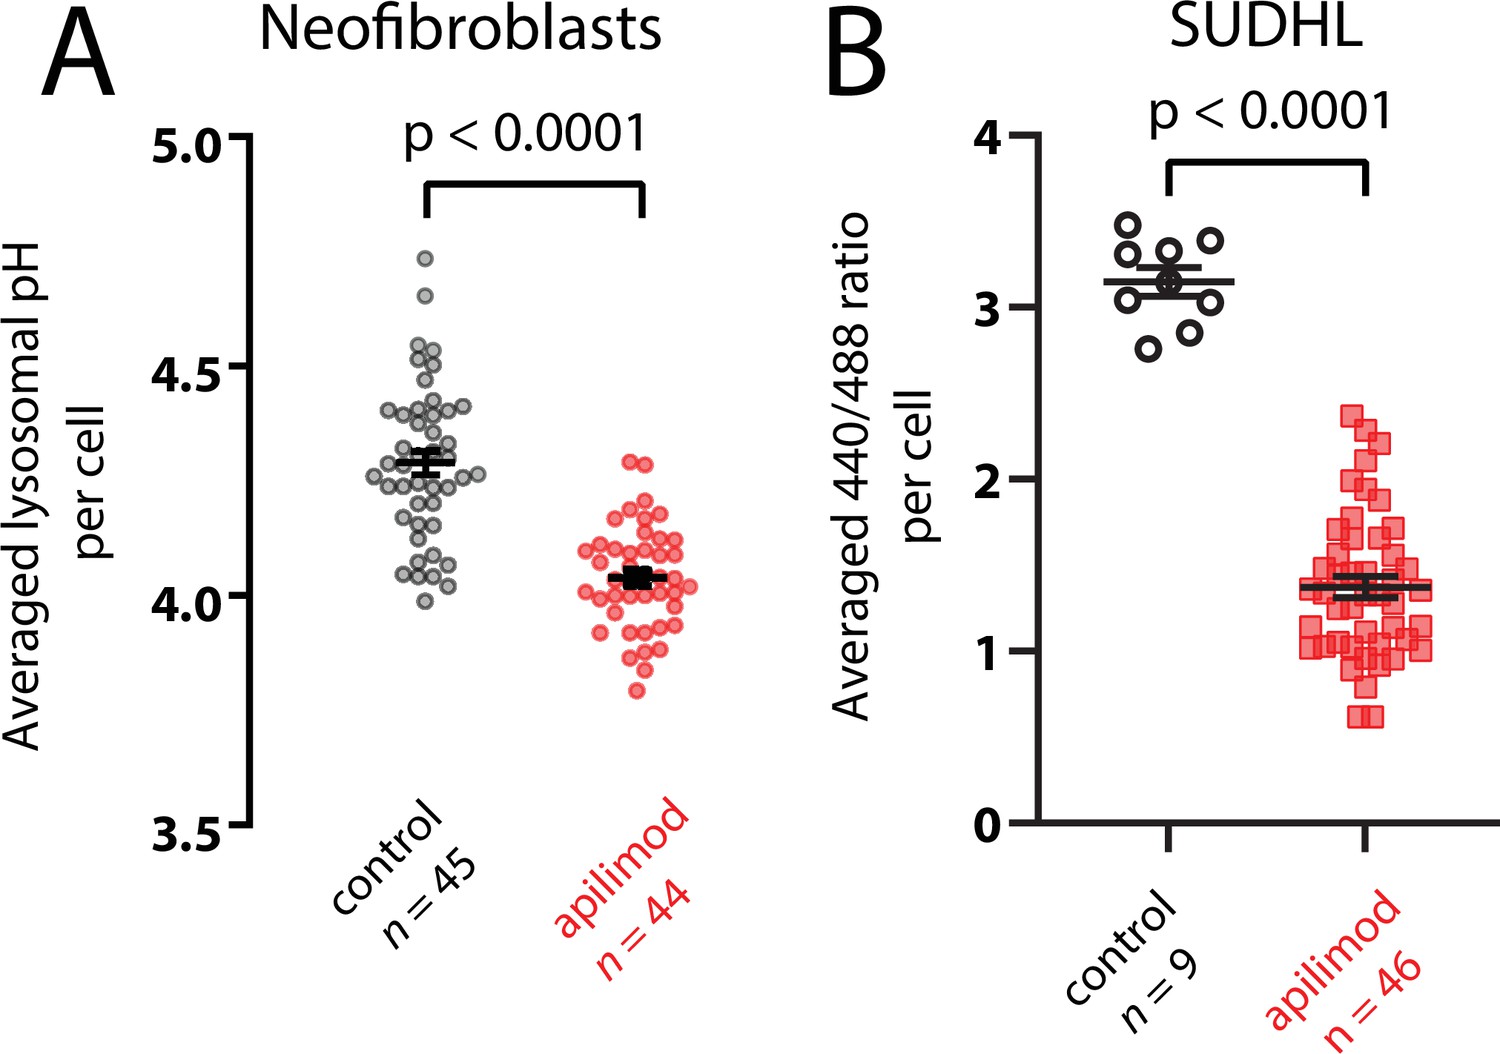
PIKfyve inhibition causes hyperacidification in neonatal fibroblasts and SUDHL cells.
Plots of the pH change (A) or ratio change (B) caused by 100 µM (A) or 200 µM (B) apilimod on either neonatal fibroblasts or SUDHL cells. Note that the 488/440 ratio is shown for SUDHL cells rather than pH because these cells were poorly adherent to glass coverslips and washed away on attempts to change solutions for pH calibration.
Figure 2 with 1 supplement
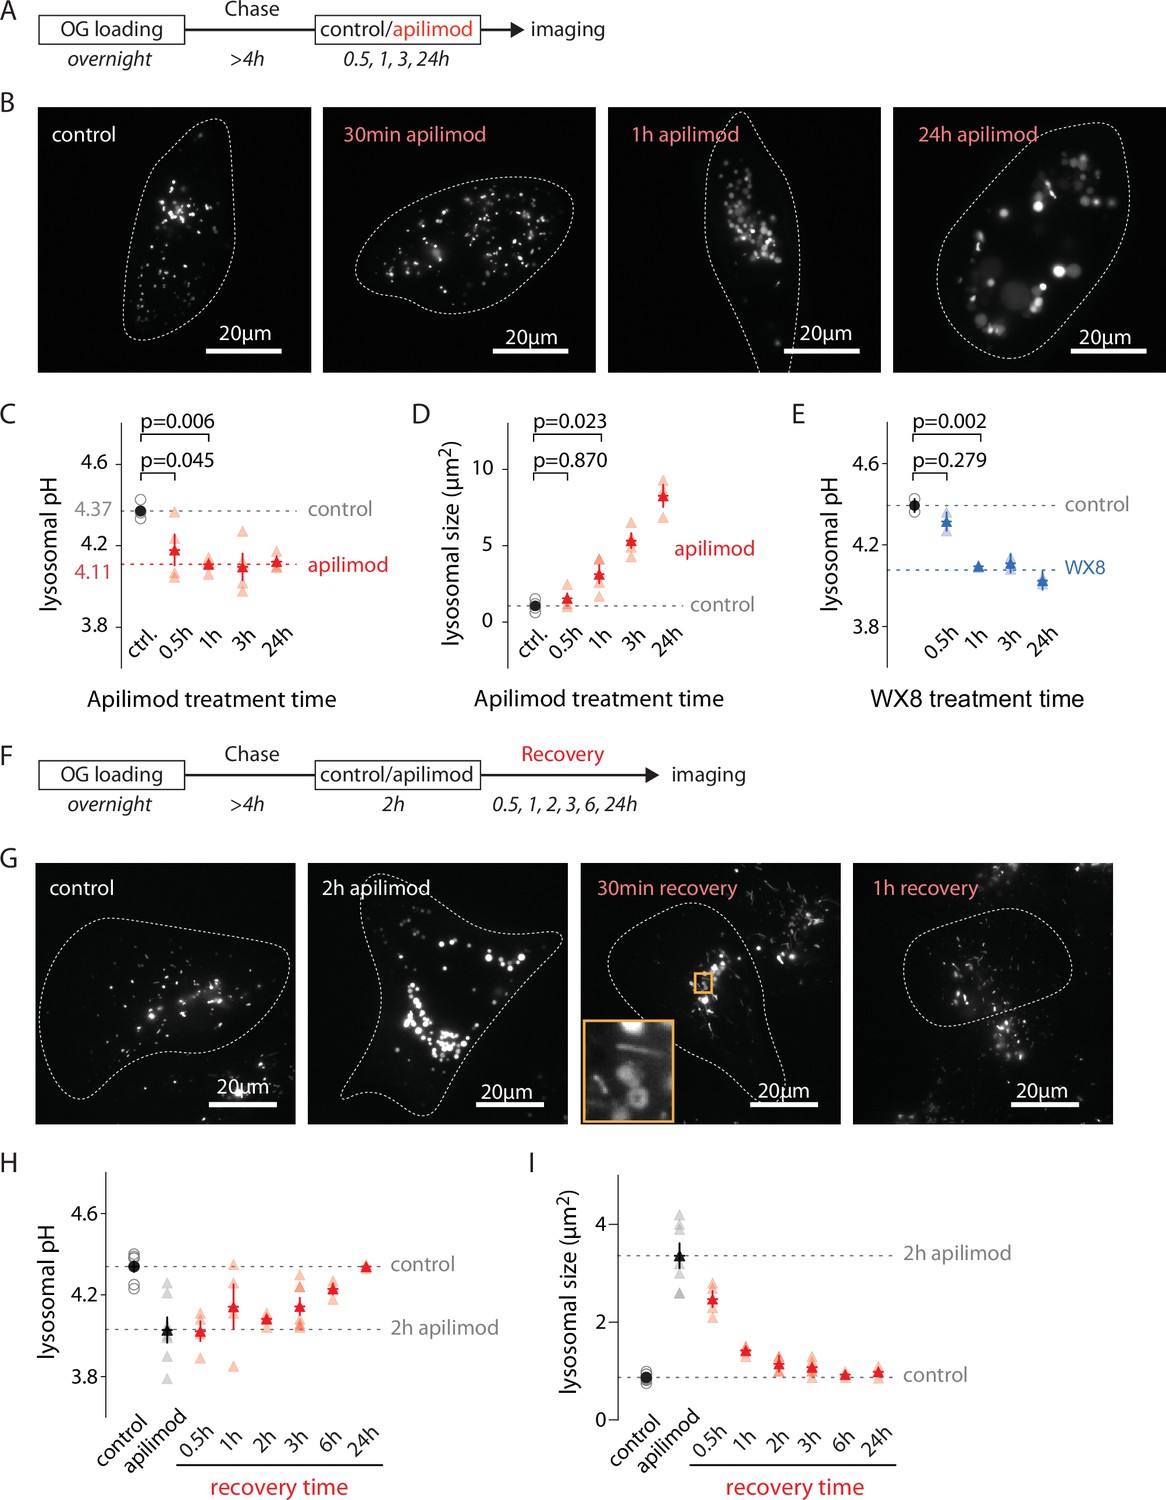
Evolution of lysosomal pH and size during PIKfyve inhibition and recovery.
(A) Protocol timeline to analyze the evolution of lysosomal pH and size during PIKfyve inhibition. U2OS cells were ‘lysosome-loaded’ with Oregon Green 488-dextran (OG) then treated for 30 min, 1 hr, 3 hr, or 24 hr with apilimod (100 nM, red) or its vehicle (0.25% DMSO, control) before imaging. (B) Representative images of cells acquired by 445 nm laser excitation. Bright objects represent OG-positive lysosomes. Dotted lines delineate cell outlines. (C, D) Comparison of lysosomal pH (C) and size (D) in control (gray empty circle) and after different apilimod treatment times (red triangle). Each symbol represents the averaged lysosomal pH of one experiment (four independent experiments, 10–15 cells per condition per experiment). Red dashed line in (C) represents the average pH value of 1–24 hr apilimod time points. p-Values were obtained from one-way ANOVA Dunnett’s multiple-comparisons test. (E) Comparison of lysosomal pH in control condition (gray empty circle) and after different treatment times with the PIKfyve inhibitor WX8 (1 µM, blue triangle). Each symbol represents the averaged lysosomal pH of one experiment (two experiments, 10–13 cells per condition per experiment). Blue dashed line represents the average value of 1–24 hr WX8 time points. (F) Protocol timeline to analyze the recovery of lysosomal pH and size after washout of apilimod. U2OS cells were ‘lysosome-loaded’ with OG, treated 2 hr with 100 nM apilimod or its vehicle (0.25% DMSO, control) to induce lysosomal hyperacidification and swelling. Apilimod was subsequently washed out with fresh media and imaged 30 min, 1 hr, 3 hr, 6 hr, and 24 hr after the washout. (G) Representative images of cells acquired using 445 nm laser excitation. Bright objects represent OG-positive lysosomes. Dotted lines delineate cell outlines. The orange box at 30 min time point highlights lysosomal tubulation events. (H, I) Comparison of lysosomal pH (H) and size (I) in control condition (gray empty circle), after 2 hr apilimod treatment (black triangle) and at different times after apilimod washout (red triangle). Each symbol represents the average lysosomal pH of one experiment (3–7 experiments, 8–15 cells per condition per experiment).
Figure 2—figure supplement 1
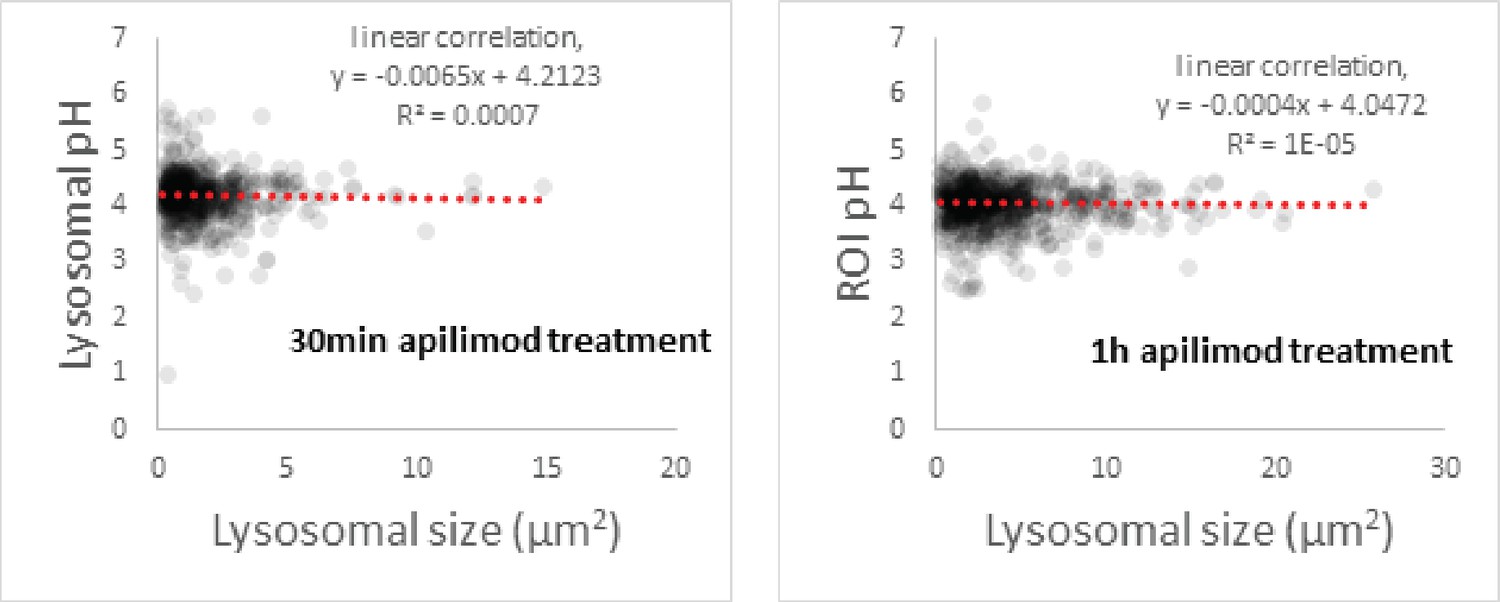
Under PIKfyve inhibition, lysosomal pH does not correlate with lysosomal size.
Representative plot of pH versus size of Oregon Green 488-dextran (OG)-loaded lysosomes after 30 min (left) or 1 hr (right) apilimod treatment. We calculated the linear correlation to give a gross estimation of the relation between the two parameters (red dashed line). Populations of each graph represent all lysosomes from the experiment used in Figure 2C and D (11 cells, 632 lysosomes and 13 cells, 771 lysosomes for 30 min and 1 hr apilimod treatment, respectively).
Figure 3 with 1 supplement
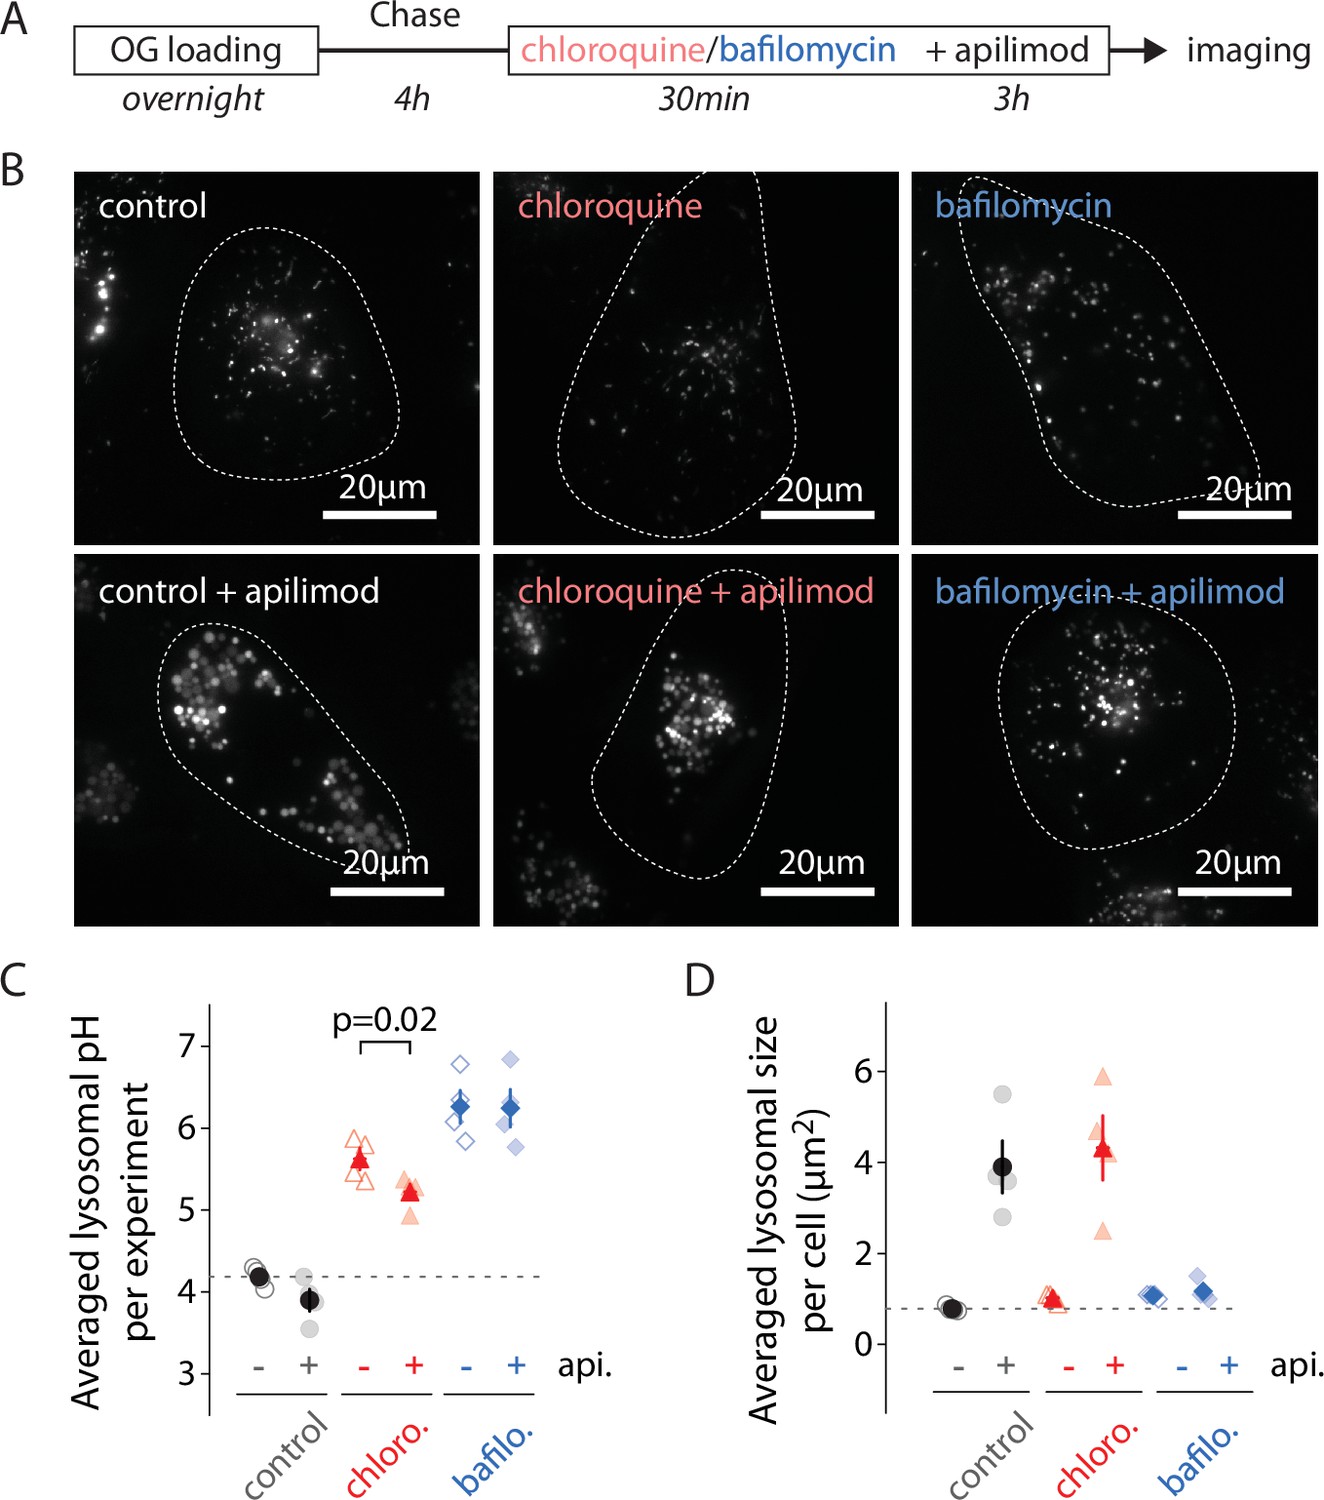
Alkilinazing lysosomal pH does not prevent lysosomal swelling.
(A) Protocol timeline. U2OS cells were ‘lysosome-loaded’ with Oregon Green 488-dextran (OG) and pretreated 30 min with chloroquine (12 µM, red), BafA1 (100 nM, blue), or a vehicle (0.31% DMSO, gray), before 3 hr treatment with apilimod (100 nM, bottom images) or a vehicle (control, DMSO 0.31%, upper images). (B) Representative images of cells acquired by 445 nm laser excitation. Bright objects represent OG-positive lysosomes. Dotted lines delineate cell outlines. (C, D) Comparison of lysosomal pH (C) or size (D) in control (gray), chloroquine (chloro., red), and BafA1 (bafilo., blue) conditions during untreated (api. -, empty symbols) versus apilimod treated (api. +, filled symbols) conditions. Each symbol represents the averaged lysosomal pH or size of one experiment (four experiments; 8–11 cells per condition). In (C), apilimod induces a lysosomal pH shift to more acidic value in chloroquine condition (paired t-test, p=0.02).
Figure 3—figure supplement 1

30-minute treatment with chloroquine is sufficient to induce alkalization of endo/lysosomal compartments.
Two representative experiments are shown. The level of alkalization after 30 min (red) is comparable to the one after 3 hr chloroquine (blue) treatment. Two independent experiments are represented. chloro.: chloroquine.
Figure 4
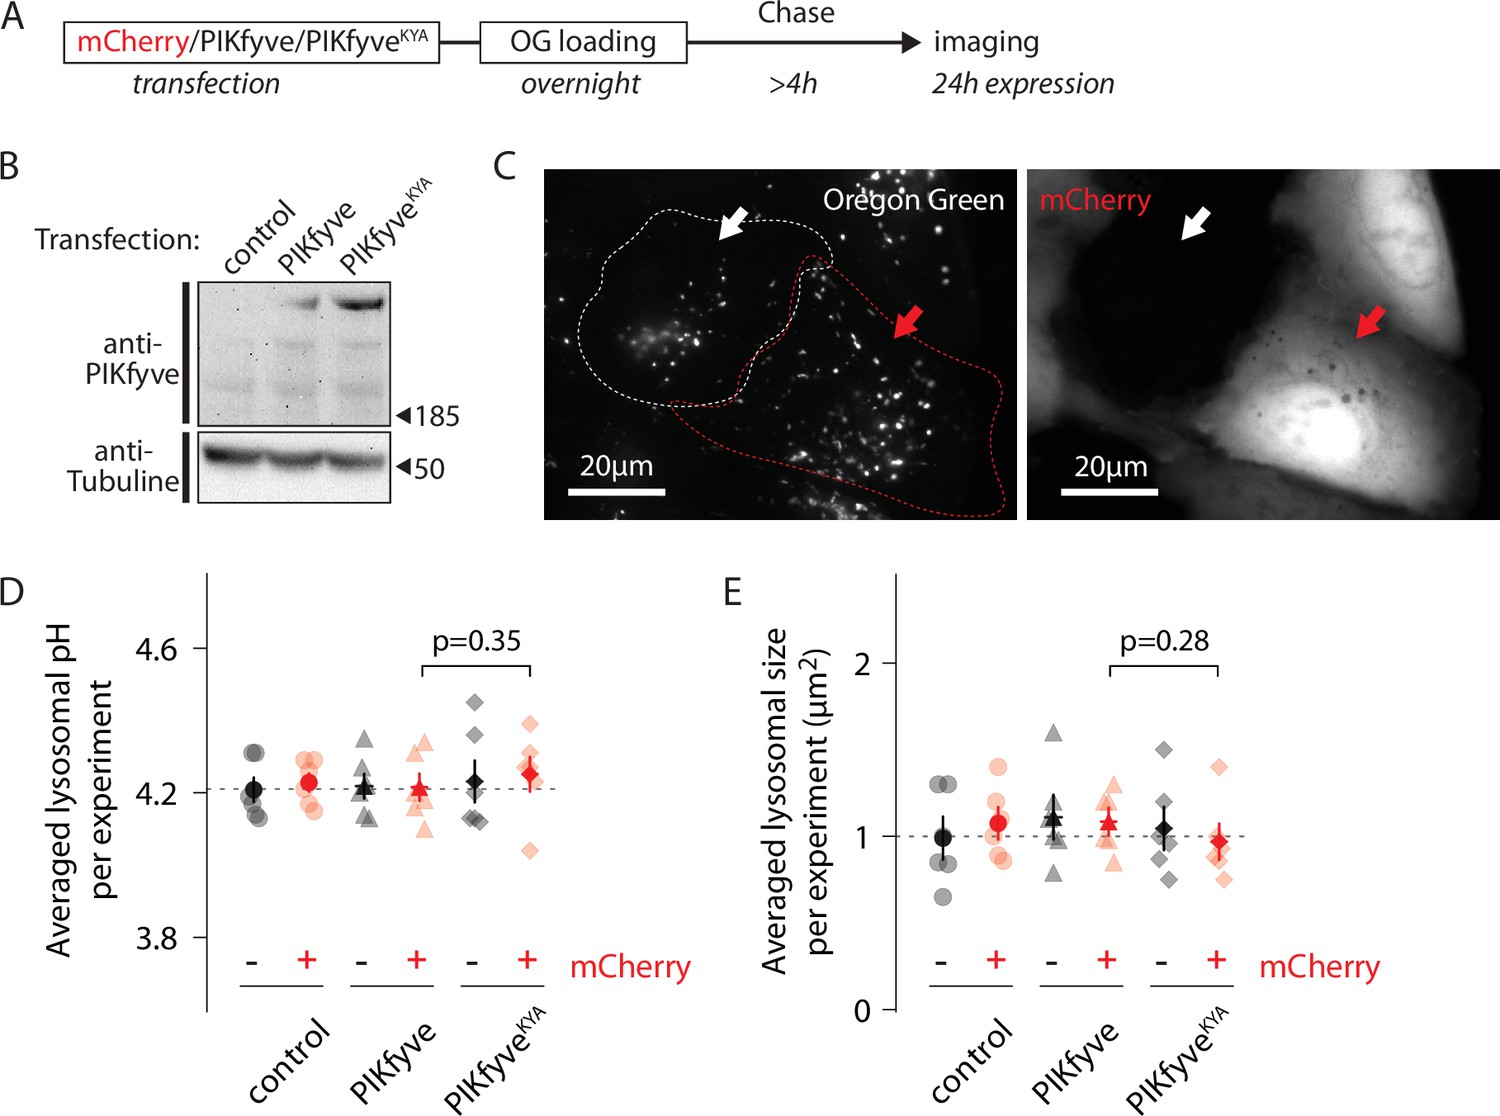
Increasing PI(3,5)P2 levels does not affect lysosomal pH.
(A) Protocol timeline. U2OS cells were transfected with either mCherry alone, mCherry and PIKfyve, or mCherry and PIKfyveKYA and subsequently ‘lysosome-loaded’ with Oregon Green 488-dextran (OG). Cells were imaged after 24 hr expression to quantify lysosomal pH and size. (B) Western blot indicating PIKfyve or PIKfyveKYA expression level for each condition after 24 hr expression. Note that PIKfyve endogenous level (control) was too low to be detected. (C) Representative cells imaged by 445 nm laser excitation (OG channel, left image) and 640 nm laser excitation (mCherry channel, right image). The red arrow indicates one cell containing lysosomes loaded with OG (bright dots in OG channel) and expressing mCherry (bright cell in mCherry channel). The white arrow indicates one cell from the same batch containing lysosomes filled with OG but not expressing mCherry. Dotted lines delineate cell shape. (D, E) Comparison of lysosomal pH (D) or size (E) in control (circle), PIKfyve-transfected (triangle), and PIKfyveKYA-transfected (diamond) conditions. For each condition, cells were separated into two populations based on the presence or absence of mCherry. Each symbol represents the averaged lysosomal pH or size of one experiment (six experiments; 8–11 cells per condition per experiment). p-Values: paired t-test between PIKfyve-mCherry and PIKfyveKYA-mCherry conditions.
-
Figure 4—source data 1
Raw blot tubulin: merged images combining a light image of the blot itself and the chemiluminescent image of the blot probed with antitubulin antibody.
- https://cdn.elifesciences.org/articles/74136/elife-74136-fig4-data1-v2.zip
-
Figure 4—source data 2
Raw blot tubulin: merged images of the same blot as above, but probed with an anti-PIKfyve antibody.
- https://cdn.elifesciences.org/articles/74136/elife-74136-fig4-data2-v2.zip
-
Figure 4—source data 3
Labeled gel: the above gel images with labels.
- https://cdn.elifesciences.org/articles/74136/elife-74136-fig4-data3-v2.zip
Figure 5 with 2 supplements
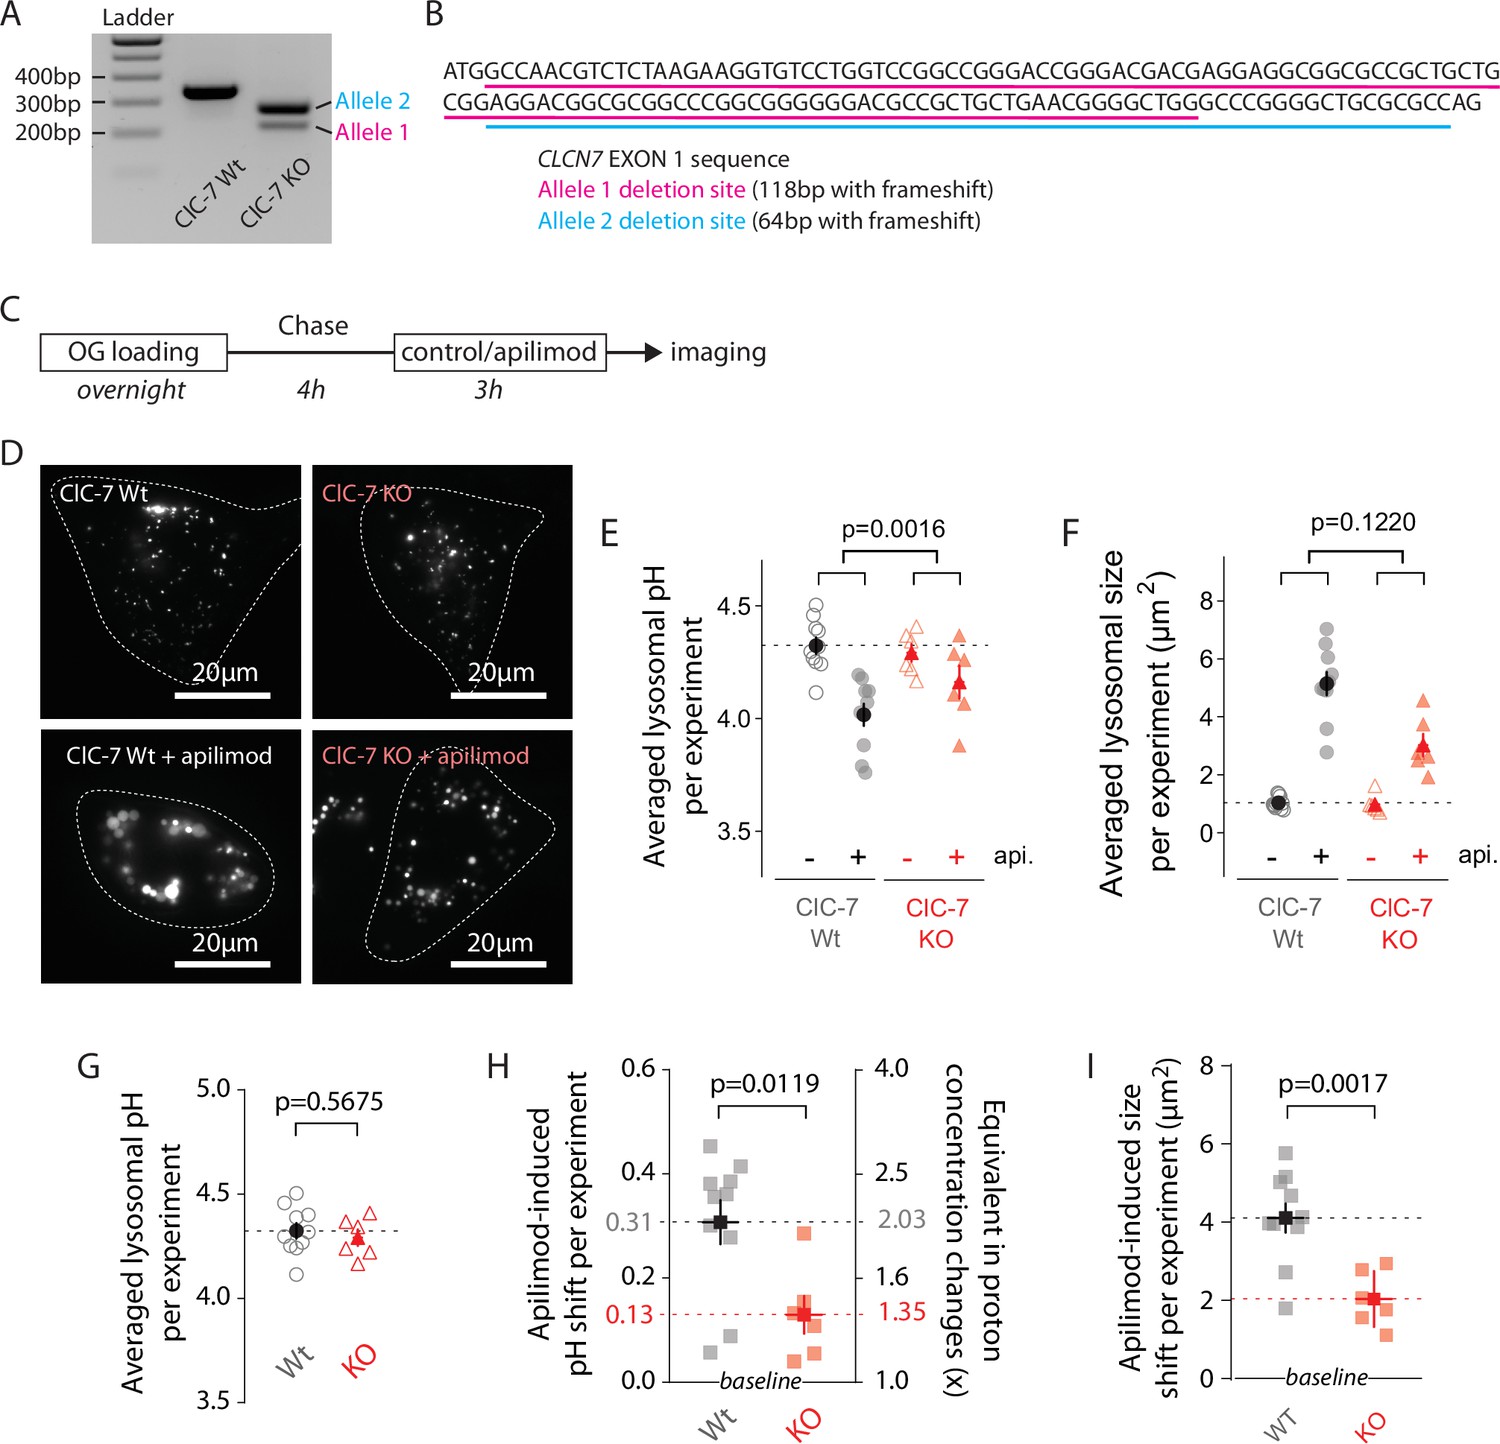
ClC-7 knockout (KO) cells display both lysosomal hyperacidification and swelling reduction.
(A) Agarose gel electrophoresis of PCR product amplified from ClCN7 deletion site of wildtype (ClC7 Wt, left) and CLCN7 KO (ClC-7 KO, right) U2OS cells. (B) EXON1 sequence from CLCN7 WT (black) and KO (purple and teal) alleles. (C) Protocol timeline. Cells were ‘lysosome-loaded’ with Oregon Green 488-dextran (OG) and treated for 3 hr with apilimod (100 nM, red) or its vehicle (0.25% DMSO, control) before imaging. (D) Images from a representative experiment: ClC-7 WT (left) or ClC-7 KO (right) cells acquired by 445 nm laser excitation. Bright objects represent OG-positive lysosomes in control (top) versus apilimod (bottom) conditions. Dotted lines delineate cell outlines. (E, F) Lysosomal pH (E) or size (F) from ClC-7 WT (gray circle) or ClC-7 KO (red triangle) cells in apilimod (filled symbols) versus control (empty symbols) in a representative experiment. Dark symbols are averages over all cells; each pale symbol represents the average lysosomal pH from one cell. p-Values for apilimod effects are obtained from two-way ANOVA. (G) There is no significant difference in pH between untreated WT and untreated KO cells (p=0.5675, unpaired t-test). For (G - I), dark symbols are averages over all experiments; each pale symbol represents the averaged lysosomal pH or size from one experiment (10 and 6 independent experiments for WT and KO conditions, respectively; each experiment represents 8–18 cells per condition). (H, I) Comparison of lysosomal pH shift (H) or size shift (I) induced by apilimod treatment in ClC-7 Wt (gray) versus ClC-7 KO (red) cells. Proton concentration change (H), [H+]change was calculated from apilimod-induced pH shift (∆pH) using the following relation: . p-Values from unpaired t-test.
-
Figure 5—source data 1
Raw gel: agarose gel of PCR product amplified from CLCN7 deletion site of wildtype (WT) and CLCN7 knockout (KO) U2OS cells.
- https://cdn.elifesciences.org/articles/74136/elife-74136-fig5-data1-v2.zip
-
Figure 5—source data 2
Labeled gel: same gel as above with labels.
- https://cdn.elifesciences.org/articles/74136/elife-74136-fig5-data2-v2.zip
Figure 5—figure supplement 1
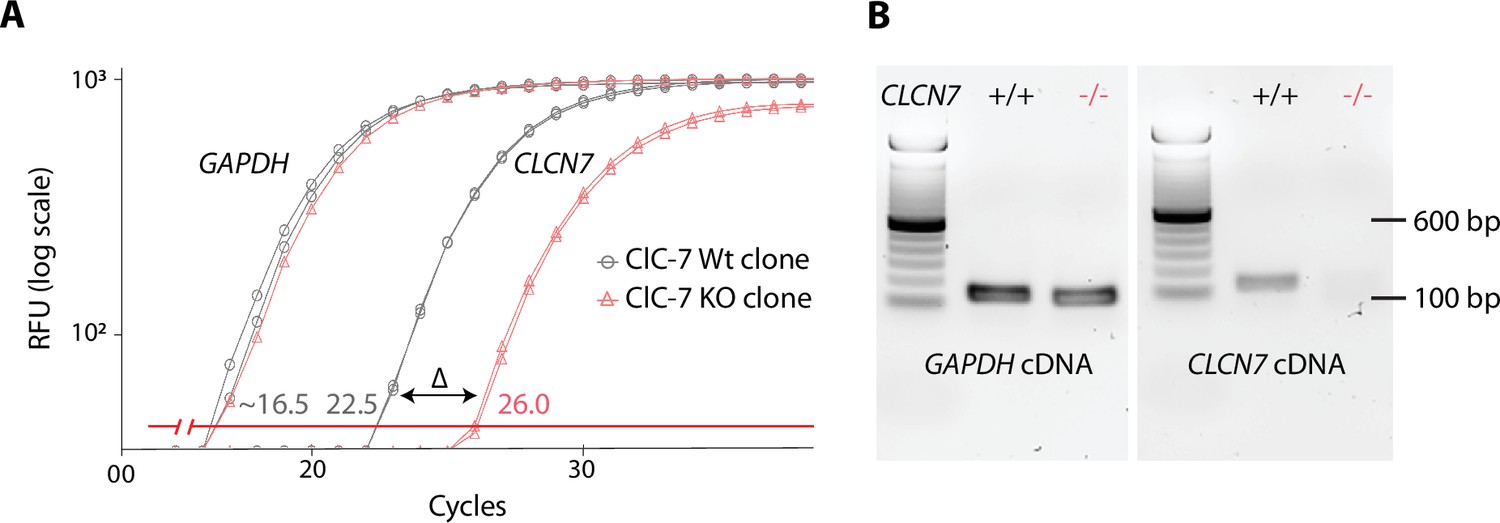
Validation of the U2OS ClC-7 knockout (KO) clone.
(A) RT-qPCR amplification plot obtained from ClC-7 wildtype (Wt) (gray) and ClC-7 KO (red) U2OS cells whole RNA. GAPDH housekeeping RNA level (left gray and left red traces) is used as a control of RNA quantity. ClCN7 RNA level corresponds to right gray and right red traces. ∆ = 3.5 cycles, indicating a 90% decrease in KO ClC-7 RNA level compared to Wt. (B) Agarose gel electrophoresis of qPCR product from ClC-7 Wt (gray) and ClC-7 KO (red) U2OS cells GAPDH or CLCN7 cDNA.
-
Figure 5—figure supplement 1—source data 1
Raw gel: agarose gel of RT-PCR products of GAPDH (positive control), ClC-7 wildtype (WT), and ClC-7 knockout (KO) U2OS cells.
- https://cdn.elifesciences.org/articles/74136/elife-74136-fig5-figsupp1-data1-v2.zip
-
Figure 5—figure supplement 1—source data 2
Labeled gel: labeled gel of above.
- https://cdn.elifesciences.org/articles/74136/elife-74136-fig5-figsupp1-data2-v2.zip
Figure 5—figure supplement 2

.CLCN7 deletion does not affect ‘lysosome-loading’ with Oregon Green 488-dextran (OG) and does not alter pH measurements.
Left: pH calibration curves of U2OS ClC-7 wildtype (WT) or ClC-7 knockout (KO) lysosomes loaded with OG in untreated (control) or 3 hr apilimod-treated conditions (apilimod). Each dot represents the averaged lysosomal 488/445 ratio of one cell (four cells per condition). Right: comparison of cumulative distribution of U2OS ClC-7 Wt (gray, control, 9 cells, 427 objects) versus ClC-7 KO (blue, 10 cells, 548 objects) lysosomal pH population. Each symbol represents the proportion of lysosomes having a pH value below the pH value represented in the abscissa axis.
Figure 6 with 3 supplements
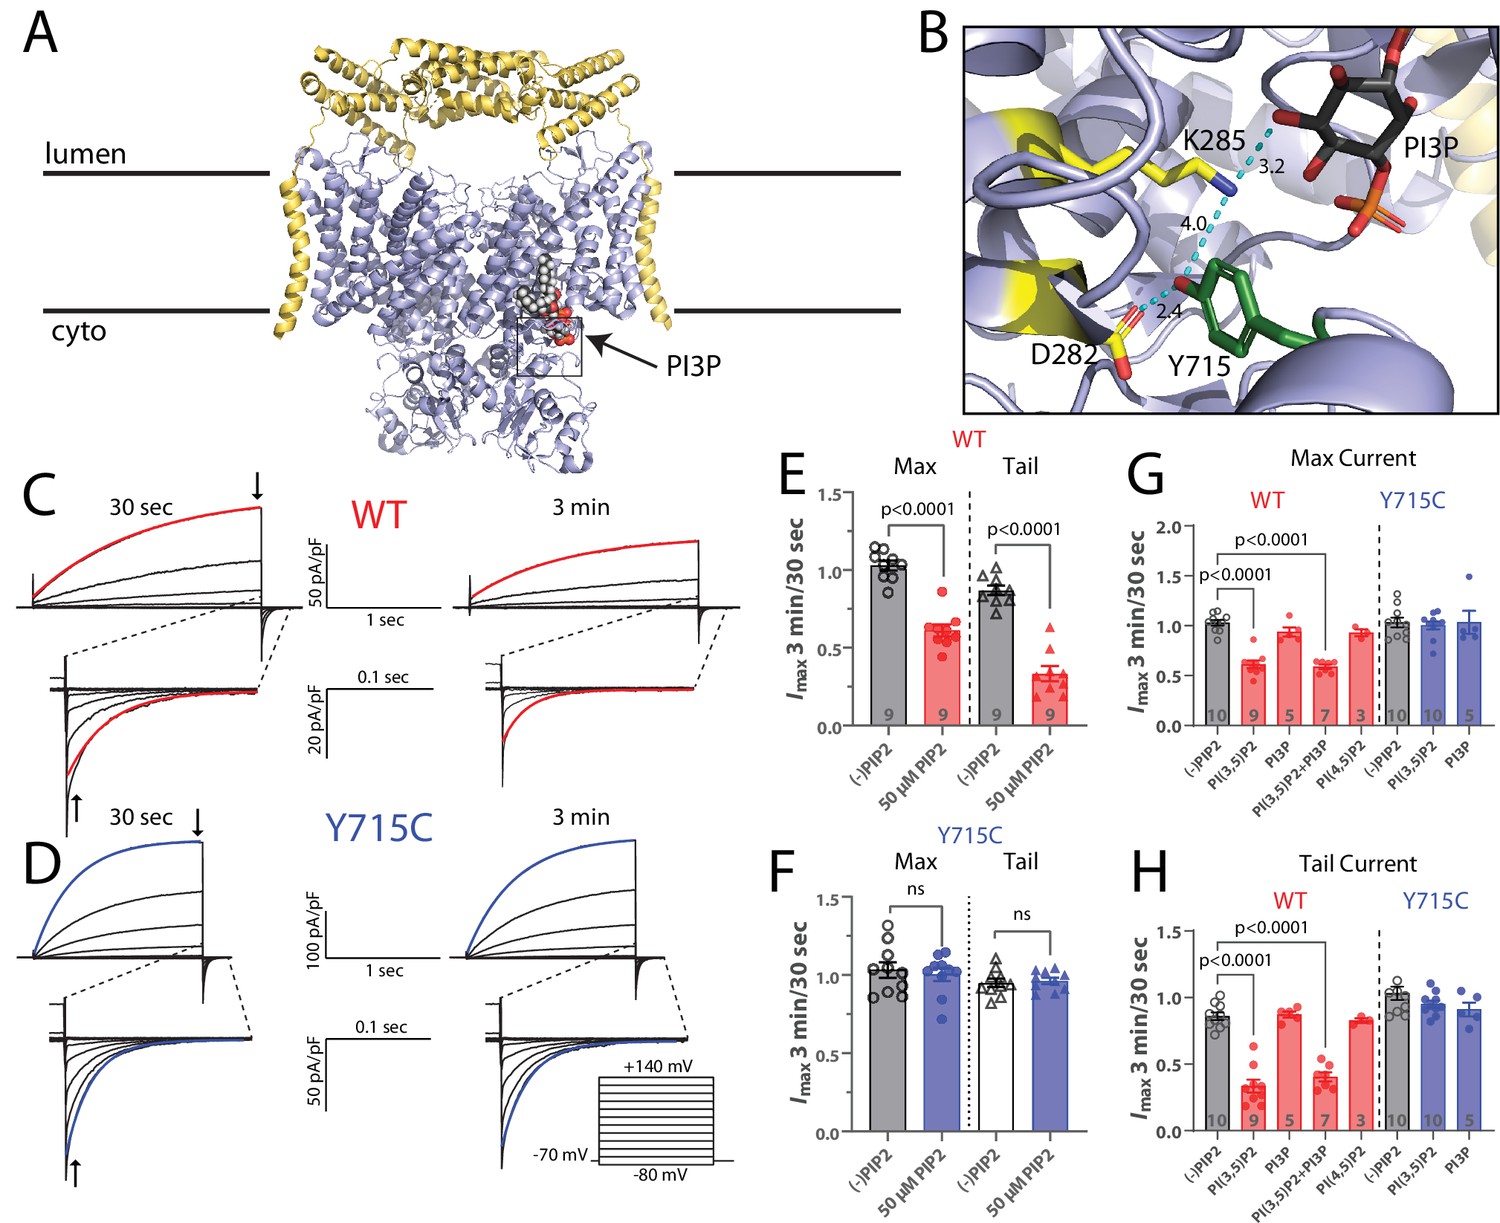
PI(3,5)P2 inhibits ClC-7-mediated currents.
(A) Cryo-EM structure of human ClC-7 (pale blue) and Ostm1 (yellow) (PDB 7JM7). PI3P is modeled bound at the interface between the transmembrane domain and the cytosolic CBS domains. (B) Enlarged view of the PI3P binding region boxed in (A). The structure reveals a hydrogen-bonding network involving the phospholipid headgroup and adjacent residues, including Y715. Measurement distances in angstroms are indicated. (C, D) Representative whole-cell current traces recorded from HEK-293 cells transfected with (C) wild-type or (D) Y715C mutant ClC-7. After allowing the pipette solution containing 50 µM PI(3,5)P2 to diffuse into the cell for 3 min, maximum voltage-activated current magnitude and tail current magnitude on returning to holding potential were reduced in currents from wildtype but not mutant ClC-7. Red or blue lines indicate a single exponential fit to obtain time constants. (E, F) The ratio of current magnitudes measured at 3 min and 30 s after cell break-in from (E) wildtype and (F) Y715C-transfected cells as indicated by arrows in (C) and (D). Each point represents the ratio of two successive recordings from a single cell. Error bars represent standard error of the mean, and p-values are calculated from a two-tailed unpaired Student’s t-test. (G, H) Effect of 50 µM phospholipids on the change in (G) maximum current and (H) tail current after a +140 mV pulse as measured by the ratio of the indicated values 3 min and 30 s after cell break-in. Error bars represent standard error of the mean, and adjusted p-values are calculated by Tukey’s method.
Figure 6—figure supplement 1
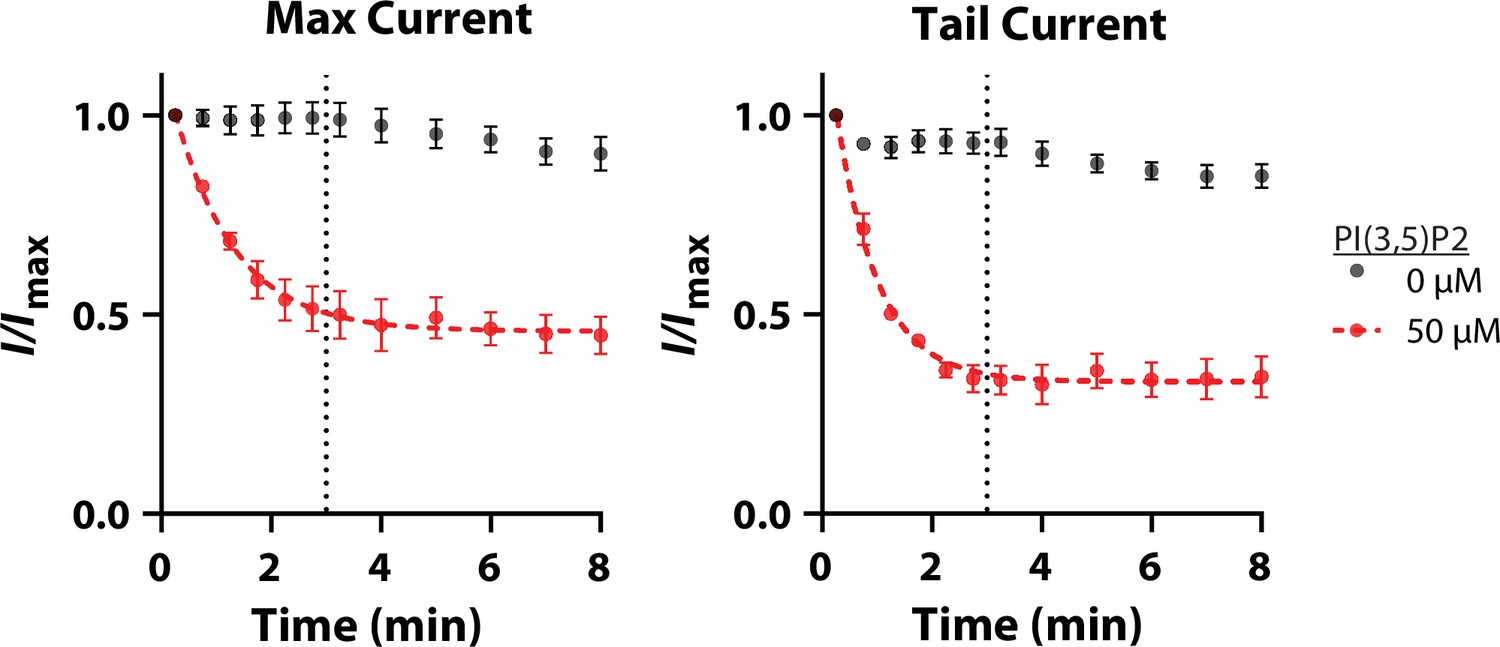
Time course of PI(3,5)P2 inhibition.
Currents were recorded in whole-cell configuration after a 2 s,+140 mV pulse and return to –70 mV holding potential. Maximum and tail currents were measured at the time points indicated without (black) and with (red) 50 µM PI(3,5)P2 included in the pipette solution (n = 3 each). When PI(3,5)P2 was included, currents gradually decreased over time, reaching a maximum effect by ~3 min (dotted line). Dashed red line shows a single exponential fit, error bars represent SEM.
Figure 6—figure supplement 2
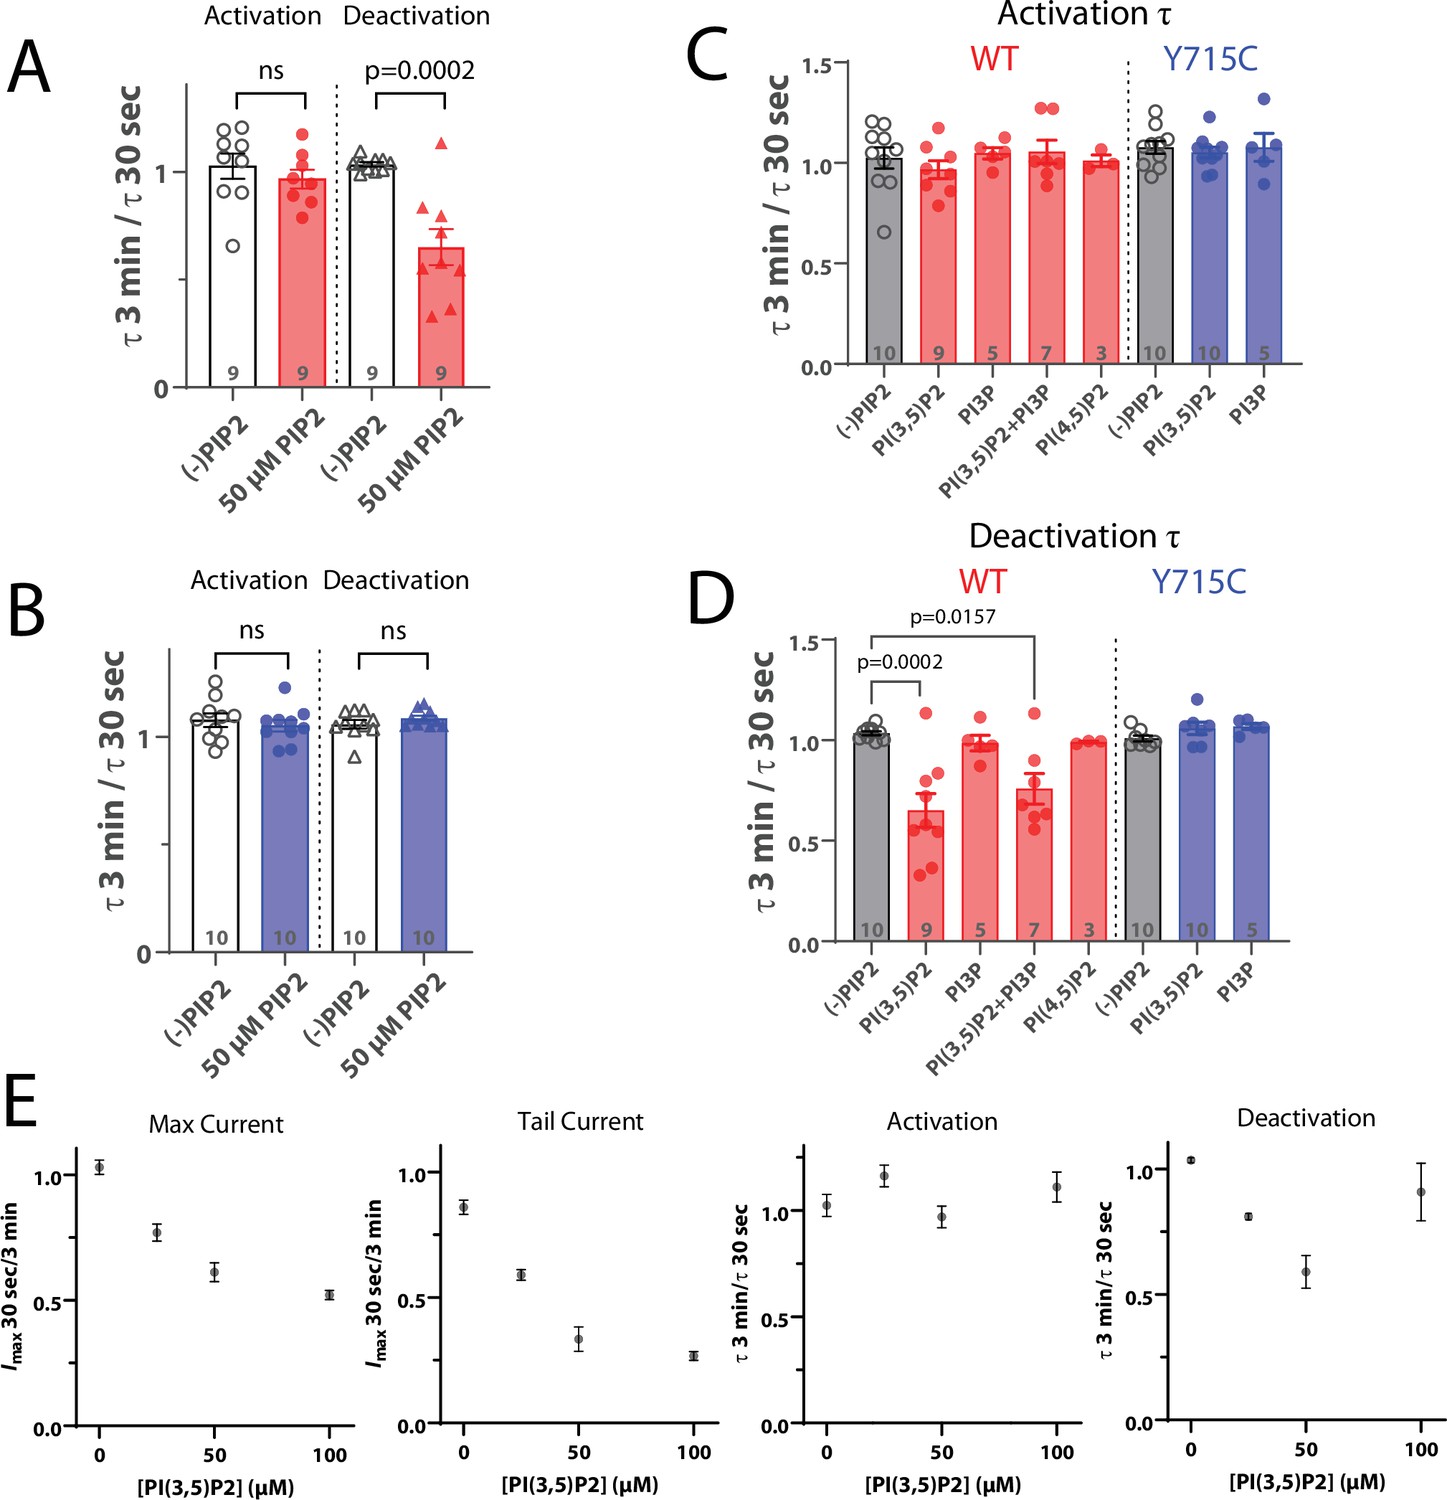
Effect of phosphoinositides on ClC-7 currents in HEK cells.
(A, B) Ratio of time constants obtained from single exponential fits of patch-clamp current traces after a +140 mV pulse (activation) and subsequent return to –70 mV holding potential (deactivation). Currents were measured from HEK-293 cells transiently expressing (A) wildtype ClC-7 or (B) ClC-7-Y715C. (C, D) Ratio of time constants after exposure to 50 µM of the indicated phosphoinositide. (E) Dose dependence of ClC-7 inhibition by PI(3,5)P2. Each point represents the average value from n ≥ 6 HEK-293 cells transiently transfected with wildtype ClC-7.
Figure 6—figure supplement 3
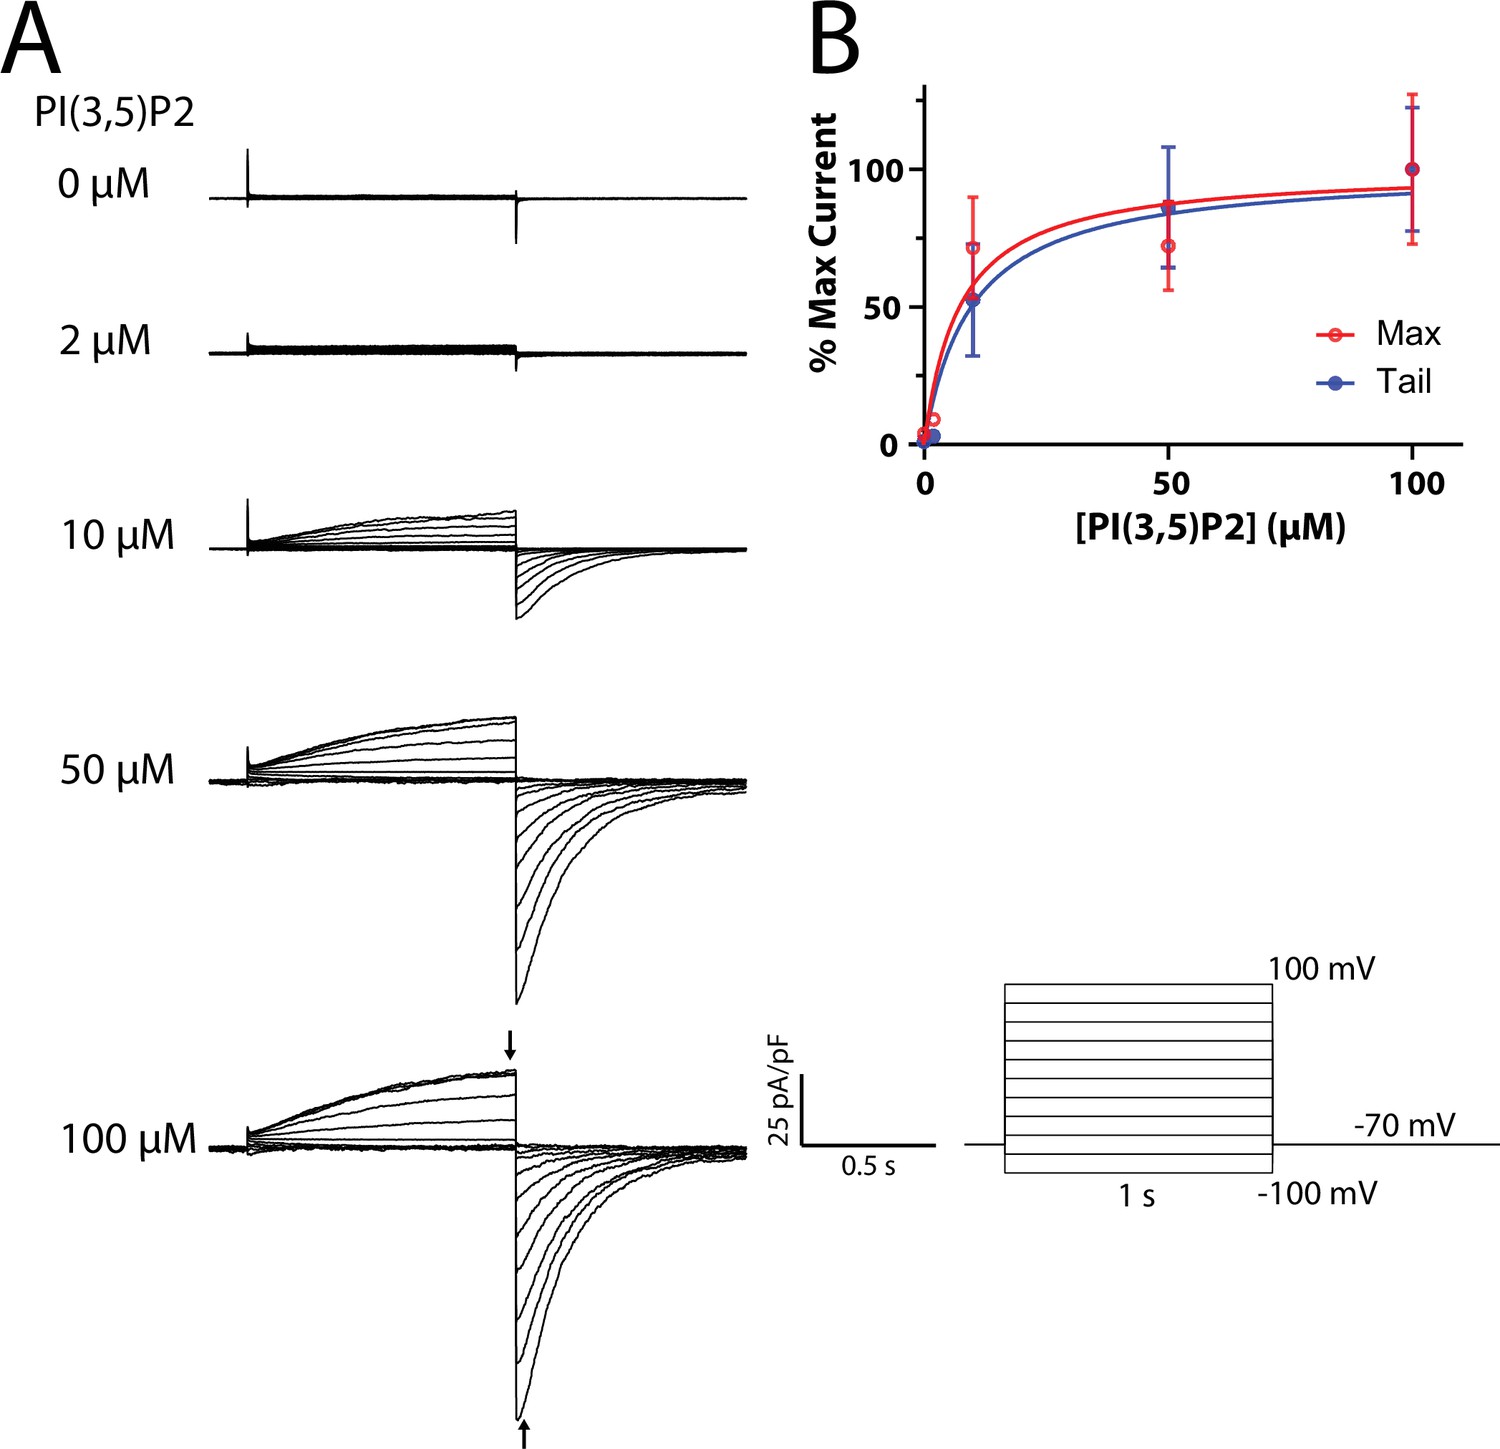
Mouse TPC1 currents evoked by PI(3,5)P2.
(A) Representative whole-cell currents measured from mTPC1-transfected HEK293 cells 3 min after break-in, with the indicated concentration of PI(3,5)P2 diC8 included in the pipette solution. Voltage pulse protocol is shown at bottom right. (B) Dose–response curve of mouse TPC1 currents in the presence of PI(3,5)P2, with values taken from the time points indicated by arrows in the 100 µM trace and normalized to the average maximum value at 100 µM PI(3,5)P2. Solid lines are fits to the Hill equation, yielding EC50 values of 7 ± 4 µM and 10 ± 5 µM for max and tail currents, respectively. For each concentration, currents from 3 to 5 cells were recorded.
Figure 7 with 1 supplement
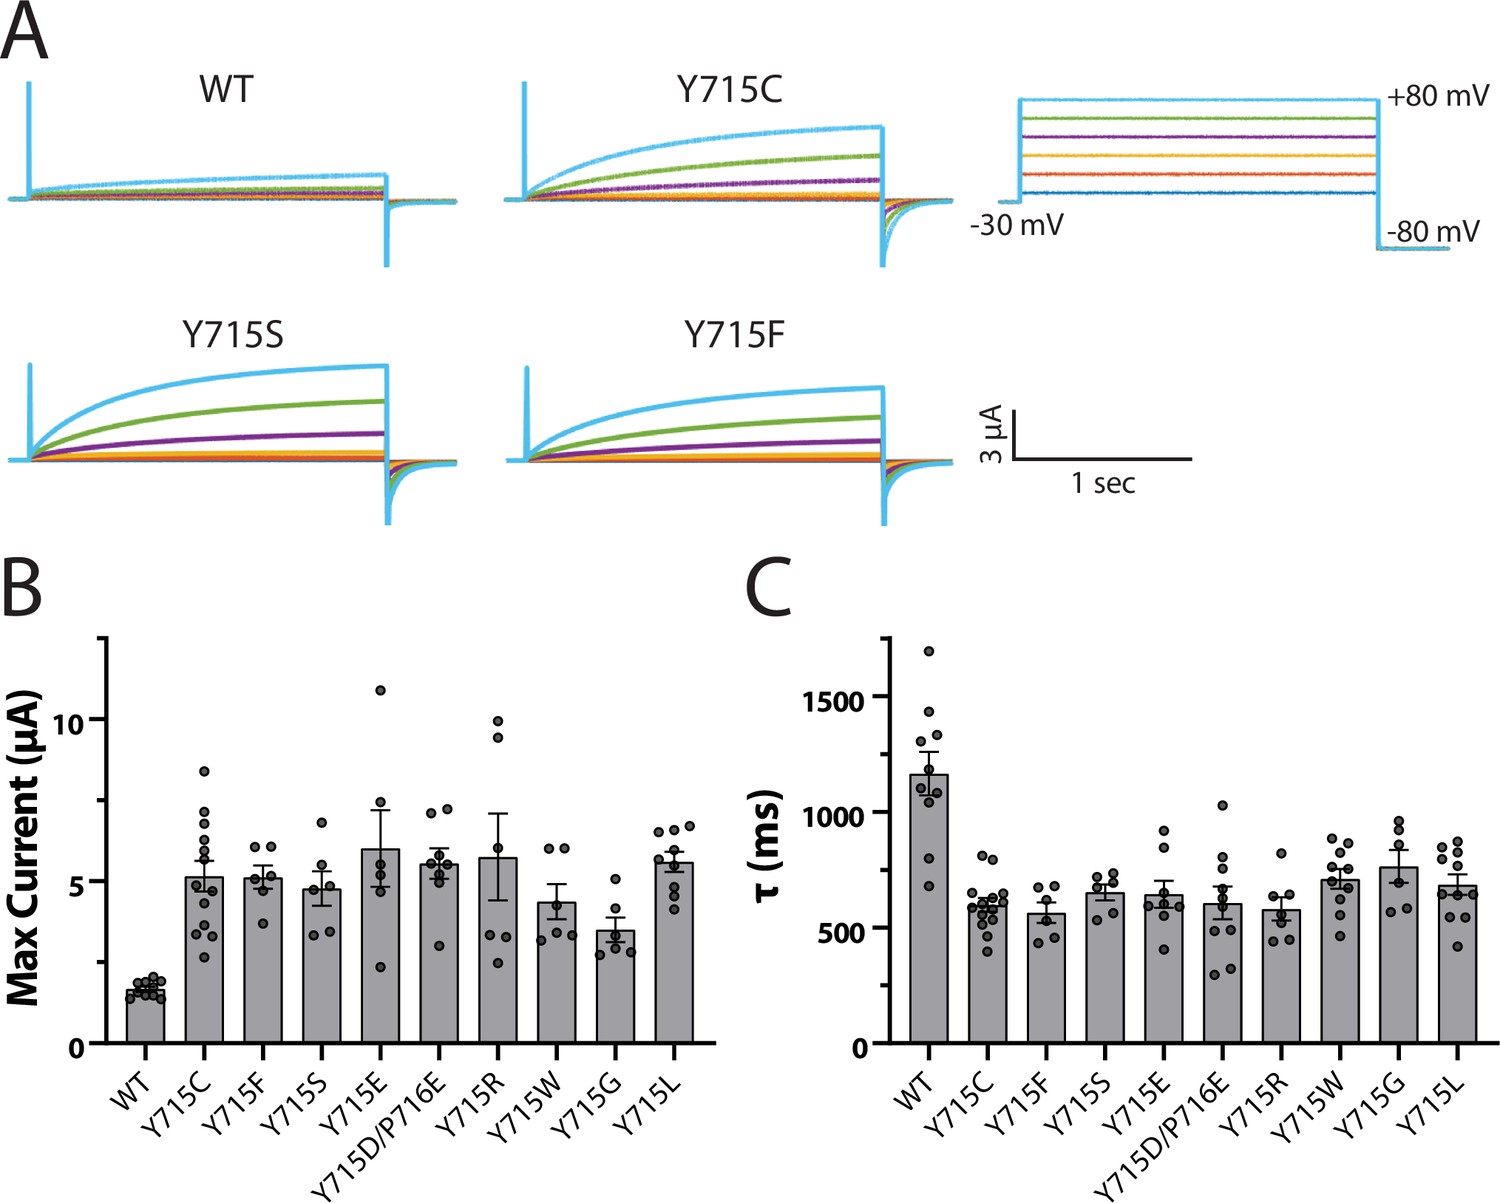
Y715 is required for proper ClC-7 function.
Y715x mutations were introduced to the plasma membrane-targeted ClC-7 and currents measured in Xenopus oocytes under two-electrode voltage clamp. (A) Representative voltage families recorded from oocytes injected with the indicated construct. (B) Maximum current measured from ClC-7 expressing oocytes at the end of a 2 s +80 mV voltage pulse. (C) Activation time constant at +80 mV obtained from a single exponential fit to the current trace. Each dot represents a value measured from an individual oocyte; 2–5 independent batches of oocytes were recorded for each mutant.
Figure 7—figure supplement 1
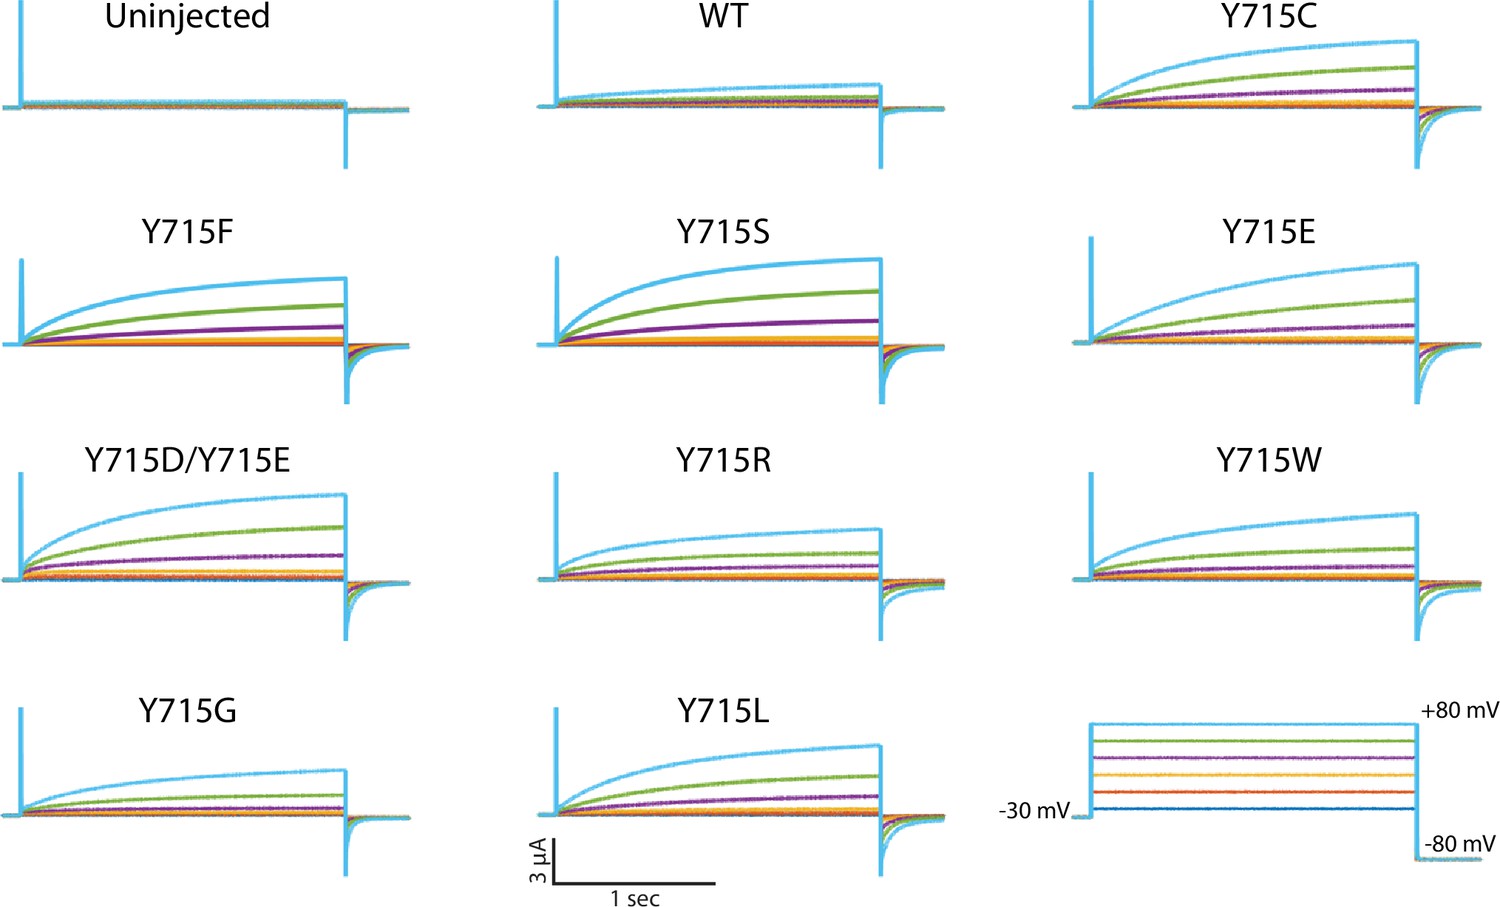
The side chain of Y715 is essential for preserving wildtype function of ClC-7.
Representative voltage families recorded from oocytes injected with the indicated construct. All tested mutations resulted in a similar gain-of-function phenotype.
Additional files
Download links
A two-part list of links to download the article, or parts of the article, in various formats.
Downloads (link to download the article as PDF)
Open citations (links to open the citations from this article in various online reference manager services)
Cite this article (links to download the citations from this article in formats compatible with various reference manager tools)
Tonic inhibition of the chloride/proton antiporter ClC-7 by PI(3,5)P2 is crucial for lysosomal pH maintenance
eLife 11:e74136.
https://doi.org/10.7554/eLife.74136


