Pathogen infection and cholesterol deficiency activate the C. elegans p38 immune pathway through a TIR-1/SARM1 phase transition
- Program in Innate Immunity, Division of Infectious Diseases and Immunology, University of Massachusetts Chan Medical School, United States
- Program in Chemical Biology, University of Massachusetts Chan Medical School, United States
- RNA Therapeutics Institute, University of Massachusetts Chan Medical School, United States
Figures
Figure 1 with 1 supplement
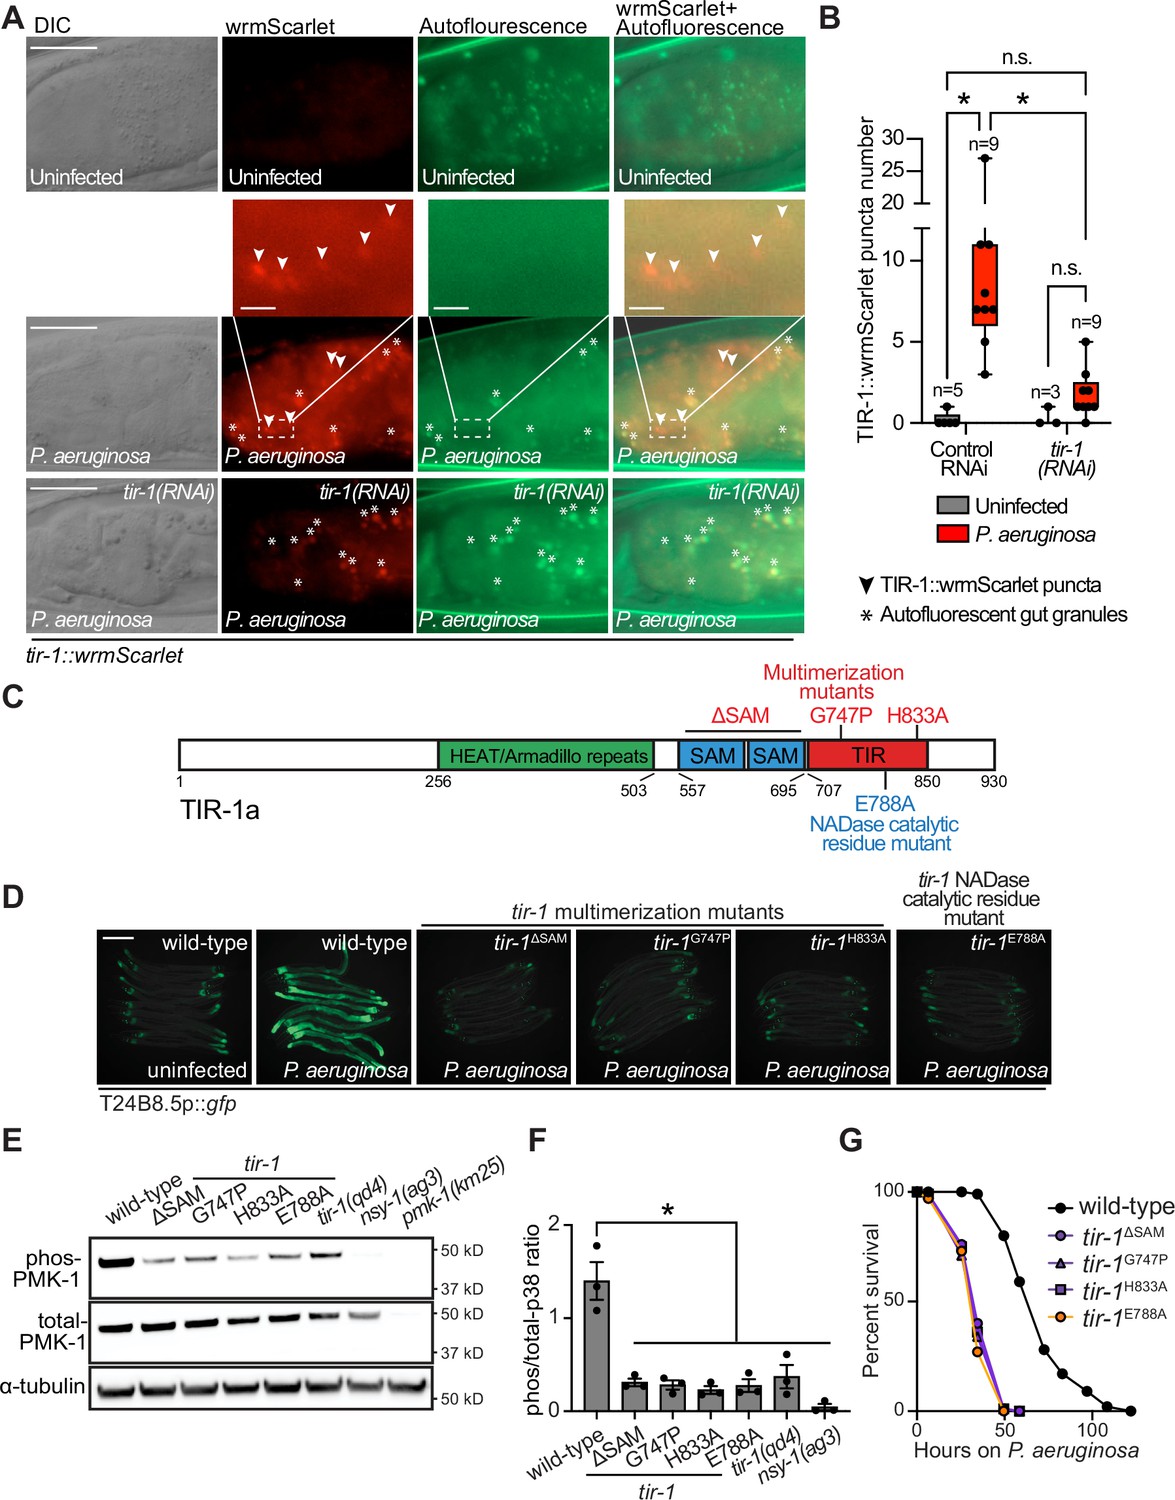
Multimerization of TIR-1/SARM1 and its intrinsic NAD+ glycohydrolase activity are required for activation of the p38 PMK-1 innate immune pathway during pathogen infection.
(A) Images of animals expressing TIR-1::wrmScarlet in the indicated conditions. All tir-1::wrmScarlet animals were treated with glo-3(RNAi) to deplete autofluorescent gut granules. Representative images for each condition are displayed. Red fluorescent channel images display both TIR-1::wrmScarlet fluorescence and autofluorescent signal, while the green fluorescent channel images only display signals from autofluorescent gut granules. TIR-1::wrmScarlet puncta are indicated by arrowheads and autofluorescent gut granules by asterisks. Scale bar equals 20 μm (2 μm for the inset enlarged images). (B) The number of puncta present in the last posterior pair of intestinal epithelial cells in the red (tir-1::wrmScarlet), but not the green (autofluorescence) fluorescent channels were quantified using Fiji image analysis software. Each data point is the number of TIR-1::wrmScarlet puncta from one animal. The n is indicated for each condition. *equals p < 0.05 (two-way ANOVA with Tukey’s multiple comparison testing). (C) Model of tir-1 showing the domains and the mutations that were introduced using CRISPR-Cas9. (D) Expression of the innate immune effector T24B8.5p::gfp in tir-1 mutants with predicted defects in oligomerization (tir-1ΔSAM, tir-1G747P and tir-1H833A) and NADase catalytic activity (tir-1E788A) during P. aeruginosa infection. Scale bar equals 200 μm. (E) Immunoblot analysis of lysates from the indicated genotypes probed with antibodies targeting the doubly phosphorylated TGY epitope in phosphorylated PMK-1 (phos-PMK-1), total PMK-1 protein (total PMK-1), and tubulin (α-tubulin). nsy-1(ag3) and pmk-1(km25) loss-of-function mutants are the controls, which confirm the specificity of the phospho-PMK-1 probing. (F) The band intensities of three biological replicates of the Western blot shown in (E) were quantified. Error bars reflect SEM. *equals p < 0.05 (one-way ANOVA with Dunnett multiple comparison testing). (G) C. elegans pathogenesis assay with P. aeruginosa and C. elegans of indicated genotypes at the L4 larval stage are shown. Data are representative of three trials. Difference between wild-type and all tir-1 mutants is significant (p < 0.05). The Kaplan-Meier method was used to estimate the survival curves for each group, and the log-rank test was used for all statistical comparisons. Sample sizes, mean lifespan and p-values for all trials are shown in Supplementary file 4. See also Figure 1—figure supplement 1.
-
Figure 1—source data 1
Figure 1B Quantification of the number of TIR-1::wrmScarlet puncta present in the last posterior pair of intestinal epithelial cells.
- https://cdn.elifesciences.org/articles/74206/elife-74206-fig1-data1-v2.xlsx
-
Figure 1—source data 2
Figure 1F Quantification of p38 immunoblot analysis of lysates from the indicated genotypes.
- https://cdn.elifesciences.org/articles/74206/elife-74206-fig1-data2-v2.xlsx
Figure 1—figure supplement 1
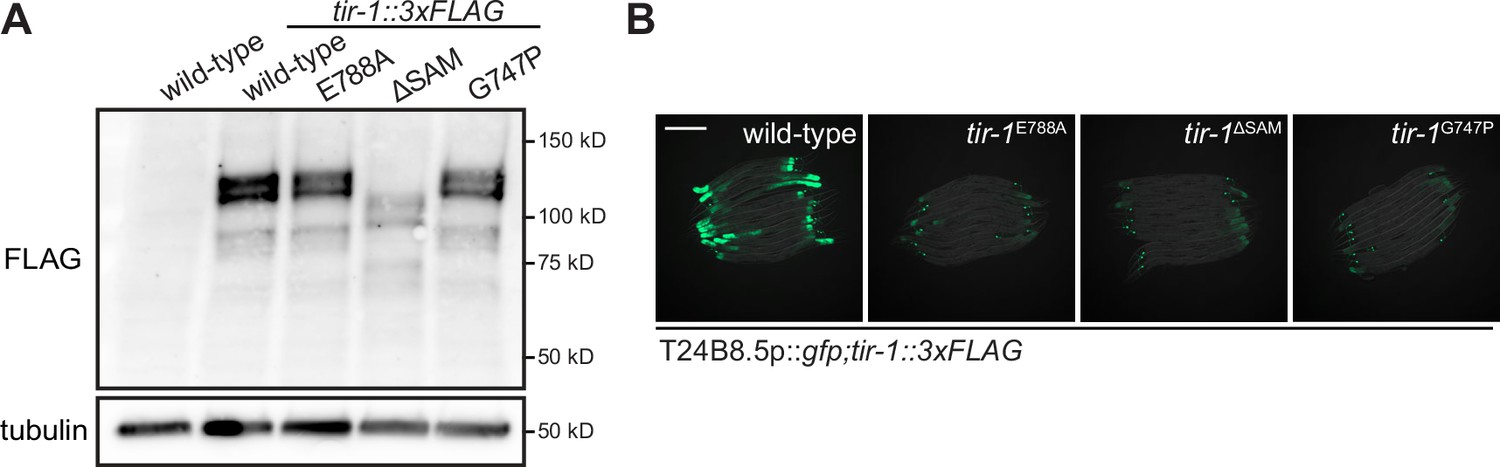
Multimerization of TIR-1/SARM1 and its intrinsic NAD + glycohydrolase activity are required for activation of the p38 PMK-1 innate immune pathway during pathogen infection.
(A) Immunoblot analysis of lysates from the indicated genotypes probed with an antibody that recognizes the FLAG epitope. (B) Images of T24B8.5p::gfp immune reporter expression in the indicated genotypes. Scale bars in all images equal 200 μm. See also Figure 1.
Figure 2 with 2 supplements
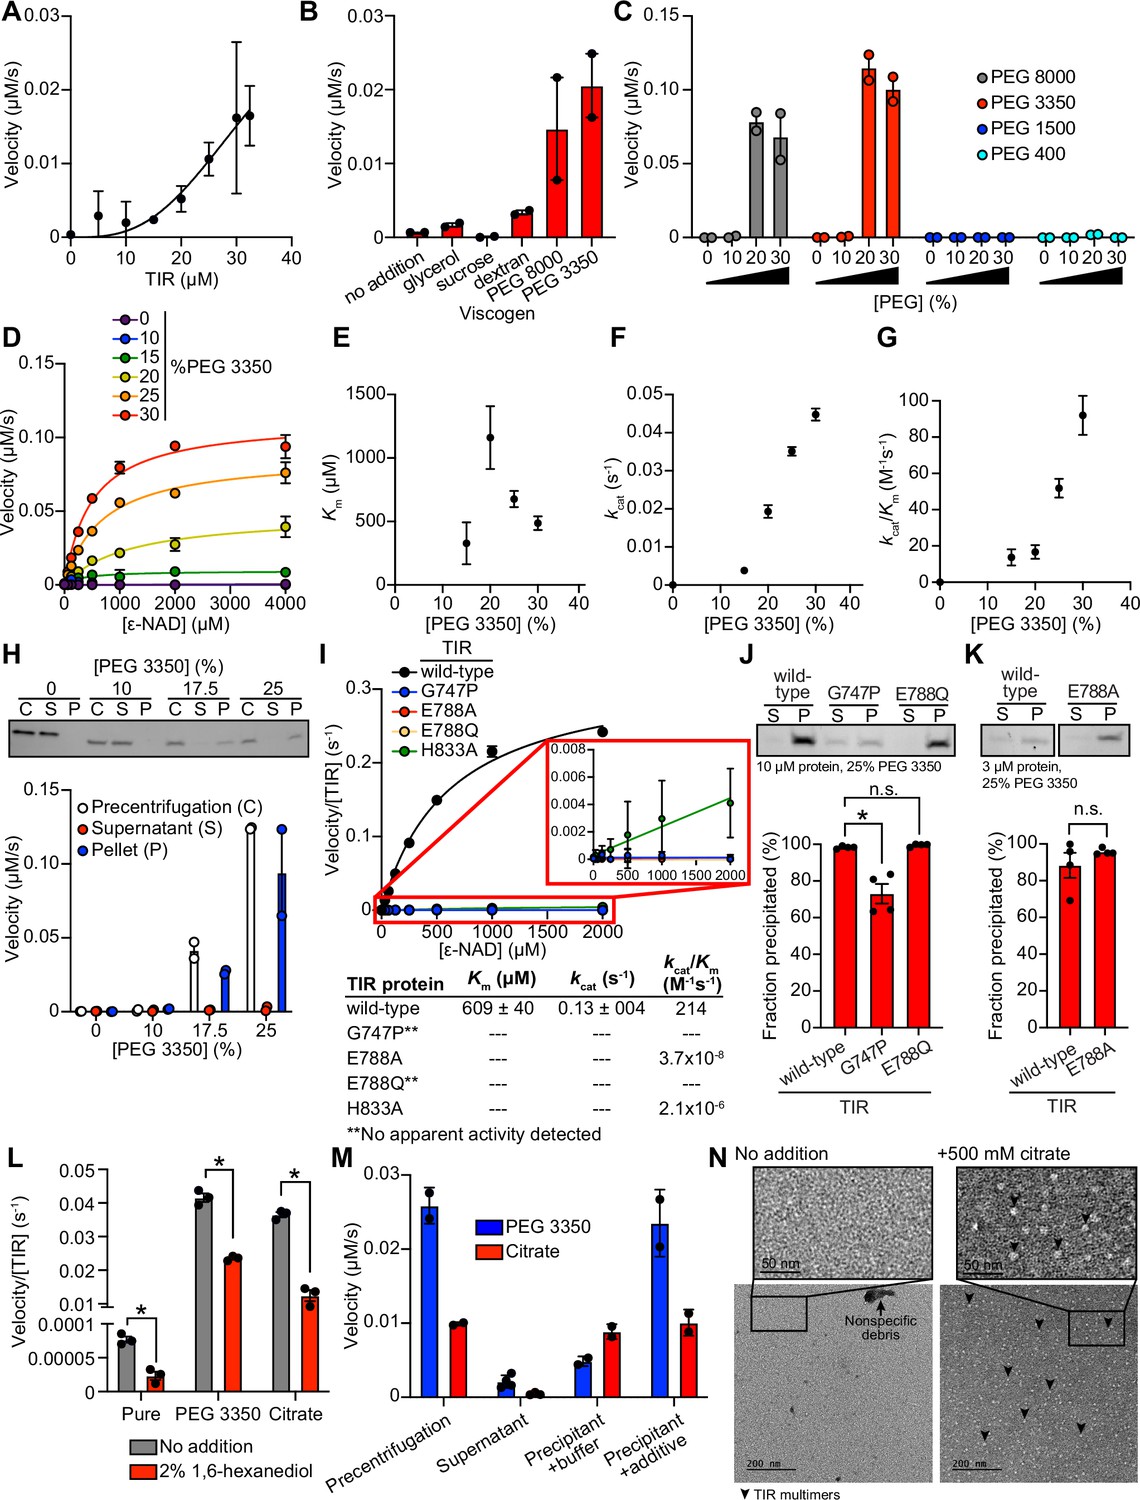
TIR multimerization and phase transition superactivates its intrinsic NAD + glycohydrolase activity.
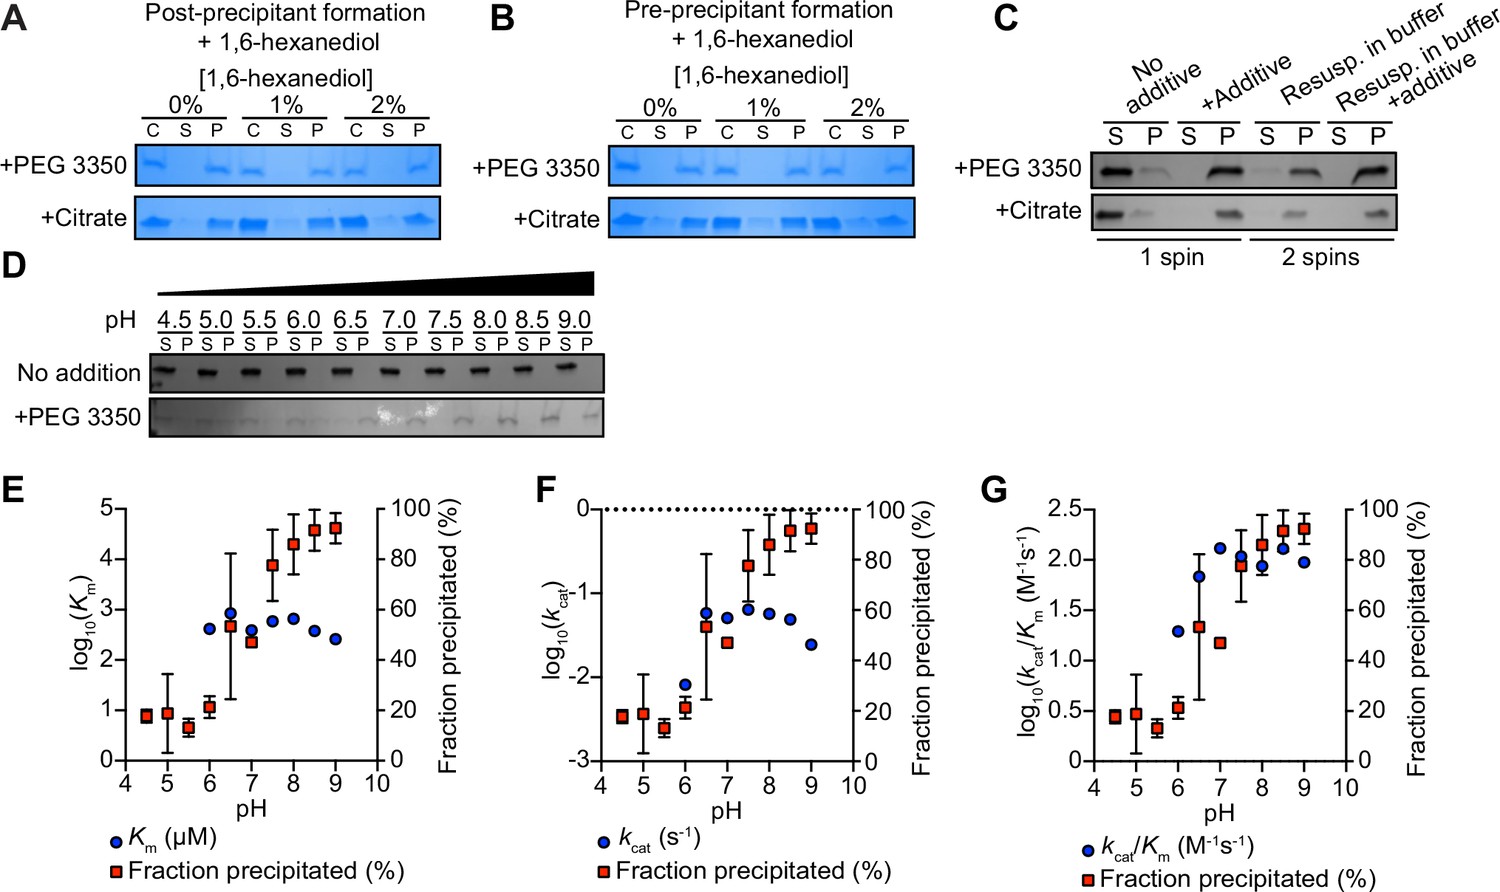
(A) NADase activity of purified TIR at increasing TIR protein concentrations is shown. Activity was assessed by incubating TIR protein with 1 mM ε-NAD and monitoring the rate at which the fluorescent product ε-ADPR was produced. Curve represents a nonlinear regression fit of the NADase activity data points (n = 2). (B) NADase activity of 2.5 μM TIR incubated in the presence of 25% (w/v) of macro- (PEG 8000, PEG 3350, and dextran) and micro- (sucrose and glycerol) viscogens was assessed as described in A (n = 2). (C) Dose dependency of macroviscogens on the NADase activity of TIR is shown. A total of 2.5 μM TIR protein was incubated with the indicated PEG compounds at concentrations from 0% to 30% (w/v). NADase activity was assessed as described in A (n = 2). (D) Steady-state kinetic analysis of 2.5 µM TIR incubated in 0–30% (w/v) of PEG 3350 with the ε-NAD substrate at concentrations from 0 to 4000 μM was assessed as described in A. (n = 2). From the steady-state kinetic analysis performed in D, Km(E), kcat (F), and kcat/Km (G) were determined at each PEG 3350 concentration. (H) SDS-PAGE analysis of TIR protein fractions incubated with increasing concentrations of PEG 3350 precentrifugation (C) and after centrifugation, the soluble (S) and pellet (P) protein fractions. NADase activity of TIR protein in each fraction and at each concentration of PEG 3350 was assessed, as described in A, and is represented below the gel image (n = 2, representative image shown). (I) Steady-state kinetic analysis of TIR wild-type, oligomerization mutants (TIRG747P and TIRH833A), and catalytic mutants (TIRE788Q and TIRE788A) in 25% PEG 3350 with 0–2000 μM ε-NAD was assessed as described in D. The inset image outlined in red is an enlarged image of the mutant kinetic data. Kinetic parameters (Km, kcat, and kcat/Km) are shown in the table below the graph (n = 3). (J, K) SDS-PAGE analysis of TIR wild-type, oligomerization mutant (TIRG747P) and catalytic mutants (TIRE788Q and TIRE788A) precipitation in the presence of 25% PEG 3350. Gel represents the soluble (S) and pellet (P) protein fractions of wild-type and mutant TIR following incubation with PEG 3350 and centrifugation. TIRG747P and TIRE788Q were assessed with 10 μM protein in J, and TIRE788A was assessed with 3 μM protein in K (a lower concentration was used for TIRE788A assays because the yield of the purified TIRE788A mutant was low). Quantification of replicates represented below gel images (n = 4, representative images shown). *equals p < 0.05 by one-way ANOVA in J and unpaired t-test in K. (L) Effect of 1,6-hexanediol on TIR NADase activity is shown. TIR protein was incubated in the presence or absence of either 25% PEG 3350 or 500 mM citrate and treated with either 0 or 2% 1,6-hexanediol. The NADase activity of TIR for each condition was assessed using the ε-NAD substrate assay (n = 3). *equals p < 0.05 (unpaired t-test). (M) The NADase activity of TIR protein incubated with either 25% PEG 3350 or 500 mM citrate before (precentrifugation, n = 2) and after centrifugation, the supernatant (n = 4) and precipitant (n = 2) fractions. Precipitation fractions were resuspended in buffer alone or buffer containing 25% PEG 3350 or 500 mM citrate, and NADase activity was assessed. (N) Negative stain electron microscopy in either the absence or presence of 500 mM citrate (diameter of particles = 8.9 nm ± 1.2, n = 65). Representative circular particles are labeled with arrowheads. All error bars reflect SEM. See also Figure 2—figure supplements 1 and 2.
-
Figure 2—source data 1
Figure 2A NADase activity of purified TIR at increasing TIR protein concentrations.
- https://cdn.elifesciences.org/articles/74206/elife-74206-fig2-data1-v2.xlsx
-
Figure 2—source data 2
Figure 2B NADase activity of 2.5 μM TIR incubated in the presence of 25% (w/v) of macro- (PEG 8000, PEG 3350, and dextran) and micro- (sucrose and glycerol) viscogens.
- https://cdn.elifesciences.org/articles/74206/elife-74206-fig2-data2-v2.xlsx
-
Figure 2—source data 3
Figure 2C Dose dependency of macroviscogens on the NADase activity of TIR.
- https://cdn.elifesciences.org/articles/74206/elife-74206-fig2-data3-v2.xlsx
-
Figure 2—source data 4
Figure 2D Steady-state kinetic analysis of 2.5 μM TIR incubated in 0%–30% (w/v) of PEG 3350.
- https://cdn.elifesciences.org/articles/74206/elife-74206-fig2-data4-v2.xlsx
-
Figure 2—source data 5
Figure 2H NADase activity of TIR protein in each fraction and at each concentration of PEG 3350.
- https://cdn.elifesciences.org/articles/74206/elife-74206-fig2-data5-v2.xlsx
-
Figure 2—source data 6
Figure 2I Steady-state kinetic analysis of TIR wild-type, oligomerization mutant (TIRG747P, TIRH833A), and catalytic mutants (TIRE788Q and TIRE788A) in 25% PEG 3350.
- https://cdn.elifesciences.org/articles/74206/elife-74206-fig2-data6-v2.xlsx
-
Figure 2—source data 7
Figure 2J Quantification of SDS-PAGE analysis of TIR: wild-type, oligomerization mutant (TIRG747P) and catalytic mutant (TIRE788Q), precipitation in the presence of 25% PEG 3350.
- https://cdn.elifesciences.org/articles/74206/elife-74206-fig2-data7-v2.xlsx
-
Figure 2—source data 8
Figure 2K Quantification of SDS-PAGE analysis of TIR: wild-type and catalytic mutant (TIRE788A), precipitation in the presence of 25% PEG 3350.
- https://cdn.elifesciences.org/articles/74206/elife-74206-fig2-data8-v2.xlsx
-
Figure 2—source data 9
Figure 2L Effect of 1,6-hexanediol on TIR NADase activity.
- https://cdn.elifesciences.org/articles/74206/elife-74206-fig2-data9-v2.xlsx
-
Figure 2—source data 10
Figure 2M NADase activity of TIR protein incubated with either 25% PEG 3350 or 500 mM citrate before (precentrifugation) and after centrifugation, the supernatant and precipitant fractions.
- https://cdn.elifesciences.org/articles/74206/elife-74206-fig2-data10-v2.xlsx
Figure 2—figure supplement 1
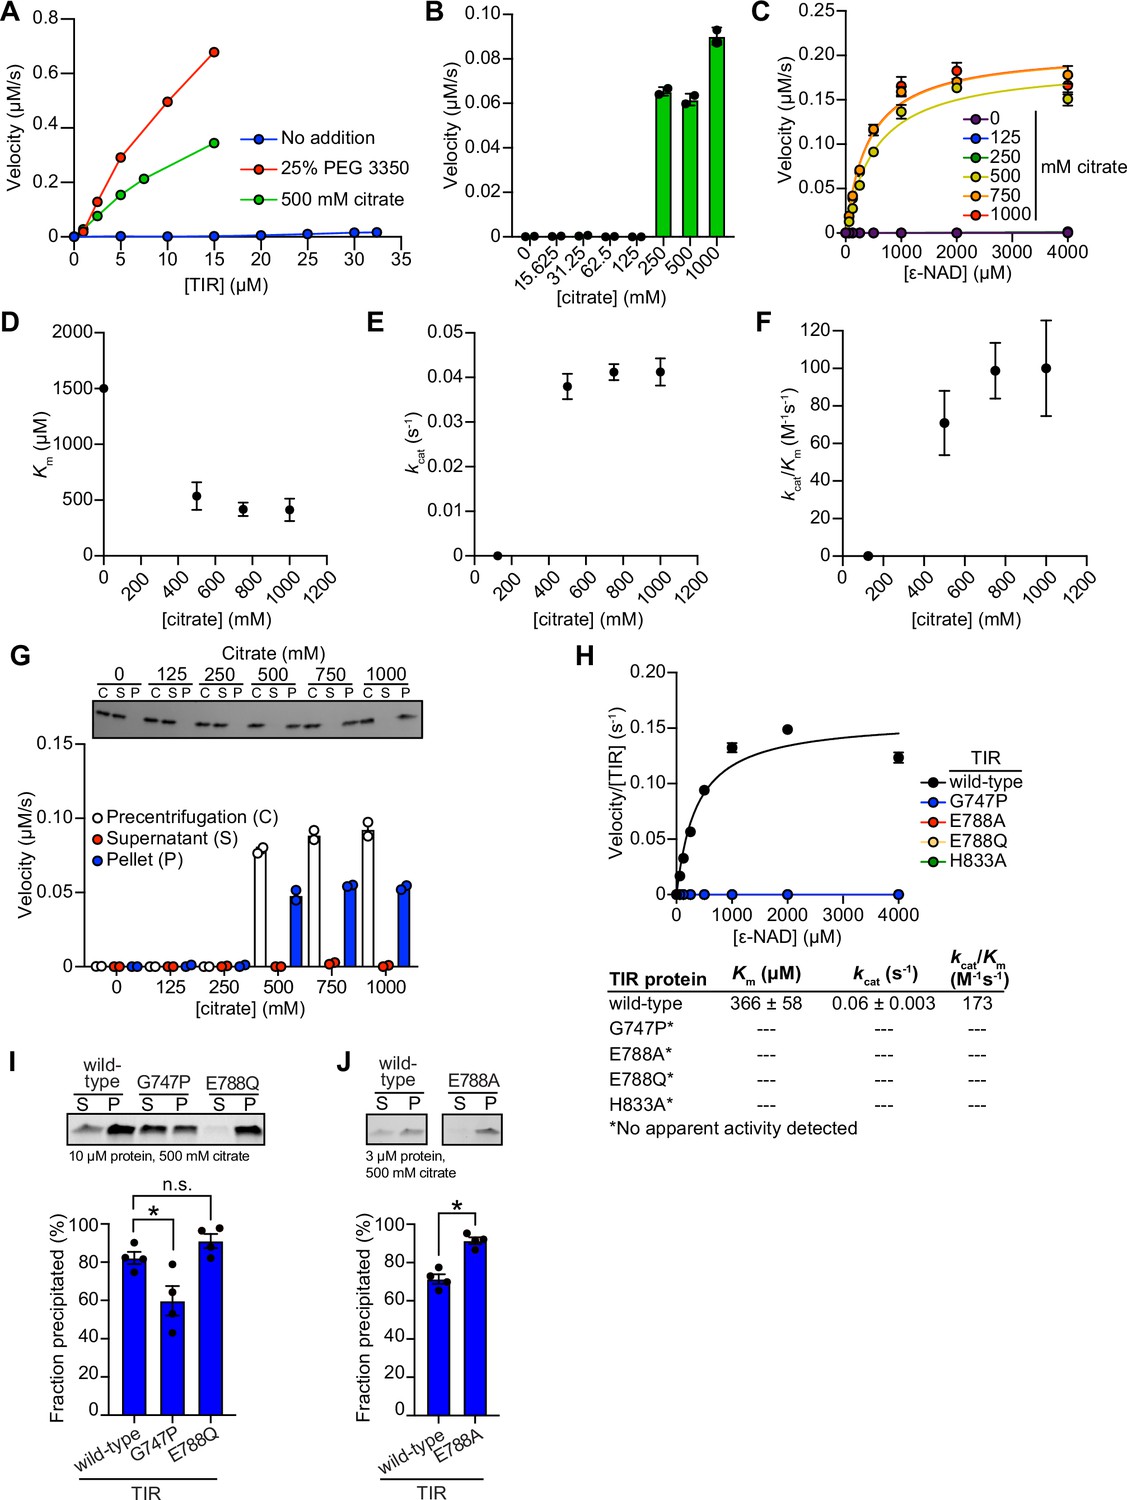
TIR multimerization and phase transition superactivates its intrinsic NAD + glycohydrolase activity.
(A) Enzyme concentration dependence in the presence and absence of either 25 % PEG 3350 or 500 mM sodium citrate (n = 2). (B) Dose-dependence of TIR NADase activity on citrate concentration as described in Figure 2C, except using citrate (n = 2). (C) Steady-state kinetic analysis of TIR as described in Figure 2D, except in the presence of citrate (n = 2). (D–F) From the steady-state kinetic analysis performed in (C), Km(D), kcat (E), and kcat/Km (F) were determined at each citrate concentration. (G) Effect of citrate on TIR aggregation and associated activity as described in Figure 2H (n = 2, representative images shown). (H) Steady-state kinetic analysis of TIR mutants as described in Figure 2I, except in the presence of citrate (n = 3). (I, J) Precipitation of TIR mutants as described in Figure 2J and K, except in the presence of citrate (n = 4, representative images shown). See also Figure 2.
-
Figure 2—figure supplement 1—source data 1
1A enzyme concentration dependence in presence and absence of either 25% PEG 3350 or 500 mM sodium citrate.
- https://cdn.elifesciences.org/articles/74206/elife-74206-fig2-figsupp1-data1-v2.xlsx
-
Figure 2—figure supplement 1—source data 2
1B Dose dependency of citrate on the NADase activity of TIR.
- https://cdn.elifesciences.org/articles/74206/elife-74206-fig2-figsupp1-data2-v2.xlsx
-
Figure 2—figure supplement 1—source data 3
1C Steady-state kinetic analysis of 2.5 μM TIR incubated in 0–1000 mM sodium citrate.
- https://cdn.elifesciences.org/articles/74206/elife-74206-fig2-figsupp1-data3-v2.xlsx
-
Figure 2—figure supplement 1—source data 4
1G NADase activity of TIR protein in each fraction and at each concentration of citrate.
- https://cdn.elifesciences.org/articles/74206/elife-74206-fig2-figsupp1-data4-v2.xlsx
-
Figure 2—figure supplement 1—source data 5
1H Steady-state kinetic analysis of TIR wild-type, oligomerization mutant (TIRG747P, TIRH833A), and catalytic mutants (TIRE788Q and TIRE788A) in 500 mM sodium citrate.
- https://cdn.elifesciences.org/articles/74206/elife-74206-fig2-figsupp1-data5-v2.xlsx
-
Figure 2—figure supplement 1—source data 6
1I Quantification of SDS-PAGE analysis of TIR: wild-type, oligomerization mutant (TIRG747P) and catalytic mutant (TIRE788Q), precipitation in the presence of 500 mM sodium citrate.
- https://cdn.elifesciences.org/articles/74206/elife-74206-fig2-figsupp1-data6-v2.xlsx
-
Figure 2—figure supplement 1—source data 7
1J Quantification of SDS-PAGE analysis of TIR: wild-type and catalytic mutant (TIRE788A), precipitation in the presence of 500 mM sodium citrate.
- https://cdn.elifesciences.org/articles/74206/elife-74206-fig2-figsupp1-data7-v2.xlsx
Figure 2—figure supplement 2
TIR multimerization and phase transition superactivates its intrinsic NAD + glycohydrolase activity.
(A) SDS-PAGE analysis of TIR protein incubated first with 25% PEG 3350 or 500 mM citrate and subsequently with 2% 1,6-hexanediol; analysis was performed on TIR samples taken precentrifugation (C) or on the soluble (S) and pellet (P) fractions taken after centrifugation (n = 2, representative image shown). (B) SDS-PAGE analysis of TIR protein incubated first with 0 or 2% 1,6-hexanediol and subsequently with 25% PEG 3350 or 500 mM citrate (n = 2, representative image shown); analysis of protein fractions as in (A). (C) SDS-PAGE analysis of TIR protein in the soluble (S) and pellet (P) fractions following incubation with either PEG 3350 or citrate and centrifugation (one spin). Pellet fractions were subsequently resuspended in only buffer or buffer containing 25% PEG 3350 or 500 mM citrate and centrifuged a second time to isolate the soluble (S) and pellet (P) fractions (n = 2, representative image shown). (D) SDS-PAGE analysis of TIR in the soluble (S) and pellet (P) fractions incubated with or without 25% PEG 3350 at the indicated pH (n = 2, representative image shown). TIR steady-state kinetic parameters Km (E), kcat (F), kcat/Km (G) are shown at the indicated pH (n = 2). See also Figure 2.
Figure 3 with 1 supplement
Cholesterol scarcity activates intestinal innate immune defenses.
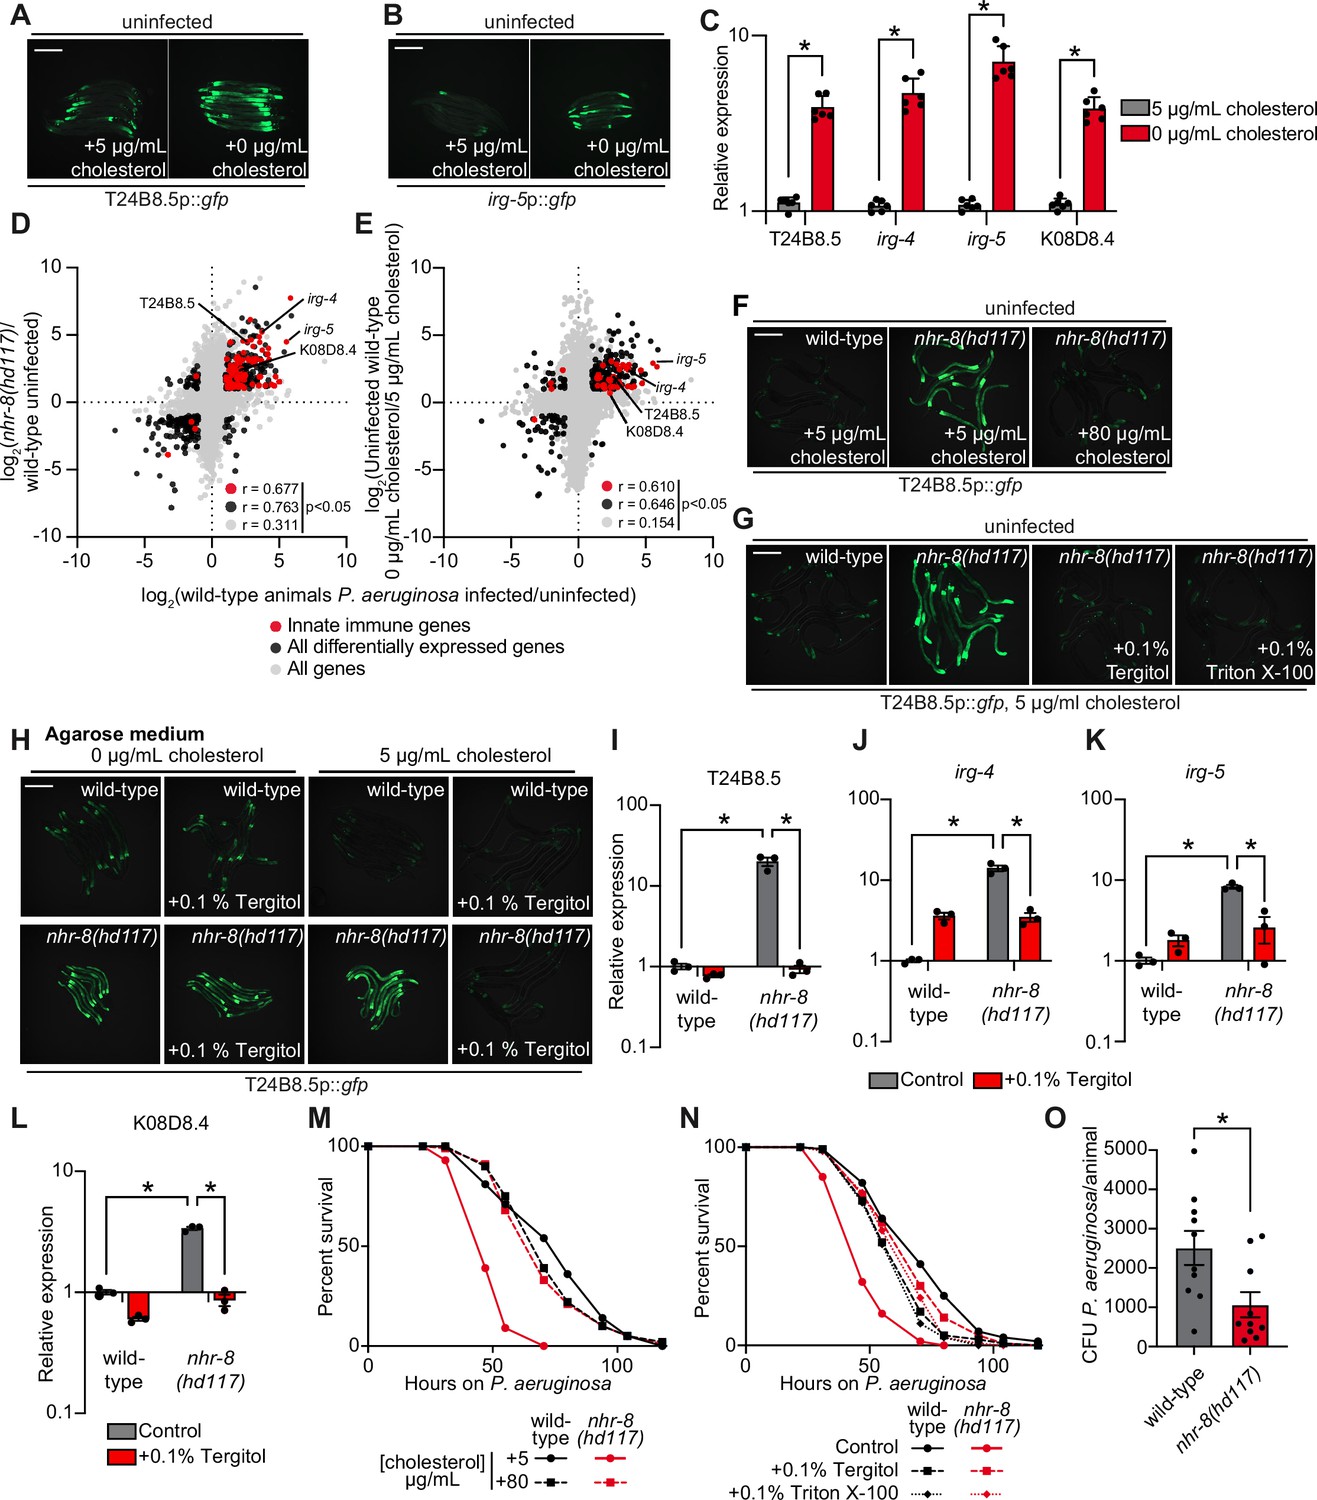
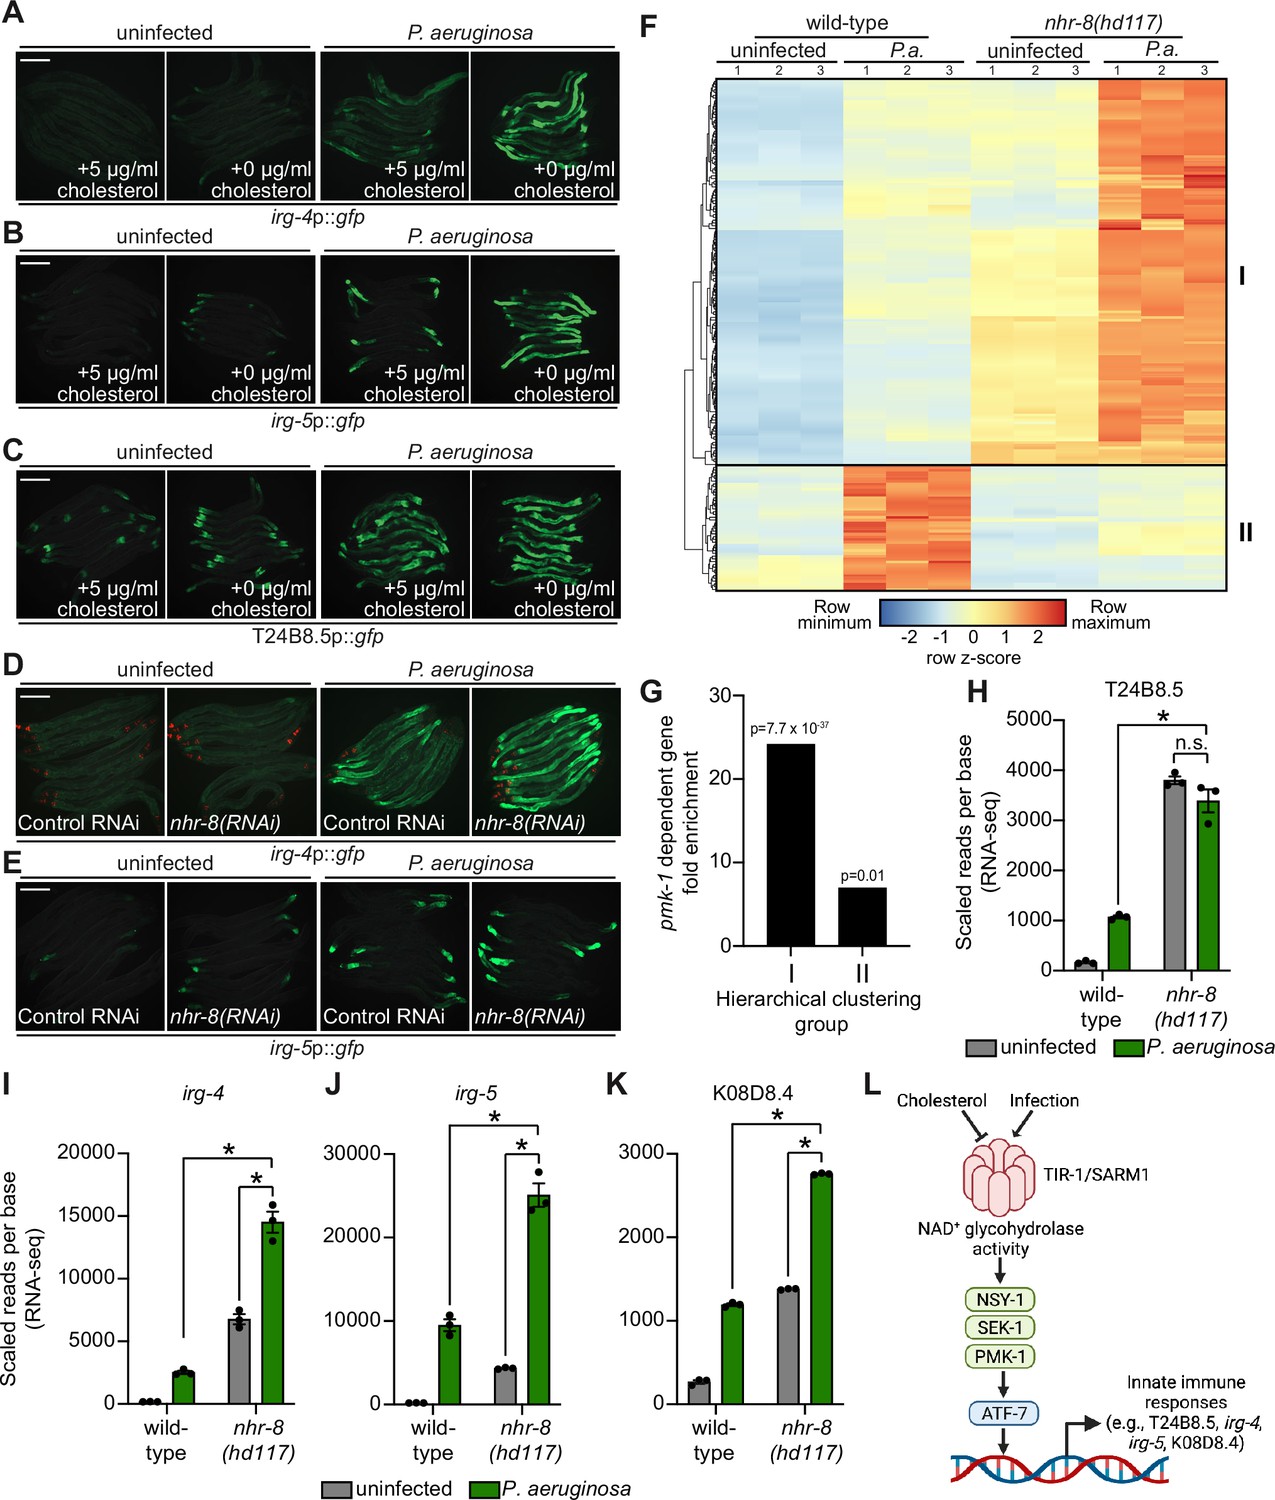
Images of T24B8.5p::gfp (A) and irg-5p::GFP (B) transcriptional immune reporters in wild-type animals grown on standard nematode growth media ( + 5 μg/mL cholesterol) and in the absence of supplemented cholesterol ( + 0 μg/mL cholesterol). (C) qRT-PCR data of the indicated innate immune effector genes in wild-type C. elegans grown in the presence ( + 5 μg/mL) and absence ( + 0 μg/mL) of supplemented cholesterol. *equals p < 0.05 (unpaired t-test). (D and E) Data from mRNA-seq experiments comparing genes differentially regulated in uninfected nhr-8(hd117) mutants versus wild-type animals (D) or uninfected wild-type animals grown in the absence (0 μg/mL) versus presence (5 μg/mL) of supplemental cholesterol (E) (y-axis) are compared with genes differentially expressed in wild-type animals during P. aeruginosa infection (x-axis). All genes are shown in gray. Genes that are differentially expressed in both datasets are shown in black (Fold change >2, q < 0.01). Genes that are annotated as innate immune genes are shown in red. The location of the representative genes T24B8.5, irg-5, irg-4, and K08D8.4, whose expression is examined throughout this manuscript, are shown. (Of note, in the 0 μg/mL cholesterol mRNA-seq data set K08D8.4 did not meet our cut-off threshold, although was significantly upregulated, fold change = 1.79, q = 5.6 × 10⁻⁴). See also Supplementary files 1-3. (F, G, H) Images of T24B8.5p::gfp animals of the indicated genotypes grown under the indicated conditions are shown. (H) C. elegans were grown on media solidified with agarose rather than agar. (I, J, K, L) qRT-PCR data of the indicated genes in wild-type and nhr-8(hd117) mutant animals grown on standard nematode growth media ( + 5 μg/mL cholesterol) in the presence or absence of 0.1% Tergitol, as indicated. For the qRT-PCR studies in (C, I, J, K and L), data are the average of three to six independent biological replicates, each normalized to a control gene with error bars representing SEM and are presented as the value relative to the average expression from all replicates of the indicated gene in wild-type animals on standard nematode growth media ( + 5 μg/mL cholesterol). *equals p < 0.05 (two-way ANOVA with Tukey’s multiple comparison testing). (M, N) Survival curves for C. elegans pathogenesis assays with P. aeruginosa and C. elegans of the indicated genotypes at the L4 larval stage and exposed to the indicated conditions. Data are representative of three trials. The difference between the nhr-8(hd117) mutant and the other conditions in both M and N is significant (p < 0.05). The Kaplan-Meier method was used to estimate the survival curves for each group, and the log-rank test was used for all statistical comparisons. Sample sizes, mean lifespan and p-values for all trials are shown in Supplementary file 4. (O) P. aeruginosa, isolated from the intestines of animals with the indicated genotypes, were quantified after 24 hr of bacterial infection. Data are colony-forming units (CFU) of P. aeruginosa and are presented as the average of 10 separate biological replicates, with each replicate containing 10–11 animals. *equals p < 0.05 (unpaired t-test). Scale bars in all images equal 200 μm. See also Figure 3—figure supplement 1.
-
Figure 3—source data 1
Figure 3C qRT-PCR data of the indicated innate immune effector genes in wild-type C. elegans growing in the presence (+5 μg/mL) and absence (+0 μg/mL) of supplemented cholesterol.
- https://cdn.elifesciences.org/articles/74206/elife-74206-fig3-data1-v2.xlsx
-
Figure 3—source data 2
Figure 3I qRT-PCR data of T24B8.5 in wild-type and nhr-8(hd117) mutant animals grown on standard nematode growth media (+5 μg/mL cholesterol) in the presence or absence of 0.1% Tergitol, as indicated.
- https://cdn.elifesciences.org/articles/74206/elife-74206-fig3-data2-v2.xlsx
-
Figure 3—source data 3
Figure 3J qRT-PCR data of irg-4 in wild-type and nhr-8(hd117) mutant animals grown on standard nematode growth media (+5 μg/mL cholesterol) in the presence or absence of 0.1% Tergitol, as indicated.
- https://cdn.elifesciences.org/articles/74206/elife-74206-fig3-data3-v2.xlsx
-
Figure 3—source data 4
Figure 3K qRT-PCR data of irg-5 in wild-type and nhr-8(hd117) mutant animals grown on standard nematode growth media (+5 μg/mL cholesterol) in the presence or absence of 0.1% Tergitol, as indicated.
- https://cdn.elifesciences.org/articles/74206/elife-74206-fig3-data4-v2.xlsx
-
Figure 3—source data 5
Figure 3L qRT-PCR data of K08D8.4 in wild-type and nhr-8(hd117) mutant animals grown on standard nematode growth media (+5 μg/mL cholesterol) in the presence or absence of 0.1% Tergitol, as indicated.
- https://cdn.elifesciences.org/articles/74206/elife-74206-fig3-data5-v2.xlsx
-
Figure 3—source data 6
Figure 3O Colony-forming units (CFUs) of P. aeruginosa, isolated from the intestines of animals with the indicated genotypes, quantified after 24 hr of bacterial infection.
- https://cdn.elifesciences.org/articles/74206/elife-74206-fig3-data6-v2.xlsx
Figure 3—figure supplement 1
Cholesterol scarcity activates intestinal innate immune defenses.
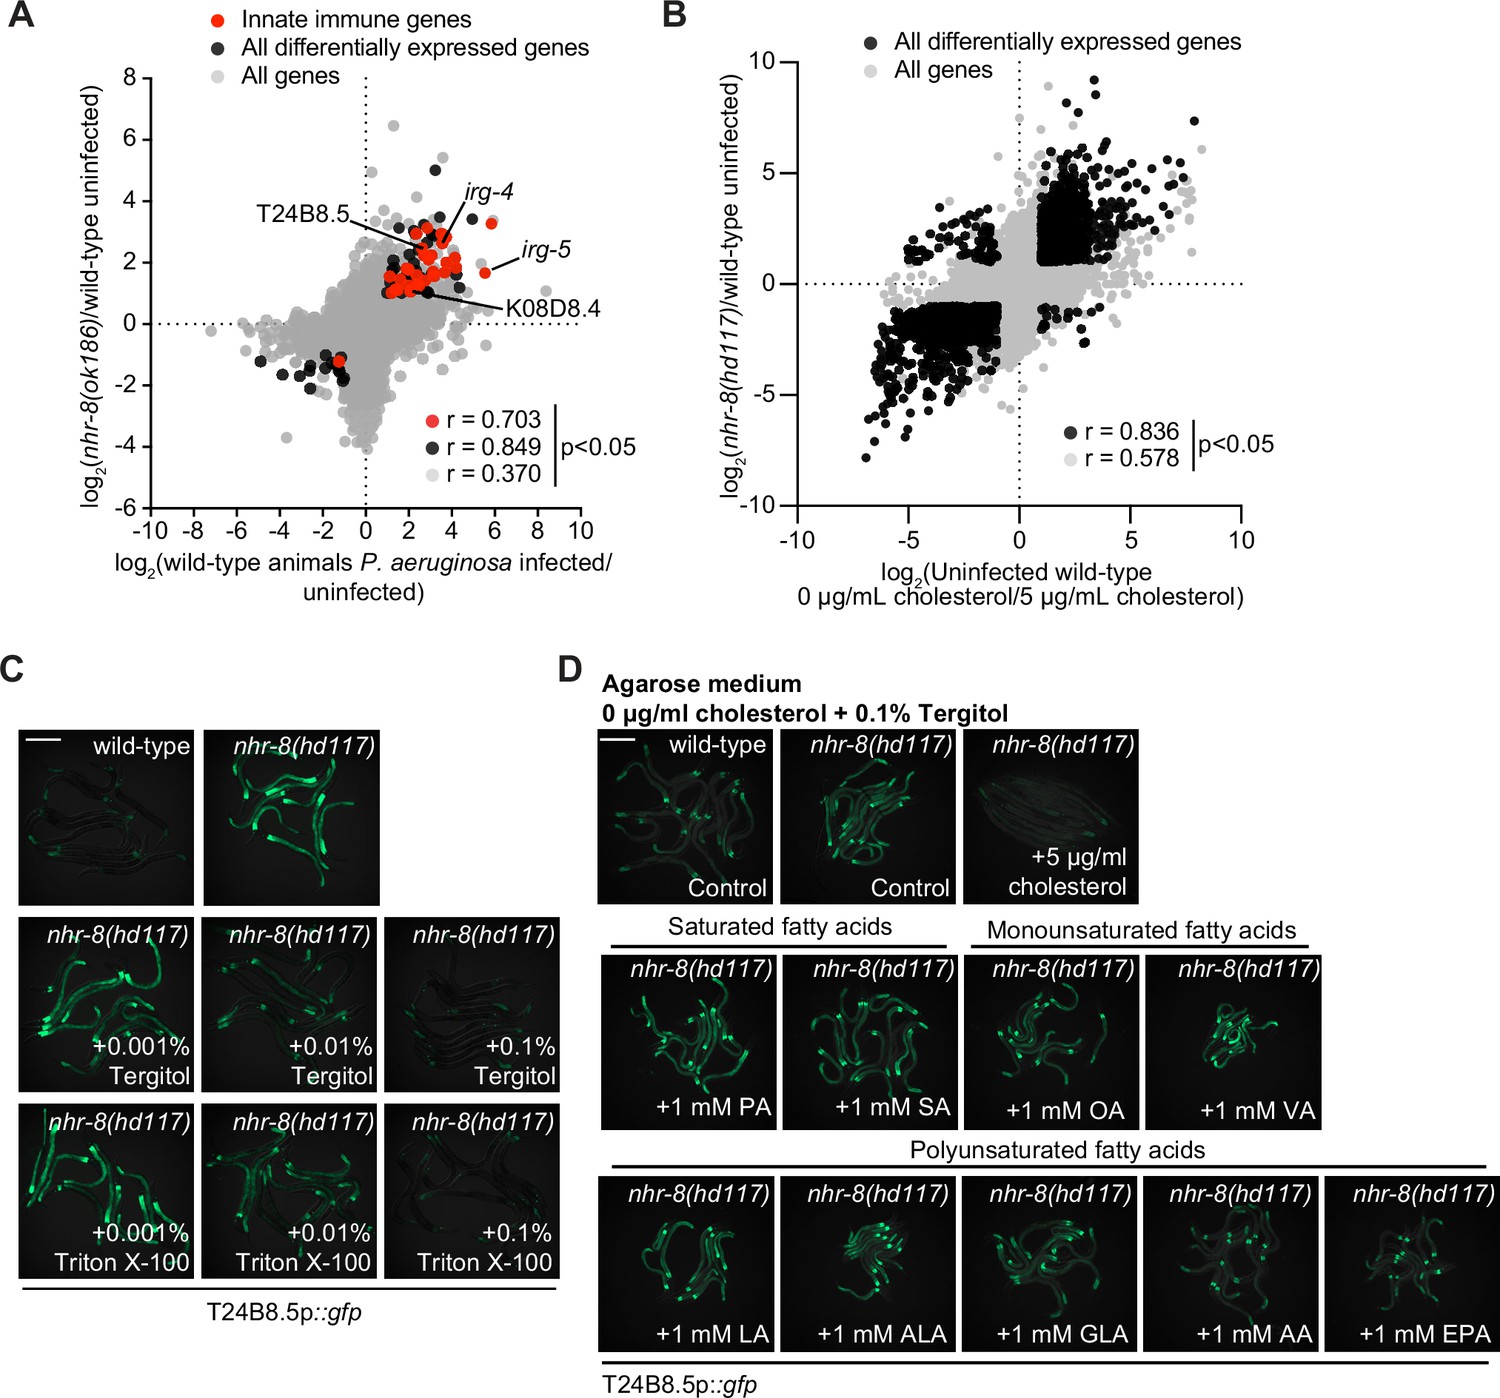
(A) An mRNA-seq experiment as described in Figure 3D, except using a different nhr-8 mutant allele: nhr-8(ok186). (B) Data from mRNA-seq experiments as described in Figure 3D, except comparing genes differentially regulated in uninfected nhr-8(hd117) mutants versus wild-type animals (y-axis) with genes differentially expressed in uninfected wild-type animals grown in the absence (0 μg/mL) versus presence (5 μg/mL) of supplemental cholesterol (x-axis). (C) Images of T24B8.5p::gfp animals as described in Figure 3G. (D) Images of T24B8.5p::gfp on agarose media with 0.1% Tergitol in the presence of supplemented fatty acids, as indicated. See also Figure 3.
Figure 4 with 1 supplement
Cholesterol scarcity activates the p38 PMK-1 innate immune pathway.
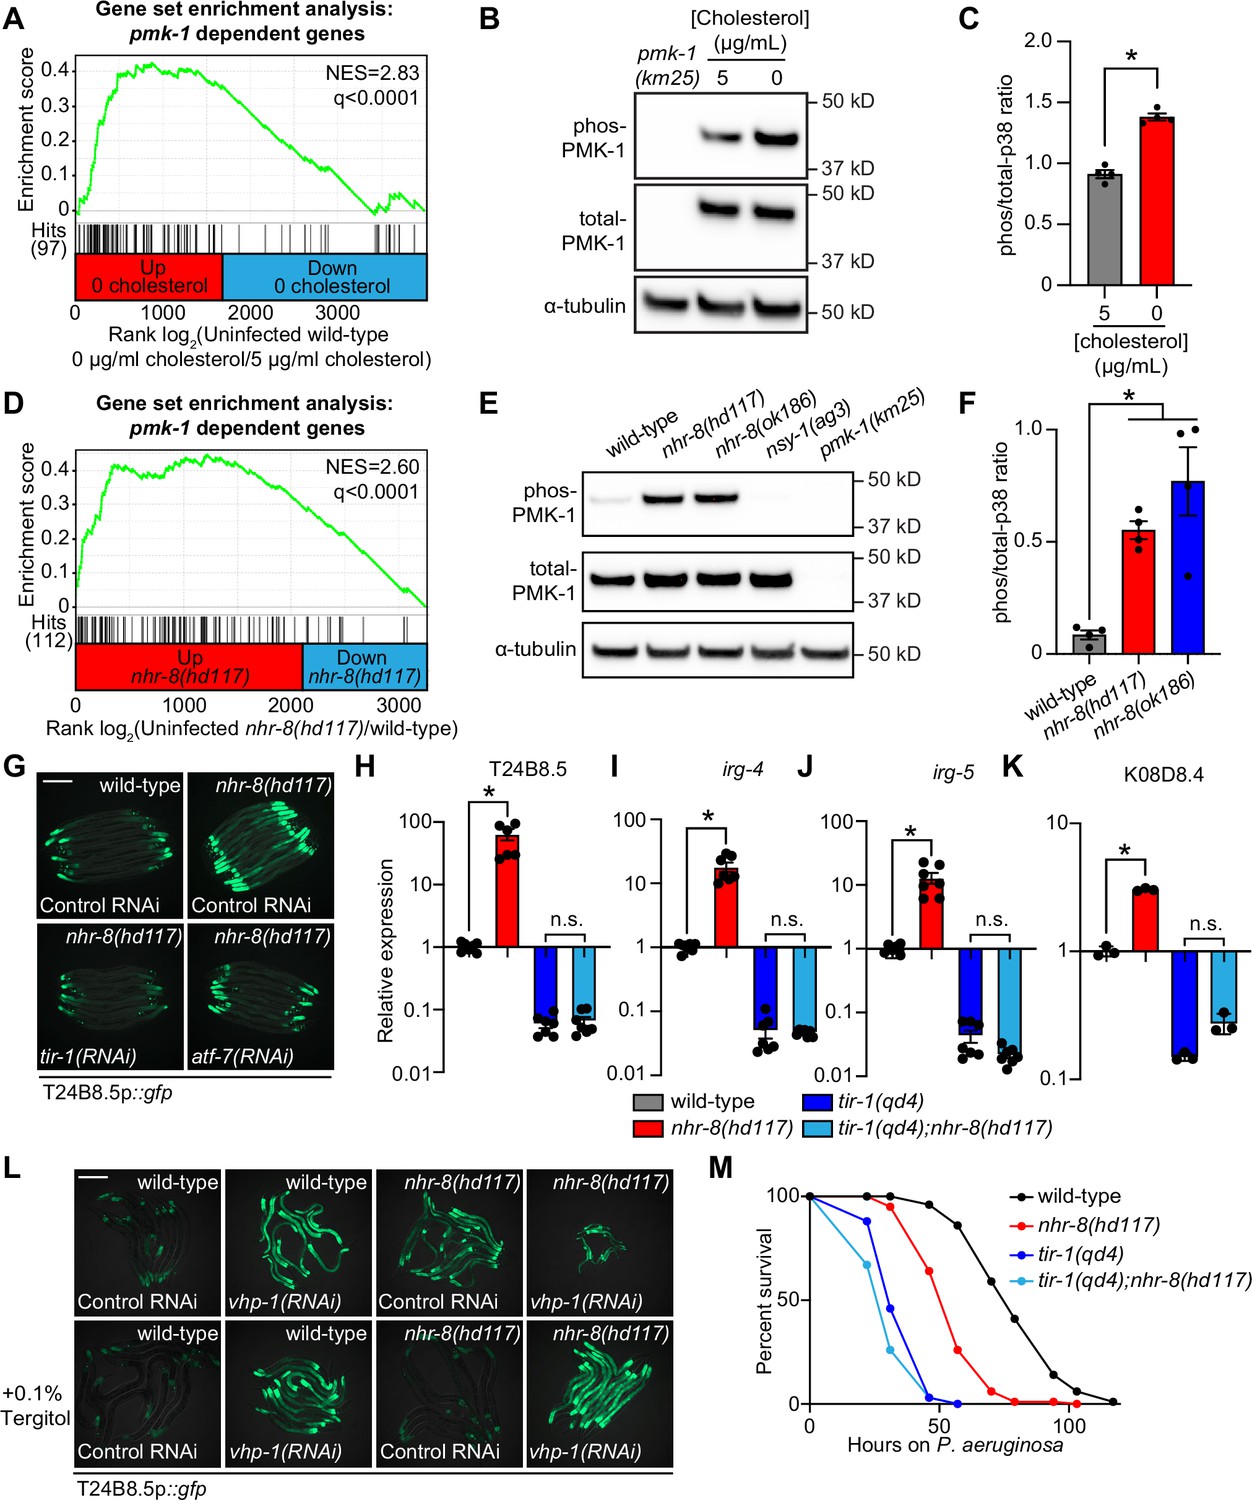
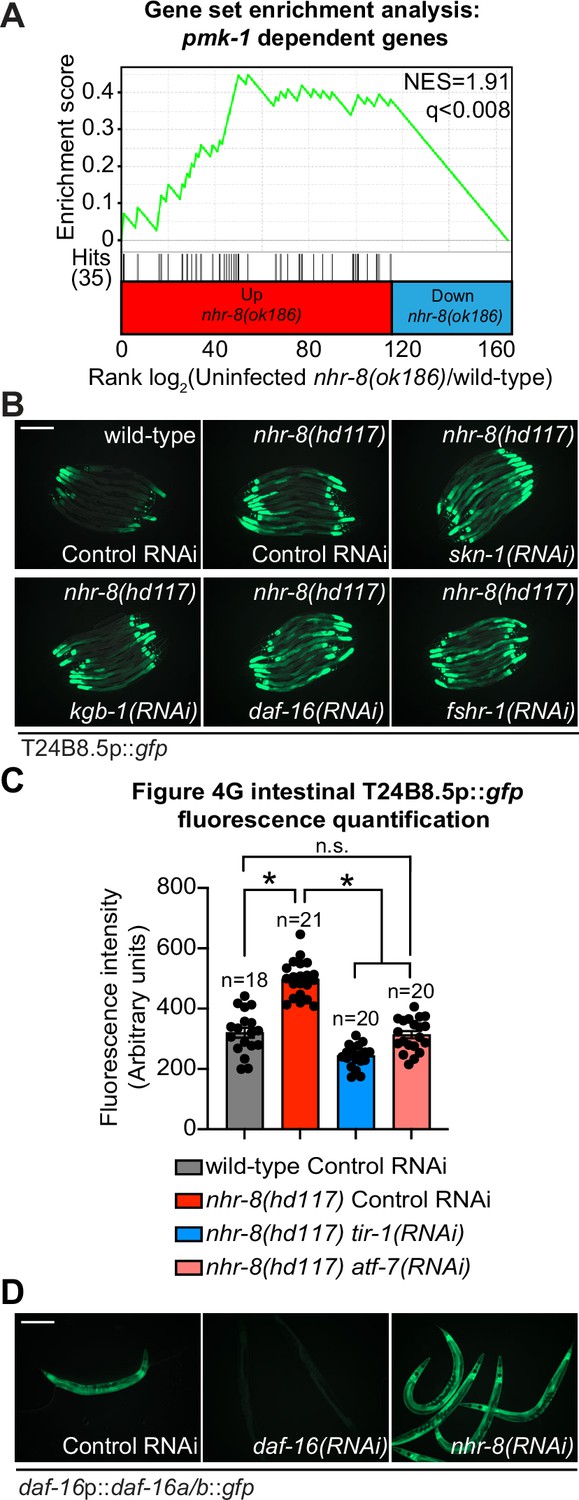
(A) Gene set enrichment analysis (GSEA) of p38 PMK-1 targets in the 0 μg/mL cholesterol mRNA-seq experiment. Fold change in expression of significantly differentially expressed genes (fold-change > 2 and q < 0.01) in uninfected animals grown in the absence (0 μg/mL) versus presence (5 μg/mL) of supplemental cholesterol are ranked from higher expression (red) to lower expression (blue). Normalized enrichment score (NES) and q-value are indicated. p38 PMK-1 targets found in the transcriptional profile are indicated by hit number in the left margin and black lines. (B) An immunoblot analysis of lysates from wild-type C. elegans grown on standard nematode growth media in the presence ( + 5 μg/mL cholesterol) and in the absence ( + 0 μg/mL cholesterol) of supplemented cholesterol using antibodies that recognize the doubly phosphorylated TGY motif of PMK-1 (phos-PMK-1), total PMK-1 protein (total PMK-1), and tubulin (α-tubulin) is shown. PMK-1 is a 43.9 kDa protein and tubulin is a 50 kDa protein. (C) The band intensities of four biological replicates of the Western blot shown in A were quantified. Error bars represent SEM. *equals p < 0.05 (unpaired t-test) (D) GSEA of p38 PMK-1 targets in the nhr-8 mRNA-seq experiment as described in A. (E, F) Western blot experiment (E) and quantification (F) of four biological replicate experiments as described in B and C with the strains of the indicated genotypes. In B and E, pmk-1(km25) and nsy-1(ag3) are loss-of-function mutants that serve as controls to confirm the specificity of phos-PMK-1 and total PMK-1 probing. Error bars represent SEM. *equals p < 0.05 (one-way ANOVA with Dunnett’s multiple comparison testing). (G) Images of T24B8.5p::gfp transcriptional immune reporter expression in wild-type animals and in nhr-8(hd117) mutants grown on control RNAi, tir-1(RNAi) or atf-7(RNAi) bacteria, as indicated. Quantification of GFP expression for this experiment is presented in Figure 4—figure supplement 1C. (H, I, J, K) qRT-PCR data of the indicated genes in the indicated mutant animals grown on standard nematode growth media ( + 5 μg/mL cholesterol). Data are the average of three to seven independent replicates, each normalized to a control gene with error bars representing SEM and are presented as the value relative to the average expression from all replicates of the indicated gene in wild-type animals. *equals p < 0.05 (one-way ANOVA with Dunnett’s multiple comparison testing) (L) Images of T24B8.5p::gfp transcriptional immune reporter animals of the indicated genotypes grown in the presence or absence of 0.1% Tergitol. Scale bars in all images equal 200 μm. (M) Survival curves of C. elegans pathogenesis assay with P. aeruginosa and C. elegans of the indicated genotypes at the L4 larval stage exposed to the indicated conditions. Data are representative of three trials. Difference between nhr-8(hd117) and all other conditions is significant (p < 0.05). The Kaplan-Meier method was used to estimate the survival curves for each group, and the log-rank test was used for all statistical comparisons. Sample sizes, mean lifespan, and p-values for all trials are shown in Supplementary file 4. See also Figure 4—figure supplement 1.
-
Figure 4—source data 1
Figure 4C Quantification of p38 immunoblot analysis of lysates from wild-type C. elegans grown on standard nematode growth media in the presence ( + 5 μg/mL cholesterol) and in the absence ( + 0 μg/mL cholesterol) of supplemented cholesterol.
- https://cdn.elifesciences.org/articles/74206/elife-74206-fig4-data1-v2.xlsx
-
Figure 4—source data 2
Figure 4F Quantification of p38 immunoblot analysis of lysates from the indicated C. elegans strains.
- https://cdn.elifesciences.org/articles/74206/elife-74206-fig4-data2-v2.xlsx
-
Figure 4—source data 3
Figure 4H qRT-PCR data of T24B8.5 in the indicated mutant animals grown on standard nematode growth media ( + 5 μg/mL cholesterol).
- https://cdn.elifesciences.org/articles/74206/elife-74206-fig4-data3-v2.xlsx
-
Figure 4—source data 4
Figure 4I qRT-PCR data of irg-4 in the indicated mutant animals grown on standard nematode growth media ( + 5 μg/mL cholesterol).
- https://cdn.elifesciences.org/articles/74206/elife-74206-fig4-data4-v2.xlsx
-
Figure 4—source data 5
Figure 4J qRT-PCR data of irg-5 in the indicated mutant animals grown on standard nematode growth media ( + 5 μg/mL cholesterol).
- https://cdn.elifesciences.org/articles/74206/elife-74206-fig4-data5-v2.xlsx
-
Figure 4—source data 6
Figure 4K qRT-PCR data of K08D8.4 in the indicated mutant animals grown on standard nematode growth media ( + 5 μg/mL cholesterol).
- https://cdn.elifesciences.org/articles/74206/elife-74206-fig4-data6-v2.xlsx
Figure 4—figure supplement 1
Cholesterol scarcity activates the p38 PMK-1 innate immune pathway.
(A) Gene set enrichment analysis (GSEA) of p38 PMK-1 targets in the mRNA-seq experiment as described in Figure 4D, except using a different nhr-8 mutant allele: nhr-8(ok186). (B) Images of T24B8.5p::gfp animals, as described in Figure 4G. (C) Fiji was used to quantify the GFP fluorescence of individual animals in the indicated conditions. The n for each condition is presented in the figure and indicates the number of animals quantified. Error bars represent SEM. *equals p < 0.05 (one-way ANOVA with Tukey’s multiple comparison testing). (D) Images of the transgenic C. elegans, in which gfp has been fused to the DAF-16 protein under the indicated conditions. Scale bars in all images equal 200 μm. See also Figure 4.
-
Figure 4—figure supplement 1—source data 1
1C Quantification of T24B8.5p::gfp expression in the indicated conditions.
- https://cdn.elifesciences.org/articles/74206/elife-74206-fig4-figsupp1-data1-v2.xlsx
Figure 5
Sterol stress activates the C. elegans p38 immune pathway through the multimerization and NAD + glycohydrolase activity of TIR-1/SARM1.
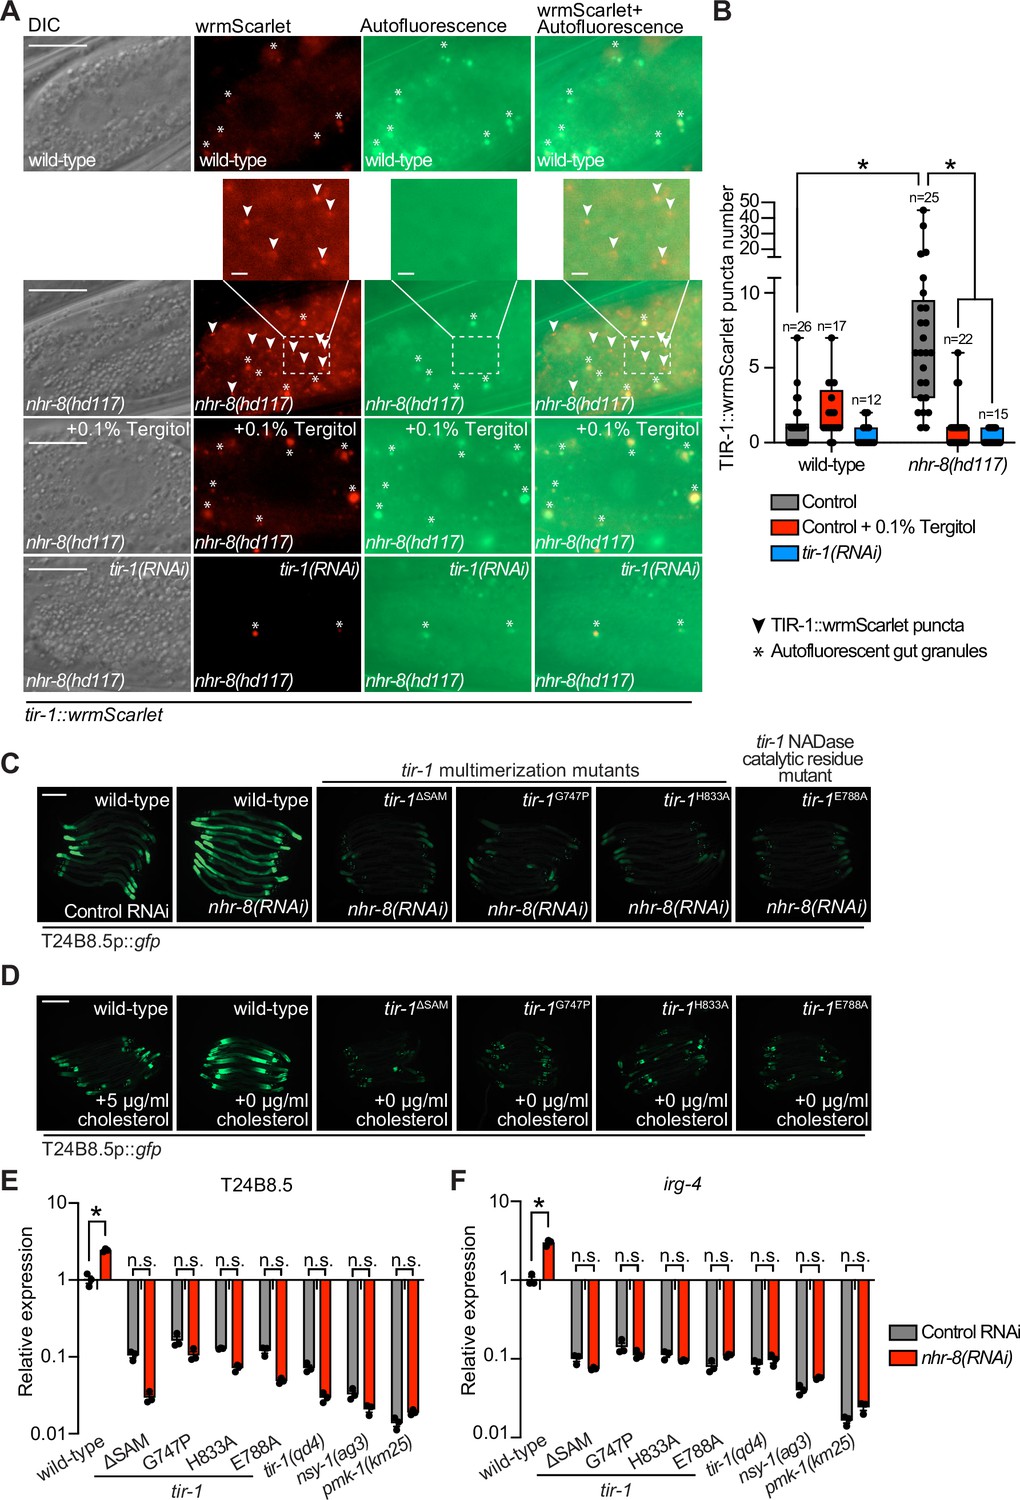
(A) Images of tir-1::wrmScarlet and nhr-8(hd117);tir-1::wrmScarlet animals as described in Figure 1A exposed to either 0.1% Tergitol or tir-1(RNAi). Scale bar equals 20 μm (2 µm for the inset enlarged images). (B) Quantification of the number of puncta present in the red (TIR-1::wrmScarlet), but not green (autofluorescence) channel with indicated conditions as described in Figure 1B. *equals p < 0.05 (two-way ANOVA with Tukey’s multiple comparison testing). (C,D) Images of T24B8.5p::gfp transcriptional immune reporter in tir-1 mutants with defects in oligomerization (tir-1ΔSAM, tir-1G747P, and tir-1H833A) and NADase catalytic activity (tir-1E788A) following nhr-8(RNAi) (C), and during cholesterol deprivation (D). Scale bar equals 200 μm. (E,F) qRT-PCR data of T24B8.5 (E) and irg-4 (F) in wild-type and mutant animals of the indicated genotypes grown on standard nematode growth media ( + 5 μg/mL cholesterol). Data are the average of three independent replicates, each normalized to a control gene with error bars representing SEM and are presented as the value relative to the average expression from all replicates in wild-type animals. *equals p < 0.05 (two-way ANOVA with Tukey’s multiple comparison testing).
-
Figure 5—source data 1
Figure 5B Quantification of the number of TIR-1::wrmScarlet puncta present in the last posterior pair of intestinal epithelial cells in the indicated strains and conditions.
- https://cdn.elifesciences.org/articles/74206/elife-74206-fig5-data1-v2.xlsx
-
Figure 5—source data 2
Figure 5E qRT-PCR data of T24B8.5 in wild-type and mutant animals of the indicated genotypes grown on standard nematode growth media ( + 5 μg/mL cholesterol).
- https://cdn.elifesciences.org/articles/74206/elife-74206-fig5-data2-v2.xlsx
-
Figure 5—source data 3
Figure 5F qRT-PCR data of irg-4 in wild-type and mutant animals of the indicated genotypes grown on standard nematode growth media ( + 5 μg/mL cholesterol).
- https://cdn.elifesciences.org/articles/74206/elife-74206-fig5-data3-v2.xlsx
Figure 6
Sterol scarcity primes p38 PMK-1 immune defenses.
(A, B, C, D, E) Images of the indicated transcriptional immune reporters under the indicated conditions. Scale bars in all images equal 200 μm. (F) A heat map compares the expression levels of the 184 genes that were both induced in wild-type animals during P. aeruginosa infection and differentially expressed (either induced or repressed) in nhr-8(hd117) mutants at baseline (each greater than two-fold, q < 0.05). To compare the expression of these genes in wild-type and nhr-8(hd117) mutants, we scaled the expression level in each condition by calculating a z-score for each row and performed hierarchical clustering, which identified two main clusters (Cluster I contains 139 genes and Cluster II contains 45 genes). See also Supplementary file 5. (G) Enrichment of p38 PMK-1-dependent genes in Cluster I and II genes is shown. (H, I, J, K) mRNA-seq data for the indicated genes from the experiment described in (F) showing scaled reads per base from three biological replicates. Error bars represent SEM. *equals q < 0.05 from RNA-seq analysis. (L) Model of p38 PMK-1 pathway activation during sterol scarcity and pathogen infection.
-
Figure 6—source data 1
Figure 6H mRNA-seq data for T24B8.5 from the conditions indicated showing scaled reads per base.
- https://cdn.elifesciences.org/articles/74206/elife-74206-fig6-data1-v2.xlsx
-
Figure 6—source data 2
Figure 6I mRNA-seq data for irg-4 from the conditions indicated showing scaled reads per base.
- https://cdn.elifesciences.org/articles/74206/elife-74206-fig6-data2-v2.xlsx
-
Figure 6—source data 3
Figure 6J mRNA-seq data for irg-5 from the conditions indicated showing scaled reads per base.
- https://cdn.elifesciences.org/articles/74206/elife-74206-fig6-data3-v2.xlsx
-
Figure 6—source data 4
Figure 6K mRNA-seq data for K08D8.4 from the conditions indicated showing scaled reads per base.
- https://cdn.elifesciences.org/articles/74206/elife-74206-fig6-data4-v2.xlsx
Tables
Key resources table
| Reagent type (species) or resource | Designation | Source or reference | Identifiers | Additional information |
|---|---|---|---|---|
| Strain, strain background (Escherichia coli) | OP50 | CaenorhabditisGenetics Center | ||
| Strain, strain background (Escherichia coli) | HT115 | CaenorhabditisGenetics Center | ||
| Strain, strain background (Escherichia coli) | BL21 (DE3) | ThermoFisher Scientific | EC0114 | Chemically competent |
| Strain, strain background (Escherichia coli) | XL1-Blue | Agilent | 200,249 | Chemically competent |
| Strain, strain background (Pseudomonas aeruginosa) | UCBPP-PA14 | PMID:7604262 | ||
| Strain, strain background (Caenorhabditis elegans) | N2; wild-type | CGC, PMID:4366476 | WormBase ID:WBStrain00000001 | Laboratory reference strain/wild type |
| Strain, strain background (Caenorhabditis elegans) | KU25 | PMID:15116070/ | WormBase ID: WBStrain00024040 | Genotype: pmk-1(km25) IV |
| Strain, strain background (Caenorhabditis elegans) | AU3 | PMID:12142542 | WormBase ID: WBStrain00000259 | Genotype: nsy-1(ag3) II |
| Strain, strain background (Caenorhabditis elegans) | ZD101 | PMID:19837372 | WormBase ID:WBStrain00040806 | Genotype: tir-1(qd4) III |
| Strain, strain background (Caenorhabditis elegans) | AA968 | PMID:23931753 | Genotype: nhr-8(hd117) IV | |
| Strain, strain background (Caenorhabditis elegans) | AE501 | PMID:11516648 | WormBase ID:WBStrain00000059 | Genotype: nhr-8(ok186) IV |
| Strain, strain background (Caenorhadbditis elegans) | AU78 | PMID:19837372 | WormBase ID:WBStrain00000262 | Genotype: agIs219 [T24B8.5p::gfp::unc-54–3’UTR; ttx-3p::gfp::unc-54–3’UTR] III |
| Strain, strain background (Caenorhabditis elegans) | AU307 | PMID:24875643 | Genotype: agIs44 [irg-4p::gfp::unc-54–3’UTR; myo-2p::mCherry] | |
| Strain, strain background (Caenorhabditis elegans) | AY101 | PMID:20133945 | WormBase ID:WBStrain00000322 | Genotype: acIs101 [pDB09.1(irg-5p::gfp); pRF4(rol-6(su1006))] |
| Strain, strain background (Caenorhabditis elegans) | TJ356 | PMID:11747825 | WormBase ID:WBStrain00034892 | Genotype: zIs356 [daf-16p::daf-16a/b::gfp + pRF4(rol-6(su1006))] |
| Strain, strain background (Caenorhabditis elegans) | RPW278 | This study | Genotype: nhr-8(hd117);agIs219 | |
| Strain, strain background (Caenorhabditis elegans) | RPW317 | This study | Genotype: tir-1(qd4);nhr-8(hd117) | |
| Strain, strain background (Caenorhabditis elegans) | RPW339 | This study | Genotype: tir-1(ums47[E788A]);agIs219 | |
| Strain, strain background (Caenorhabditis elegans) | RPW369 | This study | Genotype: tir-1(ums54[ΔSAM]);agIs219 | |
| Strain, strain background (Caenorhabditis elegans) | RPW374 | This study | Genotype: tir-1(ums55[G747P]);agIs219 | |
| Strain, strain background (Caenorhabditis elegans) | RPW381 | This study | Genotype: tir-1(ums56[H833A]);agIs219 | |
| Strain, strain background (Caenorhabditis elegans) | RPW386 | This study | Genotype: tir-1(ums57[tir-1::3xFLAG]);agIs219 | |
| Strain, strain background (Caenorhabditis elegans) | RPW387 | This study | Genotype: tir-1(ums58[tir-1[E788A]::3xFLAG]);agIs219 | |
| Strain, strain background (Caenorhabditis elegans) | RPW388 | This study | Genotype: tir-1 (ums59[tir-1[ΔSAM]::3xFLAG]);agIs219 | |
| Strain, strain background (Caenorhabditis elegans) | RPW 389 | This study | Genotype: tir-1(ums60[tir-1[G747P]::3xFLAG]);agIs219 | |
| Strain, strain background (Caenorhabditis elegans) | RPW403 | This study | Genotype: tir-1(ums63[tir-1::wrmScarlet]) | |
| Strain, strain background (Caenorhabditis elegans) | RPW404 | This study | Genotype: nhr-8(hd117);tir-1(ums63[tir-1::wrmScarlet]) | |
| Antibody | anti-total PMK-1(rabbit polyclonal) | PMID:30668573 | WB(1:1000) | |
| Antibody | anti-Phospho-p38 MAPK (Thr180/Tyr182)(rabbit polyclonal) | Cell Signaling Technology | 9211 | WB(1:1,000) |
| Antibody | anti-FLAG(mouse monoclonal) | Sigma-Aldrich | F1804 | WB(1:1,000) |
| Antibody | anti-alpha-tubulin (mouse monoclonal) | Sigma-Aldrich | T5168 | WB(1:2,000) |
| Antibody | anti-mouse IgG-HRP (goat polyclonal) | Abcam | ab6789 | WB(1:10,000) |
| Antibody | anti-rabbit IgG-HRP(goat polyclonal) | Cell Signaling Technology | 7074 | WB(1:10,000) |
| Chemical compound, drug | Peptone | Gibco | 211820 | |
| Chemical compound, drug | Agar | Fisher | BP9744 | |
| Chemical compound, drug | Cholesterol | Sigma Aldrich | C3045 | |
| Chemical compound, drug | Tri-Reagent | Sigma Aldrich | T9424 | |
| Chemical compound, drug | TERGITOL solution (Type NP-40) | Sigma Aldrich | NP40S | |
| Chemical compound, drug | RIPA Buffer | Cell Signaling Technology, Inc | 89900 | |
| Chemical compound, drug | Halt Protease and Phosphatase inhibitor | ThermoFisher Scientific | 78445 | |
| Chemical compound, drug | NuPAGELDS sample buffer | ThermoFisher Scientific | NP0007 | |
| Chemical compound, drug | 1,6-hexanediol | Sigma Aldrich | 240117 | |
| Chemical compound, drug | Nicotinamide 1,N6-ethenoadenine dinucleotide; ε-NAD | Sigma Aldrich | N2630 | |
| Chemical compound, drug | PEG 400 | Sigma Aldrich | 91893 | |
| Chemical compound, drug | PEG 1500 | Sigma Aldrich | 86101 | |
| Chemical compound, drug | PEG 3350 | Sigma Aldrich | 88276 | |
| Chemical compound, drug | PEG 8000 | Sigma Aldrich | 89510 | |
| Chemical compound, drug | Dextran | Fisher Scientific | ICN16011010 | |
| Chemical compound, drug | Sucrose | Sigma Aldrich | S0389 | |
| Chemical compound, drug | Glycerol | Sigma Aldrich | G5516 | |
| Chemical compound, drug | Sodium citrate | Sigma Aldrich | S4641 | |
| Chemical compound, drug | Kanamycin | Research Products International | K22000 | |
| Chemical compound, drug | IPTG | ThermoFisher Scientific | R0392 | |
| Chemical compound, drug | Pierce EDTA-free protease inhibitor mini tablets | ThermoFisher Scientific | A32955 | |
| Commercial assay or kit | iProof High-Fidelity DNA Polymerase | Bio-Rad Laboratories, Inc | 172–5301 | |
| Commercial assay or kit | iScript gDNA Clear cDNA Synthesis Kit | Bio-Rad Laboratories, Inc | 172–5034 | |
| Commercial assay or kit | iTaq Universal SYBR Green Supermix | Bio-Rad Laboratories, Inc | 1725120 | |
| Commercial assay or kit | DreamTaq Green PCR | ThermoFisher Scientific | K1081 | |
| Commercial assay or kit | DC protein assay | Bio-Rad Laboratories, Inc | 5000116 | |
| Commercial assay or kit | NuPAGE 4%–12% BisTris gels | ThermoFisher Scientific | NP0321BOX | |
| Commercial assay or kit | NuPAGE 3%–8% TrisAcetate gels | ThermoFisher Scientific | EA0375BOX | |
| Commercial assay or kit | SuperSignal West Pico PLUS Chemiluminescent Substrate | Thermo Fisher Scientific | 34577 | |
| Commercial assay or kit | SuperSignal West Femto PLUS Chemiluminescent Substrate | Thermo Fisher Scientific | 34095 | |
| Commercial assay or kit | Strep-Tactin XT Superflow high-capacity resin | IBA Lifesciences | 2-4030-025 | Product discontinued; suitable replacement is Strep-Tactin XT 4Flow high capacity resin (2-5030-025) |
| Commercial assay or kit | Wizard Plus SV Minipreps DNA Purification System | Promega | A1460 | |
| Commercial assay or kit | TALON Metal Affinity Resin | Takara | 635,502 | |
| Peptide, recombinant protein | Lysozyme | Sigma Aldrich | L6876 | |
| Peptide, recombinant protein | DpnI | NEB | R0176S | |
| Peptide, recombinant protein | ADP-ribosyl cyclase | Sigma Aldrich | A9106 | |
| Peptide, recombinant protein | SpCas9 Nuclease | IDT | 1081058 | |
| Recombinant DNA reagent | pET-30a(+) TIR (plasmid) | Loring et al., 2021 | Referred to as pET30a+ Strep-ceTIR-HIS in reference | |
| Software, algorithm | Fiji/imageJ | PMID:22743772 | ||
| Software, algorithm | OASIS 2 | PMID:27528229 | ||
| Software, algorithm | R Console (Version 3.5) | The R Foundation | https://www.r-project.org/ | |
| Software, algorithm | FastQC (Version 0.11.5) | https://www.bioinformatics.babraham.ac.uk/projects/fastqc/ | ||
| Software, algorithm | Kallisto (version 0.45.0) | PMID:27043002 | ||
| Software, algorithm | Sleuth (version 0.30.0) | PMID:28581496 | ||
| Software, algorithm | GSEA (version 4.1.0) | PMID:16199517 | ||
| Software, algorithm | pheatmap (version 1.0.12) | https://cran.r-project.org/web/packages/pheatmap/index.html | ||
| Software, algorithm | DAVID Bioinformatics database | PMID:19131956 | ||
| Software, algorithm | GraphPad Prism 9 | Graphpad | https://www.graphpad.com/scientific-software/prism/ |
Additional files
-
Supplementary file 1
Genes significantly differentially expressed in uninfected nhr-8(hd117) mutants compared to wild-type animals in the RNA-seq experiments presented in Figure 3D and Figure 3—figure supplement 1B.
- https://cdn.elifesciences.org/articles/74206/elife-74206-supp1-v2.xlsx
-
Supplementary file 2
Genes significantly differentially expressed in uninfected nhr-8(ok186) mutants compared to wild-type animals in the RNA-seq experiments presented in Figure 3—figure supplement 1A.
- https://cdn.elifesciences.org/articles/74206/elife-74206-supp2-v2.xlsx
-
Supplementary file 3
Genes significantly differentially expressed in uninfected wild-type animals in the absence (0 μg/mL) versus presence (5 μg/mL) of cholesterol supplementation in the RNA-seq experiments presented in Figure 3E and Figure 3—figure supplement 1B.
- https://cdn.elifesciences.org/articles/74206/elife-74206-supp3-v2.xlsx
-
Supplementary file 4
Sample sizes, mean lifespan, and p values for the C. elegans pathogenesis assays.
- https://cdn.elifesciences.org/articles/74206/elife-74206-supp4-v2.xlsx
-
Supplementary file 5
Genes in Cluster one and Cluster 2 of the heat map shown in Figure 6F.
- https://cdn.elifesciences.org/articles/74206/elife-74206-supp5-v2.xlsx
-
Supplementary file 6
Primer, crRNA guide and ssODN sequences designed for this study.
- https://cdn.elifesciences.org/articles/74206/elife-74206-supp6-v2.xlsx
-
Supplementary file 7
pmk-1 dependent genes used for GSEA analysis.
- https://cdn.elifesciences.org/articles/74206/elife-74206-supp7-v2.xlsx
-
Transparent reporting form
- https://cdn.elifesciences.org/articles/74206/elife-74206-transrepform1-v2.pdf
-
Source data 1
Raw and annotated gel and blot images 2 of 2.
- https://cdn.elifesciences.org/articles/74206/elife-74206-data1-v2.zip
-
Source data 2
Raw and annotated gel and blot images 1 of 2.
- https://cdn.elifesciences.org/articles/74206/elife-74206-data2-v2.zip
Download links
A two-part list of links to download the article, or parts of the article, in various formats.
Downloads (link to download the article as PDF)
Open citations (links to open the citations from this article in various online reference manager services)
Cite this article (links to download the citations from this article in formats compatible with various reference manager tools)
Pathogen infection and cholesterol deficiency activate the C. elegans p38 immune pathway through a TIR-1/SARM1 phase transition
eLife 11:e74206.
https://doi.org/10.7554/eLife.74206


