KLC4 shapes axon arbors during development and mediates adult behavior
- Department of Integrative Biology, University of Wisconsin-Madison, United States
- Center for Quantitative Cell Imaging, University of Wisconsin-Madison, United States
- Department of Neuroscience, University of Wisconsin-Madison, United States
- Morgridge Institute for Research, United States
- National Innovation Center for Advanced Medical Devices, China
- Department of Biology and Psychology, Georg-August-University, Germany
Figures
Figure 1 with 1 supplement
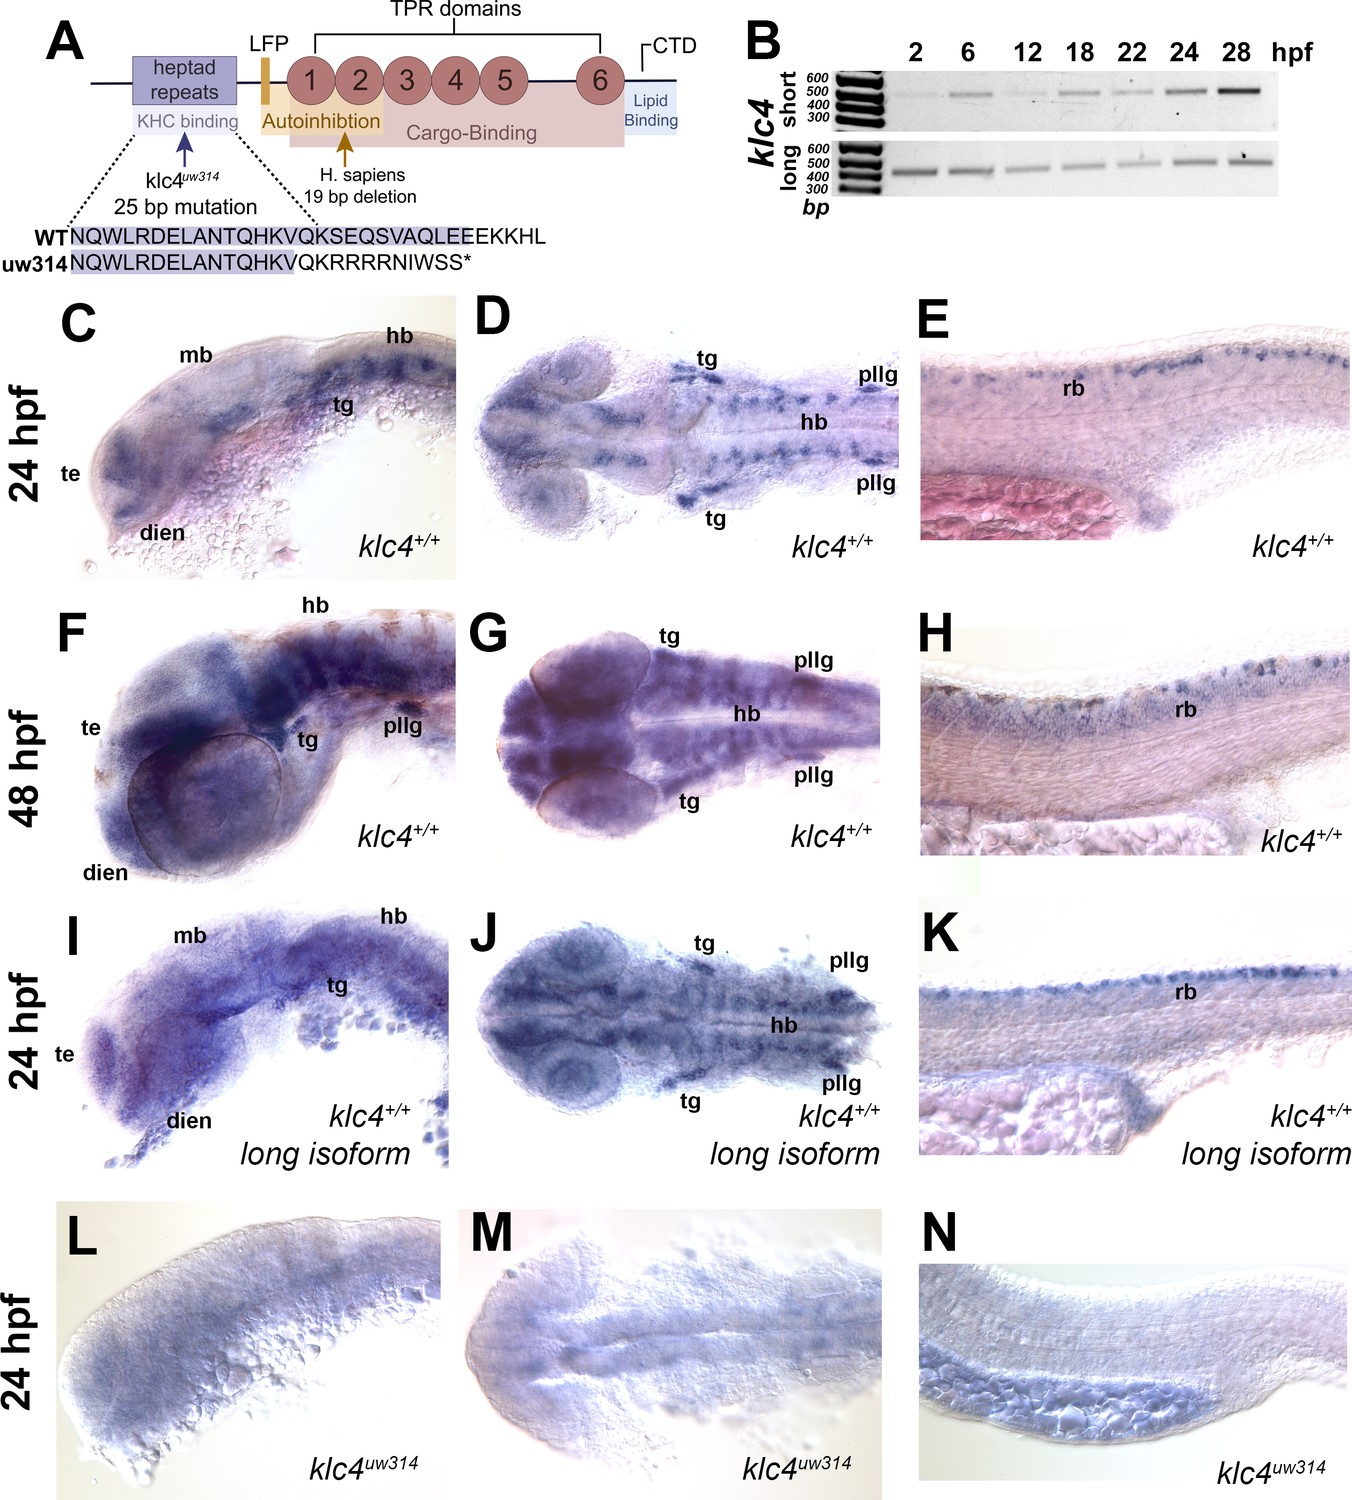
klc4 mRNA is expressed in developing zebrafish embryos.
(A) Diagram of the highly conserved domains of KLC4. Arrows indicate where mutation occurs in humans and in our zebrafish mutant. (B) Qualitative RT-PCR showing both long and short klc4 isoforms are expressed throughout development. (C–D) In situ hybridization for klc4 mRNA shown in lateral view (C) or dorsal view (D) of the head in wild type 24 hpf embryos. (E) Lateral view of trunk showing klc4 expression in Rohon-Beard sensory neurons in a 24 hpf wild type embryo. (F–G) klc4 expression in the lateral view (F) or dorsal view (G) of the head of a 48 hpf wild type embryo. (H) Lateral view of trunk showing klc4 expression in the spinal cord of a 48 hpf wild type embryo. (I–K) Lateral (I,K) and dorsal (J) views of klc4 long isoform specific in situ hybridization in wild type 24 hpf embryos. Lateral (L,N) and dorsal (M) views of klc4 in situ hybridization in 24 hpf klc4uw314 mutant embryo head (L,M) and trunk (N) showing little expression of klc4. Te = telencephalon, dien = diencephalon, mb = midbrain, hb = hindbrain, tg = trigeminal ganglion, pllg = posterior lateral line ganglion, rb = rohon beard neuron.
-
Figure 1—source data 1
Original.tiff and.scn file for the gel of RT-PCR results showing presence of klc4 isoforms.
- https://cdn.elifesciences.org/articles/74270/elife-74270-fig1-data1-v2.zip
Figure 1—figure supplement 1
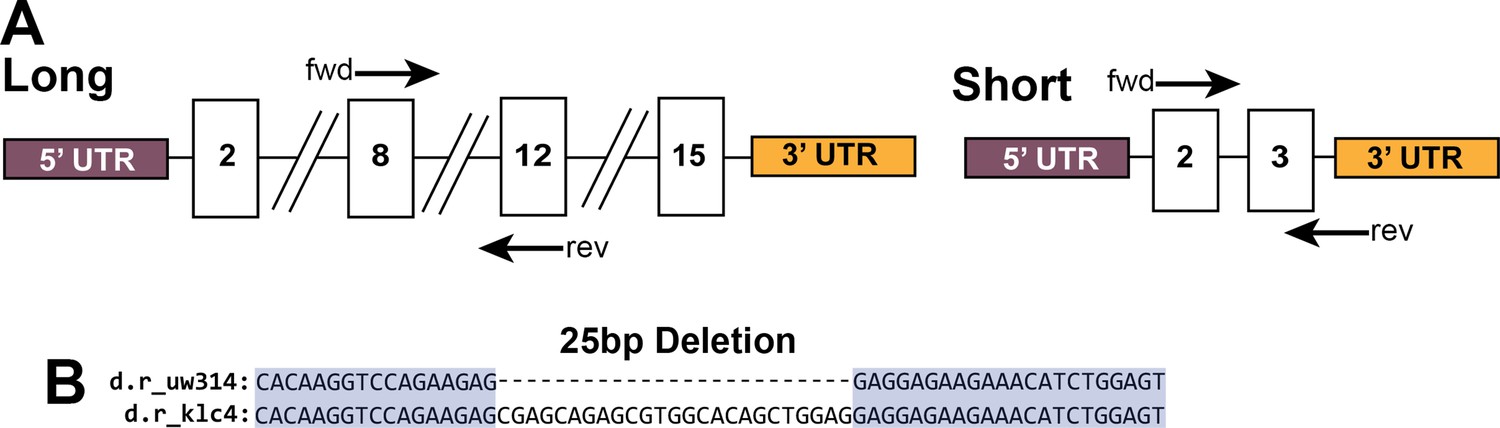
PCR strategy for the detection of long and short klc4 isoforms, and sequence alignment of wild type and klc4uw314 mutant.
(A) Diagram of the primer design for the RT-PCR of the long and short isoforms of klc4. For the long isoform, the primers were designed for regions of exon 8 (fwd) and exon 12 (rev), which are not contained in the short isoform. The amplified product is 421 bp. For the short isoform, the primers were designed against exon 2 (contained in long isoform) and the short isoform 3’UTR (not contained in long isoform). The amplified product is 523 bp. (B) The sequence alignment around the 25 bp deletion within exon 3 contained in klc4uw314 mutants.
Figure 2 with 3 supplements
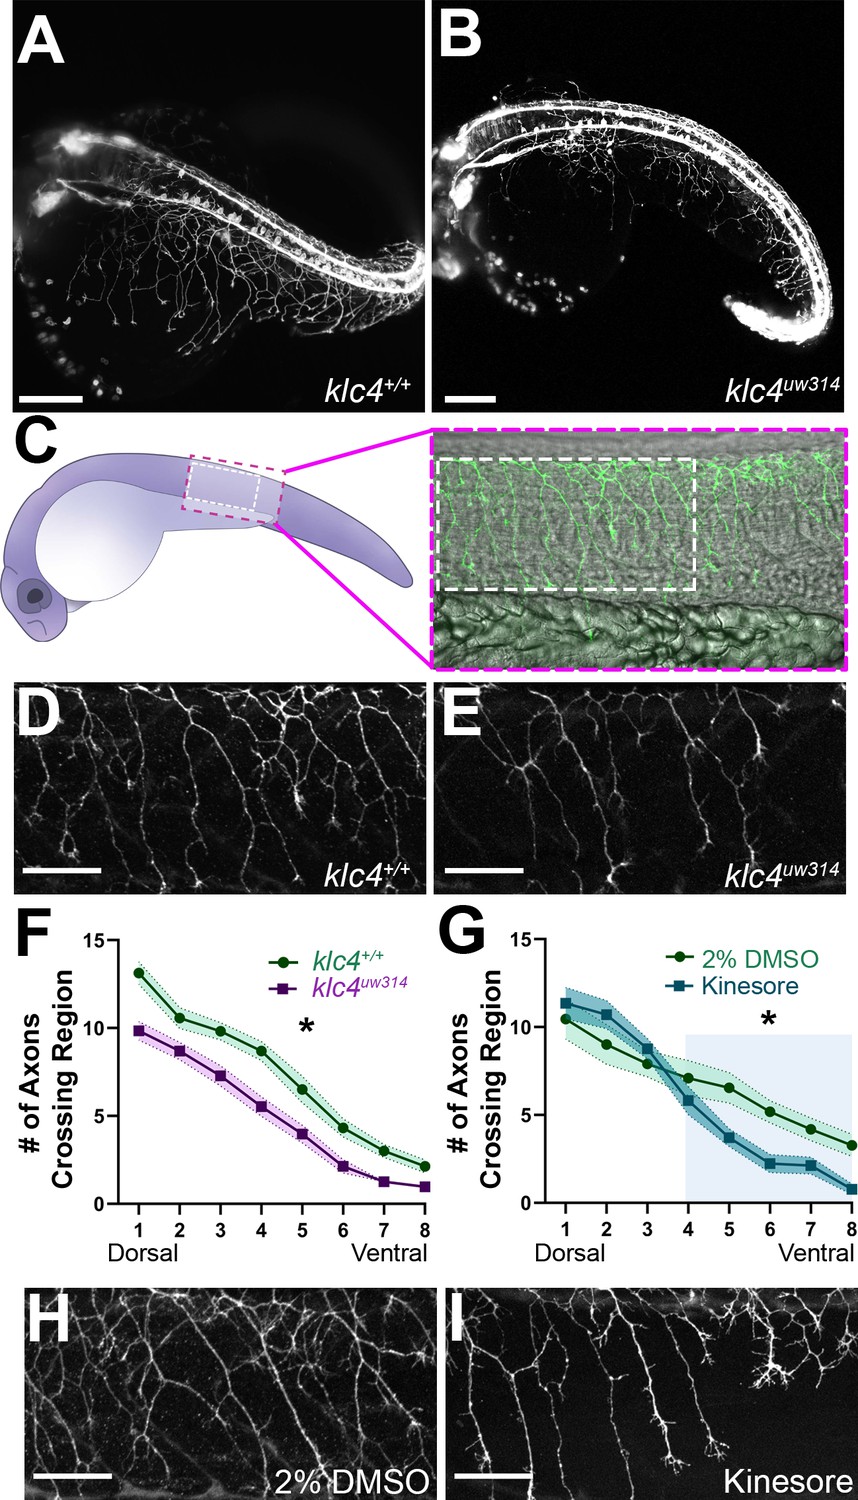
klc4uw314 mutants have reduced Rohon-Beard peripheral axon branching.
(A–B) Stills taken at approximately 24 hpf from long term light sheet movies of wild type (A) or klc4uw314 mutant (B) embryo development Scale bar = 150µm. (C) Diagram of a 24 hpf embryo indicating the area over the yolk tube extension imaged for axon analysis, with the standard region used for analysis outlined by the white dashed rectangle. (D–E) Representative examples of HNK-1 stained embryos showing peripheral axon branching in wild type (D) and klc4uw314 I embryos. (F–G) Quantification of axon branching across three technical replicates in wild type (n=32) and klc4uw314 mutant (n=32) embryos (F) and DMSO (n=12) and kinesore (n=17) treated embryos (G). Error bars = SEM. Statistical significance was measured by comparing the area under the curve for (F–G) using t-test. For (F), *p=0.0378 for entire graph. For (G), *p=0.0484 for shaded region. (H–I) Representative examples of HNK-1 stained embryos showing peripheral axon branching in DMSO (H) and kinesore treated (I) embryos. Scale bars for D,E,H,I = 50 µm.
-
Figure 2—source data 1
The number of branches crossing a selected region of interest (1-8) for wild type and klc4uw314 mutant embryos.
- https://cdn.elifesciences.org/articles/74270/elife-74270-fig2-data1-v2.xlsx
-
Figure 2—source data 2
The number of branches crossing a selected region of interest (1-8) for wild type embryos treated with either 2% DMSO or 100 µM Kinesore.
- https://cdn.elifesciences.org/articles/74270/elife-74270-fig2-data2-v2.xlsx
Figure 2—figure supplement 1
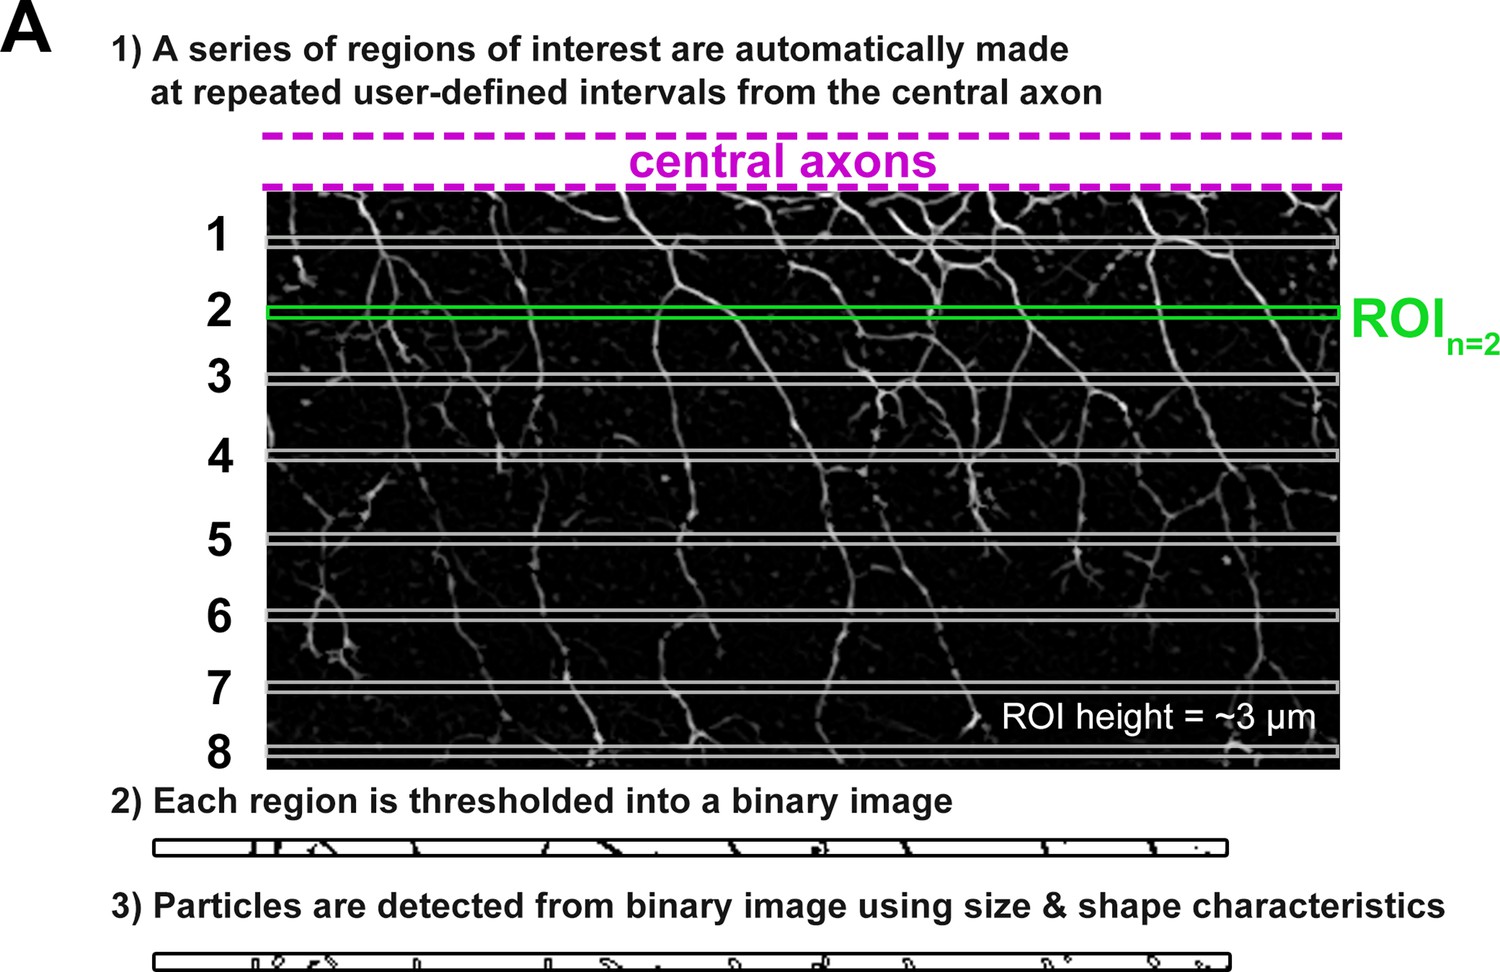
Schematic describing our branch analysis method.
A standard sized ROI (ROItrunk) from the trunk over the yolk tube extension is selected with the top of the ROItrunk aligned to the bottom of the central axon fascicle. Eight 3 µm ROIs (white and green, ROIn, n=1–8) are selected at regularly spaced intervals along ROItrunk. Each ROIn is duplicated and then thresholded into a binary image. This binary image is run through Particle Analysis in ImageJ, which counts the number of particles present with gating for size and shape characteristics. We use the number of particles counted to represent the number of branches passing through ROIn.
Figure 2—video 1
A wild type Tg(–3.1ngn1:gfp-caax) embryo imaged by light sheet microscopy over 11.6 hr to show sensory axon development, from approximately 18 to 29.6 hpf.
Anterior is to the left.
Figure 2—video 2
A klc4uw314 mutant Tg(–3.1ngn1:gfp-caax) embryo imaged by light sheet microscopy over 8.6 hr to show sensory axon development, from approximately 19 to 27.6 hpf.
Anterior is to the left.
Figure 3 with 2 supplements
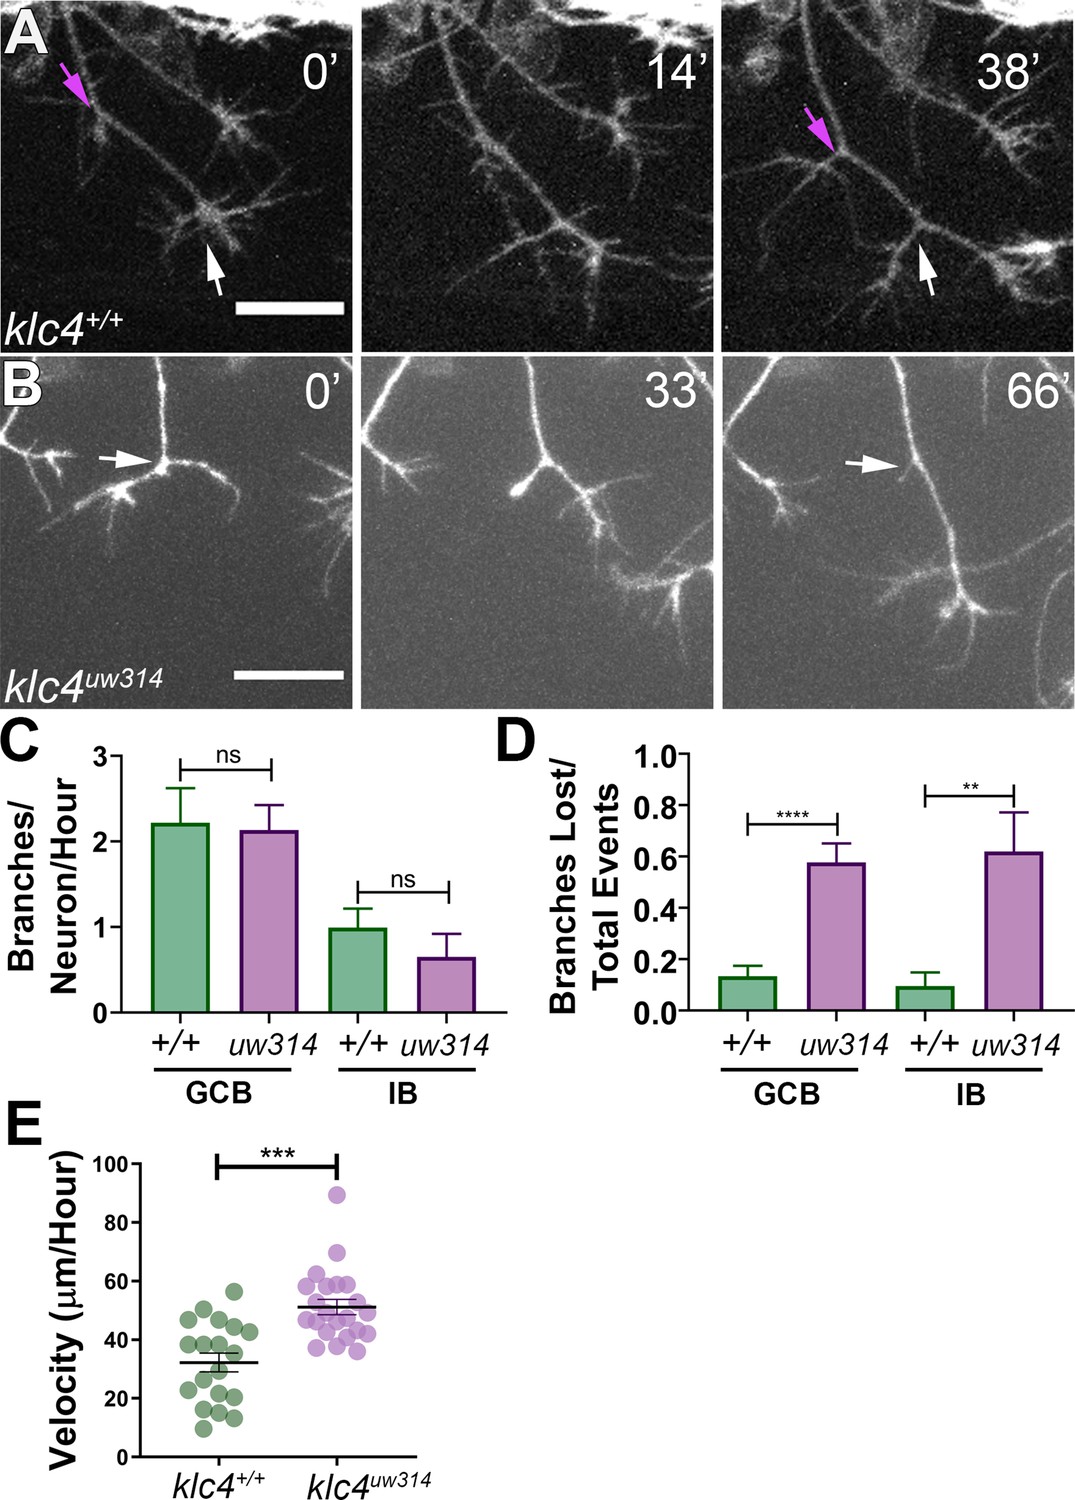
Branches initiate but do not stabilize in klc4uw314 mutants.
(A) A wild type axon forms stable branches by growth cone bifurcation (GCB, white arrows) and interstitial branching (IB, magenta arrows) over the course of 38’ min. (B) A klc4uw314 mutant axon initiates a branch via GCB (0minutes, white arrow), but one branch begins to retract and is nearly fully gone after 66’ min (panel 3, white arrow). 20 µm scale bar. (C) Quantification of axon branch initiations per neuron per hour in wild type and mutant embryos wild type GCB mean = 2.22 branches/neuron/hr, N=11 neurons from 4 embryos. Klc4uw314 GCB = 2.13 branches/neuron/hr, N=14 neurons from 4 embryos. Wild type IB=0.99 branches/neuron/hr, N=10 neurons from 4 embryos. Klc4uw314 IB = 0.65 branches/neuron/hr, N=8 neurons from 4 embryos. Error bars = SEM. There was no significant difference in branch initiation between wild type and mutant axons. GCB P=0.73, IB P=0.15, Mann–Whitney test. (D) Quantification of branches that retracted after initiation in wild type and klc4uw314 embryos. Data are displayed as a branch loss ratio (branches retracted/total branching events). Branches created by either GCB or IB were both more likely to retract in klc4uw314 embryos (wild type GCB mean = 0.13, N=11 neurons from 4 embryos; klc4uw314 GCB = 0.58, N=14 neurons from 4 embryos; wild type IB = 0.10, N=10 neurons from 4 embryos; klc4uw314 IB = 0.62, N=8 neurons from 4 embryos). **p=0.0055, ****p<0.0001, Mann–Whitney test. Error bars = SEM. (E) Quantification of axon growth velocity. Axons in klc4uw314 mutants grow faster than in wild type. Wild type N=19 axons from 3 embryos. Klc4uw314 N=22 axons from 4 embryos. ***P=0.0001, Mann-Whitney test. Error bars = SEM.
-
Figure 3—source data 1
The number of branches initiated per neuron per hour separated by type of branch (growth cone bifurcation = GCB, Interstitial Branch = IB).
- https://cdn.elifesciences.org/articles/74270/elife-74270-fig3-data1-v2.xlsx
-
Figure 3—source data 2
The number of branches of a category (growth cone bifurcation = GCB, Interstitial Branch = IB) that retracted divided by the total number of branching events of that category.
- https://cdn.elifesciences.org/articles/74270/elife-74270-fig3-data2-v2.xlsx
-
Figure 3—source data 3
The growth speed of wild type and klc4uw314 mutant embryos.
- https://cdn.elifesciences.org/articles/74270/elife-74270-fig3-data3-v2.xlsx
Figure 3—video 1
Branches in a wild type Tg(-3.1ngn1:gfp-caax) embryo growing and spreading over 15 min.
Figure 3—video 2
An example of a growth cone bifurcation in a klc4uw314 mutant Tg(-3.1ngn1:gfp-caax) embryo where the left branch begins to retract at approximately 23 min.
Figure 4 with 1 supplement
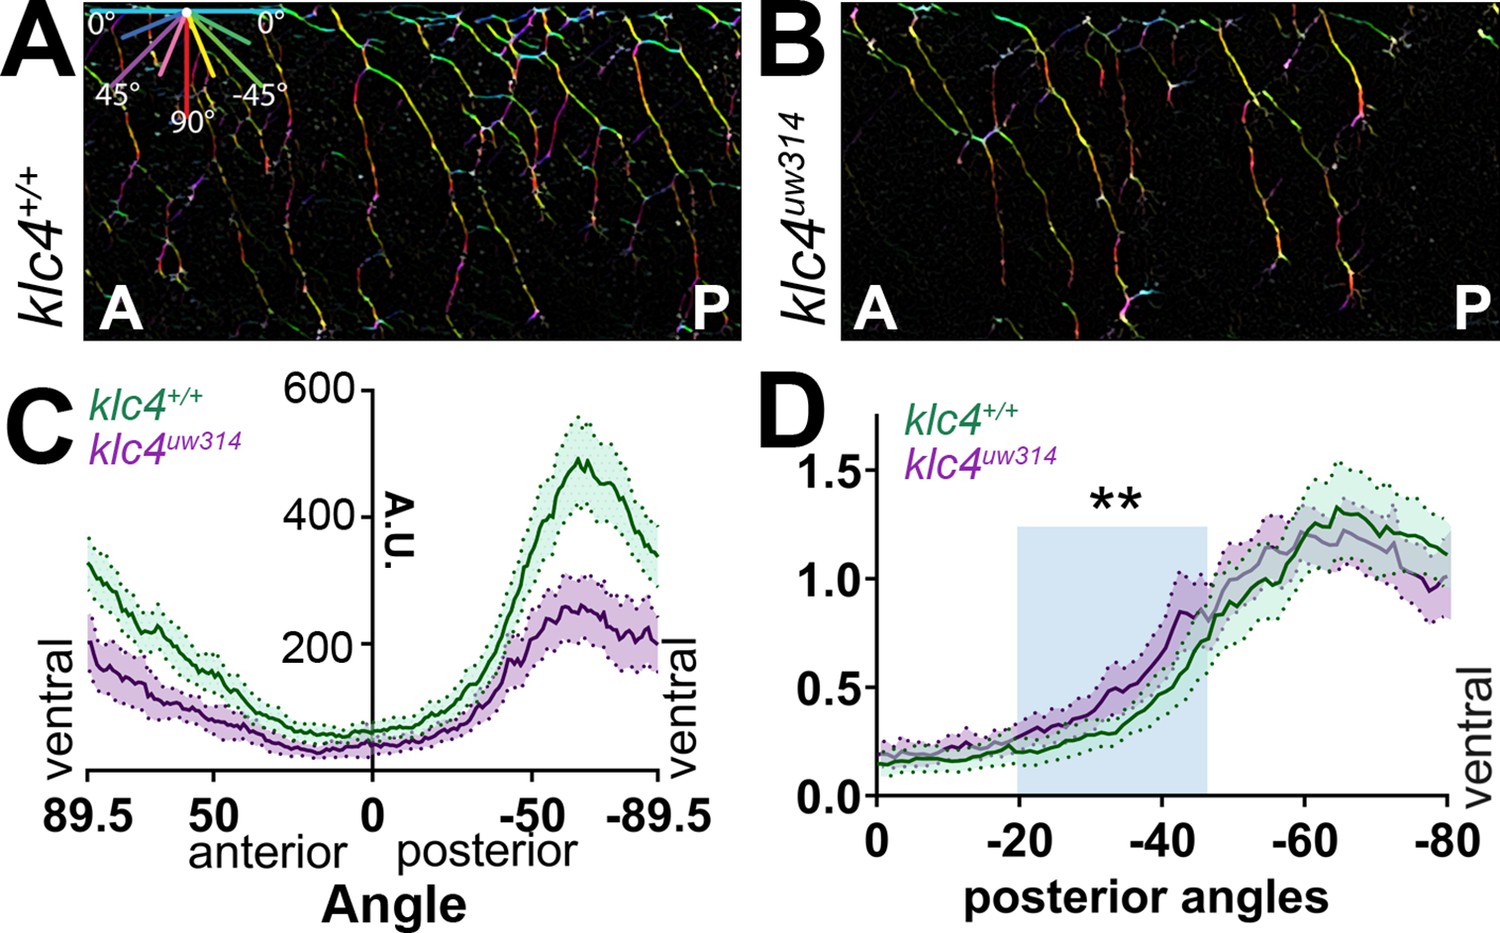
Axon orientation profiling reveals increased posterior directionality of peripheral axons in klc4uw314 mutants.
(A–B) A representative region of axon analysis for a 24 hpf wild type (A) and klc4uw314 (B) embryo. The axons are color coded for directionality according to the legend in the upper left corner of (A). (C) Plot of axon directionality in 24 hpf wild type (green) and klc4uw314 mutants (magenta). (D) Axon directionality data was normalized to total signal and posterior angles are displayed to compare directional bias. Area under the curve was measured for shaded area and tested for statistical significance using a t-test. **P=0.0047. For (C–D), error bars = 95% CI. Wild type N=40 embryos, klc4uw314 N=23 embryos.
-
Figure 4—source data 1
Histogram of the axon signal at each angle for wild type and klc4uw314 mutant axons, used to generate directional distribution plots.
- https://cdn.elifesciences.org/articles/74270/elife-74270-fig4-data1-v2.xlsx
-
Figure 4—source data 2
Histogram data in Source Data 1 that has been normalized to the total axon signal present in the sample.
Presented as a percentage of total signal.
- https://cdn.elifesciences.org/articles/74270/elife-74270-fig4-data2-v2.xlsx
Figure 4—figure supplement 1
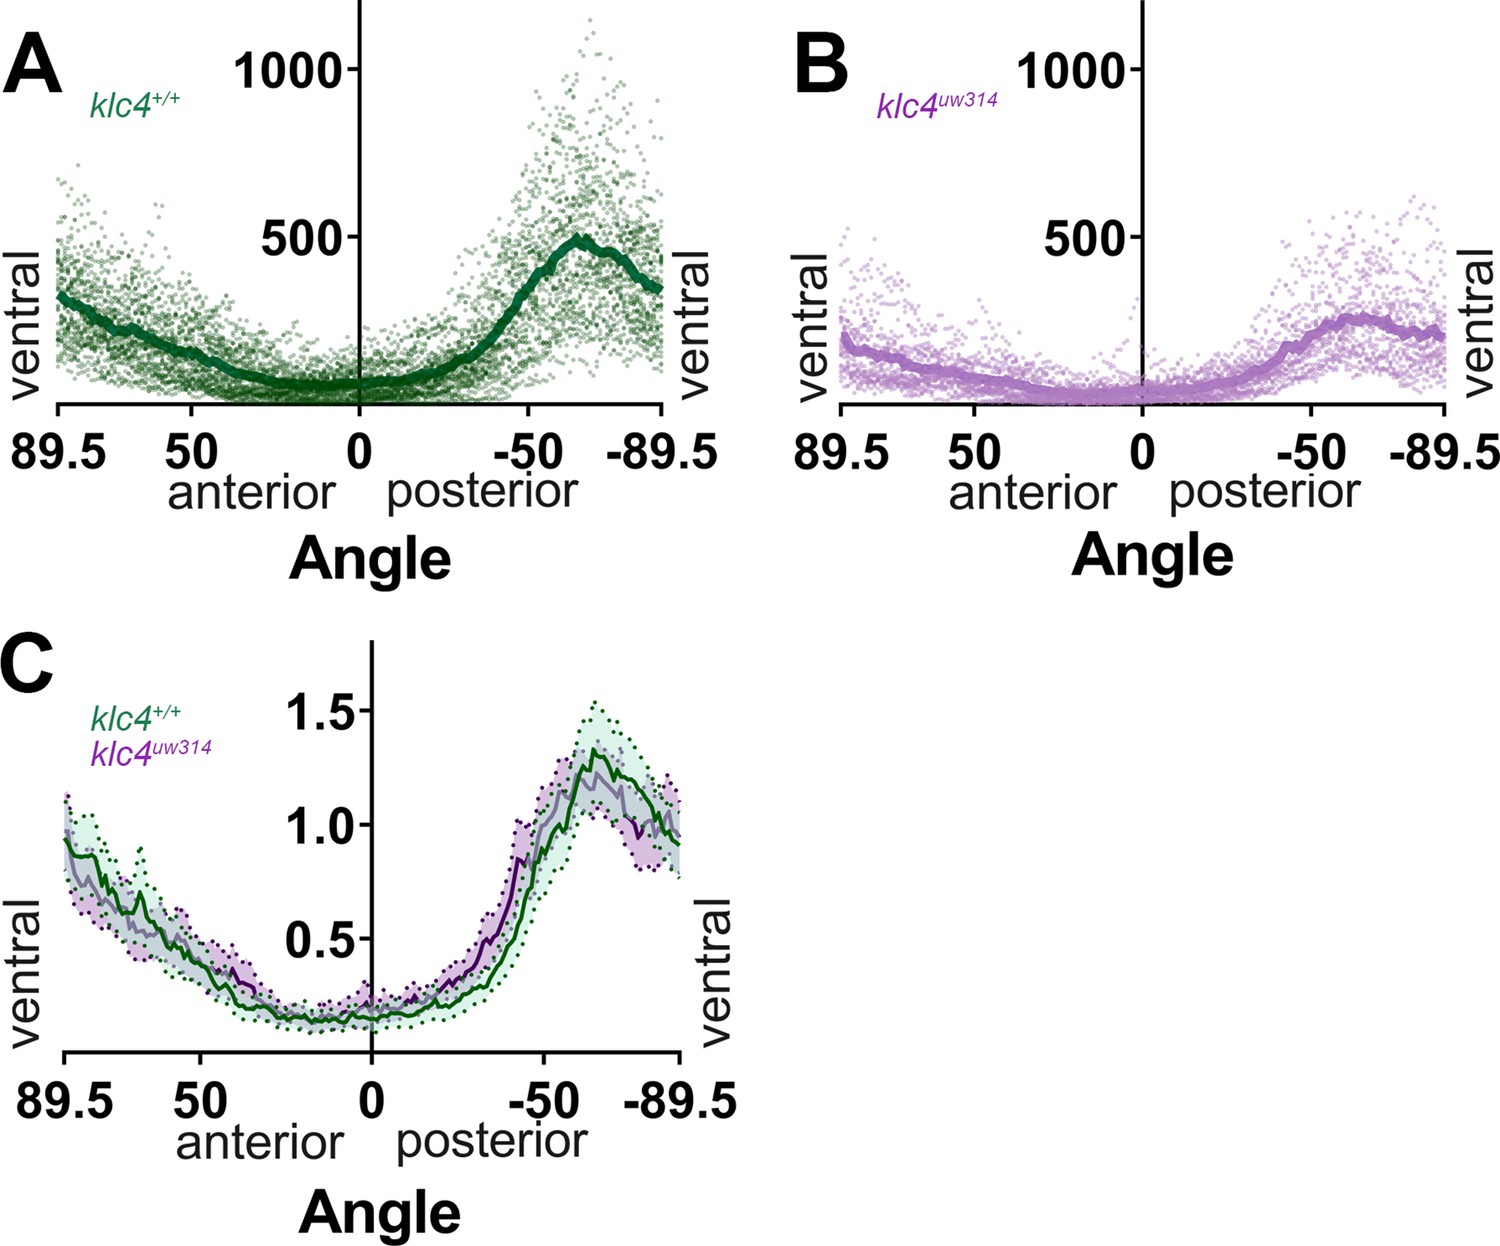
Additional data for branch directionality profiling.
(A) All individual data points for the 40 wild-type embryos analyzed (dots), with the mean overlayed (dark green line). (B) All individual data points for the 23 klc4uw314 mutant embryos analyzed (dots), with the mean overlayed (magenta line). (C) Axon directionality data normalized to total signal with posterior and anterior data displayed. Error bars = 95% CI.
Figure 5 with 2 supplements
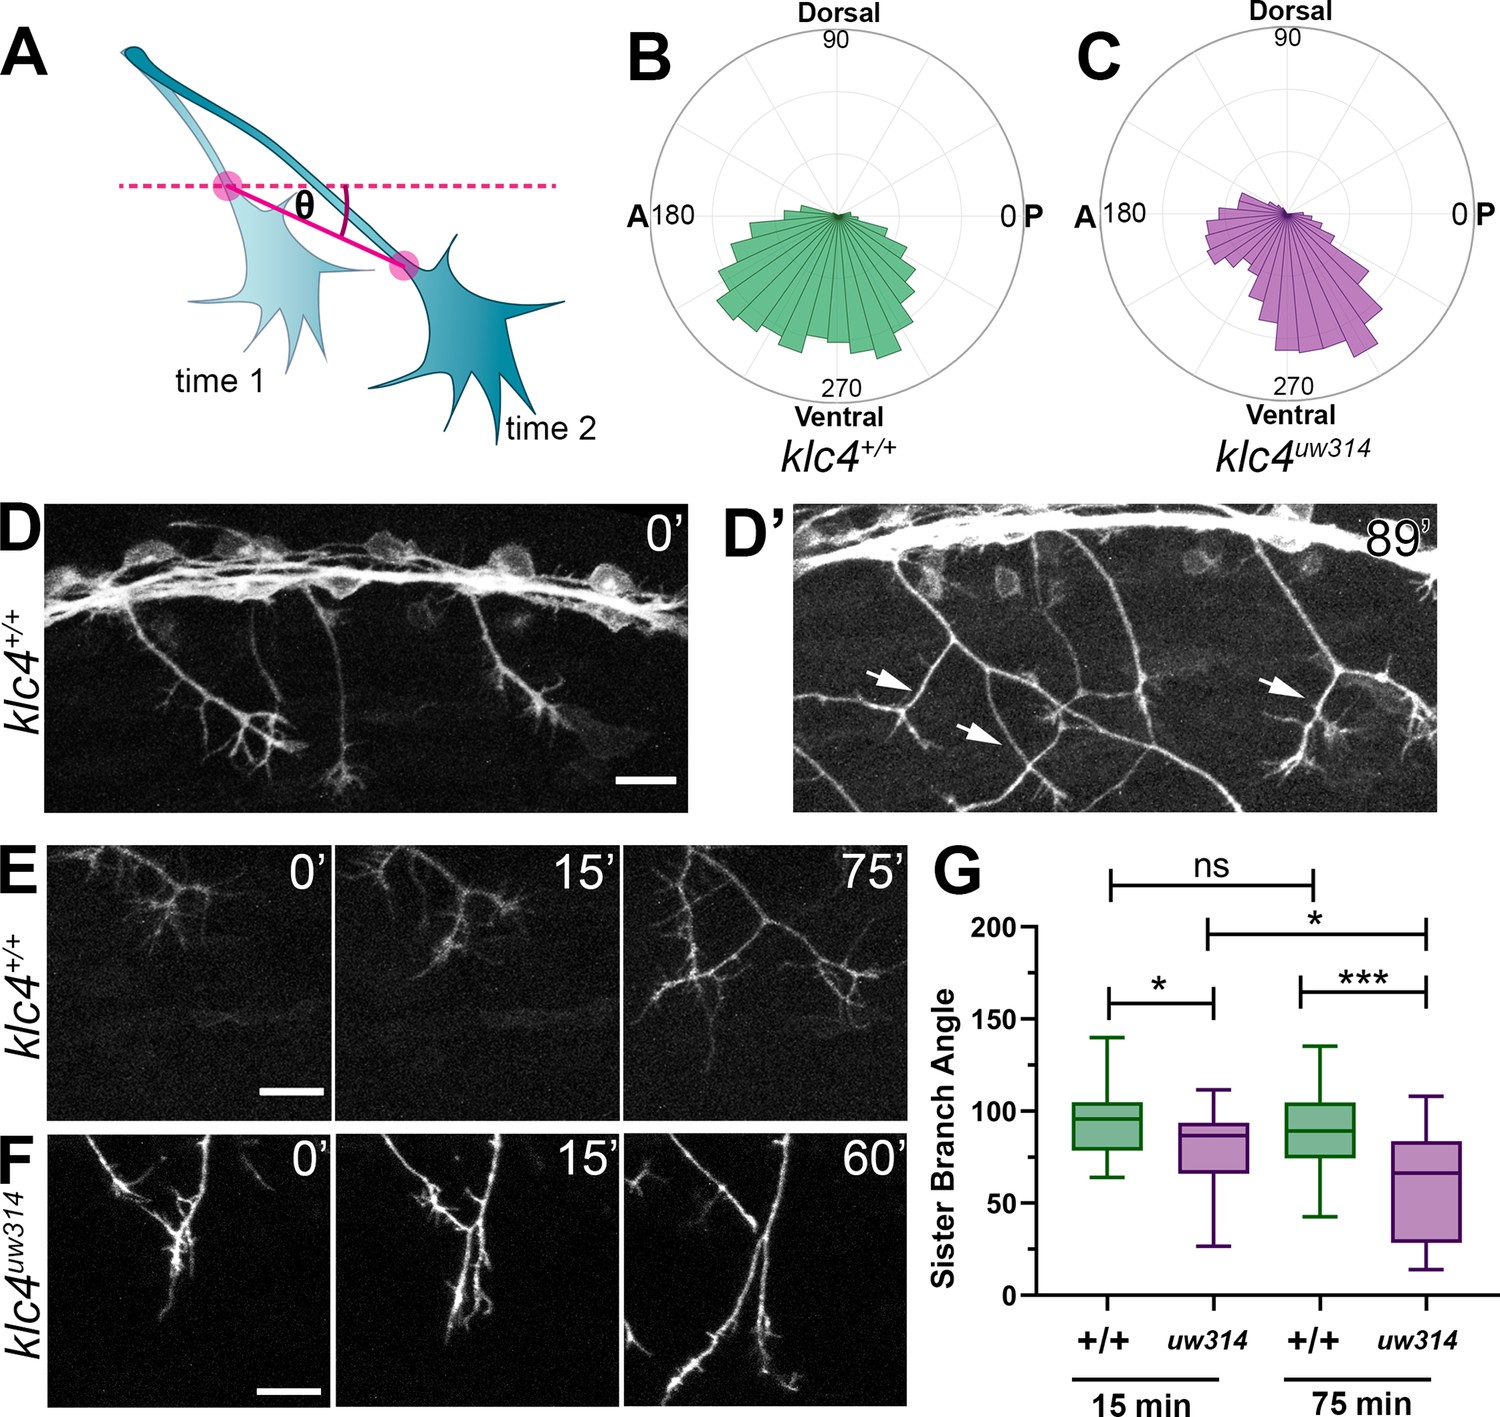
Live imaging shows that klc4uw314 mutants have a bias toward posterior growth direction and defective sister branch separation.
(A) Illustration of how axon growth direction was measured. The angle between an axon’s position in each frame and the frame preceding it was measured. (B–C) These angles were plotted as rose plots to show growth direction distributions. Wild type axons grow evenly between anterior and posterior directions, while klc4uw314 mutant axons show a preference for posterior directed growth. Wild type N=19 axons from 3 embryos. Klc4uw314 N=22 axons from 4 embryos. (D) Stills from a live capture of wild type axon outgrowth, showing that axons often grow posteriorly, but anterior directed branches form over time (D’, white arrows). (E) As a branch forms in a wild type peripheral axon, the angle between sister branches remains consistent as axons grow apart. (F) In klc4uw314 mutants, sister branches do not grow as far apart and the sister branch angle narrows over time compared to wild type. All scale bars = 20 µm. (G) Quantification of the angle between newly formed sister branches at 15 and 75 min after branch creation. Wild type 15’ N=37 branches, klc4uw314 15’ N=36 branches, Wild type 75’ N=25 branches, klc4uw314 75’ N=18 branches. 4 embryos per genotype. *p=0.021, ***p=0.0003, One-way ANOVA. Error bars = 5-95th percentile.
-
Figure 5—source data 1
The rose plot data generated with the Chemotaxis Tool for wild type axon tracking data.
- https://cdn.elifesciences.org/articles/74270/elife-74270-fig5-data1-v2.xlsx
-
Figure 5—source data 2
The rose plot data generated with the Chemotaxis Tool for klc4uw314 mutant axon tracking data.
- https://cdn.elifesciences.org/articles/74270/elife-74270-fig5-data2-v2.xlsx
-
Figure 5—source data 3
The angle between sister branches, measured at 15 min after branch formation and 75 min after branch formation.
If a branch retracted or the 75-min time point fell out of recorded range, no data was recorded for the 75-min point.
- https://cdn.elifesciences.org/articles/74270/elife-74270-fig5-data3-v2.xlsx
Figure 5—video 1
Example of a wild type peripheral axon growing out while maintaining a wide branch angle between sister branches.
Figure 5—video 2
Peripheral axon growth in a klc4uw314 mutant embryo demonstrating both fasciculation between axons from the same neuron (self-fasciculation) and the narrowing of the angle between sister axons over time.
Figure 6 with 2 supplements
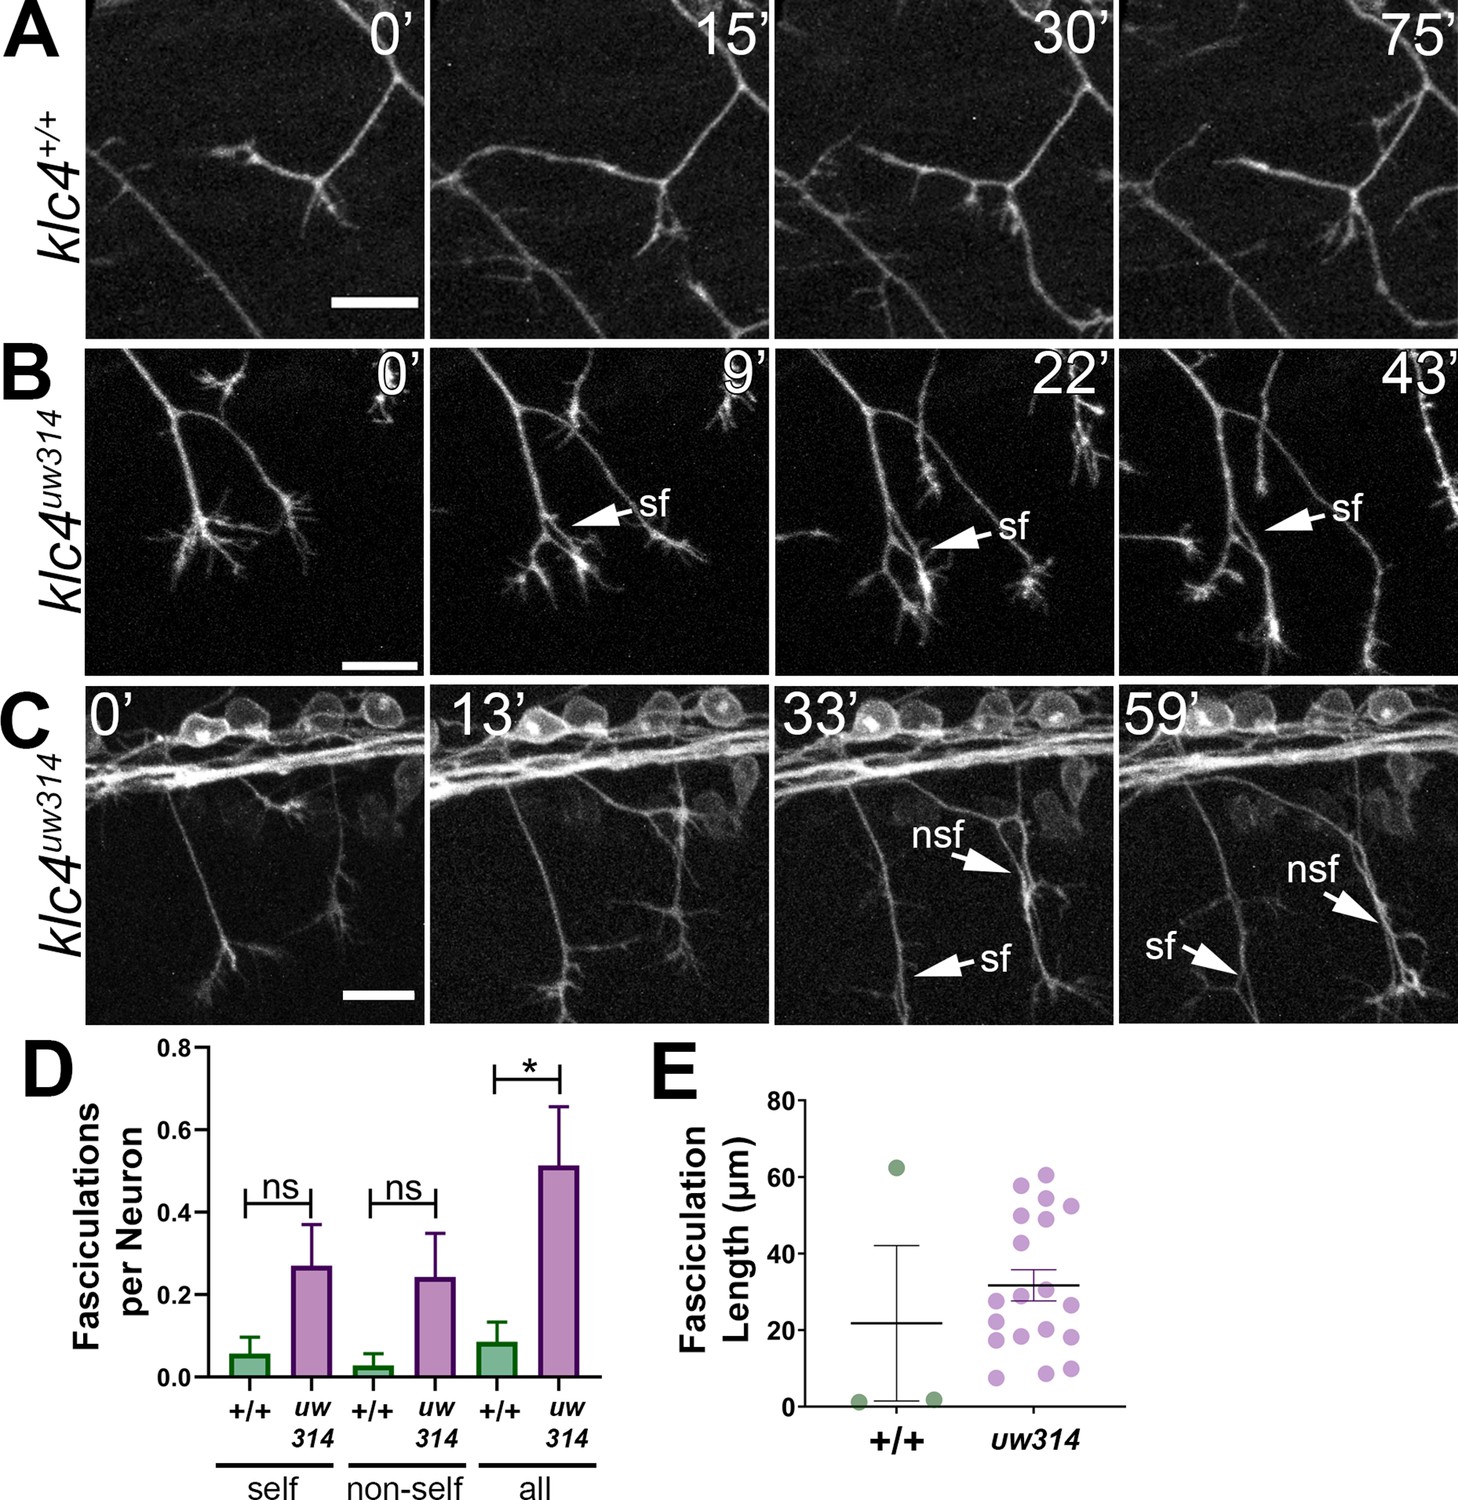
Loss of KLC4 results in aberrant axon fasciculation.
(A) In wild type embryos, the most common response to self or non-self contact between axons is retraction. Two neighboring axons in a wild type embryo make contact (time 0’) and within 30 min, one of the axons has retracted. (B–C) When axons make contact in klc4uw314 embryos, they often fasciculate instead of retracting. This happens with both self-contacts (B–C, sf) and non-self-contacts (C), nsf. All scale bars = 20 µm. (D) Fasciculations per neuron, separated by self or non-self, as well as all fasciculations combined. Wild type N=35 neurons in 4 embryos. Klc4uw314 N=37 neurons in 5 embryos. Error bars = SEM. (E) Fasciculation length was measured from the last frame of each 2 hr imaging period. Wild type N=3 fasciculations, klc4uw314 N=19 fasciculations. Mean with SEM displayed over individual data points. Because fasciculation events are rare in wild-type embryos and a length measurement is conditional on the event occurring, we could not apply a statistical test to assess the significance of the difference in fasciculation length.
-
Figure 6—source data 1
Fasciculations per neuron, separated as self or non-self, and combined (all).
- https://cdn.elifesciences.org/articles/74270/elife-74270-fig6-data1-v2.xlsx
-
Figure 6—source data 2
Fasciculation length measured in microns.
- https://cdn.elifesciences.org/articles/74270/elife-74270-fig6-data2-v2.xlsx
Figure 6—video 1
A peripheral axon in a klc4uw314 mutant embryo contacts a neighboring peripheral axon and fasciculates with it.
Figure 6—video 2
Tight fasciculation is revealed in a klc4uw314 mutant peripheral axon as a gap opens between the two axons as an interstitial branch forms.
Figure 7 with 3 supplements
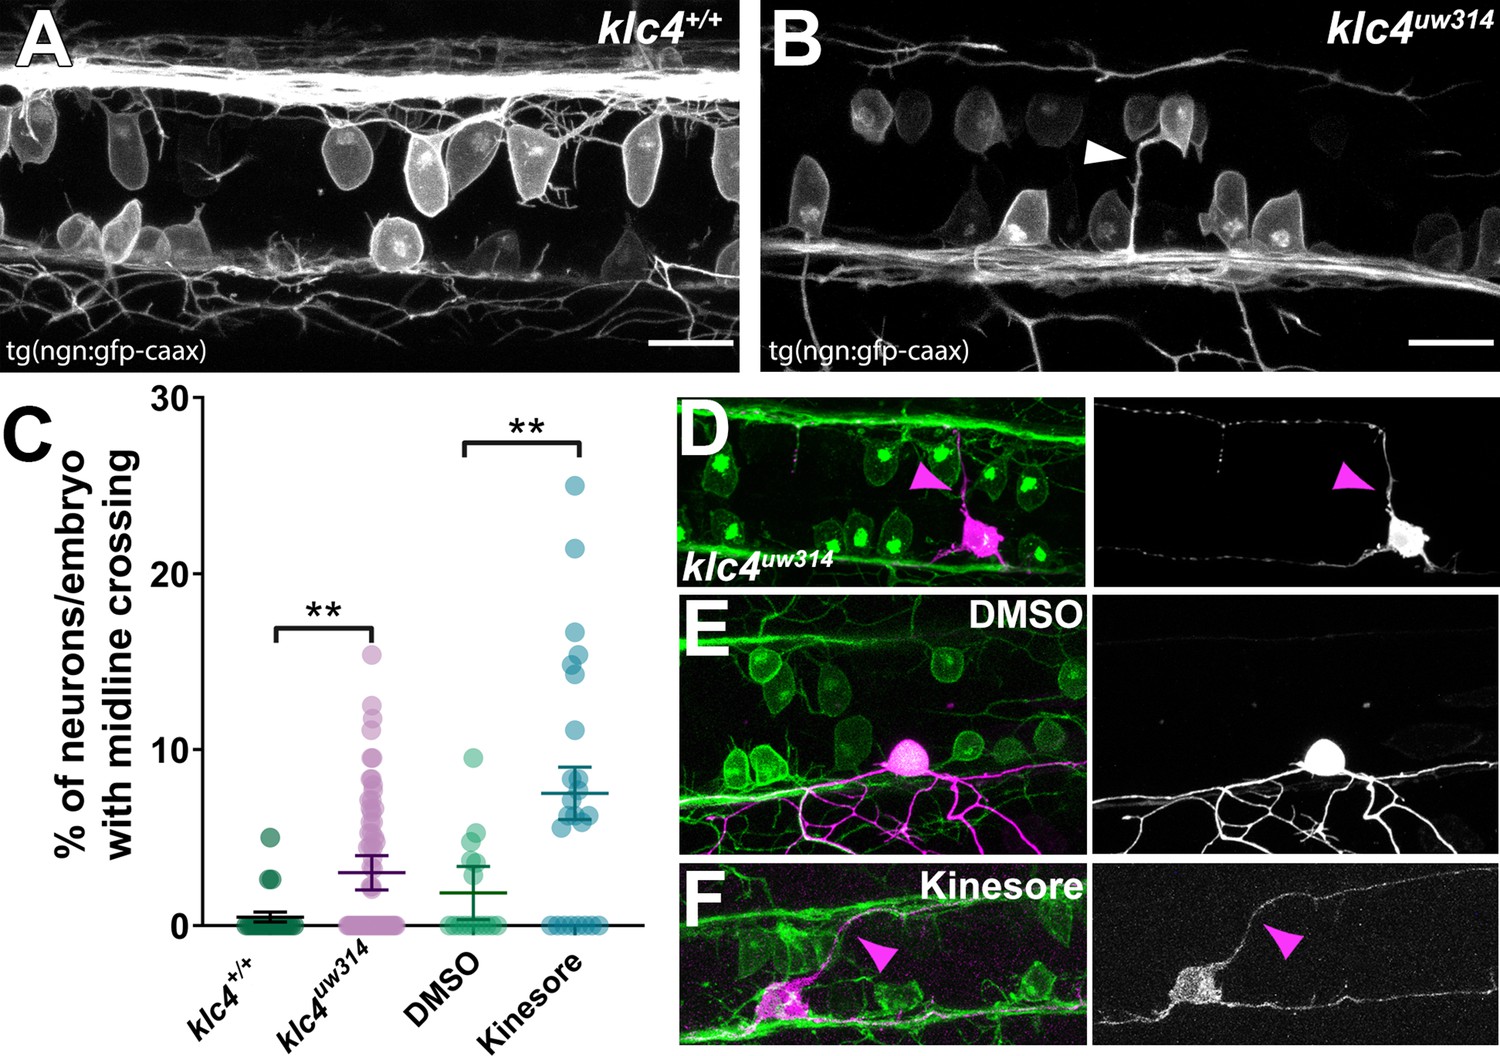
Midline crossing of apical protrusions occurs more frequently when KLC function is disrupted.
(A–B) Confocal projections (dorsal views) of partial z-stacks containing only the optical sections in the plane of the RB cell bodies within the spinal cord in a wild-type Tg(–3.1ngn1:gfp-caax) embryo (A), or a klc4uw314 Tg(–3.1ngn1:gfp-caax) embryo (B), with an apical protrusion from a neuron crossing the midline and reaching the contralateral side (white arrowhead). Scale bars = 20 µm. (C) The percentage of neurons per embryo that had an apical protrusion crossing the midline of the spinal cord was quantified. **p<0.0052, Mann–Whitney test. Mean with SEM displayed over individual data points. Wild type N=608 neurons from 21 embryos, klc4uw314 N=1496 neurons from 47 embryos, 2% DMSO N=429 neurons from 15 embryos, Kinesore N=595 neurons from 21 embryos. (D–F) Mosaic labeling of individual neurons by injection with –3.1ngn1:gfp-caax DNA into klc4uw314 mutants (D), DMSO-treated embryos I or kinesore-treated embryos (F) showing that apical protrusions (magenta arrowheads) can fasciculate onto the contralateral central axon.
-
Figure 7—source data 1
The percentage of neurons per embryo that had an apical protrusion that fully crossed the midline of the spinal cord.
- https://cdn.elifesciences.org/articles/74270/elife-74270-fig7-data1-v2.xlsx
Figure 7—video 1
Light sheet microscopy of an embryo treated with 100µM Kinesore, showing what appear to be apical protrusions crossing the midline of the spinal cord.
This behavior was seen in both Kinesore treated and klc4uw314 mutant embryos. Anterior is to the right.
Figure 7—video 2
High-speed, high-magnification light sheet microscopy of a klc4uw314 mutant embryo showing an apical protrusion growing across the midline with a dynamic tip that shows growth-cone like behavior.
Anterior is to the top right corner.
Figure 7—video 3
A cropped portion of Figure 2—video 1 showing normal behavior of apical protrusions in the spinal cord of a wild-type embryo.
Video has been rotated to show the spinal cord in a more horizontal position. Anterior to the left.
Figure 8 with 2 supplements
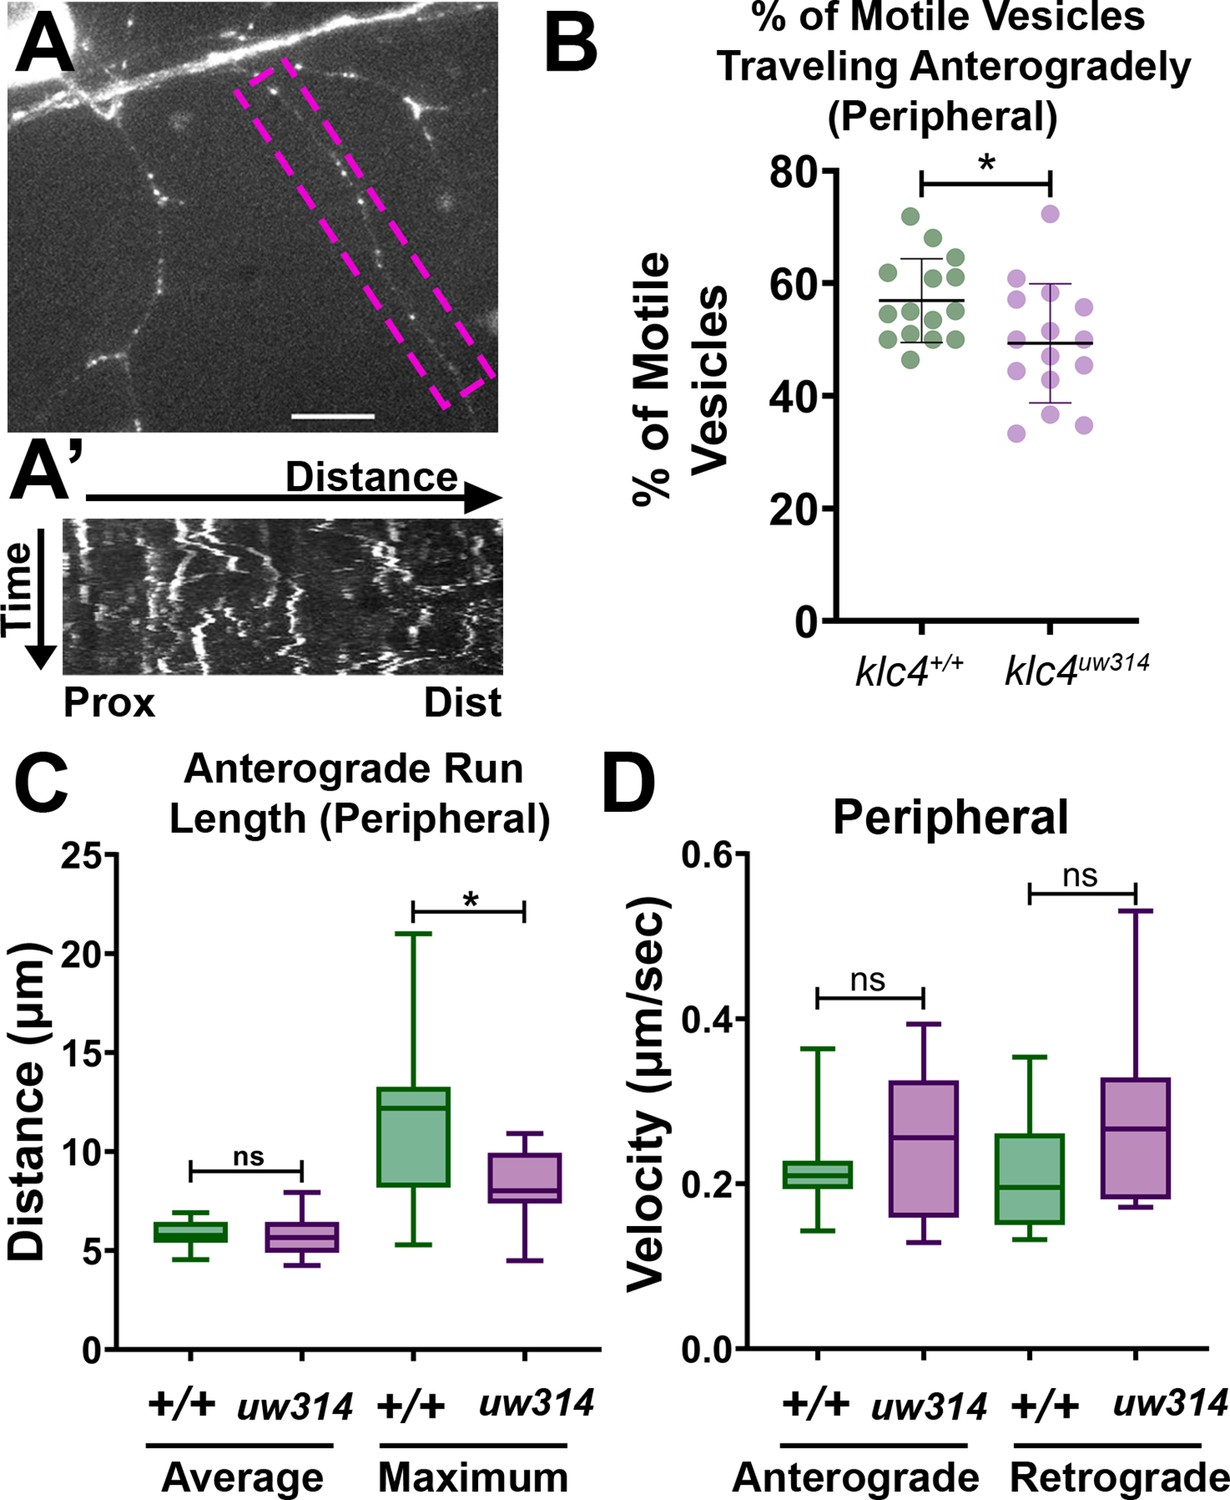
Endosomal trafficking dynamics are disrupted in klc4314 mutants.
(A) Live RB neuron expressing eGFP-Rab5c. Scale bar = 10 μm. (A’) Representative kymograph of axon segment boxed in magenta in (A).(B) Percentage of anterogradely moving vesicles out of all motile Rab5 vesicles in peripheral axons. The proportion of anterogradely moving vesicles is decreased in klc4314 mutants, *p=0.0372 by Mann-Whitney test; error bars = mean with SD. Wild type N=15 embryos, klc4314 N=15 embryos. (C) Average Rab5 vesicle run length and maximum anterograde vesicle run length in peripheral axons. *p=0.0358, ns p=0.5359, Mann-Whitney test. (D) Rab5 vesicle velocity in peripheral axons. NS by Mann-Whitney test (anterograde p=0.6505, retrograde p=0.0792), wild type N=12 embryos, klc4314 N=11 embryos. For all data, one neuron per embryo was analyzed. Error bars in box and whisker plots represent 5-95th percentile.
-
Figure 8—source data 1
The percentage of motile vesicles per cell that were traveling anterogradely in peripheral RB axon branches.
- https://cdn.elifesciences.org/articles/74270/elife-74270-fig8-data1-v2.xlsx
-
Figure 8—source data 2
The distance traveled by Rab5 comets, including both average and maximum run length.
- https://cdn.elifesciences.org/articles/74270/elife-74270-fig8-data2-v2.xlsx
-
Figure 8—source data 3
The measured velocity of Rab5 comets in peripheral axons.
- https://cdn.elifesciences.org/articles/74270/elife-74270-fig8-data3-v2.xlsx
Figure 8—figure supplement 1
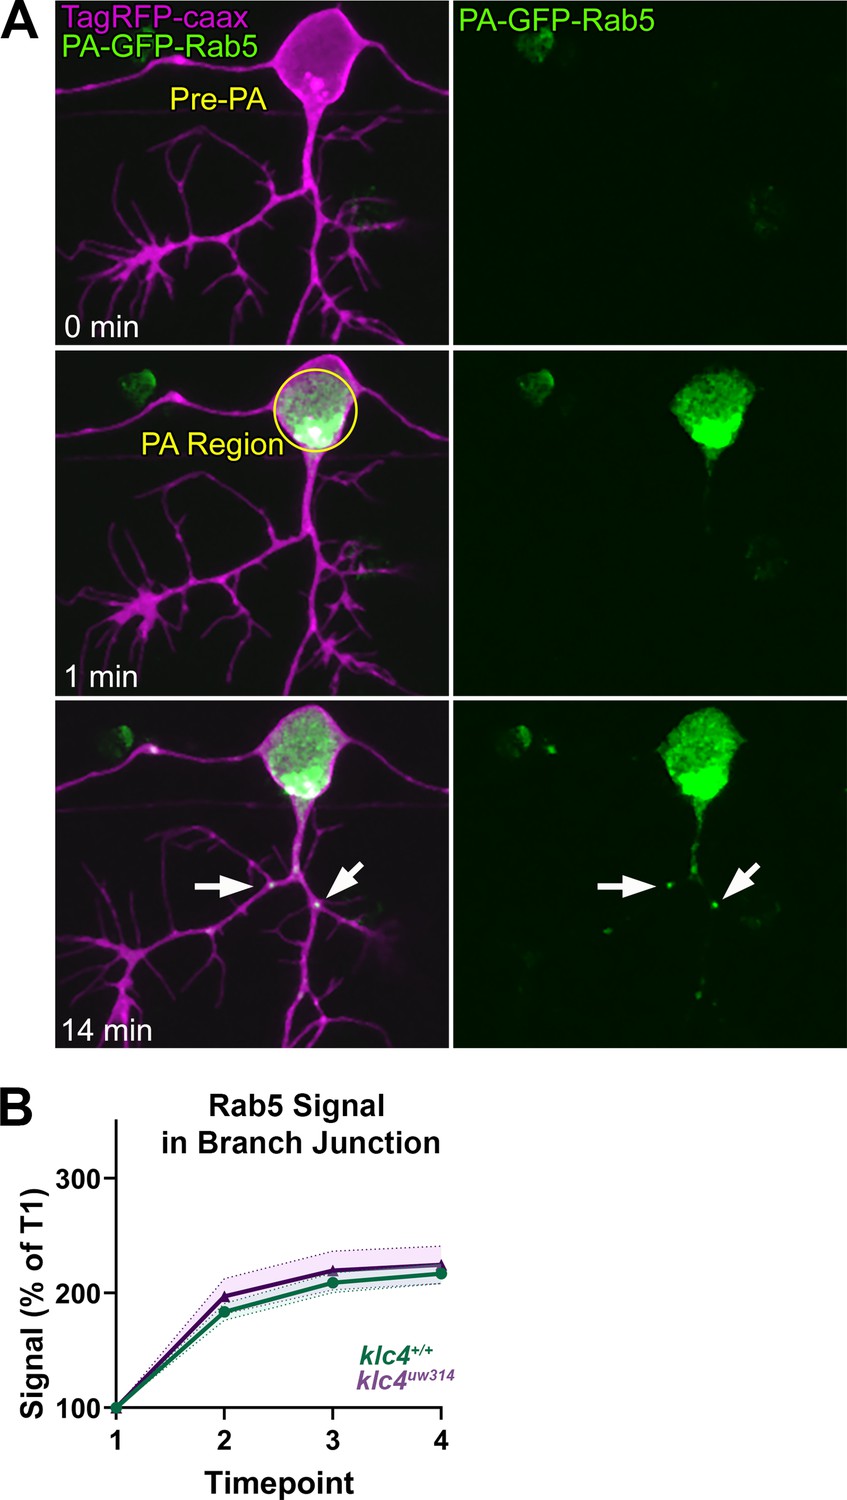
Vesicles labeled with photoactivatable Rab5 accumulate normally at branch points.
(A) Representative image series of PA-GFP-Rab5 photoactivation. A region outlining the cell body is selected and photoactivated using a 405 nm laser (middle panel). Rab5 vesicles can then be visualized moving into the axon and into branch points (lower panel). (B) We quantified the accumulation of Rab5 at branch points by dividing the acquired images into 4 time periods (t1–t4) comprised of 7–8 min intervals and measuring the signal at branch points from maximum intensity projections of each time period (t1–t4). Signal was normalized to the signal at t1. There was no significant difference in the area under the curve between klc4+/+ and klc4uw314 mutants (p=0.1319, t-test, klc4+/+ N = 42 branches from 20 embryos, klc4uw314 N=18 branches from 8 embryos). Error bars = SEM.
Figure 8—video 1
An RB neuron expressing photoactivatable Rab5 (green) and membrane-bound TagRFP (magenta).
Upon photoactivation, vesicles can be seen traveling into the peripheral axons. The second half of the movie shows the maximum intensity projections of time intervals (T1-4) used to analyze vesicle accumulation at branch points. Each time interval represents a maximum intensity projection of 6.5 minutes of time. T0 represents the frame prior to photoactivation.
Figure 9 with 2 supplements
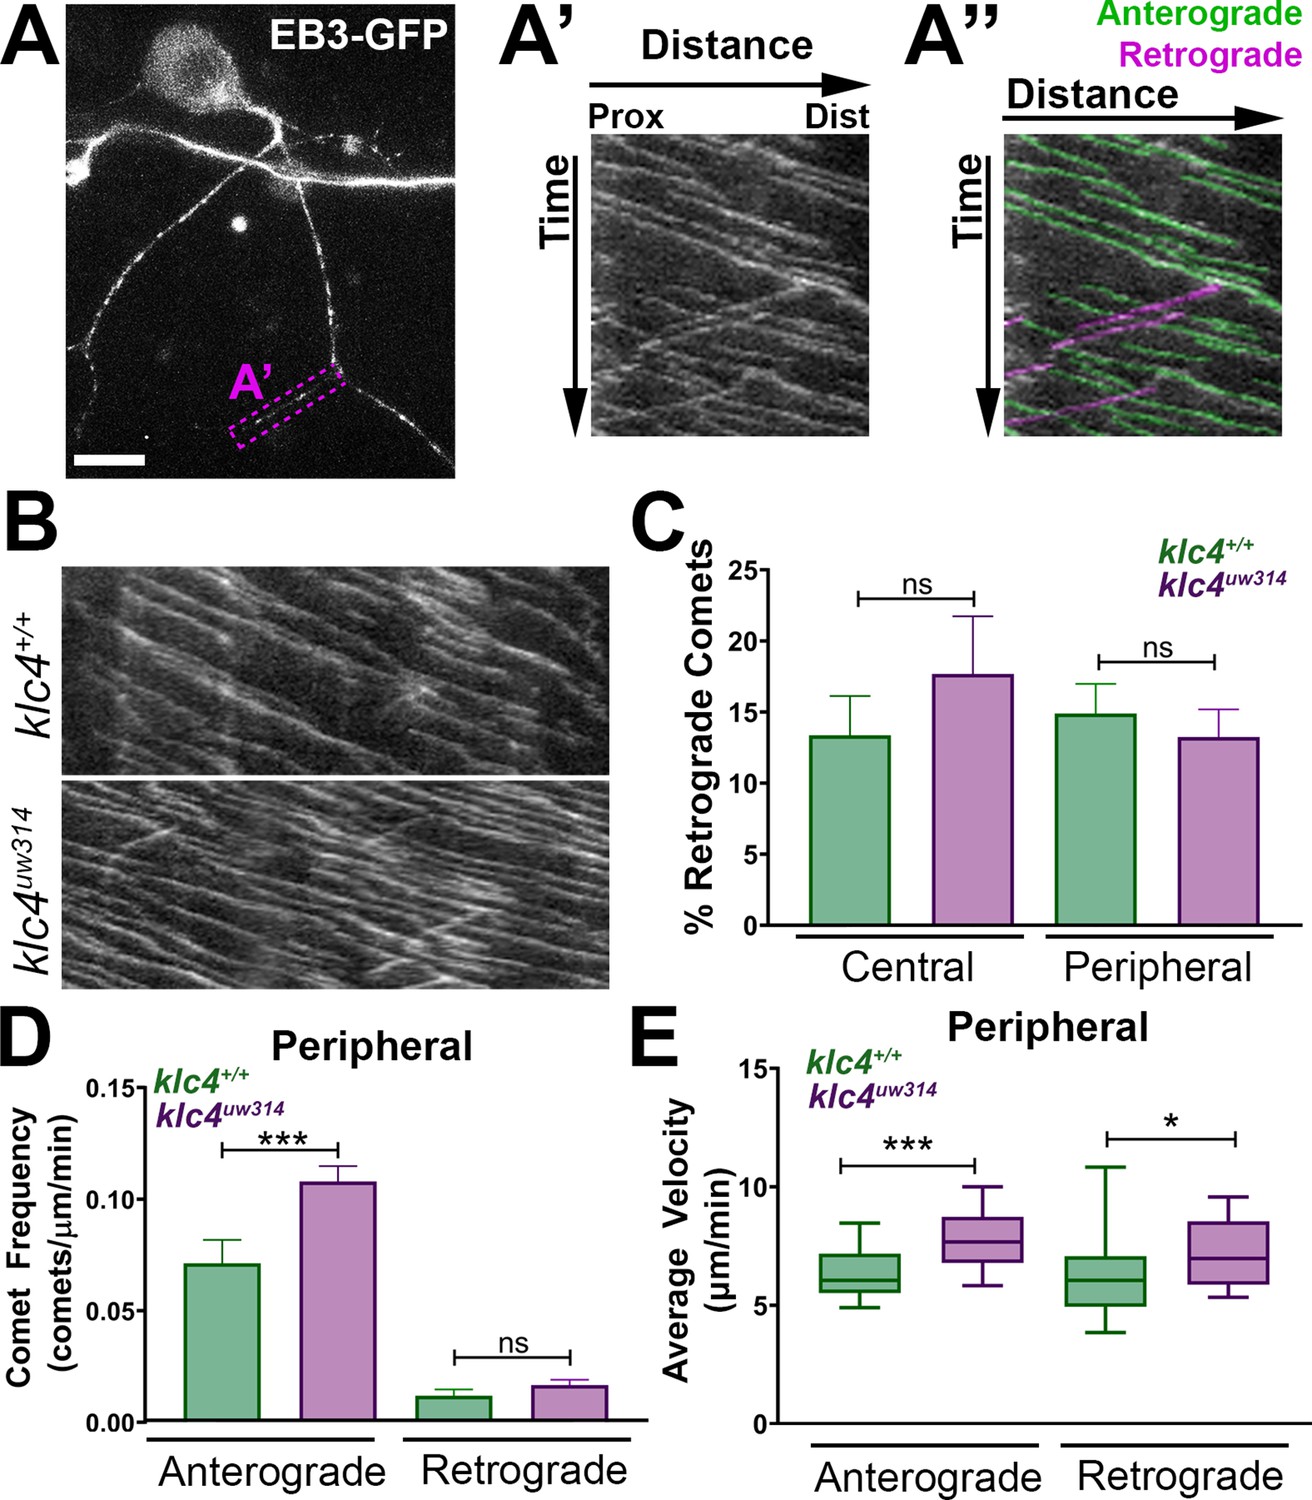
Microtubule dynamics are increased in klc4uw314 mutants.
(A-A”) Live RB neuron expressing EB3-GFP, scale bar = 10 μm. Magenta box in (A) indicates axon segment selected for kymograph in (A’). (A”) EB3 comets identified as anterogradely (green) or retrogradely (magenta) directed based on their angle. (B) Representative kymographs from peripheral axon segments of wildtype (top) or klc4uw314 (bottom). (C) Quantification of the percentage of retrograde comets out of all comets imaged for both peripheral and central axons. NS by Mann-Whitney test. (D) Peripheral axon comet frequency. ***p=0.0003, Mann-Whitney test. (E) Peripheral axon comet velocity. ***p=0.0004, *p=0.042, Mann-Whitney test. For all data, error bars = SEM. Wild type central N=8 segments, klc4uw314 central N=15 segments, Wild type peripheral N=26 segments, klc4uw314 peripheral N=48 segments. Wild type data from 10 neurons in 7 embryos. Klc4uw314 data from 13 neurons in 8 embryos. All comets in a kymograph were measured.
-
Figure 9—source data 1
Source Data 1: All measurements of EB3-GFP comets in wild type and klc4uw314 mutants, averaged per measured segment.
- https://cdn.elifesciences.org/articles/74270/elife-74270-fig9-data1-v2.xlsx
Figure 9—figure supplement 1
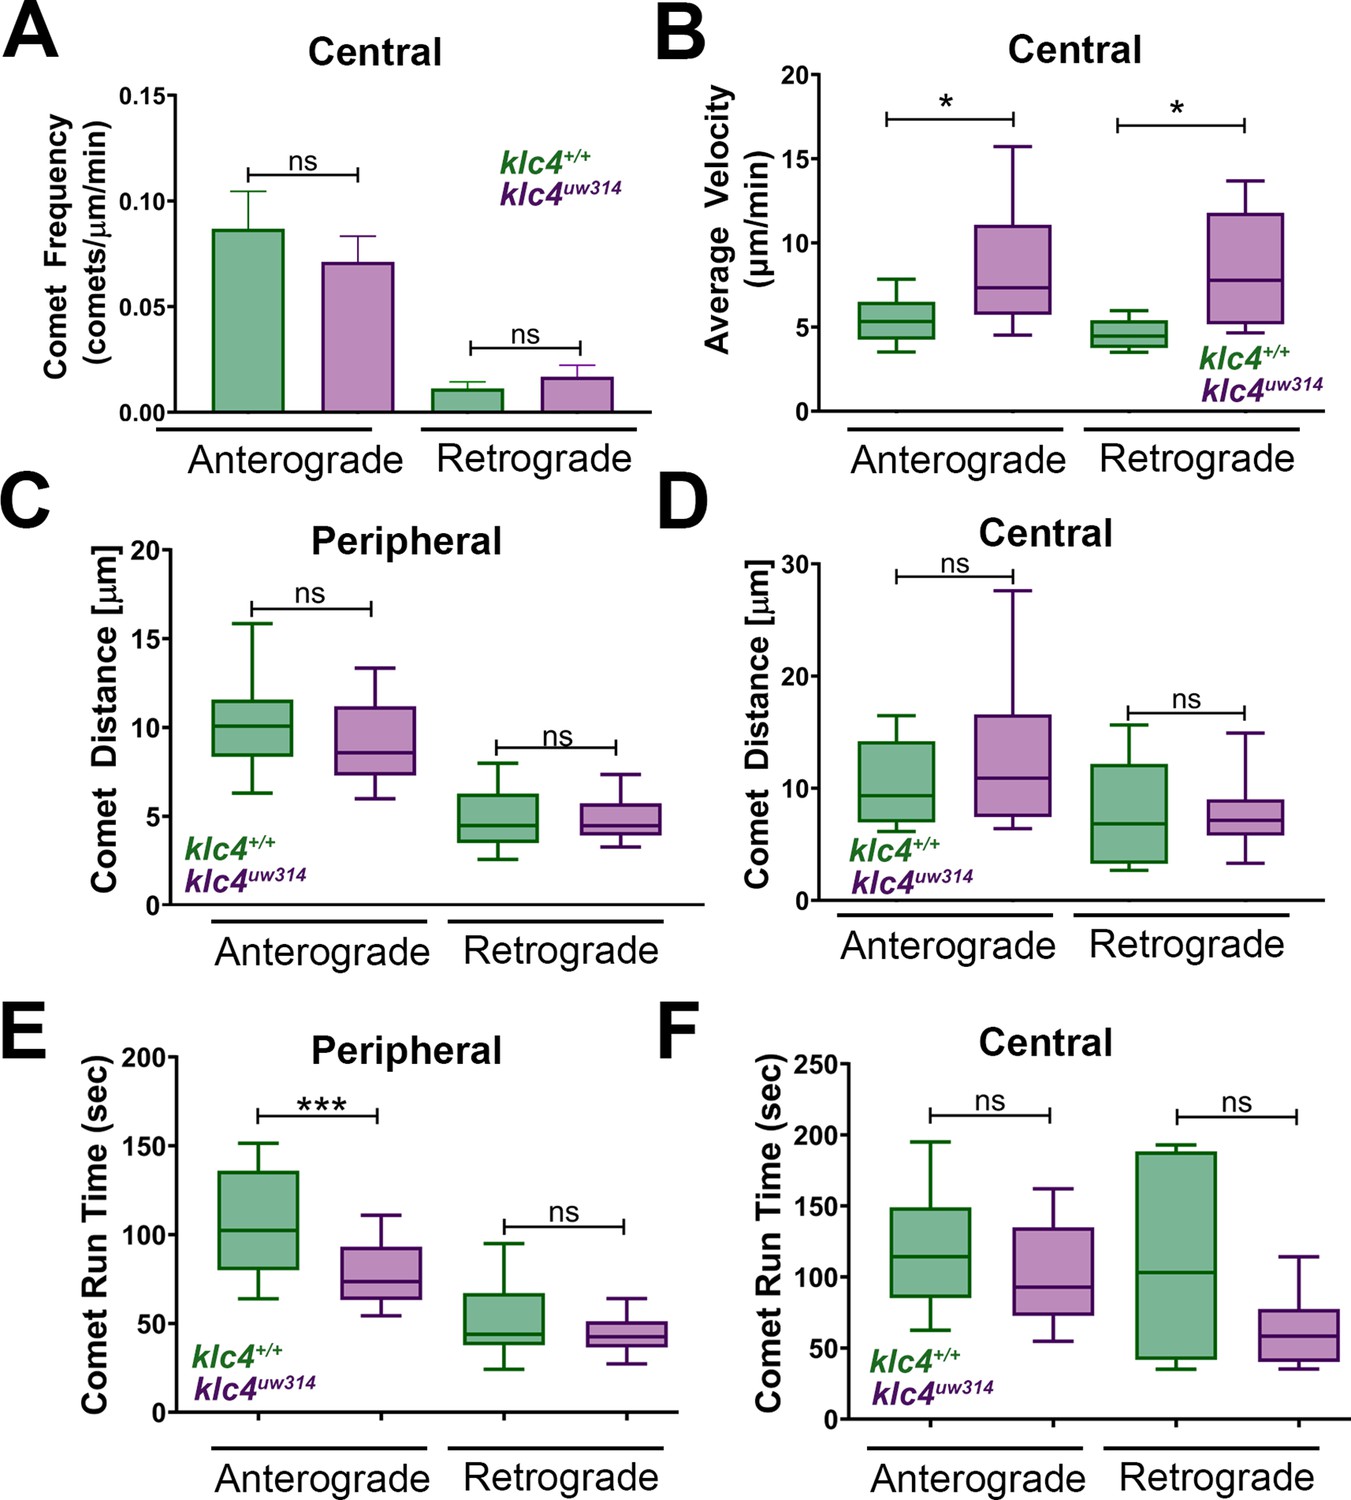
Additional quantification of microtubule dynamics in wild type and klc4 mutant axons.
(A) Central axon comet frequency. NS by Mann-Whitney test. (anterograde p=0.4664, retrograde p=0.7268) (B) Central axon comet velocity. *p<0.05, Mann-Whitney test. (C) Average distance traveled by peripheral axon comets. NS by Mann-Whitney test (anterograde p=0.1476, retrograde p=0.9288) (D) Average distance traveled by central axon comets. NS by Mann-Whitney test (anterograde p=0.3738, retrograde p=0.8836) (E) Average comet run time for peripheral axon comets. NS by Mann-Whitney test (***p=0.0001, NS p=0.1389) (F) Average comet run time for central axon comets. NS by Mann-Whitney test (anterograde p=0.3363, retrograde p=0.3196) For all data, error bars = SEM. Wild type central N=8 segments, klc4uw314 central N=15 segments, Wild type peripheral N=26 segments, klc4uw314 peripheral N=48 segments. Wild type data from 10 neurons in 7 embryos. Klc4uw314 data from 13 neurons in 8 embryos.
Figure 9—video 1
An RB neuron expressing EB3-GFP to tag plus ends of microtubules.
Plus end comets can be seen traveling in a predominantly anterograde direction.
Figure 10
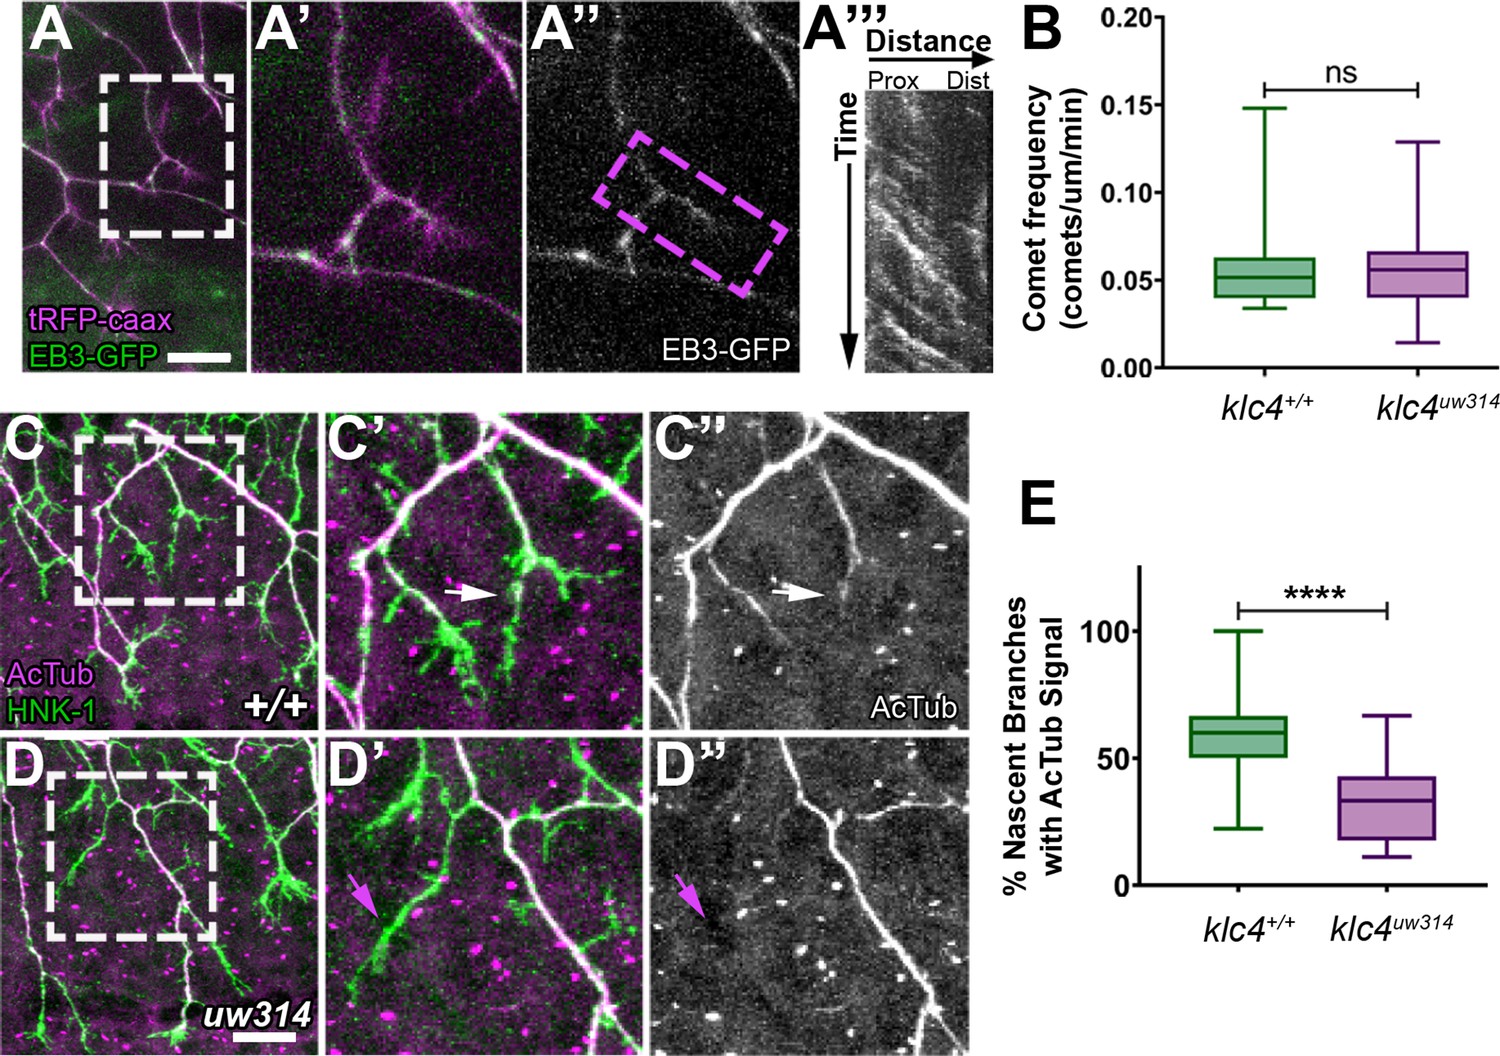
Nascent RB axon branches show reduced microtubule stabilization in klc4uw314 mutants.
(A) Still image of nascent RB branches expressing EB3-GFP in a live wild type embryo at 23hpf. (A’) Zoom in of the branches outlined in white in (A).(A”) EB3-GFP signal in nascent branches in (A’). (A’’’) Representative kymograph generated from nascent branch outlined in magenta in (A’). (B) Quantification of peripheral axon comet frequency. NS by Mann-Whitney test, p=0.8410. Wild type N=22 nascent branches from 9 embryos, klc4uw314 N=25 nascent branches from 8 embryos. (C-D’’) Representative examples of HNK-1 and acetylated tubulin stained embryos at 24hpf. White arrows in (C’-C’’) indicate nascent branches with tubulin acetylation. Magenta arrows in (D’-D’’) indicate nascent branches lacking tubulin acetylation. (E) Percentage of nascent branches containing acetylated tubulin out of all nascent branches. Fewer nascent branches contained acetylated tubulin in klc4uw314 mutants. ****p<0.0001 by Mann-Whitney test. Wild type N=132 nascent branches from 15 embryos, and klc4uw314 N=143 nascent branches from 16 embryos. Scale bars = 20 μm. Error bars in box and whisker plots represent 5-95th percentile.
-
Figure 10—source data 1
Source Data 1: The EB3 comet frequency in nascent axons.
- https://cdn.elifesciences.org/articles/74270/elife-74270-fig10-data1-v2.csv
-
Figure 10—source data 2
The percentage of nascent branches with discernable acetylated tubulin signal out of all nascent branches observed.
- https://cdn.elifesciences.org/articles/74270/elife-74270-fig10-data2-v2.csv
Figure 11 with 1 supplement

Larval and adult klc4uw314 mutants have behavioral defects (A) Example of touch assay administration.
A 3 dpf larva is touched on the tail using a gel loading tip, provoking a swim response. (B) Larval response time was measured starting from beginning of swim to cessation of motion. (C) The number of swim bouts performed by each larva during total post-touch swim time was counted. For B-C, each point represents an individual larva. ***p=0.0005, Mann-Whitney test. Error bars = SEM. Wild type N=45, klc4uw314 N=41. 55 total larva were tested for each genotype, but larva that did not respond were not included in these data. (D) Schematic of the novel tank test design, with upper and lower zones demarcated by the center dotted line. (E) Percentage of fish per experiment that entered the upper zone of the tank during a 3-min exposure to a novel tank. Error bars = SEM. Each point represents one experiment day: wild type N=3 experiments with 30 total fish, klc4uw314 N=3 experiments with 39 total fish. (F) The time it took for individual fish to first cross into the upper zone during a 3-min exposure to a novel tank. Points represent individual fish, error bars = SEM. Wild type N=24, klc4uw314 N=8. Fish that did not cross into the upper zone are not represented in this data. NS by t-test, p=0.7766. (G) The total time fish spent in the upper zone of the novel tank during a 3-min exposure. Points represent individual fish, ***p=0.0002 by t-test, error bars = SEM. Wild type N=30, klc4uw314 N=39. (H) Percentage of fish to freeze per experiment during a 3-min exposure to the novel tank. Error bars = SEM. Each point represents one experiment day: wild type N=3 experiments with 30 total fish, klc4uw314 N=3 experiments with 39 total fish. (I) The total time fish spent frozen during a 3-min exposure to a novel tank. Points represent individual fish, ****p<0.0001 by Mann-Whitney test, error bars = SEM. Wild type N=30, klc4uw314 N=39.
-
Figure 11—source data 1
The length of time each individual larva spent swimming after a touch stimulus (non-responding fish removed from graph).
- https://cdn.elifesciences.org/articles/74270/elife-74270-fig11-data1-v2.csv
-
Figure 11—source data 2
The number of swim bouts performed by each individual larva after a touch stimulus (non-responding fish removed from graph).
- https://cdn.elifesciences.org/articles/74270/elife-74270-fig11-data2-v2.csv
-
Figure 11—source data 3
The average percentage of fish that entered the upper zone of the tank per experimental trial.
- https://cdn.elifesciences.org/articles/74270/elife-74270-fig11-data3-v2.xlsx
-
Figure 11—source data 4
The time it took an individual fish to first cross into the upper zone of the tank.
Only individuals that crossed into the upper zone are represented in this dataset.
- https://cdn.elifesciences.org/articles/74270/elife-74270-fig11-data4-v2.xlsx
-
Figure 11—source data 5
The total time spent by each individual fish in the upper zone throughout the experimental time period.
- https://cdn.elifesciences.org/articles/74270/elife-74270-fig11-data5-v2.xlsx
-
Figure 11—source data 6
The average percentage of fish that performed one or more freezing bouts per experimental trial.
- https://cdn.elifesciences.org/articles/74270/elife-74270-fig11-data6-v2.xlsx
-
Figure 11—source data 7
The total time spent frozen by each individual fish throughout the experimental time period.
- https://cdn.elifesciences.org/articles/74270/elife-74270-fig11-data7-v2.xlsx
Figure 11—figure supplement 1
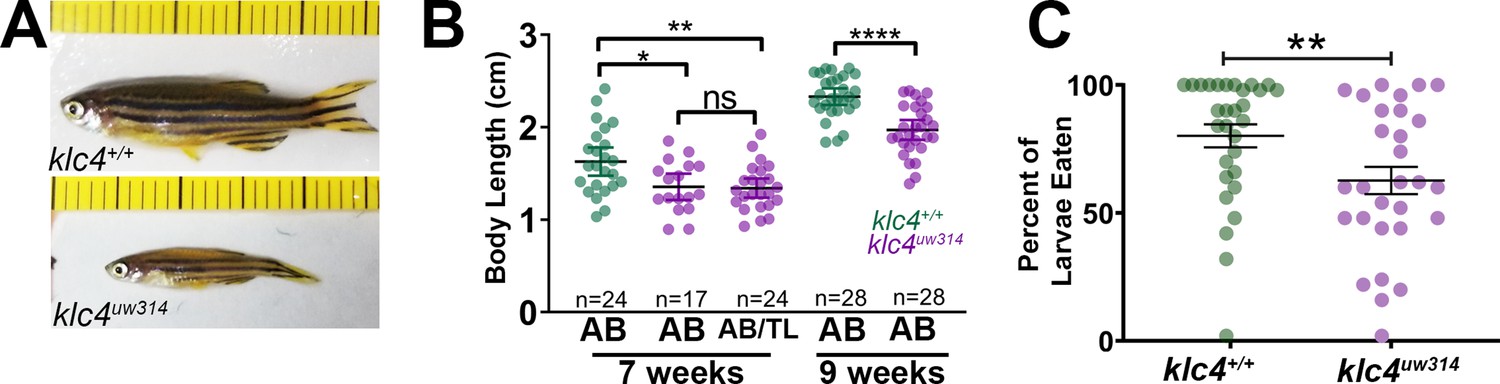
Loss of klc4 results in reduced size and ineffective feeding in adult zebrafish.
(A) Age-matched adult wild type and klc4uw314 mutant fish. Ruler tick marks represent 1 mm. (B) Body length measurements for age matched adult fish at 7 weeks and 9 weeks old. ****p<0.0001, **p=0.0024, *p=0.013, t-test. N is given in figure as individual fish. (C) Percentage of larvae consumed over an hour. **p=0.0090, t-test. Wild type N=31, klc4uw314 N=30.
Figure 12 with 1 supplement

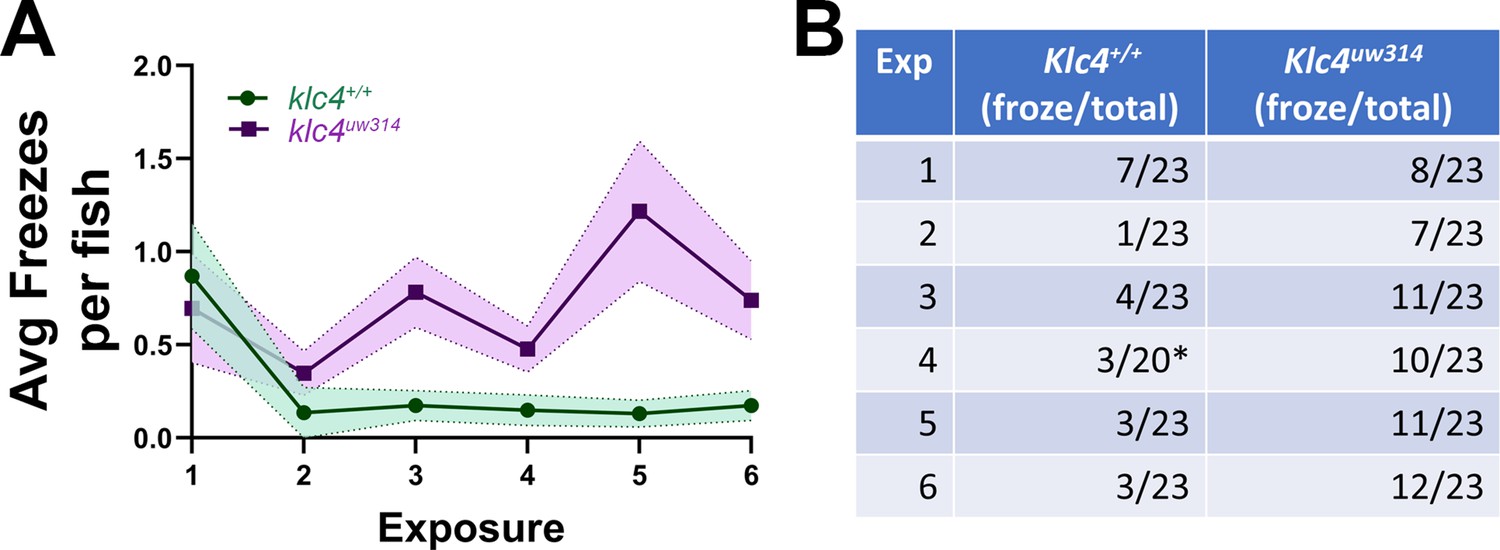
Adult klc4uw314 mutant anxiety-like behavior does not fully habituate after repeat exposure to a novel environment.
(A) Percentage of fish per experiment that froze during the first 3 min of a 10-min initial exposure to a novel tank. (B) Plot of the percentage of fish that froze during the course of six 10-min exposures to the same novel tank. (C) Plot of the average time spent frozen during the course of six 10-min exposures to the same novel tank. (D) Plot of the average total and mobile-only swim velocities of fish during each of six 10-min exposures to the same novel tank. Mobile-only velocity excludes periods of time the fish spent at a velocity of 0 cm/s (frozen). (E) Plot of the percentage of time that fish spent in the upper zone of the tank during the course of six 10-min exposures to the same novel tank. (E) Plot of the average time it took for a fish to first enter the upper zone of the tank during the course of six 10-min exposures to the same novel tank. For all data, N=4 groups per genotype, 23 total fish per genotype. Error bars = SEM. For figures D-F, videos that could not be automatically tracked were omitted (for WT, 6/138, for klc4uw314, 4/138).
-
Figure 12—source data 1
The percentage of fish per group that froze during the first 3 min of exposure 1 of the habituation series.
- https://cdn.elifesciences.org/articles/74270/elife-74270-fig12-data1-v2.csv
-
Figure 12—source data 2
The percentage of fish per group that froze for each exposure in the habituation series.
- https://cdn.elifesciences.org/articles/74270/elife-74270-fig12-data2-v2.xlsx
-
Figure 12—source data 3
The total time spent frozen by each individual fish throughout the experimental time period for each exposure in the habituation series.
- https://cdn.elifesciences.org/articles/74270/elife-74270-fig12-data3-v2.xlsx
-
Figure 12—source data 4
The mobile and total swim velocities for each individual fish throughout the experimental time period for each exposure in the habituation series.
- https://cdn.elifesciences.org/articles/74270/elife-74270-fig12-data4-v2.xlsx
-
Figure 12—source data 5
The percentage of fish per group that entered the upper zone of the tank at least once during each exposure in the habituation series.
- https://cdn.elifesciences.org/articles/74270/elife-74270-fig12-data5-v2.xlsx
-
Figure 12—source data 6
The time in seconds it took each individual fish to initially cross over into the upper zone of the tank for each exposure in the habituation series.
- https://cdn.elifesciences.org/articles/74270/elife-74270-fig12-data6-v2.xlsx
Figure 12—figure supplement 1
Additional data for novel tank habituation experiments.
(A) The average number of freezing bouts per fish over the course of 6 exposures. (B) The number of fish that froze out of the total number of fish in the experiment. * indicates data for 3 fish lost from one exposure due to video equipment malfunction. These data could not be generated again since fish had already been exposed to the tank, so the group N for this exposure is 20 instead of 23.
Tables
Key resources table
| Reagent type (species) or resource | Designation | Source or reference | Identifiers | Additional information |
|---|---|---|---|---|
| Gene (Danio rerio) | klc4 | Ensembl | ENSDARG00000086985 | |
| Strain, strain background (Danio rerio) | AB | ZIRC | ZL1 | Wildtype Strain of Zebrafish |
| Strain, strain background (Danio rerio) | TL | ZIRC | ZL86 | Wildtype Strain of Zebrafish |
| Genetic reagent (Danio rerio) | Tg(–3.1ngn1:gfp-caax) | Andersen et al., 2011 | Tg(ngn:gfp-caax) | Transgenic line labelling sensory axons, AB/TL background |
| Recombinant DNA reagent | 3.1ngn1:trfp-caax | Andersen et al., 2011 | Tg(ngn:trfp-caax) | Plasmid for labelling sensory axons |
| Recombinant DNA reagent | 3.1ngn1-mcherry-caax | Andersen et al., 2011 | Tg(ngn:mcherry-caax) | Plasmid for labelling sensory axons |
| Recombinant DNA reagent | 3.1ngn1:eb3-caax | Stepanova et al., 2003; Ponomareva et al., 2014 | Tg(ngn:eb3-gfp) | Plasmid for labelling microtubule plus ends |
| Recombinant DNA reagent | 3.1ngn1:GFP-rab5c | Clark et al., 2011; Ponomareva et al., 2014 | Tg(ngn:GFP-rab5c) | Plasmid for labelling Rab5c vesicles |
| Recombinant DNA reagent | 3.1ngn1:PA-gfp-Rab5c | Ponomareva et al., 2014 | Tg(ngn:PA-gfp-Rab5c) | Plasmid for labelling Rab5c vesicles |
| Sequence-based reagent | klc4 in situ probe | This paper | Sequences listed in methods | |
| Sequence-based reagent | klc4 long isoform specific in situ probe | This paper | Sequences listed in methods | |
| Sequence-based reagent | short isoform RT primers | This paper | Sequences listed in methods | |
| Sequence-based reagent | long isoform RT primers | This paper | Sequences listed in methods | |
| Sequence-based reagent | klc4 gRNA | This paper | Sequence listed in methods | |
| Peptide, recombinant protein | Cas9 protein with NLS | PNA Bio | NC0789474 | |
| Chemical compound, drug | Trizol | Thermo-Fisher | 15596026 | For RNA extraction |
| Chemical compound, drug | Kinesore | Chembridge Hit2Lead library | #6233307 | Kinesin1 targeting small molecule |
| Commercial assay or kit | Superscript III | Invitrogen | 18080093 | |
| Commercial assay or kit | DIG RNA labelling kit | Roche | 11175025910 | |
| Chemical compound, drug | Oligo dT | Invitrogen | 18418020 | |
| Chemical compound, drug | Random Hexamers | Invitrogen | N8080127 | |
| Antibody | anti-HNK1 (mouse monoclonal) | ZIRC | ZN-12 | IF(1:250) |
| Antibody | anti-acetylated tubulin (Mouse monoclonal) | Sigma | T6793 | IF(1:1000) |
| Antibody | anti-mouse IgG AlexaFluor 488 (goat polyclonal) | Invitrogen | A-21121 | IF(1:1000) |
| Antibody | Goat anti-mouse IgG2b AlexaFluor 647 (goat polyclonal) | Invitrogen | A-21141 | IF(1:1000) |
| Software, algorithm | CRISPRscan | Moreno-Mateos et al., 2015 | https://www.crisprscan.org/ | |
| Software, algorithm | CRISP-ID | Dehairs et al., 2016 | http://crispid.gbiomed.kuleuven.be/ | |
| Software, algorithm | ToxTrac | Rodriguez et al., 2018 | Animal Tracking Freeware | |
| Software, algorithm | OrientationJ | Rezakhaniha et al., 2011 | Used to quantify orientation of axons | |
| Software, algorithm | Graphpad Prism | Graphpad | Graph making software | |
| Software, algorithm | Chemotaxis Tool | Ibidi | https://ibidi.com/chemotaxis-analysis/171-chemotaxis-and-migration-tool.html |
Additional files
Download links
A two-part list of links to download the article, or parts of the article, in various formats.
Downloads (link to download the article as PDF)
Open citations (links to open the citations from this article in various online reference manager services)
Cite this article (links to download the citations from this article in formats compatible with various reference manager tools)
KLC4 shapes axon arbors during development and mediates adult behavior
eLife 11:e74270.
https://doi.org/10.7554/eLife.74270


