Robust T cell activation requires an eIF3-driven burst in T cell receptor translation
- Department of Molecular and Cell Biology, University of California-Berkeley, United States
- The J. David Gladstone Institutes, United States
- School of Optometry, University of California, Berkeley, United States
- Department of Microbiology and Immunology, University of California, San Francisco, United States
- Gladstone-UCSF Institute of Genomic Immunology, United States
- Diabetes Center, University of California, San Francisco, United States
- Chan Zuckerberg Biohub, United States
- Department of Medicine, University of California, San Francisco, United States
- Parker Institute for Cancer Immunotherapy, United States
- Innovative Genomics Institute, University of California, Berkeley, United States
- California Institute for Quantitative Biosciences, University of California, Berkeley, United States
- Department of Chemistry, University of California-Berkeley, United States
- Molecular Biophysics and Integrated Bioimaging Division, Lawrence Berkeley National Laboratory, United States
Figures
Figure 1 with 2 supplements
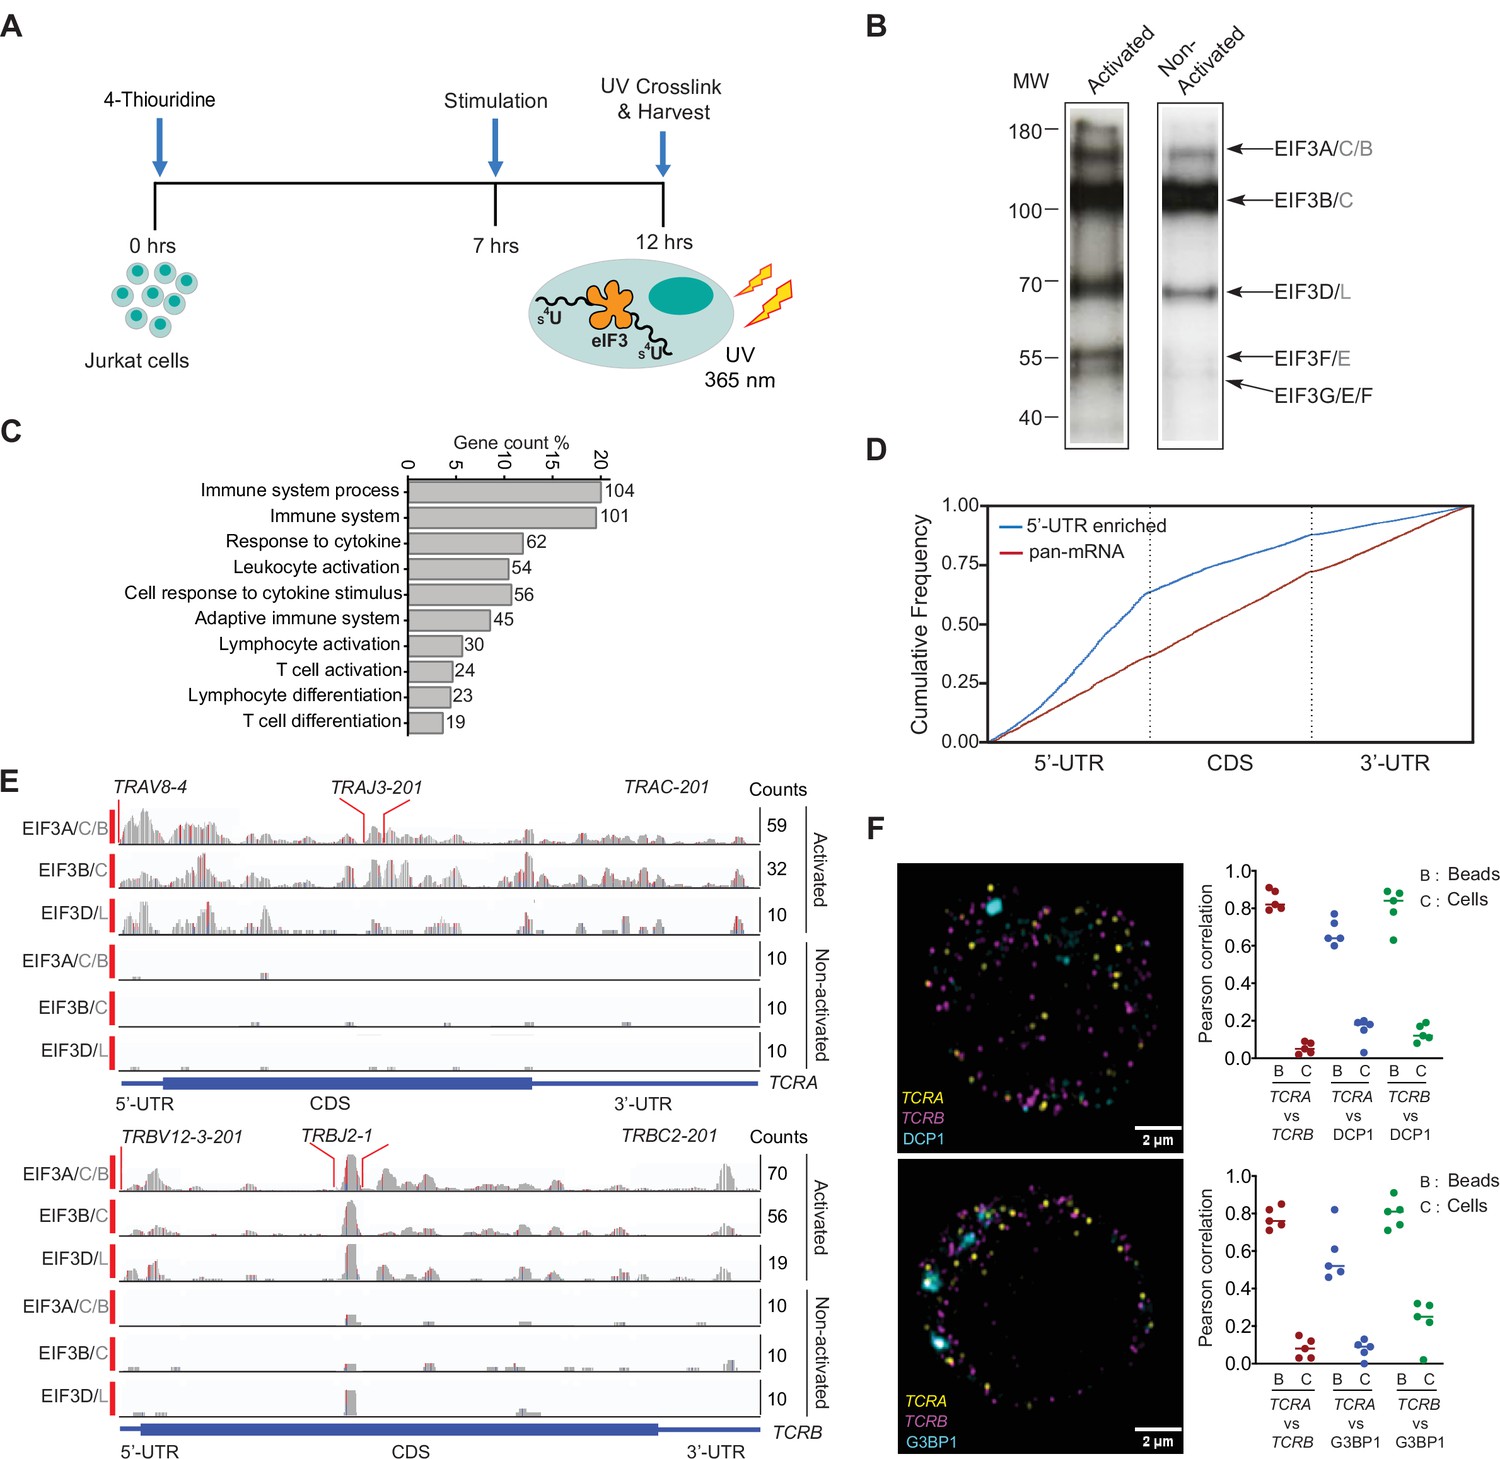
eIF3 interacts with specific mRNAs related to immune function in activated Jurkat cells.
(A) Schematic of the PAR-CLIP experiment in Jurkat cells, showing steps through cell harvesting. (B) Phosphorimage of SDS polyacrylamide gel resolving 5′ 32P-labeled RNAs crosslinked to eIF3 subunits in activated and non-activated Jurkat cells, from one of two biological replicates. (C) Pathway enrichment categories determined using the STRING Database for both biological replicates of the EIF3A/C/B PAR-CLIP libraries (mRNAs with ≥ 100 reads). Number of genes in each pathway whose mRNAs crosslinked to eIF3 is shown next to each bar. Note that the categories reported by the STRING Database are not disjoint sets. (D) Varied mRNA crosslinking patterns to eIF3 in activated Jurkat cells. Cumulative plot showing mRNA crosslinking in sample EIF3A/C/B to predominantly the 5’-UTR (n = 396, 414 mRNAs in replicates 1 and 2, respectively), and across the entire length of some mRNAs (‘pan-mRNAs’, n = 634, 621 mRNAs). The 5’-UTR, CDS, and 3’-UTR regions are shown normalized by length. (E) Crosslinking of the eIF3 subunits as indicated across the entire TCRA and TCRB mRNAs, in activated and non-activated Jurkat cells. 5’-UTR, coding sequence (CDS), and 3’-UTR elements (below) along with the variable (V), joining (J) and constant (C) regions (above) for the mapped TCR genes in Jurkat cells are shown. The blue and red vertical lines in the plotted reads indicate the amount of T-C transitions vs other mutations, respectively for a particular nucleotide. The TCRA and TCRB mRNAs are present in both non-activated and activated Jurkat cells (Supplementary file 4). (F) FISH analysis of TCRA and TCRB mRNAs (yellow and magenta, respectively) and P bodies (top) marked by the location of DCP1 (cyan) and stress granules (bottom) marked by the location of G3BP1 (cyan), in activated Jurkat cells. Graphs to the right of the images indicate Pearson’s correlation coefficients (PCCs) of TCRA and TCRB mRNAs localizing with each other or with P bodies or stress granules. TetraSpeck microsphere beads were used as a positive control for colocalization. Labels on the x axis are, B: TetraSpeck microsphere beads, C: activated Jurkat cells. (n = 5, p < 0.008, for PCC values of cells relative to bead colocalization, across all the channels tested, using the Wilcoxon rank-sum test). Images are representative of one experiment of the five independent experiments in the graphs.
Figure 1—figure supplement 1
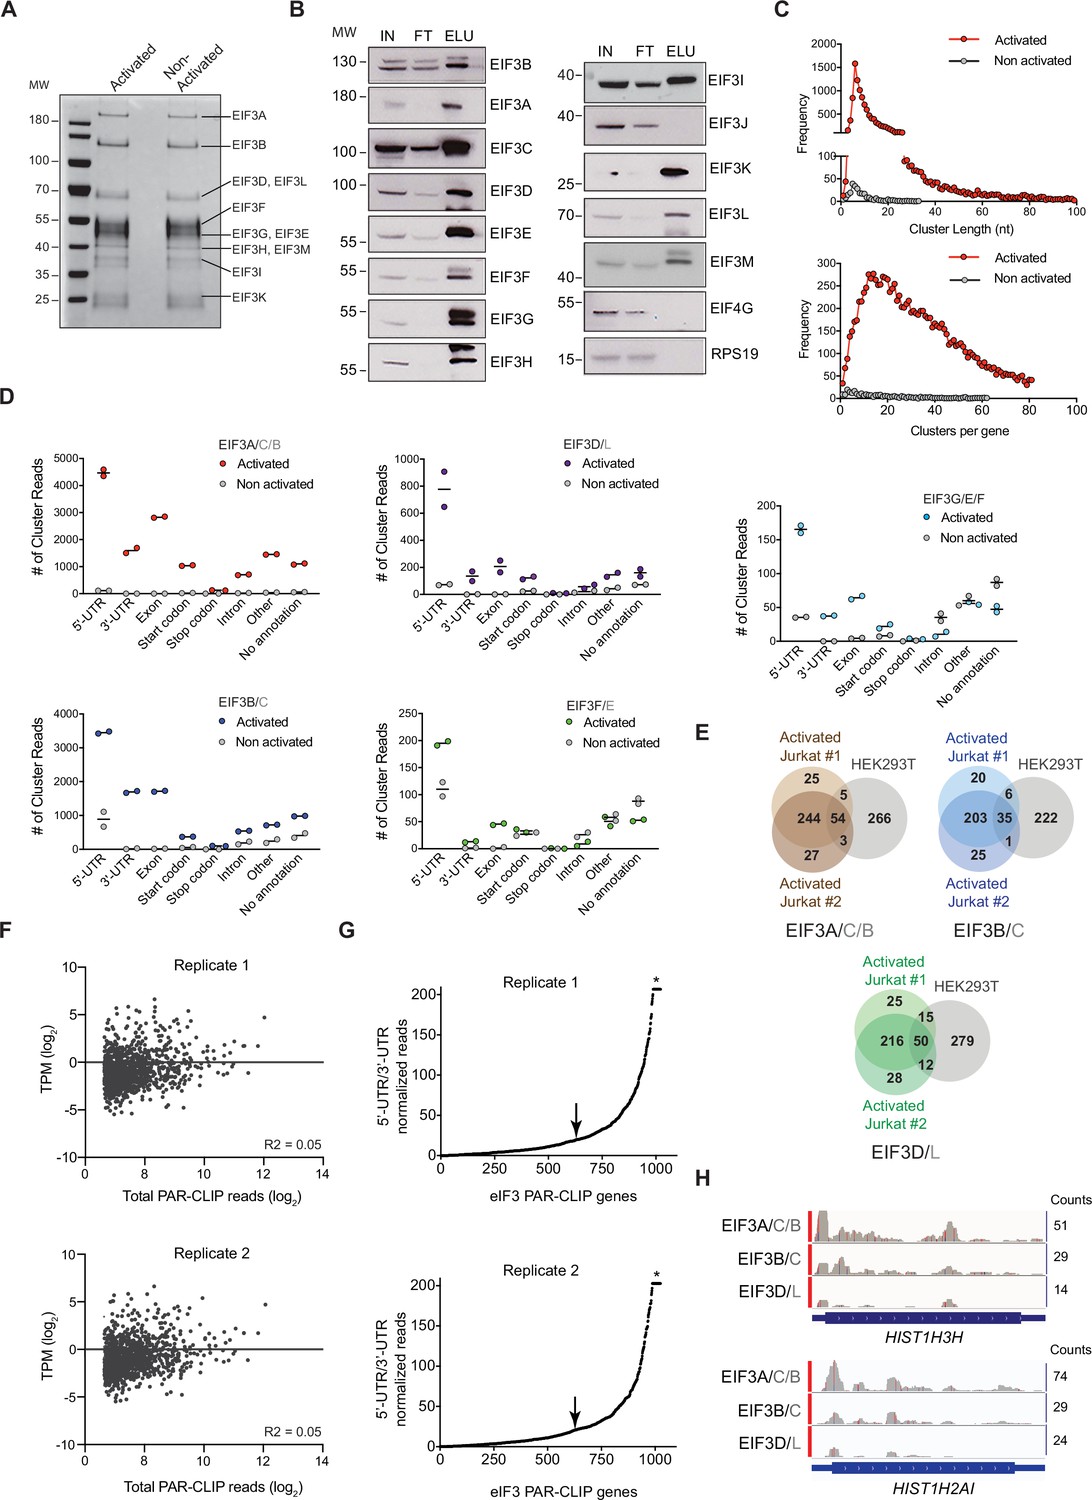
eIF3 PAR-CLIP experiments in activated and non-activated Jurkat cells.
(A) Composition of eIF3 in I + PMA activated and non-activated Jurkat cells after anti-EIF3B immunoprecipitation (IP), identified by mass spectrometry. Shown is an SDS polyacrylamide gel stained with Coomassie Brilliant Blue. (B) Composition of eIF3 in activated Jurkat cells determined by western blot after anti-EIF3B IP. IN: input; FT: flow-through from anti-EIF3B IP beads; ELU: elution of eIF3 from anti-EIF3B IP beads. Anti-EIF4G1 and anti-RPS19 western blots confirm the stringency of bead wash steps (Lee et al., 2015). (C) (Top) The length distribution of PAR-CLIP clusters mapped to RNAs crosslinked to eIF3 in the EIF3A/C/B samples, from activated (red) and non-activated (gray) Jurkat cells. (Bottom) The frequency distribution of the number of eIF3 PAR-CLIP clusters mapped to RNAs in the EIF3A/C/B samples, from activated (red) and non-activated (gray) Jurkat cells. In all panels, the distributions are the average of both biological replicates. RNA PAR-CLIP properties observed in the EIF3A/C/B sample are representative of those seen in PAR-CLIP sequence reads of RNAs crosslinked to other eIF3 subunits. (D) Categories of RNA crosslinked to eIF3, defined by clusters and divided into RNA categories, in I + PMA activated Jurkat cells and non-activated Jurkat cells (grey). In all panels, RNA categories include: 5’-UTR, 5’-UTR of mRNA; 3’-UTR, 3’-UTR of mRNA; CDS, protein coding region of mRNA; Start codon, beginning of mRNA CDS; Stop codon, stop codon region of mRNA; Intron, regions of pre-mRNA; Other, other classes of RNA; No annotation, reads that map to the human genome but that have no annotation assigned. A given mRNA may give rise to clusters in different mRNA categories. Panels C and D show representative results from one of two biological replicates. (E) Venn diagram of genes identified by eIF3 PAR-CLIP in activated Jurkat cells from two biological replicates, compared with the eIF3 PAR-CLIP mRNAs previously identified in HEK293T cells. The same number of mRNAs from the Jurkat cell PAR-CLIP libraries, ranked by total reads mapped to a given gene, are compared to the number of mRNAs identified in the HEK293T PAR-CLIP experiments. (F) Scatterplot of TPM of mRNAs expressed in activated Jurkat cells (most abundant isoform, see Methods) versus mRNAs identified by PAR-CLIP as crosslinked to eIF3 in the EIF3A/C/B samples, with ≥100 total read counts. n = 1029 and 1035 for PAR-CLIP hit genes plotted for replicates 1 and 2, respectively. The R-squared goodness of fit to a linear equation is shown. (G) mRNAs sorted by increasing value of the ratio of normalized 5’-UTR reads to normalized 3’-UTR reads in the EIF3A/C/B samples. Values of the ratio of 5’-UTR/3’-UTR normalized reads >200 have been truncated to a value of 200 in the plot (asterisk). The arrow indicates the threshold used to create cumulative plots shown in Figure 1D. (H) Examples of eIF3 crosslinking to histone mRNAs HIST1H2AI and HIST1H3H in activated Jurkat cells are shown. Transcription start sites were determined from the FANTOM5 Database (Noguchi et al., 2017).
Figure 1—figure supplement 2

The TCRA and TCRB mRNAs do not colocalize with P bodies and stress granules in activated T cells.
(A) (right panel) Single optical section of TetraSpeck microspheres (0.1 µm) adjacent to a Jurkat cell probed for P bodies. Scatter plots of pixel intensities in different emission channels are shown: channel 1, 670 nm; channel 2, 570 nm; channel 3, 488 nm. (left panel) Single optical section of a Jurkat cell probed for TCRA mRNA (channel 1), TCRB mRNA (channel 2), and DCP1 to mark P bodies (channel 3). (middle panels) Scatter plots showing: channel 1 vs. channel 2, channel 1 vs. channel 3, and channel 2 vs. channel 3. (B) (right panel) Single optical section and scatter plots for TetraSpeck microspheres as in A, but adjacent to a Jurkat cell probed for stress granules. (left panel) Single plane image of a Jurkat cell probed for TCRA mRNA (channel 1), TCRB mRNA (channel 2), and G3BP1 to mark stress granules (channel 3). (middle panels) Scatter plots as in A. Images of each cell are representative of those used in the analysis in Figure 1F.
Figure 2 with 1 supplement
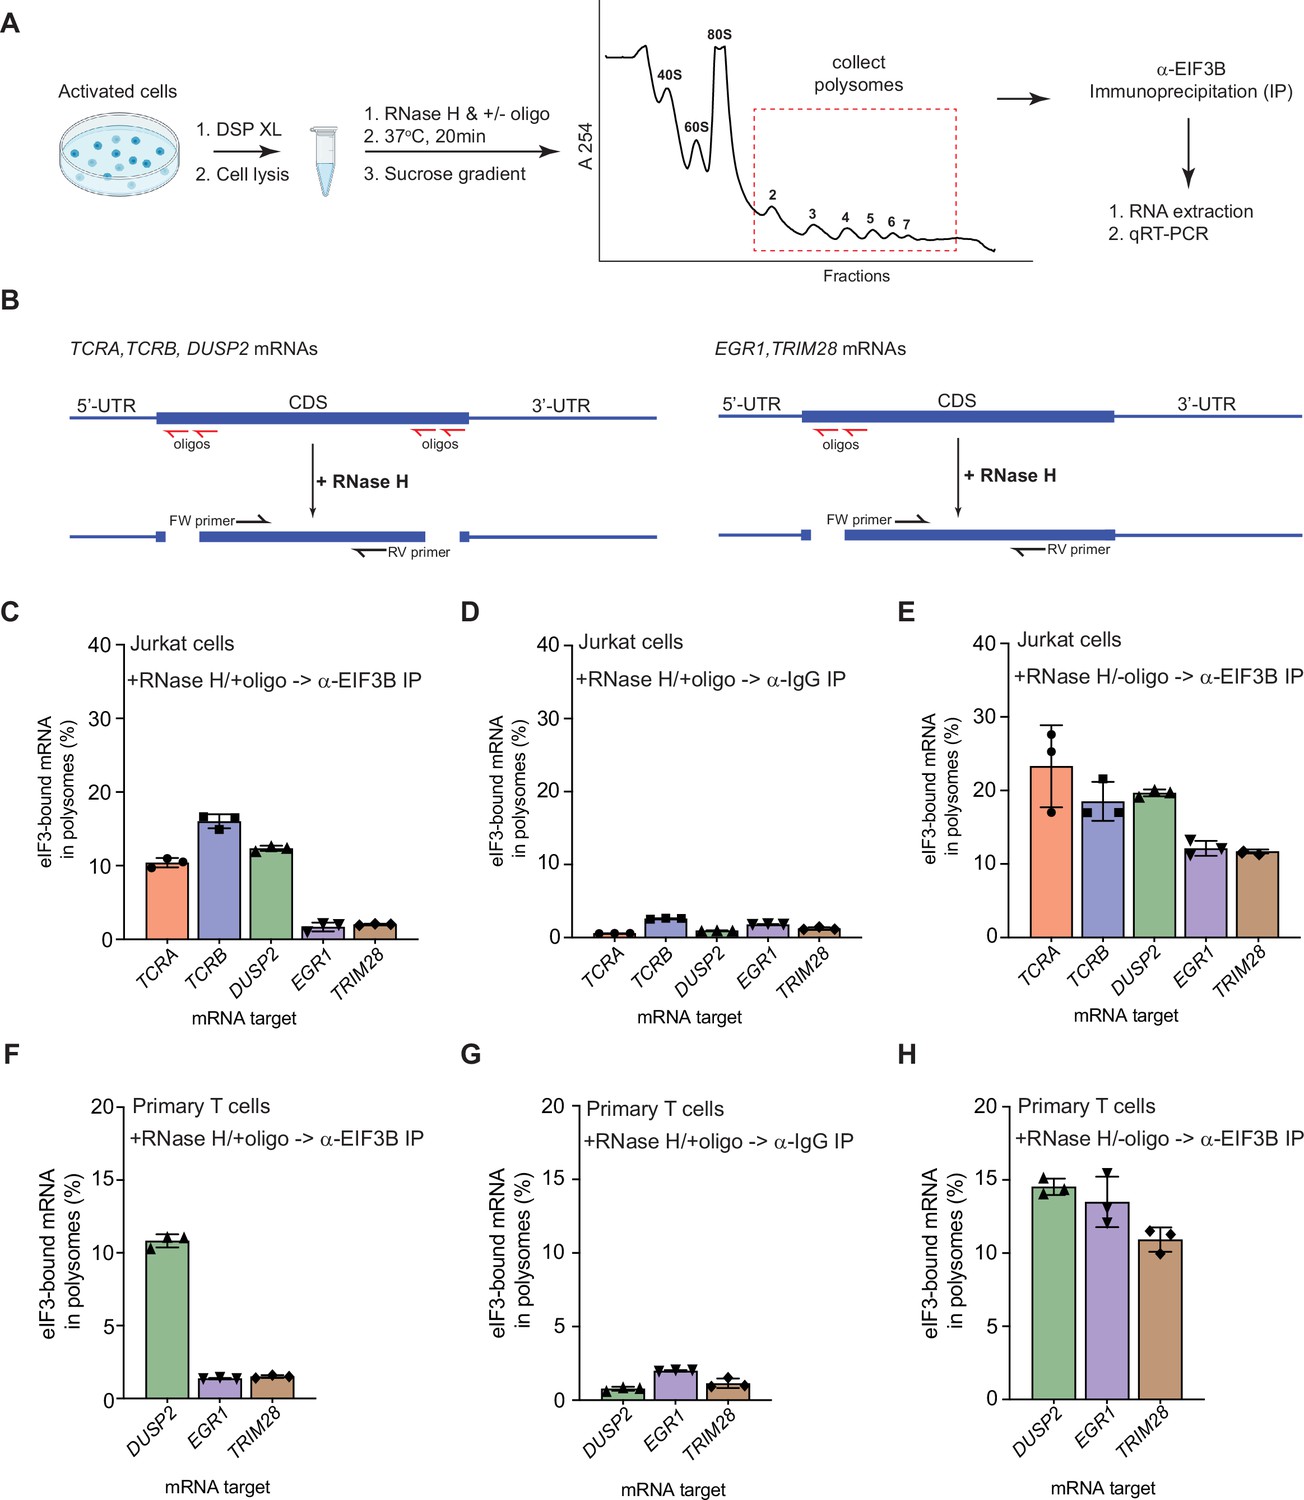
eIF3 remains bound to the coding sequences (CDS) of pan-mRNAs independent of their 5’-UTR and 3’-UTR elements in actively translating ribosomes.
(A) Schematic outlining the RNase H-based assay of eIF3 interactions with mRNAs in polysomes. DSP refers to the dithiobis (succinimidyl propionate) crosslinking agent. Oligos, DNA oligos designed for RNase H-mediated targeting and cleavage of specific mRNAs. (B) Strategy for detecting mRNA fragments released by RNase H digestion. Red arrows denote DNA oligos for RNase H-mediated targeting of mRNAs. RT-qPCR primers (black) were used to detect the CDS regions of the mRNAs. (C) Amount of eIF3-bound mRNA co-immunoprecipitated by an anti-EIF3B antibody (Lee et al., 2015), from polysome fractions of Jurkat cells treated with RNase H and oligos targeting the CDS-UTR junctions (red arrows diagrammed in panel B). (D) Amount of eIF3-bound mRNA co-immunoprecipitated with IgG beads, from polysome fractions of Jurkat cell lysate treated with RNase H and oligos targeting the CDS-UTR junctions. (E) Amount of eIF3-bound mRNA co-immunoprecipitated by the anti-EIF3B antibody, from polysome fractions of Jurkat cell lysate treated only with RNase H. (F) Amount of eIF3-bound mRNA co-immunoprecipitated by an anti-EIF3B antibody, from polysome fractions of primary human T cells treated with RNase H and oligos targeting the CDS-UTR junctions (red arrows diagrammed in panel B). (G) Amount of eIF3-bound mRNA co-immunoprecipitated with IgG beads, from polysome fractions of primary human T cell lysate treated with RNase H and oligos targeting the CDS-UTR junctions. (H) Amount of eIF3-bound mRNA co-immunoprecipitated by the anti-EIF3B antibody, from polysome fractions of primary human T cell lysate treated only with RNase H. In panels C–H, the percentage is relative to the amount of total mRNA present in the polysome fraction prior to immunoprecipitation. All the immunoprecipitation experiments in panels C–H were carried out in biological duplicate with one technical triplicate shown (n = 3, with mean and standard deviations shown). The primary human T cell experiment was done using two donors.
Figure 2—figure supplement 1
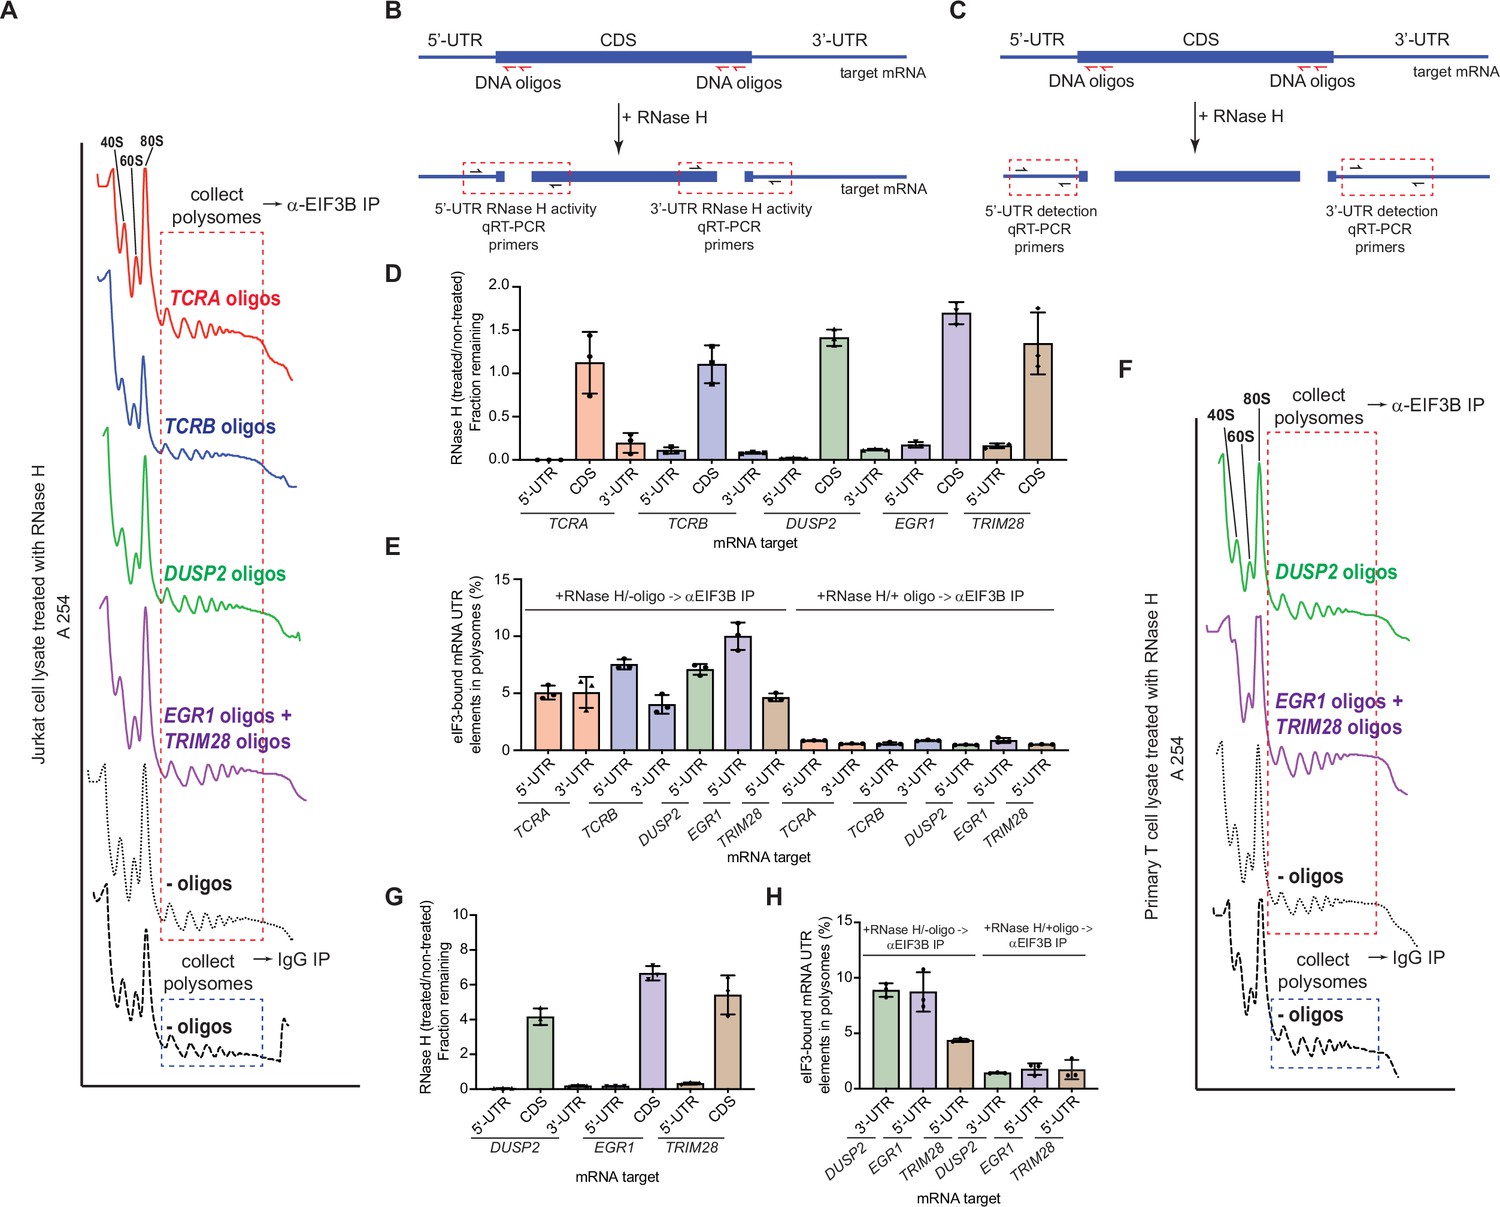
The TCRA and TCRB mRNAs remain bound to elongating ribosomes via eIF3 in activated T cells.
(A) Sucrose gradient fractionation of polysomes from crosslinked Jurkat cells. Cell lysates treated with RNase H, as indicated, were fractionated on 10–50% sucrose gradients. Shown is the absorbance at 254 nm, for one of two biological replicates. (B) Strategy for detecting mRNA cleavage by RNase H digestion. RT-qPCR primers were designed to span the mRNA digestion sites. (C) Strategy for detecting 5’-UTR or 3’-UTR mRNA fragments released by RNase H digestion. RT-qPCR primers were designed within the 5’-UTR or 3’-UTR regions. (D) Fraction of intact mRNA segments remaining after RNase H treatment of DSP-crosslinked cell lysates from Jurkat cells, in the presence or absence of mRNA-specific DNA oligos for the indicated mRNAs. The mRNAs were detected using RT-qPCR oligos as illustrated in panel B. (E) Amount of eIF3-bound 5’-UTR and 3’-UTR regions of the mRNA co-immunoprecipitated by anti-EIF3B antibody, from polysome fractions of lysate from Jurkat cells treated with RNase H, either in the absence (left) or presence (right) of mRNA-targeting DNA oligos. Percentage is relative to the amount of total mRNA present in the polysome fraction prior to immunoprecipitation. Primers to the mRNA 5’-UTR and 3’-UTR regions, as indicated in panel C, were used for quantification. (F) Sucrose gradient fractionation of polysomes from crosslinked primary human T cells. (G) Fraction of intact mRNA segments remaining after RNase H treatment of DSP-crosslinked cell lysates from primary T cells, in the presence or absence of mRNA-specific DNA oligos for the indicated mRNAs. The mRNAs were detected using RT-qPCR oligos as illustrated in panel B. (H) Amount of eIF3-bound 5’-UTR and 3’-UTR regions of the mRNA co-immunoprecipitated by anti-EIF3B antibody, from polysome fractions of lysate from primary human T cells treated with RNase H, either in the absence (left) or presence (right) of mRNA-targeting DNA oligos. Percentage is relative to mRNA present in the polysome fraction prior to immunoprecipitation. Primers to the mRNA 5’-UTR and 3’-UTR regions, as indicated in panel C, were used for quantification. All experiments were carried out in biological duplicate with one technical triplicate shown (n = 3, with mean and standard deviations shown). All the primary human T cell experiments were performed using samples from two donors and data from one representative donor are shown.
Figure 3
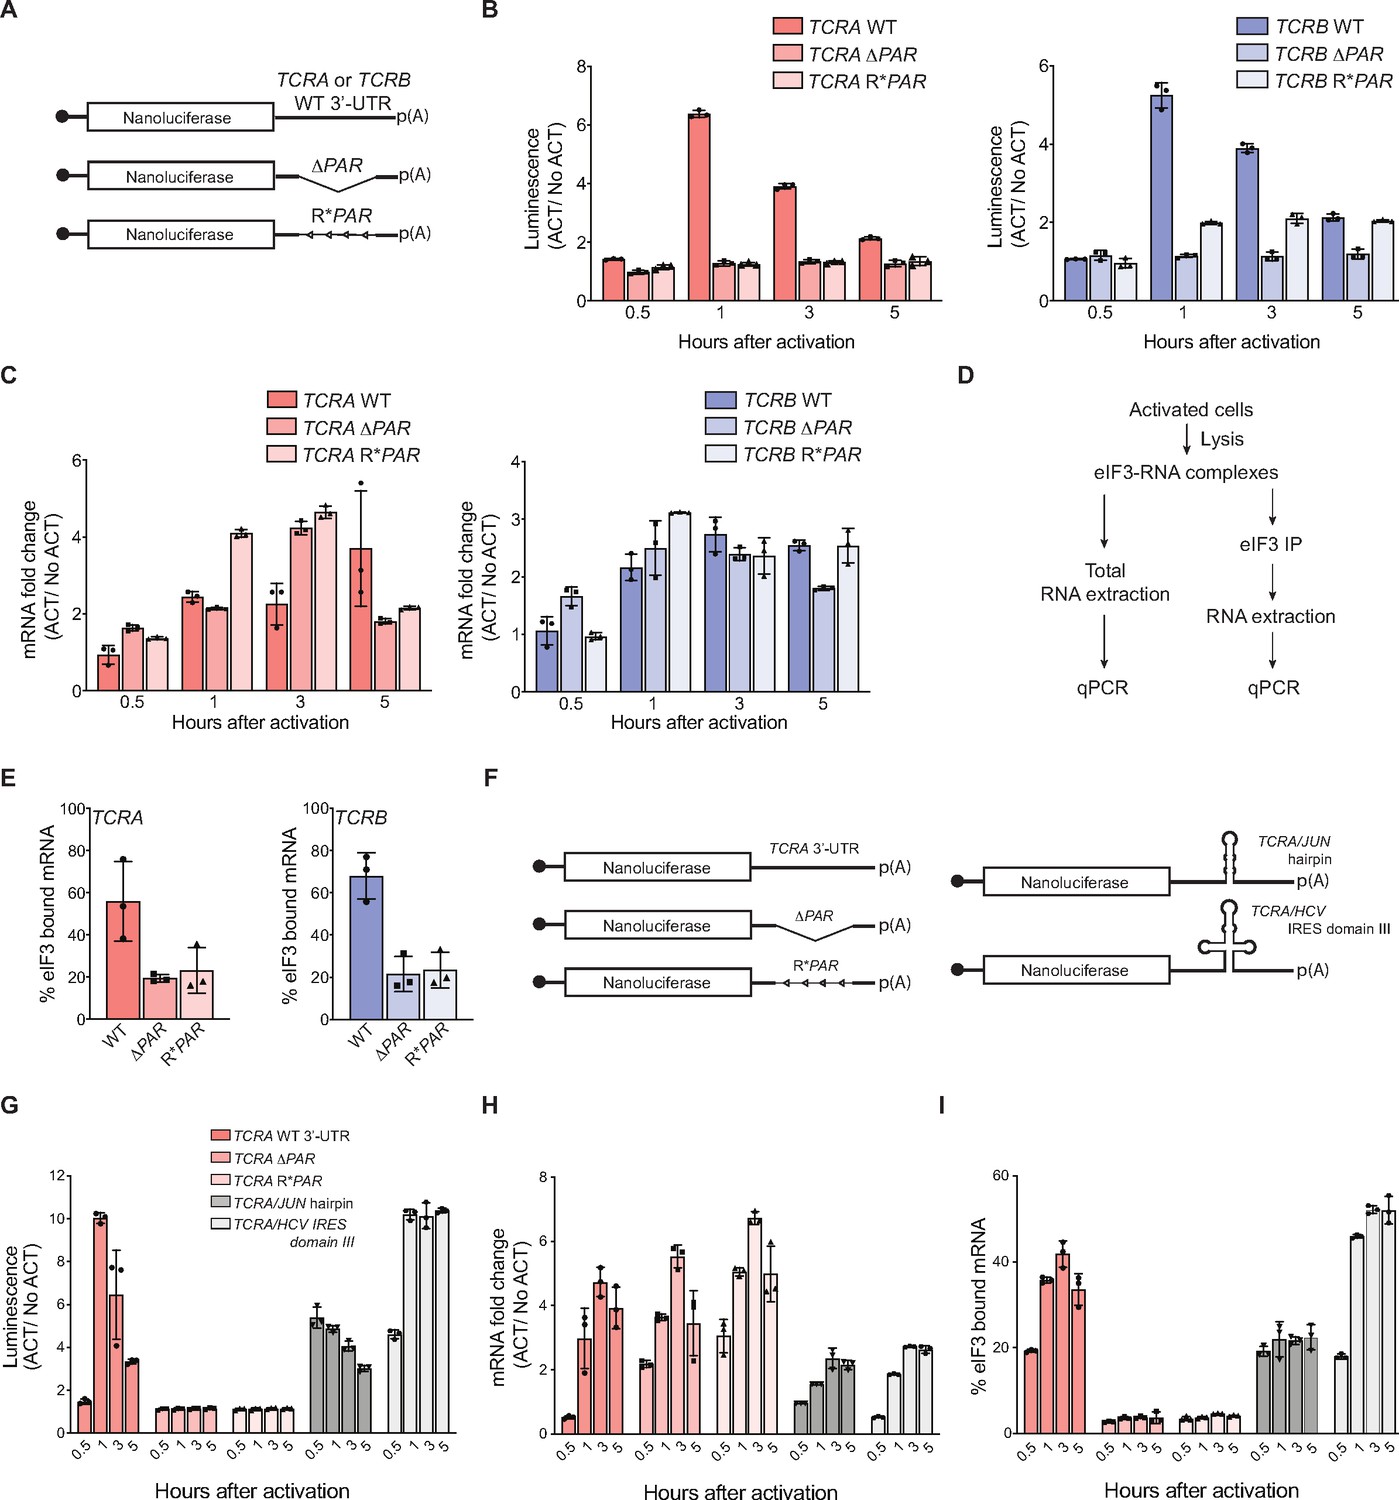
Interaction of eIF3 with TCRA and TCRB mRNA 3’-UTR elements mediates a burst in TCR translation in primary human T cells.
(A) Schematic of nanoluciferase reporters stably expressed in primary human T cells. The reporters carry the HBB 5’-UTR and WT, ΔPAR or R*PAR 3’-UTRs. WT, intact 3’-UTR from either TCRA or TCRB mRNA; ΔPAR, 3’-UTR of TCRA or TCRB with the eIF3 PAR-CLIP site deleted; R*PAR, reversed PAR-CLIP sequence in the 3’-UTR of TCRA or TCRB mRNA. (B) Luciferase activity in anti-CD3/anti-CD28 activated T cells stably expressing nanoluciferase constructs described in A, relative to non-activated controls (ACT/NoACT). (C) Changes in nanoluciferase mRNA levels in B, as determined by qRT-PCR. (D) Schematic of immunoprecipitation of eIF3 using an anti-EIF3B antibody (Lee et al., 2015), followed by qRT-PCR to quantify the amount of nanoluciferase mRNA bound to eIF3. (E) Immunoprecipitation as shown in D showing the amount of nanoluciferase mRNA bound to eIF3 in T cells stably transduced with either TCRA (left) or TCRB (right) WT, ΔPAR or R*PAR 3’-UTRs after activation with anti-CD3/anti-CD28 antibodies for 1 hr. The percent mRNA bound to anti-EIF3B beads is calculated relative to total mRNA isolated from the cells. (F) Schematic of nanoluciferase reporters stably expressed in primary human T cells. Nanoluciferase reporters carry the HBB 5’-UTR and WT, ΔPAR, R*PAR of the TCRA 3’-UTR, or ΔPAR of the TCRA 3’-UTR replaced with either a JUN 5’-UTR hairpin or hepatitis C viral (HCV) internal ribosome entry site (domain IIIabc). (G) Luciferase activity in anti-CD3/anti-CD28 activated T cells stably expressing nanoluciferase constructs described in F, relative to non-activated controls. (H) Changes in nanoluciferase mRNA levels in G, as determined by qRT-PCR. (I) Immunoprecipitation as shown in D to quantify the amount of nanoluciferase mRNA bound to eIF3 in T cells stably expressing nanoluciferase constructs in F after activation with anti-CD3/anti-CD28 antibodies for 0.5, 1, 3, and 5 hr. The percent mRNA bound to anti-EIF3B beads is calculated relative to total mRNA isolated from the cells. All experiments were carried out in triplicate (three separate wells per condition), with mean and standard deviations shown. All the primary human T cell experiments were performed using two donors and data from one representative donor is shown.
Figure 4 with 1 supplement
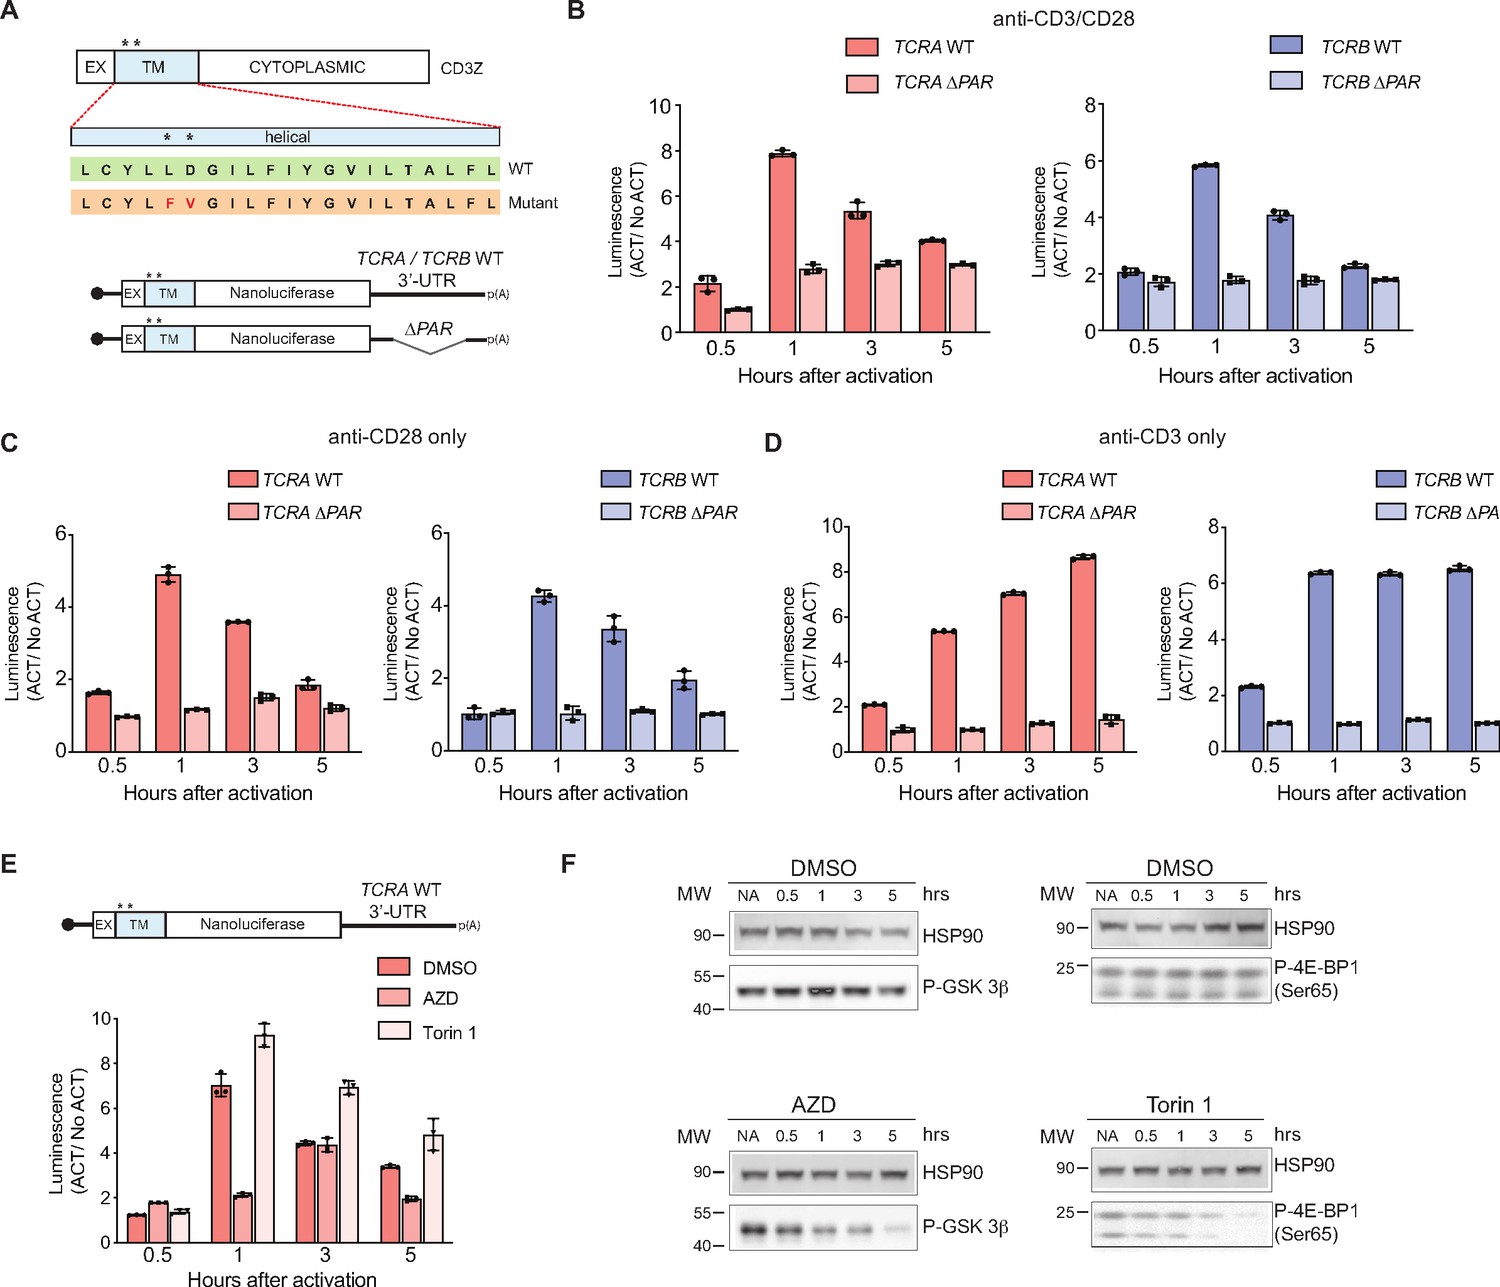
The burst in nanoluciferase reporter translation requires membrane-proximal CD28 signaling.
(A) Schematic of the membrane-tethered nanoluciferase reporters stably expressed in primary human T cells. (Top) Wild-type CD3-zeta protein with asterisk indicating two amino acids mutated in the transmembrane region to prevent association with the TCR (Dong et al., 2019) (EX: extracellular, TM: transmembrane). (Bottom) Schematic of the nanoluciferase reporters. Nanoluciferase is fused C-terminal to the extracellular and transmembrane segments of CD3-zeta, mutated to prevent TCR association. The reporters carry the HBB 5’-UTR and TCRA, TCRB, TCRA ΔPAR, or TCRB ΔPAR 3’-UTR. (B) Luciferase activity in primary human T cells stably expressing membrane-tethered reporters described in A stimulated with anti-CD3/anti-CD28 antibodies, relative to non-activated controls (ACT/NoACT). (C) Luciferase activity in primary human T cells stably expressing membrane-tethered reporters described in A, and activated only with anti-CD28 antibodies, relative to non-activated controls. (D) Luciferase activity in primary human T cells stably expressing membrane-tethered reporters described in A, and activated only with anti-CD3 antibodies, relative to non-activated controls. (E) Luciferase activity in primary human T cells stably expressing membrane-tethered reporter with WT TCRA 3’-UTR described in A inhibited with either AZD5363 (AZD) to inhibit AKT activity or Torin 1 to inhibit mTOR before activating with anti-CD3/anti-CD28 antibodies, relative to non-activated controls. In panels A–E, all experiments were carried out in triplicate (three separate wells per condition), with mean and standard deviations shown. (F) Western blot carried out to measure AKT activity in the presence of AZD5363 (AZD) using an anti-Phospho-GSK-3β antibody or mTOR activity in the presence of Torin 1 using an anti-Phospho-4EBP1 antibody, for the samples in E. HSP90 was used as a loading control. All the primary human T cell experiments were performed using two donors and data from one representative donor is shown.
Figure 4—figure supplement 1
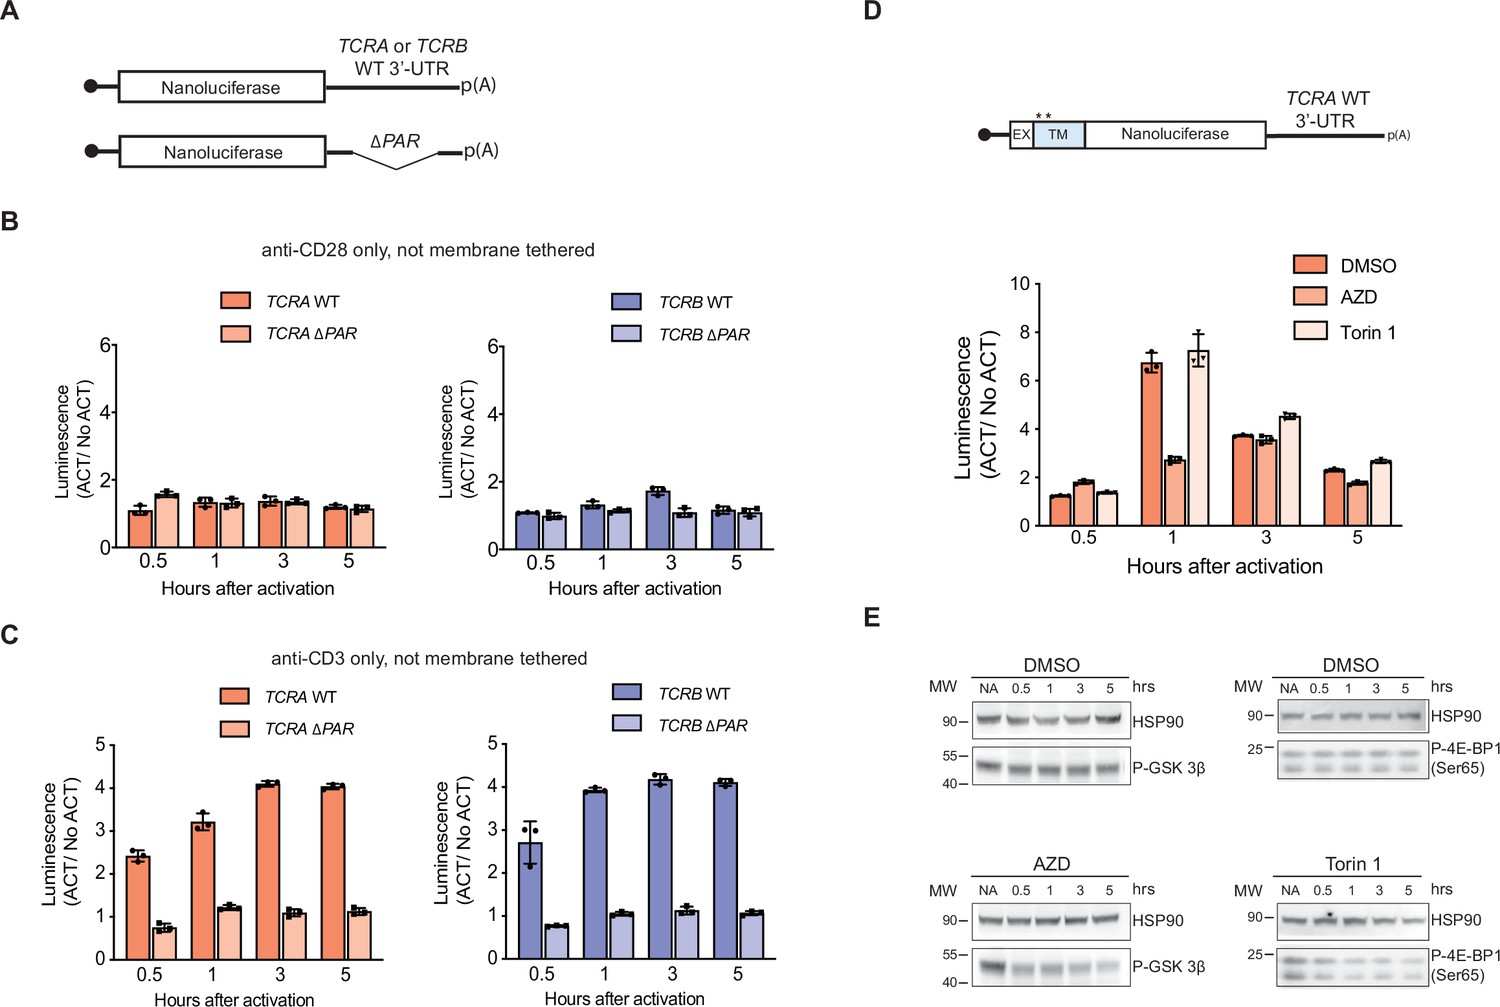
Nanoluciferase reporter expression in activated T cells.
(A) Schematic of nanoluciferase reporters without a transmembrane helix (not membrane tethered) stably expressed in primary human T cells. The reporters carry the HBB 5’-UTR and TCRA, TCRB, TCRA ΔPAR, or TCRB ΔPAR 3’-UTR. (B) Luciferase activity in T cells stably expressing reporters described in A stimulated only with anti-CD28 antibodies, relative to non-activated controls (n = 3, with mean and standard deviations shown). (C) Luciferase activity in primary human T cells stably expressing reporters described in A stimulated only with anti-CD3 antibodies, relative to non-activated controls (n = 3, with mean and standard deviations shown). (D) Luciferase activity in primary human T cells stably expressing membrane-tethered reporter (described in the schematic above) with WT TCRA 3’-UTR inhibited with either AZD5363 (AZD) to inhibit AKT activity or Torin 1 to inhibit mTOR before activating with anti-CD3/anti-CD28 antibodies, relative to non-activated controls. In panels B–D, all experiments were carried out in triplicate (three separate wells per condition), with mean and standard deviations shown. (E) Western blot carried out to measure AKT activity in the presence of AZD5363 (AZD) using an anti-Phospho-GSK-3β antibody or mTOR activity in the presence of Torin 1 using an anti-Phospho-4EBP1 antibody for the samples in D. HSP90 was used as a loading control. All the primary human T cell experiments were performed using samples from two donors and data from one representative donor are shown here. The data from the other donor are presented in Figure 4F.
Figure 5 with 5 supplements
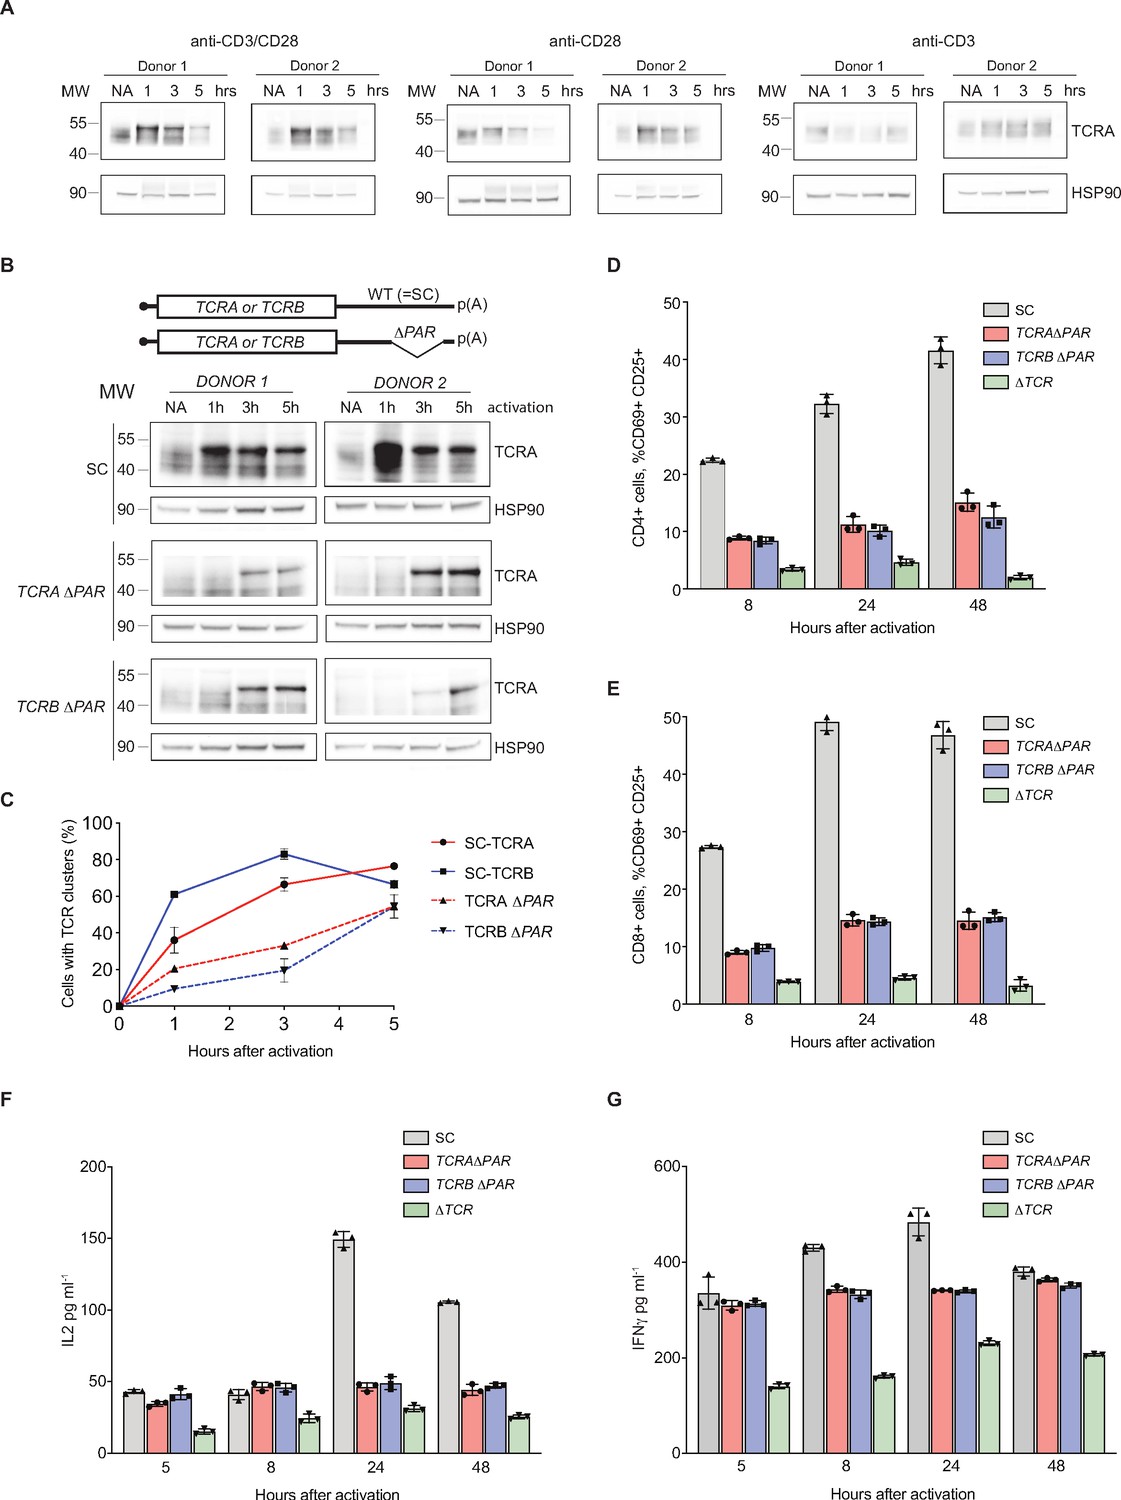
eIF3 binding to the TCRA and TCRB mRNA 3’-UTR elements is required for a rapid burst in TCR translation and robust activation of primary human T cells.
(A) Western blots of TCRA protein levels in T cells as a function of time after different modes of activation. HSP90 was used as a loading control. (B) Western blots measuring TCRA protein levels as a function of time after anti-CD3/anti-CD28 activation. Cell lines used are labeled on the left: TCRA ΔPAR, TCRB ΔPAR, and SC (scrambled gRNA). HSP90 was used as a loading control. Schematics of TCRA and TCRB mRNAs with and without eIF3 PAR-CLIP sites are shown above. SC control cells have the WT 3’-UTRs for TCRA and TCRB mRNAs. (C) The number of T cells with one or more TCR clusters measured by anti-TCRA/anti-TCRB protein staining and epifluorescence microscopy as a function of time after anti-CD3/anti-CD28 activation. A total of 100 cells from each donor were imaged for TCRA ΔPAR (n = 2 donors, stained with anti-TCRA antibody), TCRB ΔPAR (n = 2 donors, stained with anti-TCRB antibody), and SC cell lines (n = 2 donors, each stained separately with anti-TCRA and anti-TCRB antibodies). Values are mean ± standard deviation. (D) Flow cytometric analysis measuring T cell activation markers CD69 (early activation marker) and CD25 (mid-activation marker), quantifying the mean percent of CD4+ T cells that are CD69+ CD25+. (E) Flow cytometric analysis of CD8+ T cells, quantifying the mean percent of CD8+ T cells that are CD69+ CD25+. Cells sorted as shown in Figure 5—figure supplement 2. (F) Quantification of IL2 secreted from SC, TCRA ΔPAR, TCRB ΔPAR, and ΔTCR cell populations at different time points after stimulation with anti-CD3/anti-CD28 antibodies, as determined by ELISA. (G) Quantification IFNγ secreted from the cells in F, as determined by ELISA. In panels D–G, all experiments were carried out in triplicate (three separate wells per condition), with mean and standard deviations shown. Representative results from one donor are shown.
Figure 5—figure supplement 1
Generation and analysis of TCRA ΔPAR and TCRB ΔPAR primary human T cells.
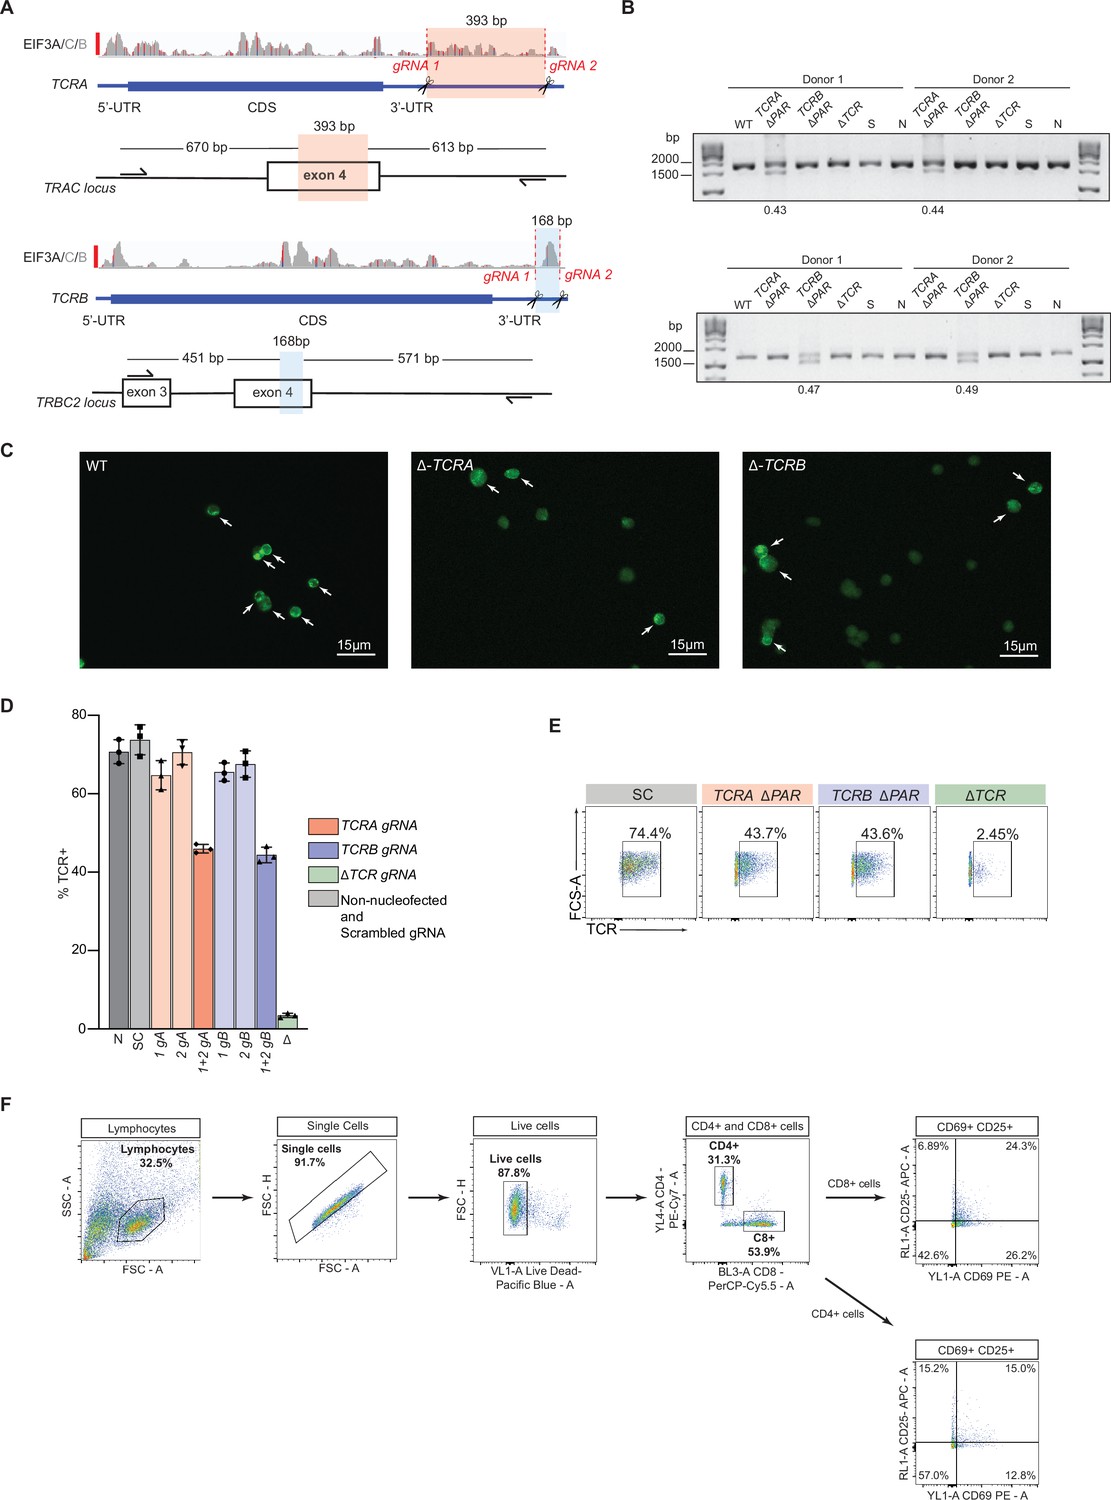
(A) CRISPR/Cas9 RNP-mediated genome editing at the TCRA and TCRB genomic loci in primary human T cells. Location of gRNA sites targeting the TCRA 3’-UTR, to generate TCRA ΔPAR cells is highlighted in red. In TCRA, gRNA1 and gRNA2 target hg38 genomic locations chr14:22,551,700 and chr14:22,552,073, respectively. Location of gRNA sites targeting the TCRB 3’-UTR, to generate TCRB ΔPAR cells is highlighted in blue. In TCRB, gRNA1 and gRNA2 target hg38 genomic locations chr7:142,802,561 and chr7:142,802,695, respectively. (B) Top gel: Analysis of TCRA 3’-UTR PAR-CLIP site deletion efficiency. Total genomic DNA extracted from WT, TCRA ΔPAR, TCRB ΔPAR (here serving as a negative control), scrambled gRNA nucleofected (S) and non-nucleofected (N) cells was analyzed by PCR to measure the editing efficiency. TCRA ΔPAR cells produced a 1283 bp PCR product compared to 1676 bp in S, N or TCRB ΔPAR cells (See panel A). Bottom gel: Analysis of TCRB 3’-UTR PAR-CLIP site deletion efficiency. Total genomic DNA extracted from WT, TCRA ΔPAR (here serving as a negative control), TCRB ΔPAR, scrambled gRNA nucleofected (S) and non-nucleofected (N) cells were analyzed by PCR to measure the editing efficiency. TCRB ΔPAR cells produced a 1022 bp PCR product compared to 1190 bp in S, N or TCRA ΔPAR cells (See panel A). The percentage of alleles with PAR-CLIP site deletion, quantified by imageJ. (C) Representative immunofluorescence images used to count TCR clusters in WT, TCRA ΔPAR and TCRB ΔPAR primary human T cells. The white arrows indicate the cells that were scored as having TCR clusters. (D) Percentage of cells expressing TCR on the cell surface of activated T cells measured by flow cytometric analysis. TCR expressing cells in the cell populations tested: N, Non-nucleofected cells; SC, Scrambled gRNA; 1gA, TCRA gRNA 1; 2gA, TCRA gRNA 2; 1 + 2 gA, TCRA gRNA 1 + 2 (i.e. TCRA ΔPAR); 1 gB, TCRB gRNA 1; 2 gB, TCRB gRNA 2; 1 + 2 gB, TCRB gRNA 1 + 2 (i.e. TCRB ΔPAR); ΔTCR, TCR gRNA targeting the CDS of TCRA. (n = 3 replicates from three separate wells, with mean and standard deviation shown.) (E) Representative density plots showing the percentage of TCR on the cell surface in activated T cells. The cell lines shown are: SC, TCRA ΔPAR, TCRB ΔPAR, ΔTCR (negative control). In panels D and E, representative results from one of two donors are shown. (F) Gating strategy for flow cytometric analysis of CD69 and CD25 levels. Primary human T cells were gated to isolate lymphocytes, followed by isolation of single cells, then live cells. Next, cells were gated to separate CD4+ and CD8+ cells expressing T cell activation markers CD69 and CD25. The gates for CD69+ and CD25+ cells were set based on CD69 and CD25 levels in the ΔTCR T cells. Shown is the workflow of the FACS gating, with an example of T cells activated with anti-CD3/anti-CD28 antibodies for 8 hr.
Figure 5—figure supplement 2

Effects of TCRA ΔPAR and TCRB ΔPAR mutations on different steps of CD8+ T cell activation.
Representative density plots showing the percentage of CD8+ T cells expressing CD69 (early activation marker), CD25 (mid-activation marker) or CD69 and CD25 after activation with anti-CD3/anti-CD28 antibodies at different time points, analyzed by flow cytometry. The plots represent one of the two donors. The cell lines shown are SC, TCRA ΔPAR, TCRB ΔPAR, and ΔTCR (negative control). The gating for CD69+ and CD25+ cells was set based on CD69 and CD25 levels in ΔTCR T cells.
Figure 5—figure supplement 3
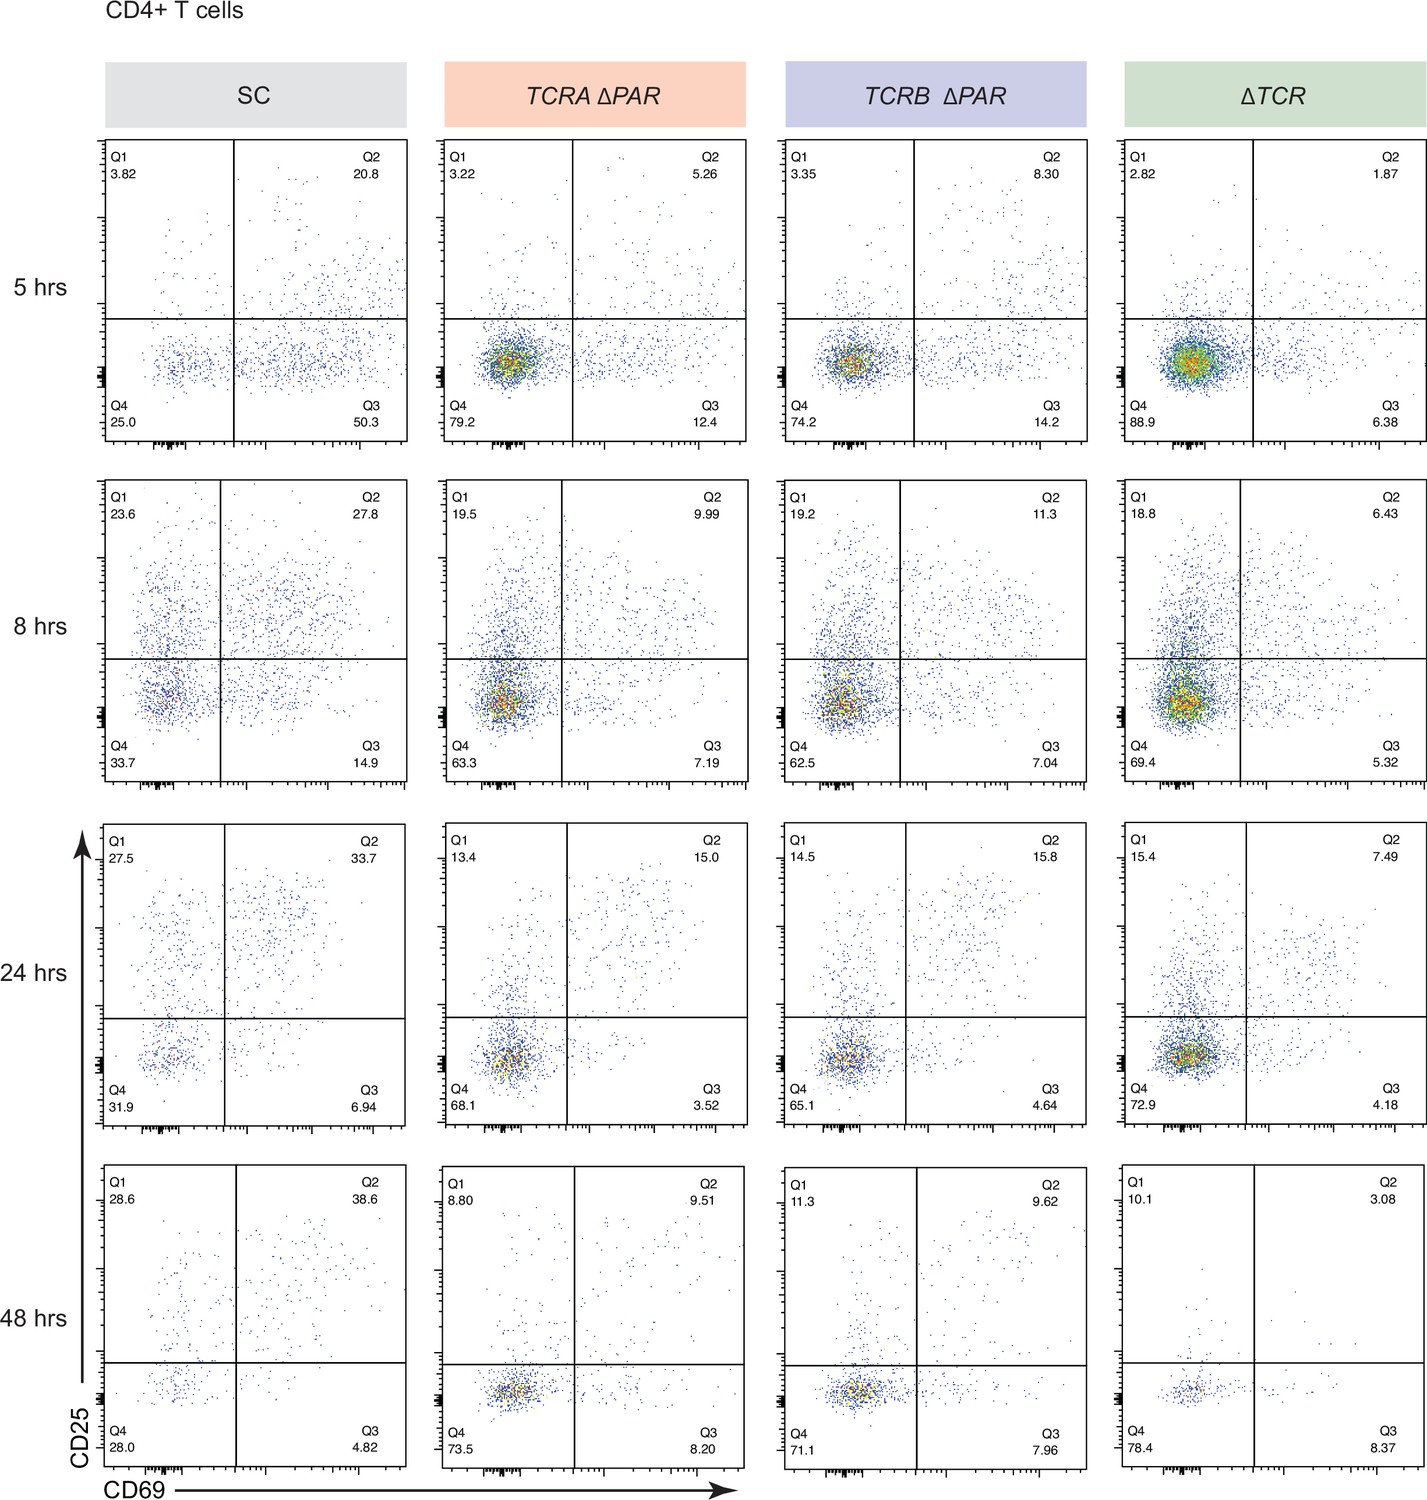
Effects of TCRA ΔPAR and TCRB ΔPAR mutations on different steps of CD4+ T cell activation.
Representative density plots showing the percentage of CD4+ T cells expressing CD69 (early activation marker), CD25 (mid-activation marker) or CD69 and CD25 after activation with anti-CD3/anti-CD28 antibodies at different time points, analyzed by flow cytometry. The plots represent one of the two donors. The cell lines shown are SC, TCRA ΔPAR, TCRB ΔPAR, and ΔTCR (negative control). The gating for CD69+ and CD25+ cells was set based on CD69 and CD25 levels in ΔTCR T cells.
Figure 5—figure supplement 4
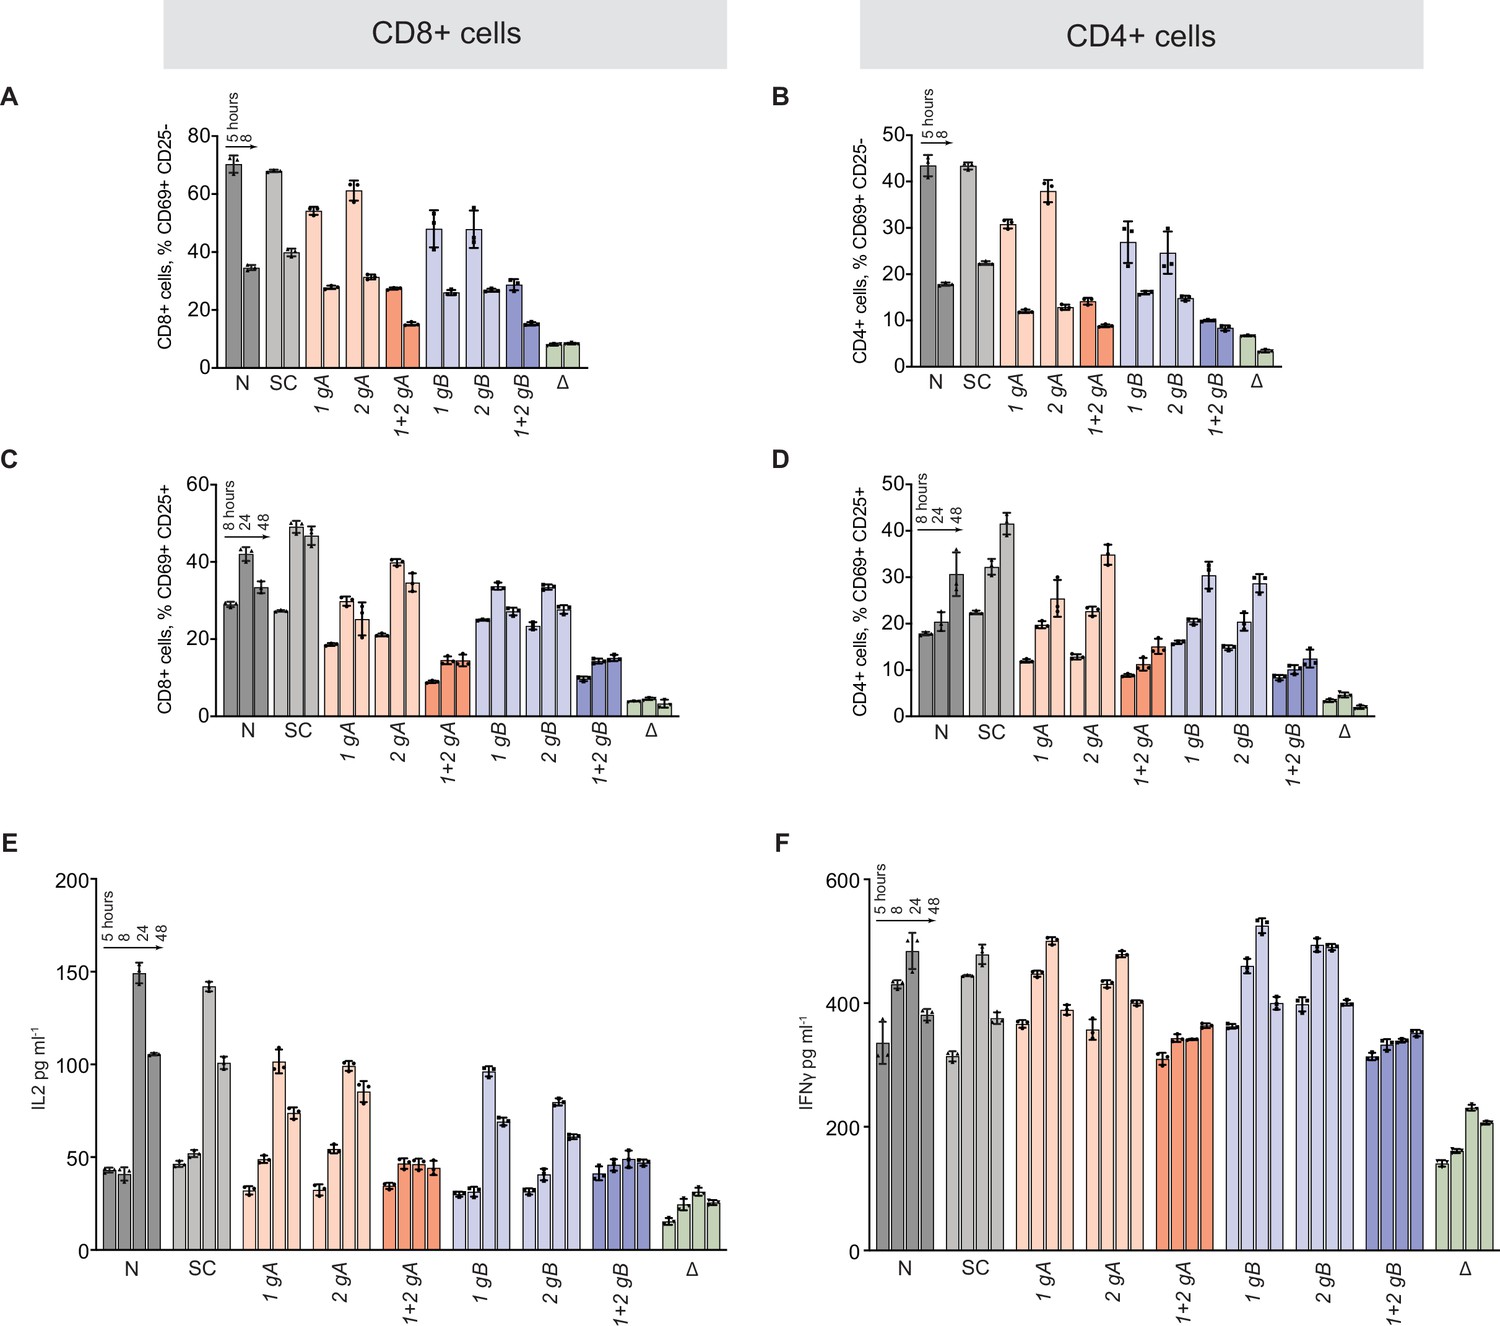
Effects of TCRA ΔPAR and TCRB ΔPAR mutations on different steps of T cell activation.
(A and B) Flow cytometric analysis quantifying the mean percent of A, CD8+ T and B, CD4+ T cells that are only CD69+. (C and D) Flow cytometric analysis quantifying the mean percent of C, CD8+ T and D, CD4+ T cells that are CD69+ CD25+. (E and F) Quantification of E, secreted IL-2 and F, secreted IFNγ, for all cell populations tested, as determined by ELISA. The cell populations tested: N, Non-nucleofected cells; SC, Scrambled gRNA; 1gA, TCRA gRNA 1; 2gA, TCRA gRNA 2; 1 + 2 gA, TCRA gRNA 1 + 2 (i.e. TCRA ΔPAR); 1 gB, TCRB gRNA 1; 2 gB, TCRB gRNA 2; 1 + 2 gB, TCRB gRNA 1 + 2 (i.e. TCRB ΔPAR); ΔTCR gRNA targeting the CDS of TCRA. All experiments were carried out in triplicate (three separate wells per condition), with mean and standard deviations shown. Representative results from one donor are shown.
Figure 5—figure supplement 5

eIF3 binding to the TCRA and TCRB mRNA 3’-UTR elements in Jurkat cells.
(A) Western blots of TCRA protein levels as a function of time after anti-CD3/anti-CD28 activation. Cell lines used: WT Jurkat cells, TCRA ΔPAR and TCRB ΔPAR, Jurkat cells in which the eIF3 PAR-CLIP sites in the 3’-UTRs of the TCRA and TCRB mRNAs, respectively, have been deleted. Schematics of TCRA and TCRB mRNAs with and without eIF3 PAR-CLIP sites are shown above. HSP90 was used as a loading control. Western blots are representative of two biological replicates. (B) TCRA and TCRB mRNA levels in WT Jurkat cells, or Jurkat cells with the TCRA eIF3 3’-UTR PAR-CLIP site deleted, as determined by qRT-PCR at different time points after anti-CD3/anti-CD28 activation. (C) TCRA and TCRB mRNA levels in WT Jurkat cells, or Jurkat cells with the TCRB eIF3 3’-UTR PAR-CLIP site deleted, as determined by qRT-PCR at different time points after anti-CD3/anti-CD28 activation. (D) Schematic of immunoprecipitation of eIF3 using an anti-EIF3B antibody, followed by qRT-PCR to quantify the amount of nanoluciferase mRNA bound to eIF3. (E) Immunoprecipitation of eIF3 as shown in D to quantify the amount of TCRA or TCRB mRNA bound to eIF3 in Jurkat cells after activation with anti-CD3/anti-CD28 antibodies for 5 hours (left) and 8 hr (right). The percent mRNA bound to anti-EIF3B beads is calculated relative to total mRNA isolated from the cells. In panels B–E, all experiments were carried out in triplicate (three separate wells per condition), with mean and standard deviations shown. Representative results from one of two biological replicates are shown.
Figure 6 with 6 supplements
The TCRA and TCRB mRNA 3’-UTR elements enhance CAR T cell function.
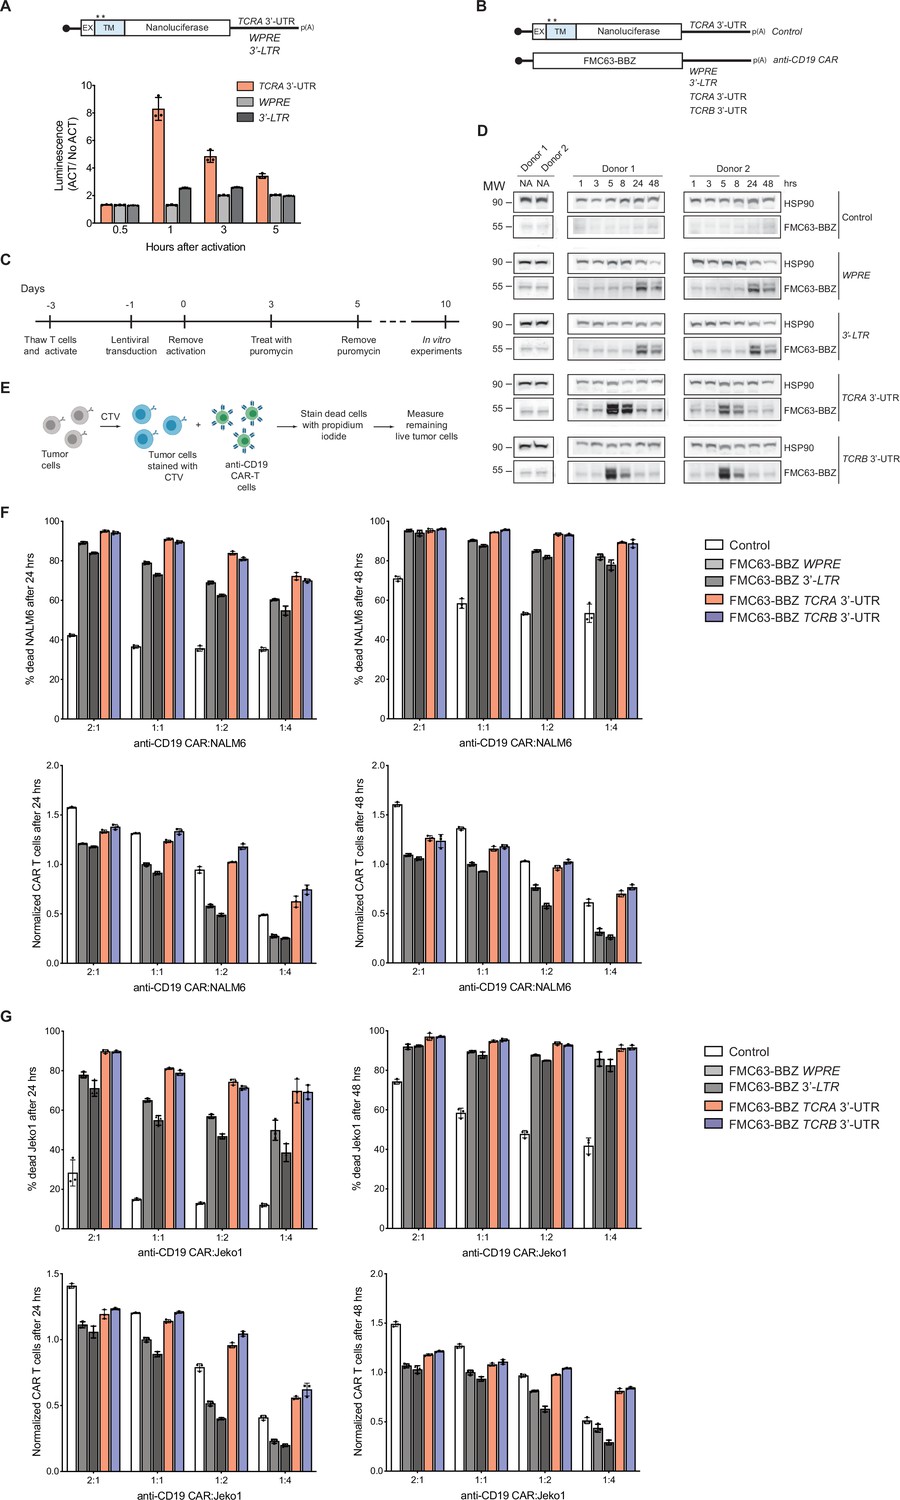
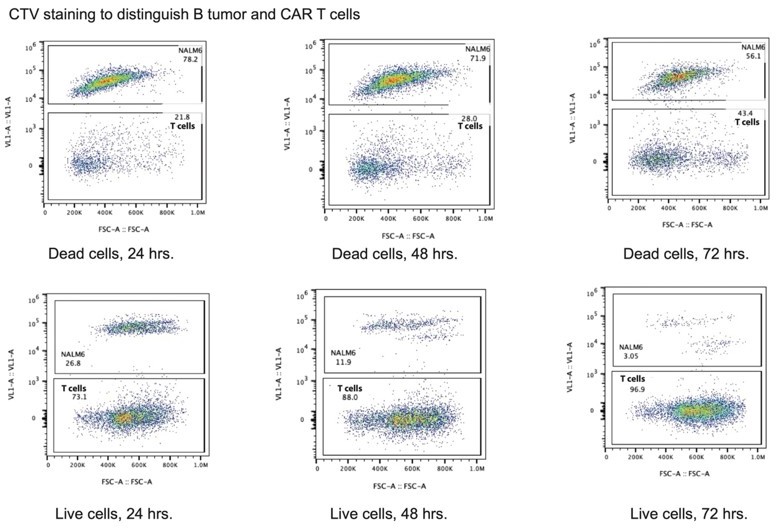
(A) (Top) Schematic of membrane-tethered nanoluciferase reporters stably expressed in primary human T cells. The reporters have the HBB 5’-UTR and either the TCRA 3’-UTR, the Woodchuck Hepatitis Virus Posttranscriptional Regulatory Element (WPRE) or the gammaretroviral 3’-Long Terminal Repeat (3’-LTR) as 3’-UTR. (Bottom) Luciferase activity in primary human T cells stably expressing membrane-tethered nanoluciferase reporters described above and activated with anti-CD3/anti-CD28 antibodies, relative to non-activated cells. Representative results from one of two donors are shown (n = 3 separate wells, with mean and standard deviations shown). (B) Schematics of FMC63-BBZ CAR cDNA sequence fused 5’ of the WPRE, 3’-LTR, TCRA 3’-UTR or TCRB 3’-UTR. The membrane-tethered nanoluciferase reporter with TCRA 3’-UTR was used as a control for the effects of lentiviral expression. (C) Timeline of CAR T cell generation from primary human T cells and the experiments performed. (D) Western blots measuring FMC63-BBZ CAR protein levels as a function of time after incubation with NALM6 cells. CAR T cells expressing the constructs in B are labeled: Control, WPRE, 3’-LTR, TCRA and TCRB 3’-UTR. HSP90 was used as a loading control (n = 2 donors). (E) Schematic describing the cytotoxicity assay used to detect live tumor cells after incubation with FMC63-BBZ CAR cells using flow cytometric analysis. (F) Top panels show cytotoxic activity of FMC63-BBZ CARs fused to various 3’-UTRs described in B after incubating with NALM6 cells for 24 and 48 hr. Bottom panels show CAR T cells present in the experiments at the different time points, normalized to the WPRE CAR T cells at a 1:1 ratio with target tumor cells. (G) Top panels show cytotoxic activity of FMC63-BBZ CARs fused to various 3’-UTRs described in B after incubating with Jeko 1 cells for 24 and 48 hr. Bottom panels show CAR T cells present in the experiments at the different time points, normalized to the WPRE CAR T cells at a 1:1 ratio with target tumor cells. In panels F and G, representative results for one of two donors are shown for T cells propagated in 50 U/mL IL2 (n = 3 separate wells, with mean and standard deviations shown).
Figure 6—figure supplement 1

Effects of the TCRA and TCRB mRNA 3’-UTR elements on CAR T cell function.
(A) Western blots measuring TCRA protein levels as a function of time in FMC63-BBZ CAR T cells after incubation with NALM6 tumor cells. Cell lines used are labeled: Control, WPRE, 3’-LTR, TCRA, and TCRB 3’-UTR diagrammed in Figure 6B. HSP90 was used as a loading control. (B) Gating strategy for flow cytometric analysis to detect live tumor cells after incubation with CAR T cells. This includes: (1) both CAR T and tumor cell gating, (2) isolating single cells, (3) isolating live cells based on propidium iodide staining and (4) separating cell trace violet (CTV) stained vs non-stained cells to isolate live tumor cells. (C) Left panel shows cytotoxic activity of FMC63-BBZ CARs fused to various 3’-UTRs described in Figure 6B after incubating with NALM6 tumor cells for 72 hr. Right panel shows CAR T cells present in the experiments at 72 hr, normalized to the WPRE CAR T cells at a 1:1 ratio with target tumor cells. (D) Left panel shows cytotoxic activity of FMC63-BBZ CARs fused to various 3’-UTRs described in Figure 6B after incubating with Jeko 1 tumor cells for 72 hr. Right panel shows CAR T cells present in the experiments at 72 hr, normalized to the WPRE CAR T cells at a 1:1 ratio with target tumor cells. Results in panels C and D for one of two donors are shown (n = 3 separate wells, with mean and standard deviations shown).
Figure 6—figure supplement 2
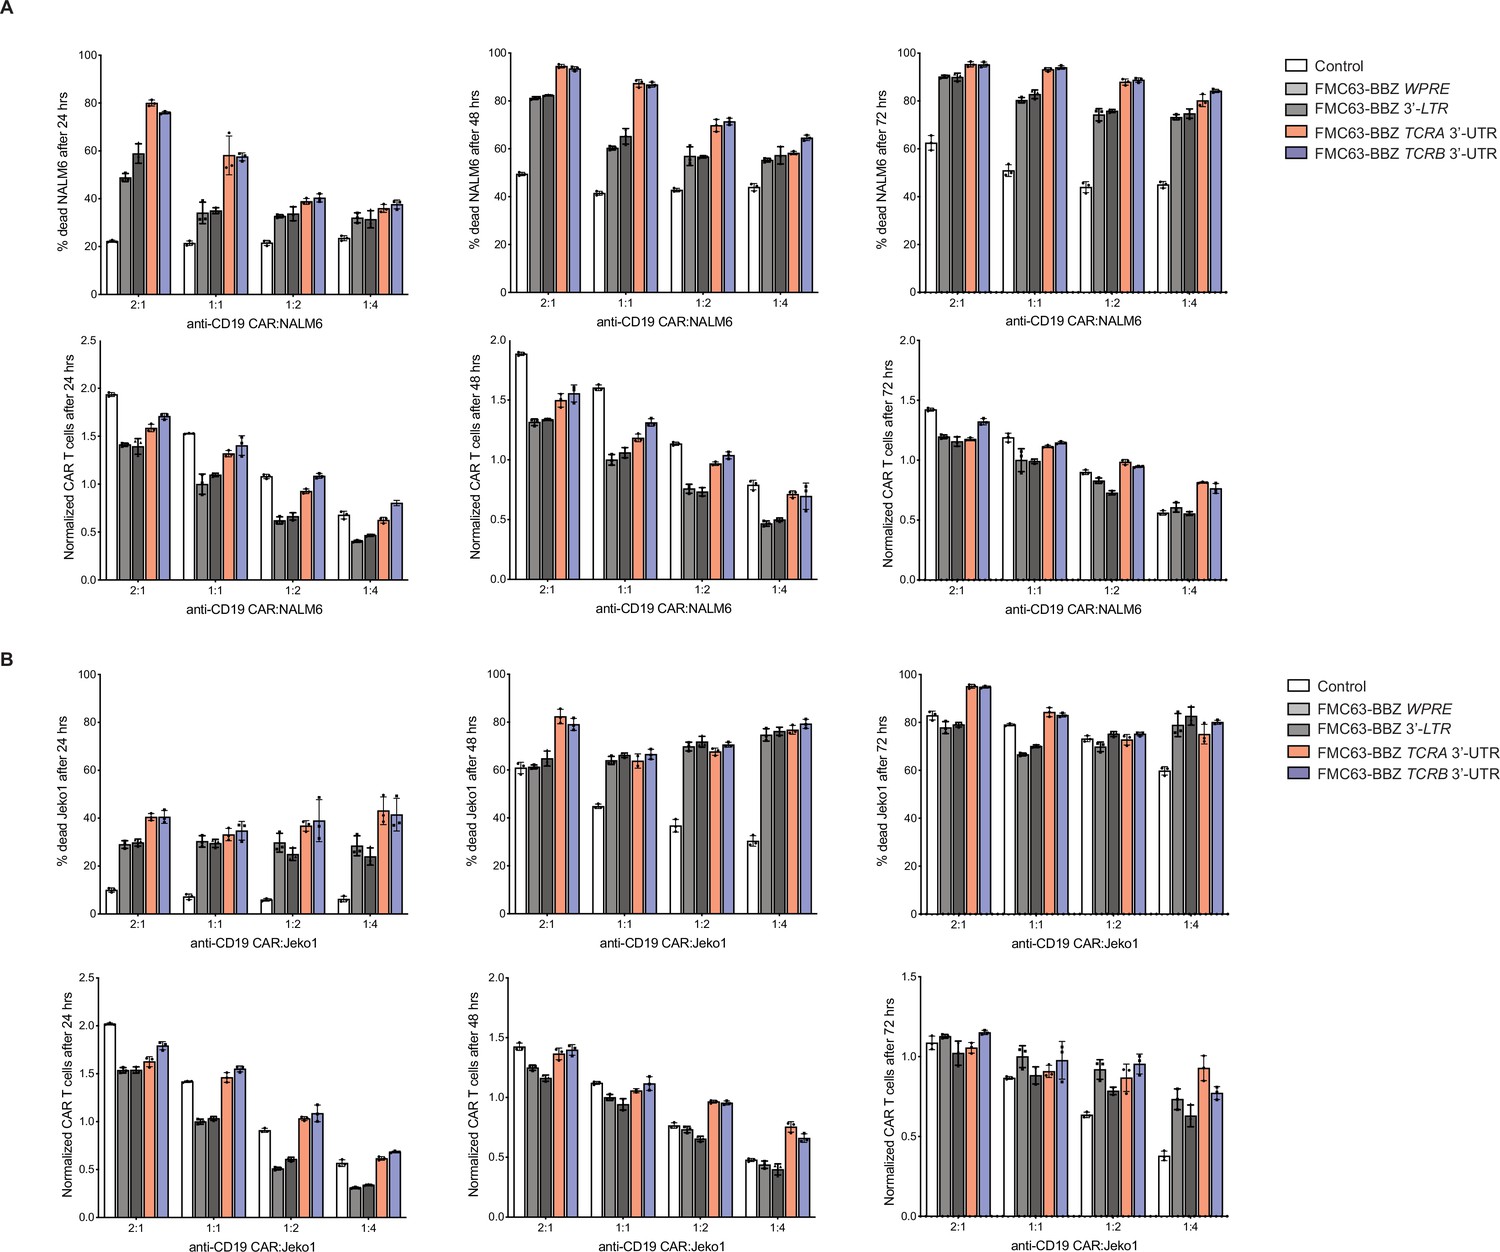
Effects of the TCRA and TCRB mRNA 3’-UTR elements on CAR T cell function, donor 2.
(A) Top panels, cytotoxic activity of FMC63-BBZ CARs fused to various 3’-UTRs described in Figure 6B after incubating with NALM6 cells for 24, 48, and 72 hr. Bottom panels, CAR T cells present in the experiments at the different time points, normalized to the WPRE CAR T cells at a 1:1 ratio with target tumor cells. (B) Top panels, cytotoxic activity of FMC63-BBZ CARs fused to various 3’-UTRs described in Figure 6B after incubating with Jeko 1 cells for 24, 48, and 72 hr. Bottom panels, CAR T cells present in the experiments at the different time points, normalized to the WPRE CAR T cells at a 1:1 ratio with target tumor cells. These are results for the second of the two donors with T cells propagated in 50 U/mL IL2 (n = 3 separate wells, with mean and standard deviations shown).
Figure 6—figure supplement 3
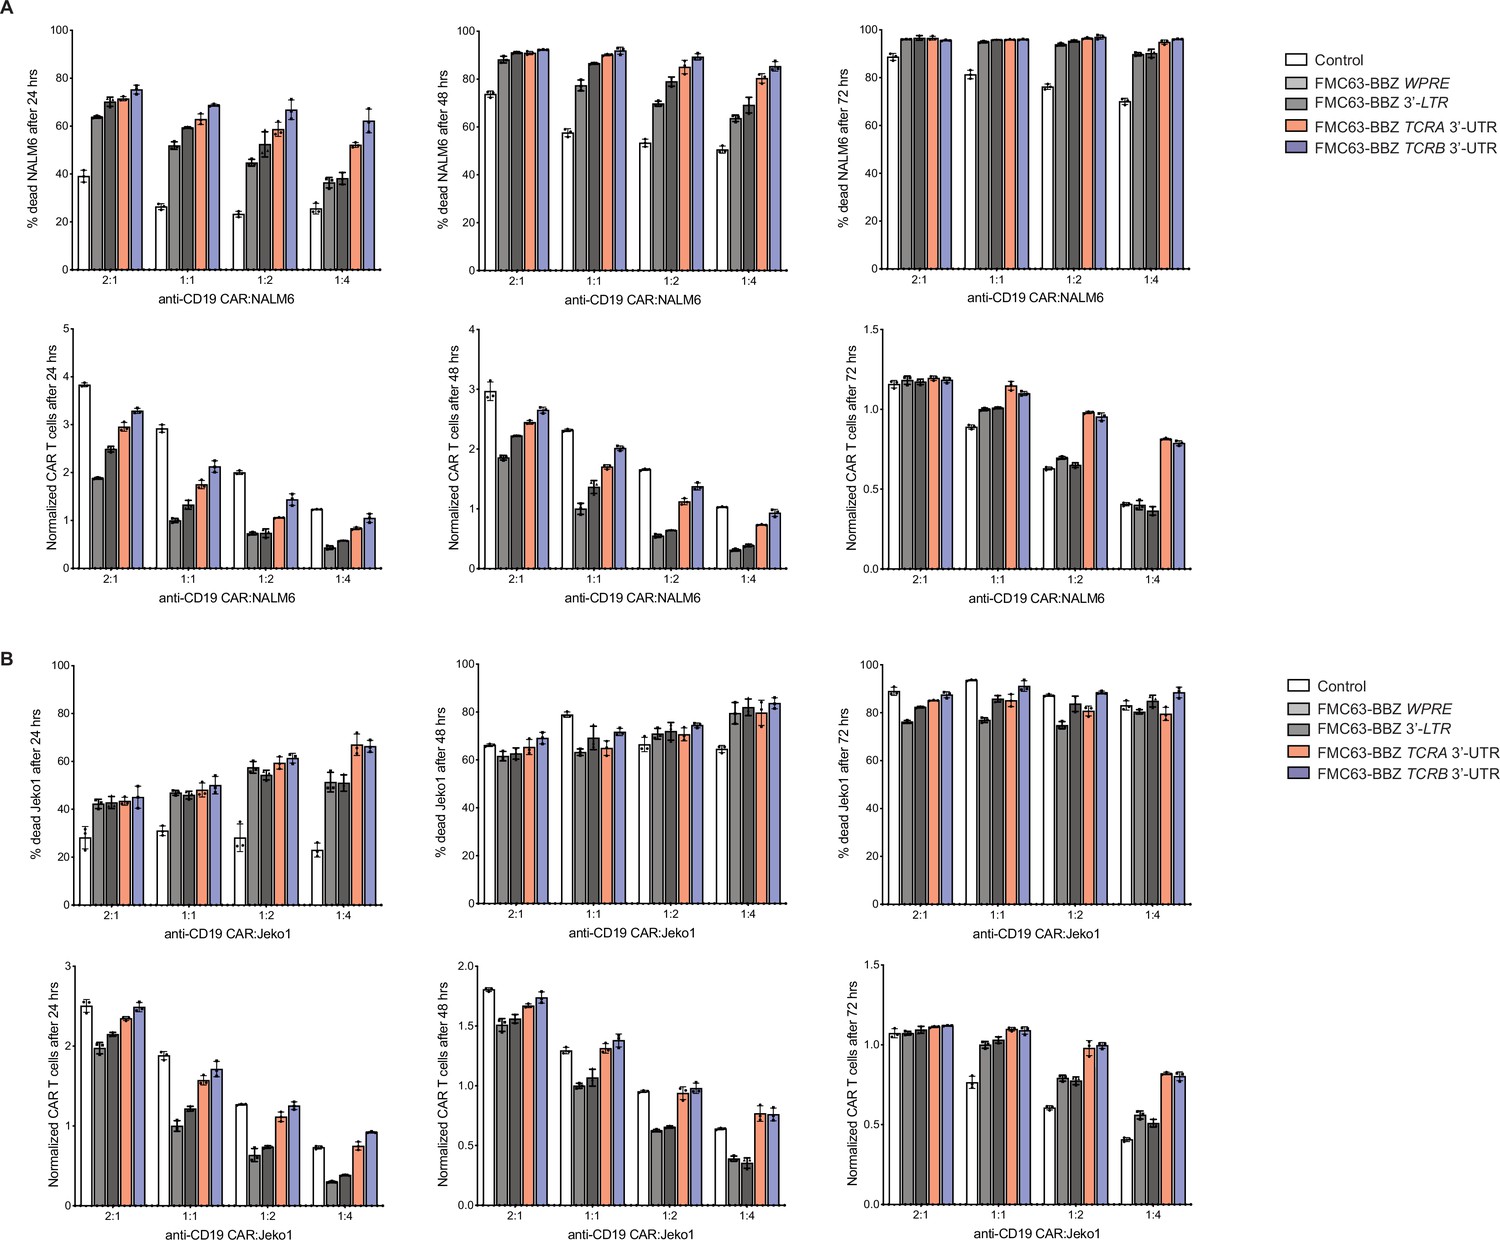
Anti-CD19 CAR T cell killing assays for T cells propagated in 500 U/mL IL2, donor 1.
(A) Top panels, cytotoxic activity of FMC63-BBZ CARs fused to various 3’-UTRs described in Figure 6B after incubating with NALM6 cells for 24, 48, and 72 hr. Bottom panels, CAR T cells present in the experiments at the different time points, normalized to the WPRE CAR T cells at a 1:1 ratio with target tumor cells. (B) Top panels, cytotoxic activity of FMC63-BBZ CARs fused to various 3’-UTRs described in Figure 6B after incubating with Jeko 1 cells for 24, 48, and 72 hr. Bottom panels, CAR T cells present in the experiments at the different time points, normalized to the WPRE CAR T cells at a 1:1 ratio with target tumor cells. These are results for one of two donors with T cells propagated in 500 U/mL IL2 (n = 3 separate wells, with mean and standard deviations shown).
Figure 6—figure supplement 4

Anti-CD19 CAR T cell killing assays for T cells propagated in 500 U/mL IL2, donor 2.
(A) Top panels, cytotoxic activity of FMC63-BBZ CARs fused to various 3’-UTRs described in Figure 6B after incubating with NALM6 cells for 24, 48, and 72 hr. Bottom panels, CAR T cells present in the experiments at the different time points, normalized to the WPRE CAR T cells at a 1:1 ratio with target tumor cells. (B) Top panels, cytotoxic activity of FMC63-BBZ CARs fused to various 3’-UTRs described in Figure 6B after incubating with Jeko 1 cells for 24, 48, and 72 hr. Bottom panels, CAR T cells present in the experiments at the different time points, normalized to the WPRE CAR T cells at a 1:1 ratio with target tumor cells. These are results for the second of two donors with T cells propagated in 500 U/mL IL2 (n = 3 separate wells, with mean and standard deviations shown). Cells expressing the anti-CD19 CAR using the TCRA 3’-UTR were lost due to a failed transduction.
Figure 6—figure supplement 5
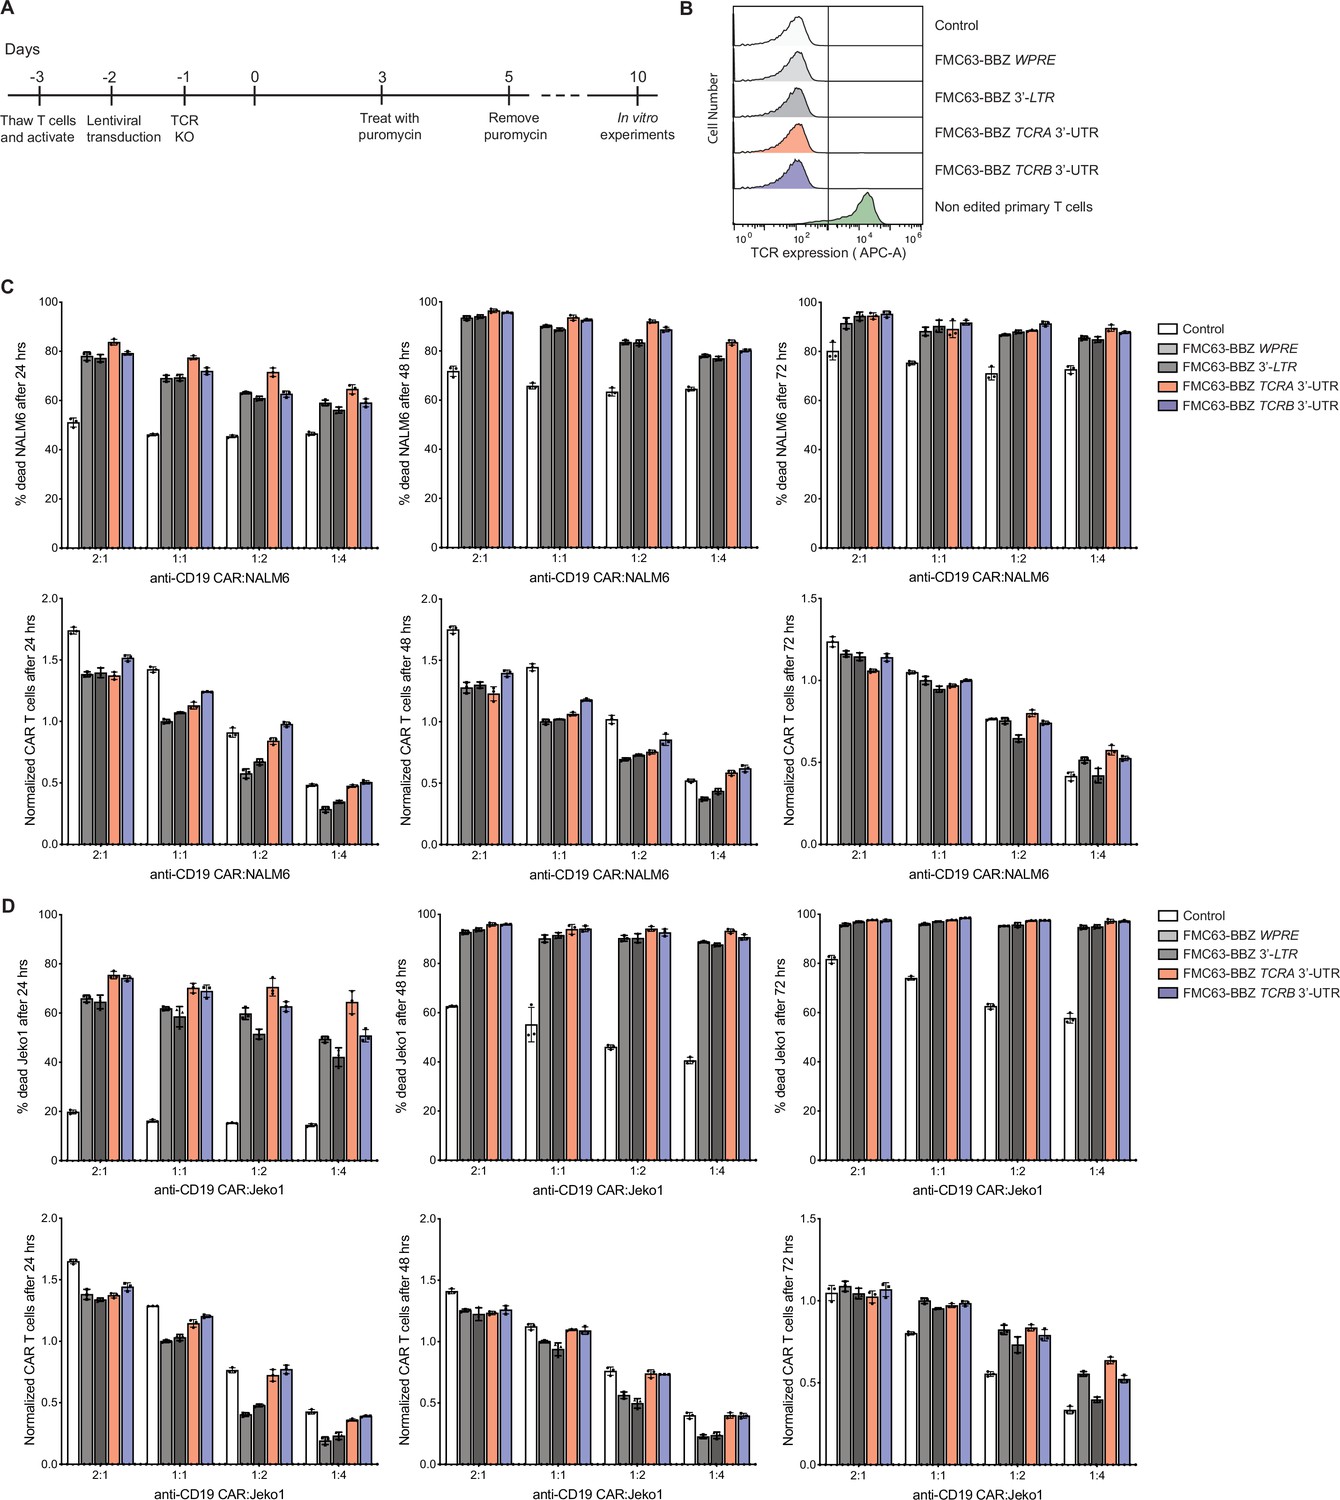
Effects of the TCRA and TCRB mRNA 3’-UTR elements on CAR T cell function, in cells with TCR expression knocked out.
(A) Timeline of CAR T cell generation from primary human T cells and the experiments performed. (B) Expression levels of the TCR in CAR T cells after editing of the TCRA CDS (see Methods). (C) Top panels, cytotoxic activity of FMC63-BBZ CARs fused to various 3’-UTRs described in Figure 6B after incubating with NALM6 cells for 24, 48, and 72 hr. Bottom panels, CAR T cells present in the experiments at the different time points, normalized to the WPRE CAR T cells at a 1:1 ratio with target tumor cells. (D) Top panels, cytotoxic activity of FMC63-BBZ CARs fused to various 3’-UTRs described in Figure 6B after incubating with Jeko 1 cells for 24, 48, and 72 hr. Bottom panels, CAR T cells present in the experiments at the different time points, normalized to the WPRE CAR T cells at a 1:1 ratio with target tumor cells. These are results for one donor with T cells propagated in 50 U/mL IL2 (n = 3 separate wells, with mean and standard deviations shown).
Figure 6—figure supplement 6
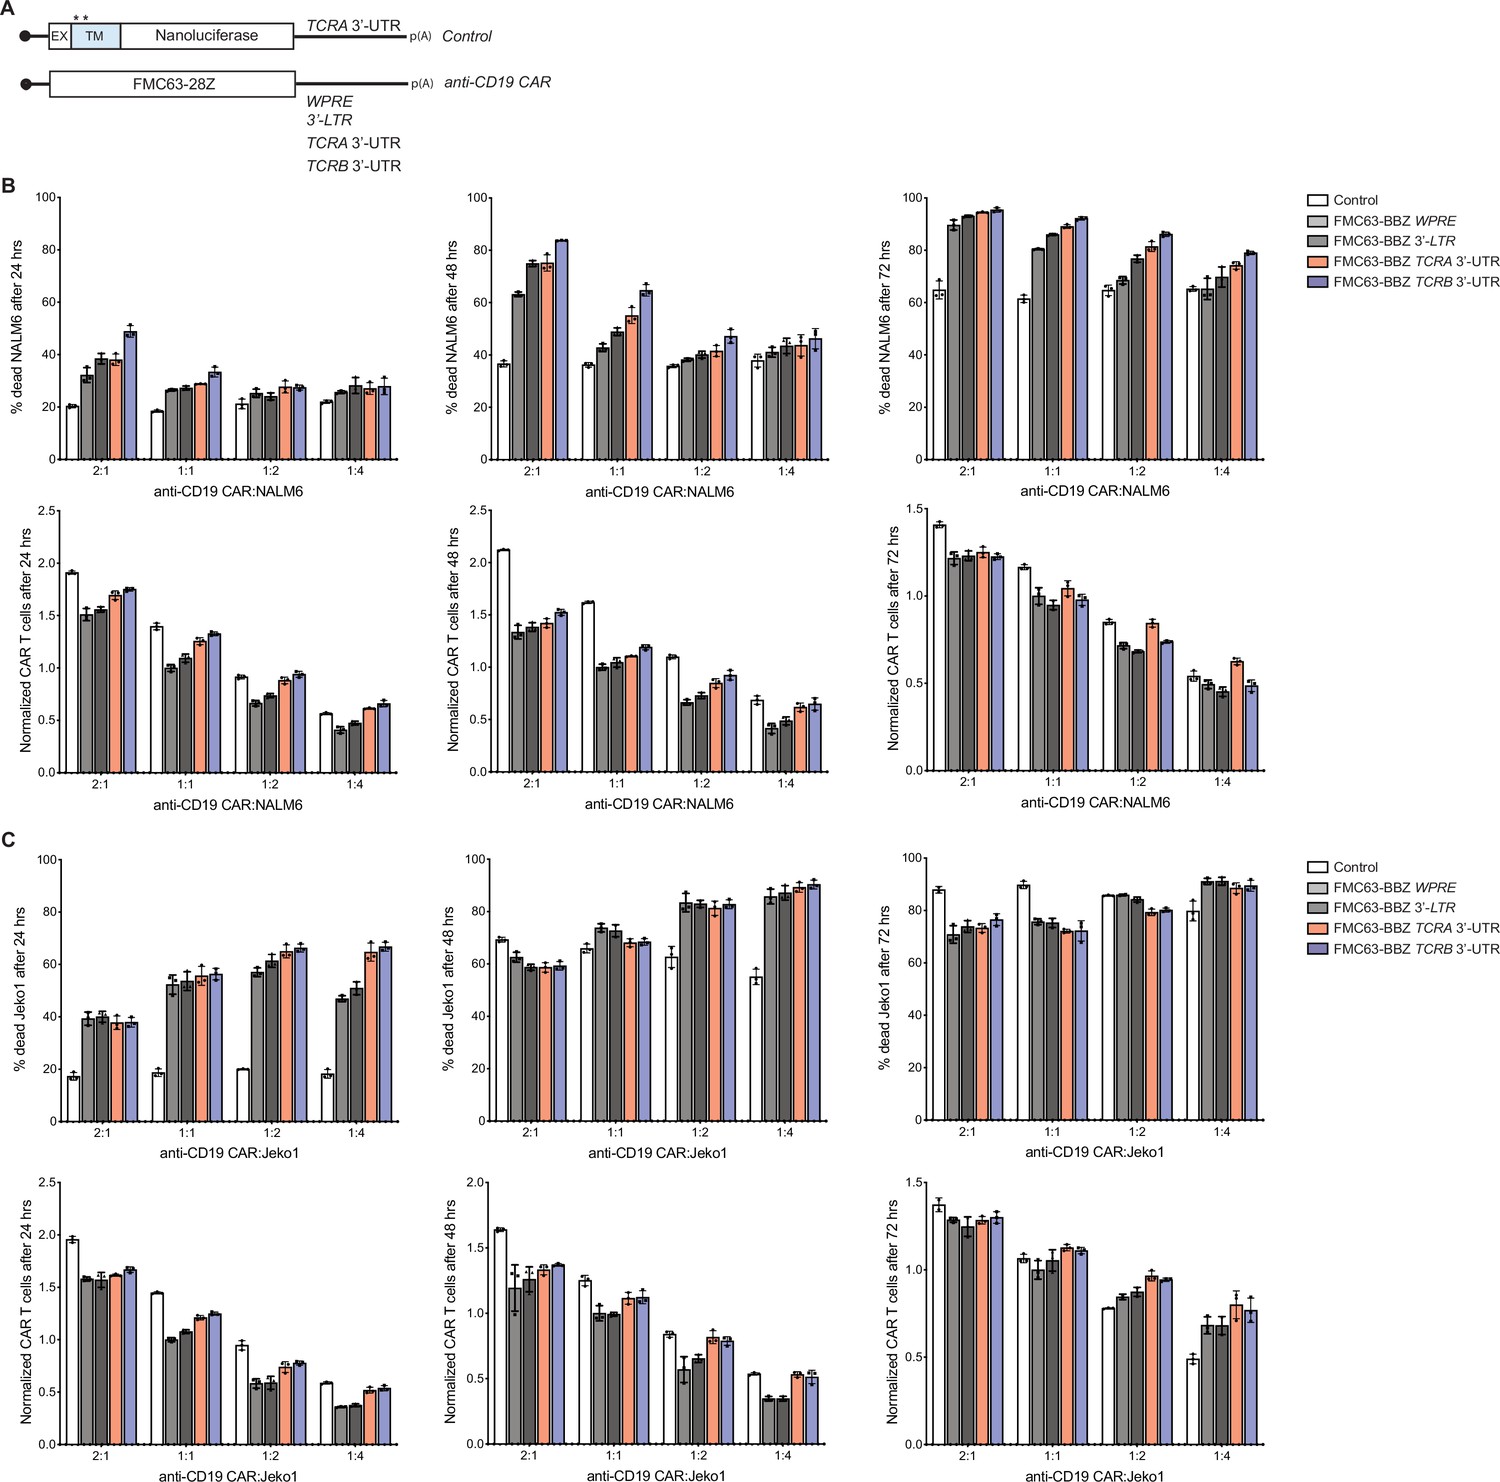
Effects of the TCRA and TCRB mRNA 3’-UTR elements on CAR T cell function for T cells expressing an FMC63-28Z CAR.
(A) Schematic of FMC63-28Z CAR cDNA sequence fused 5’ of the WPRE, 3’-LTR, TCRA 3’-UTR or TCRB 3’-UTR. The membrane-tethered nanoluciferase reporter with TCRA 3’-UTR was used as a control for the effects of lentiviral expression. (B) Top panels, cytotoxic activity of FMC63-28Z CARs fused to various 3’-UTRs described in panel A after incubating with NALM6 cells for 24, 48, and 72 hr. Bottom panels, CAR T cells present in the experiments at the different time points, normalized to the WPRE CAR T cells at a 1:1 ratio with target tumor cells. (C) Top panels. cytotoxic activity of FMC63-28Z CARs fused to various 3’-UTRs described in panel A after incubating with Jeko 1 cells for 24, 48, and 72 hr. Bottom panels, CAR T cells present in the experiments at the different time points, normalized to the WPRE CAR T cells at a 1:1 ratio with target tumor cells. These are results from one donor with T cells propagated in 500 U/mL IL2 (n = 3 separate wells, with mean and standard deviations shown).
Figure 7
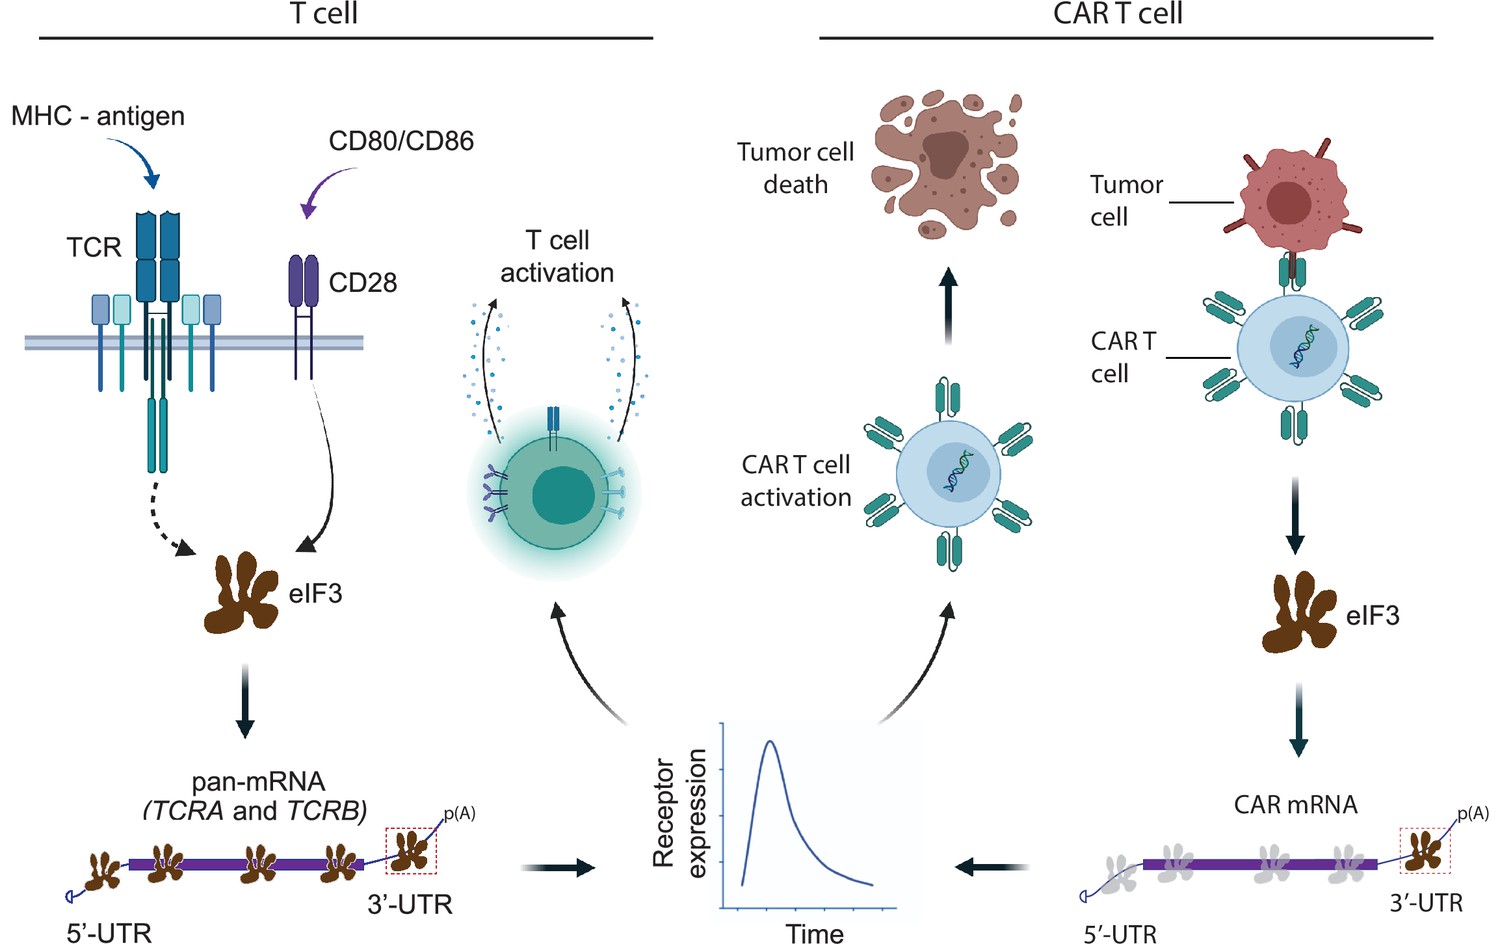
Model for robust T cell activation and improved CAR T cell function mediated by eIF3 interactions with the TCRA and TCRB mRNAs.
Left, a T cell activated upon antigen recognition by the TCR and CD28 costimulatory signal leads to recruitment of the TCRA and TCRB mRNAs to translating ribosomes due to eIF3 binding to the mRNA 3’-UTRs. This results in a short burst in TCRA and TCRB translation followed by a robust increase in T cell function as measured by CD69 and CD25 expression and cytokine release. Right, activation of CAR T cells expressing CAR mRNAs with the TCRA or TCRB 3’-UTRs leads to a burst in CAR translation and improved tumor cell killing.
Author response image 1
Additional files
-
Supplementary file 1
Subunits in eIF3 crosslinked to RNA in activated Jurkat cells.
Lists the eIF3 subunits, percent sequence coverage and number of identified peptides.
- https://cdn.elifesciences.org/articles/74272/elife-74272-supp1-v2.xlsx
-
Supplementary file 2
PARpipe statistics for eIF3 PAR-CLIP samples.
Samples are indexed in the first tab, including both biological replicates for activated and non-activated Jurkat cells. Statistics are given for each library at the read, cluster and group level.
- https://cdn.elifesciences.org/articles/74272/elife-74272-supp2-v2.xlsx
-
Supplementary file 3
PAR-CLIP mapping to individual genes for each eIF3 PAR-CLIP sample.
Samples are indexed in the first tab, including both biological replicates for activated and non-activated Jurkat cells. First lists the gene name and number of clusters identified. The statistics also include: Sum, sum of that statistic over all sites for that gene; Med, median of that statistic for all sites for that gene; ReadCount, total reads mapping to the gene; T2C fraction, number of reads with T-to-C conversions / number of reads; ConversionSpecificity, log (number of reads with T-to-C conversions / number of reads with other conversions); UniqueReads, reads collapsed to single copies. Also included: 5'utr/Intron/Exon/3'utr/Start_codon/Stop_codon, number of sites mapping to that annotation category; Junction, number of sites mapping to a junction between categories (coding-intron, coding-3'utr, etc.); GeneType, as described in the gene_type category for this gene in the.gtf file used.
- https://cdn.elifesciences.org/articles/74272/elife-74272-supp3-v2.xlsx
-
Supplementary file 4
Transcriptome analysis of non-activated or activated Jurkat cells.
Each tab lists transcript name and version, gene name, type of transcript, length of transcript, and mean transcripts per million, calculated from two biological replicates.
- https://cdn.elifesciences.org/articles/74272/elife-74272-supp4-v2.xlsx
-
Supplementary file 5
Pathway enrichment analysis.
Lists for both biological replicates of the EIF3A/C/B PAR-CLIP libraries are included (genes with ≥ 100 reads), along with associated transcript names, lengths in nts of the 5’-UTR, coding region, and 3’-UTR, and reads normalized to the lengths of the transcript regions. Tabs also include the top tissue-specific pathway enrichment categories determined using the STRING Database. These list: the Gene Ontology (GO) number, GO description, observed gene count, background gene count, false discovery rate, and matching proteins in the network by Ensembl protein ID, and by gene name.
- https://cdn.elifesciences.org/articles/74272/elife-74272-supp5-v2.xlsx
-
Supplementary file 6
Reagent information for experiments.
Lists include antibodies used, PCR primers, qPCR primers, gRNA targeting sequences, and FISH probes, and DNA oligos for RNase H experiments.
- https://cdn.elifesciences.org/articles/74272/elife-74272-supp6-v2.xlsx
-
Transparent reporting form
- https://cdn.elifesciences.org/articles/74272/elife-74272-transrepform1-v2.docx
-
Source data 1
Original western blots for main figures and figure supplements.
Boxed regions are the regions shown in the figures.
- https://cdn.elifesciences.org/articles/74272/elife-74272-supp7-v2.zip
-
Source data 2
Spreadsheets with numerical data used in figures and figure supplements.
- https://cdn.elifesciences.org/articles/74272/elife-74272-supp8-v2.zip
Download links
A two-part list of links to download the article, or parts of the article, in various formats.
Downloads (link to download the article as PDF)
Open citations (links to open the citations from this article in various online reference manager services)
Cite this article (links to download the citations from this article in formats compatible with various reference manager tools)
Robust T cell activation requires an eIF3-driven burst in T cell receptor translation
eLife 10:e74272.
https://doi.org/10.7554/eLife.74272


