Molecular features underlying differential SHP1/SHP2 binding of immune checkpoint receptors
- Section of Cell & Developmental Biology, Division of Biological Sciences, University of California, San Diego, United States
- Division of Life Science, State Key Laboratory of Molecular Neuroscience, Hong Kong University of Science and Technology, China
Figures
Figure 1 with 1 supplement
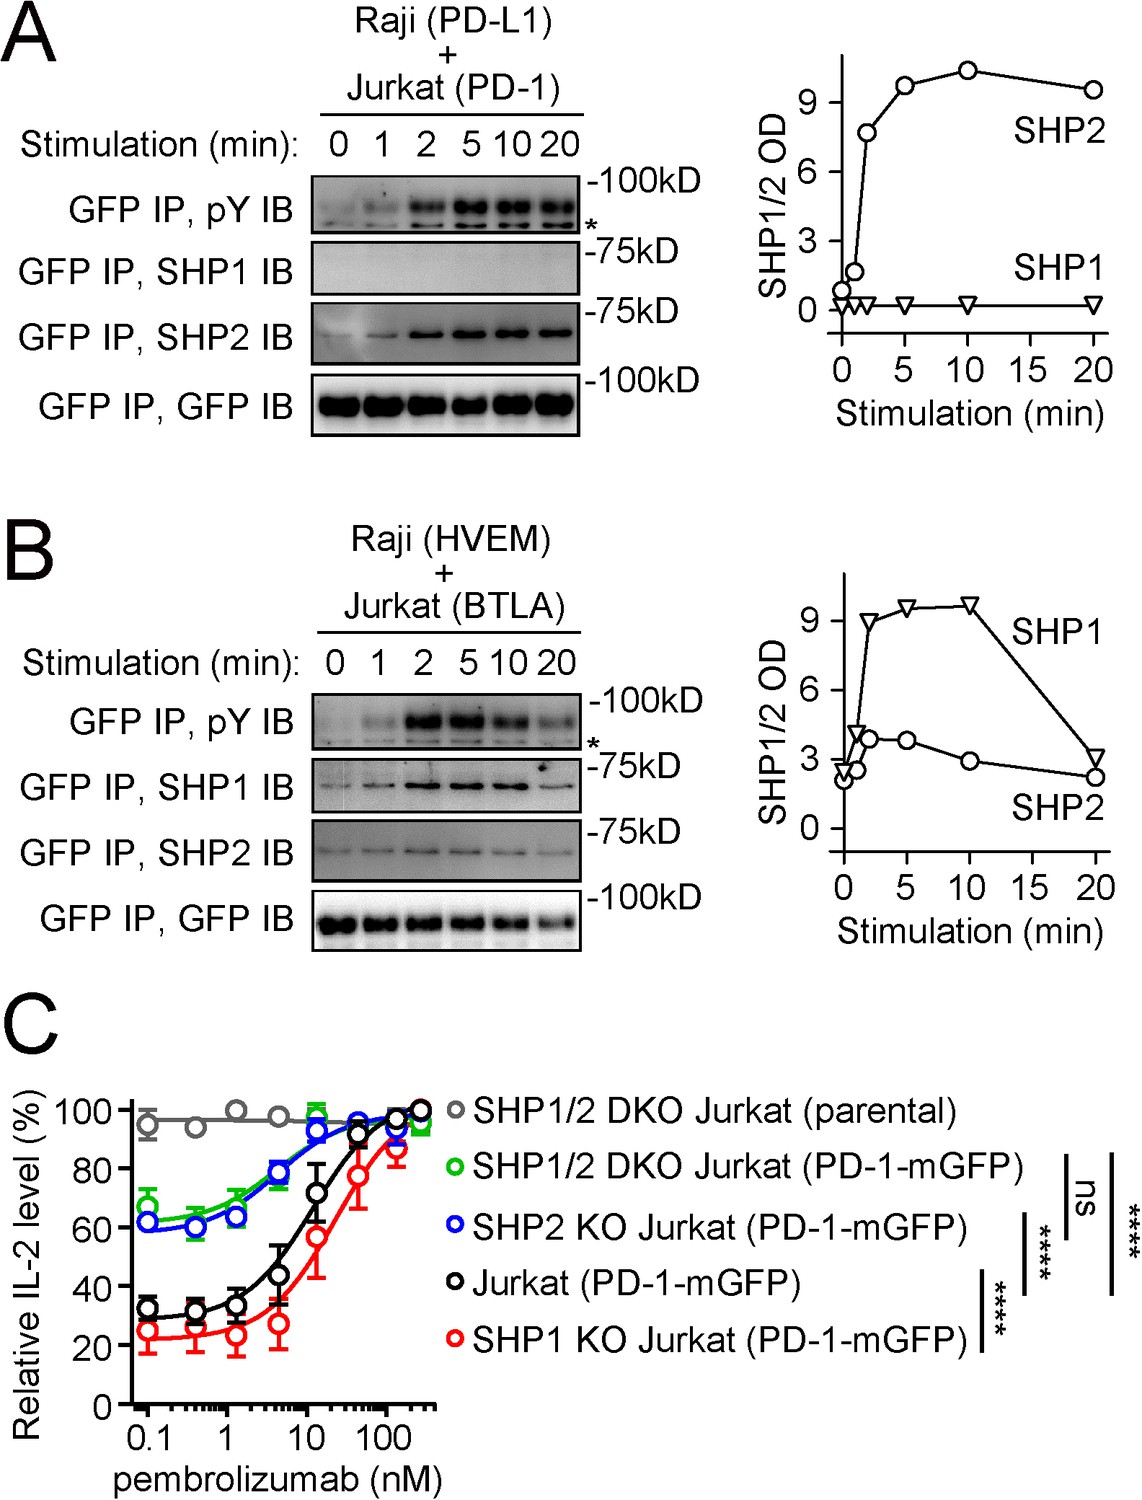
PD-1 recruits and signals through SHP2, but not SHP1, whereas BTLA prefers to recruit SHP1.
(A, B) Left are representative immunoblots (IBs) showing the levels of bound SHP1 and SHP2 in PD-1-mGFP (A) or BTLA-mGFP (B) pulled down by GFP IP from indicated cell lysates, with the duration of stimulation prior to lysis indicated (see Materials and methods). IBs of GFP and phosphotyrosines (pY) of the same samples were shown to indicate PD-1 or BTLA input and their degrees of phosphorylation. Right are quantification graphs. (C) Relative IL-2 levels produced by PD-1-mGFP-expressing WT, SHP1 KO, SHP2 KO, or SHP1/2 DKO Jurkat cells stimulated with PD-L1-mCherry-expressing Raji cells in the presence of increasing concentrations of pembrolizumab (0, 0.4, 1.3, 4.4, 13.3, 44, 133, or 267 nM). For each type of Jurkat cells, IL-2 data were normalized to the condition with the highest IL-2 value in each replicate. Error bars are s.d. from three independent coculture assays run in three different days, with each assay run in technical triplicates. ****p<0.0001; ns, not significant; two-way ANOVA test.
-
Figure 1—source data 1
Uncropped IBs for data shown in Figure 1A and B.
- https://cdn.elifesciences.org/articles/74276/elife-74276-fig1-data1-v2.pdf
-
Figure 1—source data 2
Raw data for Figure 1 graphs.
- https://cdn.elifesciences.org/articles/74276/elife-74276-fig1-data2-v2.xlsx
Figure 1—figure supplement 1
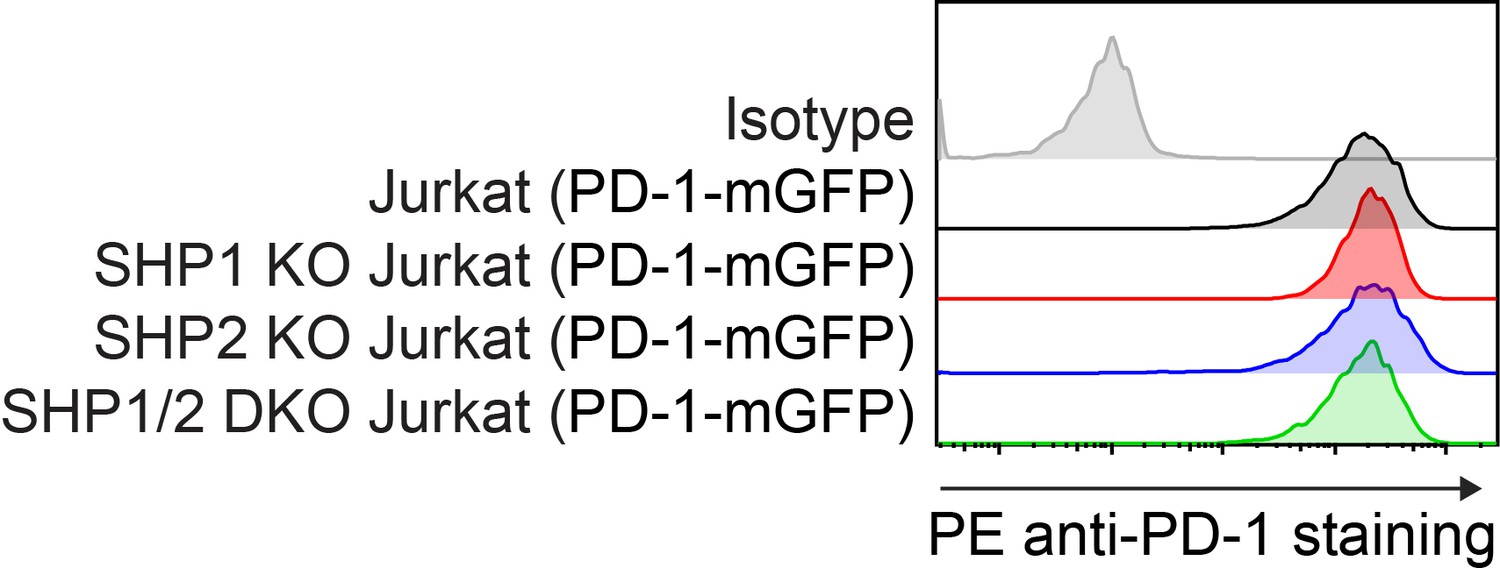
Flow cytometry histograms.
Flow cytometry histograms showing cell surface expressions of PD-1 in indicated Jurkat cells.
Figure 2 with 1 supplement
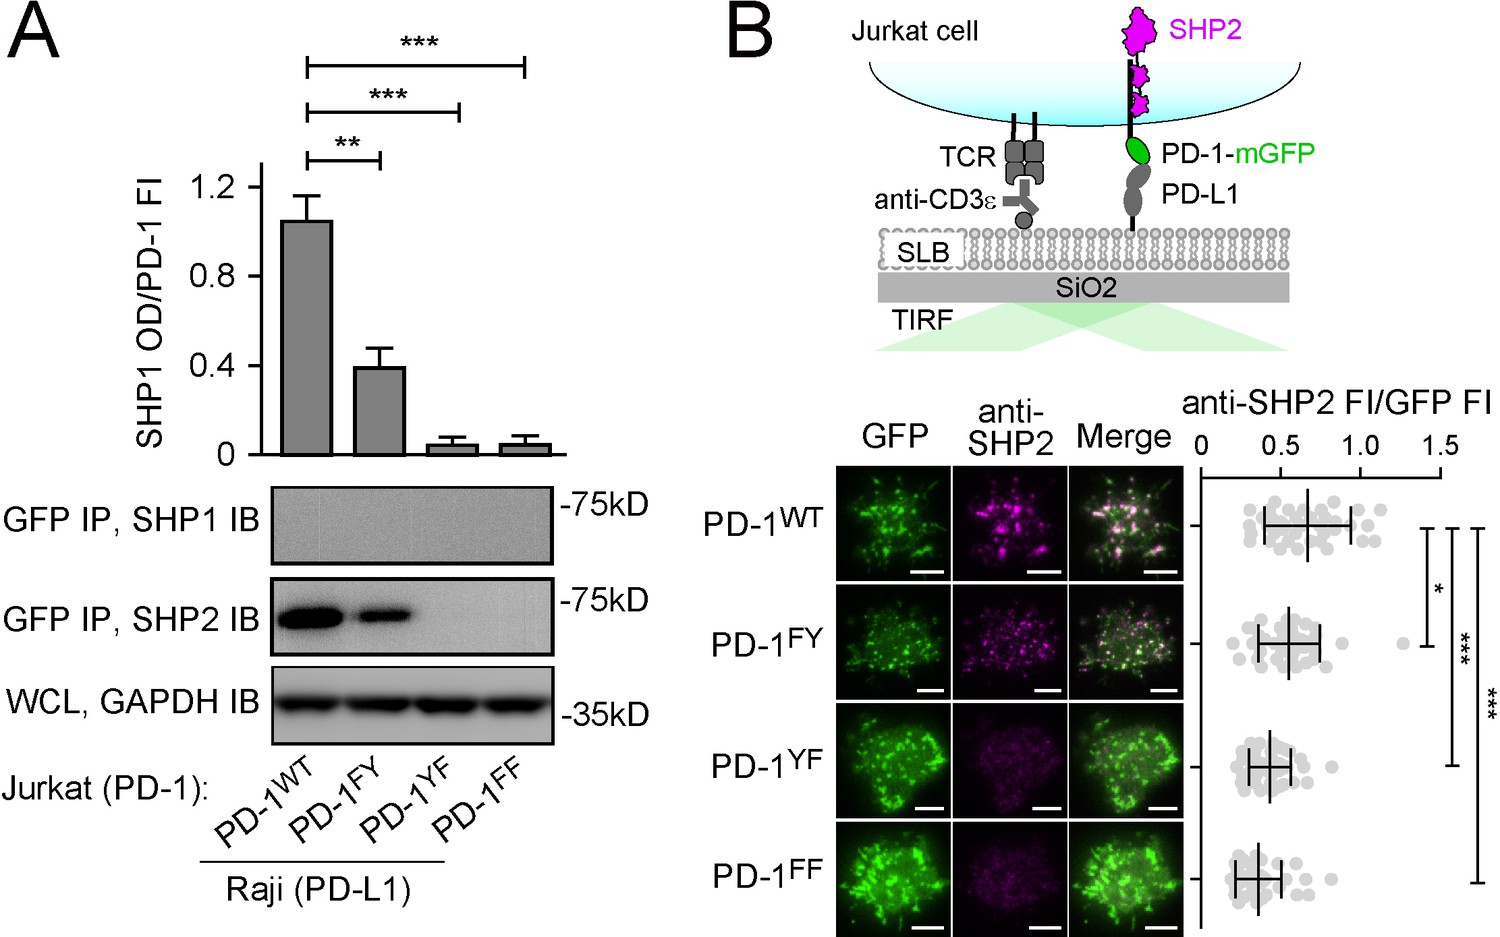
Both immunoreceptor tyrosine-based inhibitory motif (ITIM) and immunoreceptor tyrosine-based switch motif (ITSM) contribute to the ability of PD-1 to recruit SHP2.
(A) Representative immunoblots (IBs) showing the levels of SHP1 and SHP2 bound to mGFP-tagged PD-1 variants pulled down from the indicated coculture lysates via GFP IP. GAPDH IB of the whole cell lysates (WCL) served as a loading control (see Materials and methods). Bar graphs on top summarize SHP2 optical density (OD) normalized to the fluorescence intensity (FI) of each PD-1 variant, based on flow cytometry data in Figure 2—figure supplement 1. Error bars are s.d. from three independent coculture experiments performed on different days. (B) Upper: a cartoon depicting a PD-1-mGFP-expressing Jurkat cell in contact with a supported lipid bilayer (SLB) containing anti-CD3ε and PD-L1ECD. Lower left: representative TIRF images of both PD-1 (GFP) and endogenous SHP2 (stained with anti-SHP2) in an SLB-associated Jurkat expressing indicated PD-1 variants. Lower right: dot plots summarizing anti-SHP2 FI normalized to GFP FI of 40 Jurkat cells under each condition recorded on the same day with the same microscope setting (see Materials and methods); Error bars: s.d. Scale bars: 5 µm. *p<0.05; **p<0.01; ***p< 0.001; ns, not significant; Student’s t-test.
-
Figure 2—source data 1
Uncropped IBs for data shown in Figure 2A.
- https://cdn.elifesciences.org/articles/74276/elife-74276-fig2-data1-v2.pdf
-
Figure 2—source data 2
Raw data for quantification graphs in Figure 2.
- https://cdn.elifesciences.org/articles/74276/elife-74276-fig2-data2-v2.xlsx
Figure 2—figure supplement 1
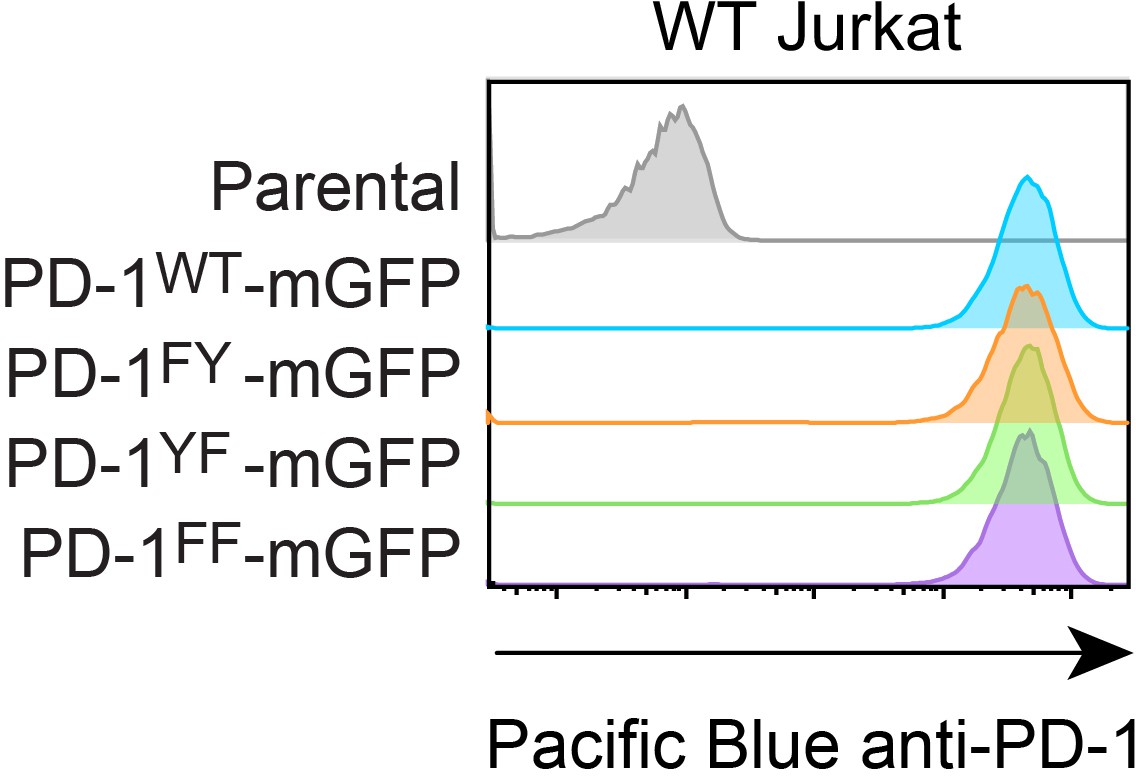
Flow cytometry histograms.
Flow cytometry histograms showing cell surface expressions of PD-1 variants in indicated Jurkat cells.
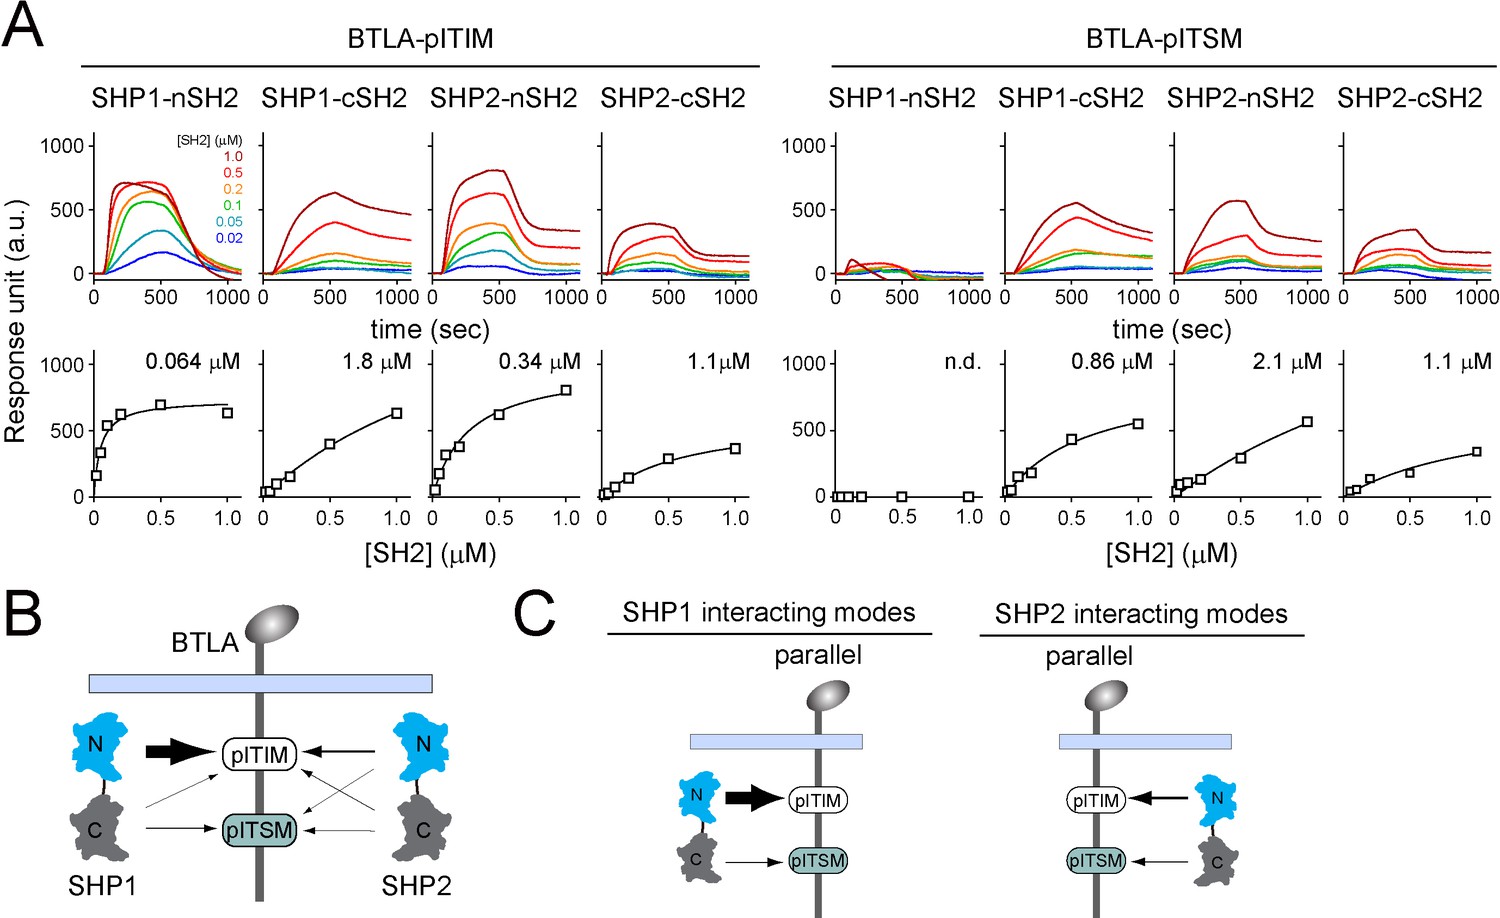
Figure 3 with 1 supplement
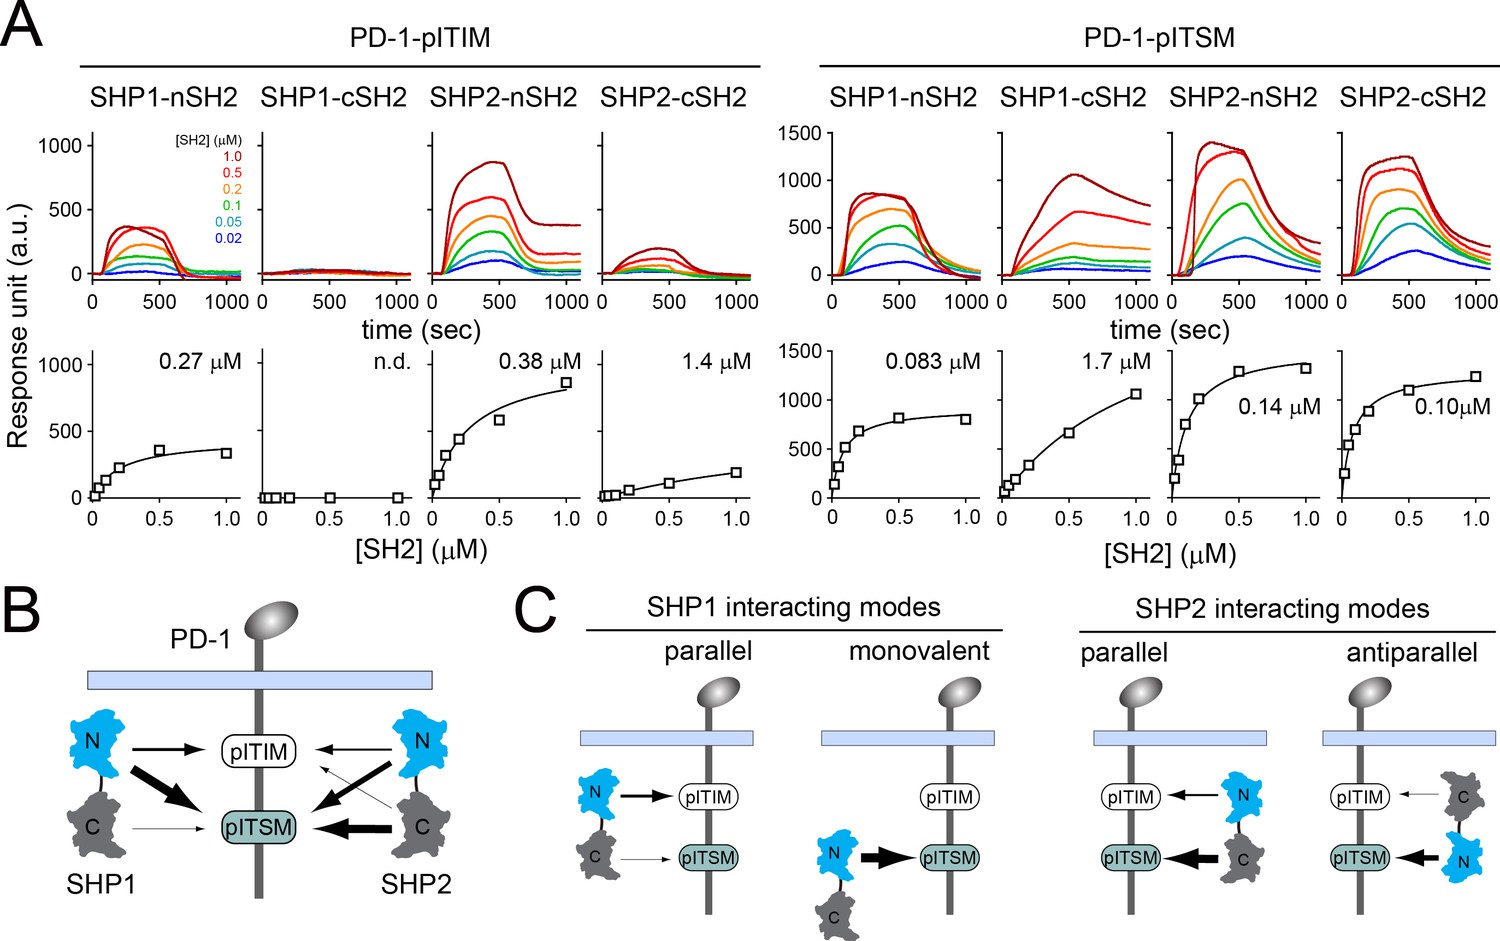
Surface plasmon resonance (SPR) measurements of binding between individual SH2 of SHP1 or SHP2 and immunoreceptor tyrosine-based inhibitory motif (ITIM) or immunoreceptor tyrosine-based switch motif (ITSM) of PD-1.
(A) SPR sensorgrams (top) and the derived equilibrium-binding curves (bottom) showing the interactions of indicated SH2 and phosphorylated PD-1-ITIM (PD-1YF) or PD-1-ITSM (PD-1FY) immobilized onto Ni sensor chips. Individual SH2 proteins were injected at 20, 50, 100, 200, 500, and 1000 nM. Shown are representative of three independent experiments performed on three different sensorchips on three different days. The calculated Kd values are indicated in the binding curves. (B) A cartoon depicting relative binding affinities of SHP1/SHP2 individual SH2 to PD-1-ITIM/ITSM, with the thickness of arrows matching the relative affinities calculated from the SPR data in (A). (C) Possible interacting modes of SHP1/SHP2-tSH2 with PD-1.
-
Figure 3—source data 1
Uncropped SDS-PAGE gel images for Figure 3—figure supplement 1A.
- https://cdn.elifesciences.org/articles/74276/elife-74276-fig3-data1-v2.pdf
-
Figure 3—source data 2
Raw data for Figure 3 and Figure 3—figure supplement 1.
- https://cdn.elifesciences.org/articles/74276/elife-74276-fig3-data2-v2.xlsx
Figure 3—figure supplement 1
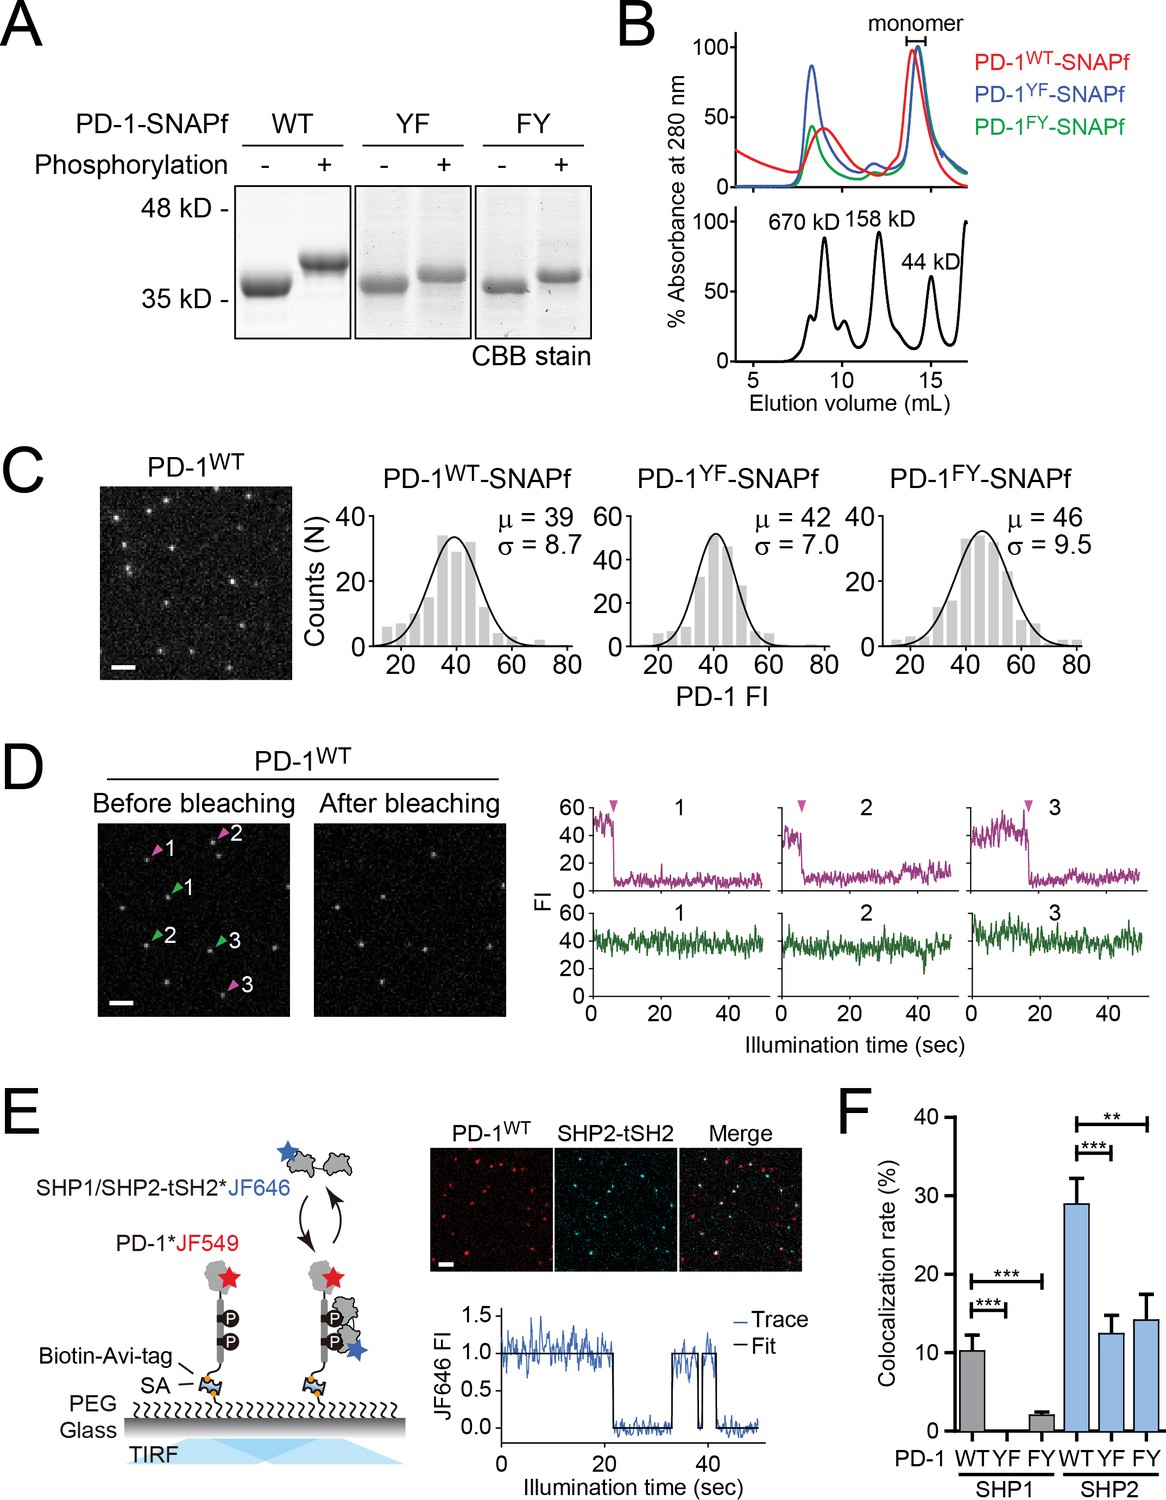
Single-molecule imaging monitoring SHP1/SHP2-tSH2 binding to PD-1 variants.
(A) Coomassie-stained SDS-PAGE images showing the shift of electrophoretic mobilities of indicated PD-1 variants after phosphorylation. (B) Size-exclusion chromatograms of phosphorylated PD-1 variants (top) and protein standards with their molecular weights labeled in kilo Dalton (kD, bottom). The monomeric fractions used for single-molecule imaging assays are indicated. (C) Left: a representative TIRF image showing JF646-labeled PD-1 single molecules. Right: histograms summarizing the fluorescence intensity (FI) of individual molecules of PD-1 in the TIRF image. Mean (µ) and s.d. (σ) of the Gaussian fit are indicated distribution. Scale bar: 2 µm. (D) Left: representative TIRF images showing JF646-labeled PD-1 single molecules before and after photobleaching. The bleached and unbleached spots are indicated with purple and green arrowheads, respectively. Right: fluorescence time trajectories of bleached (purple) and non-bleached (green) spots, with the bleaching moments indicated with arrowheads. Scale bar: 2 µm. (E) Left: a cartoon depicting the setup of the single-molecule imaging assay. Each of the pre-phosphorylated, biotinylated, and JF549-labeled PD-1 variants was immobilized onto a biotin-PEG-coated coverslip. The FIs of PD-1 molecules and the bound JF646-labeled SHP1/SHP2-tSH2 were monitored by TIRF-M. Right: representative TIRF images showing the PD-1WT and SHP2-tSH2 single molecules (top), and a representative time trajectory showing SHP2-tSH2 binding and unbinding from PD-1WT (bottom). Scale bar: 2 µm. (F) Bar graphs summarizing the % of PD-1 molecules associated with SHP1-tSH2 or SHP2-tSH2 (see Materials and methods). Error bars are s.d. from 3 to 5 independent experiments performed on different days using the same microscope setting. **p<0.01; ***p<0.001; Student’s t-test.
Figure 4 with 1 supplement

Swapping the cSH2 of SHP1 with that of SHP2 induced PD-1:SHP1 association in T cells.
(A) Left: sequence alignment of cSH2 of human and mouse SHP1/SHP2. The underlying dots denote SHP2-cSH2 residues that participate in PD-1-pITSM binding, according to NMR structure of PD-1-pITSM:SHP2-cSH2 complex (PDB code: 6R5G): black dots highlight residues that are conserved in SHP1-cSH2; blue dots highlight residues that are not conserved in SHP1-cSH2. Right: NMR structure of PD-1-pITSM:SHP2-cSH2 complex (PDB code: 6R5G) with PD-1 depicted in a stick model and SHP2-cSH2 showed in a ribbon diagram, in which the blue-dot-denoted residues in the sequence alignment are highlighted in blue sticks. (B) Left: diagram showing the design of mCherry-tagged, SH2-swapped SHP1 variants, with one or both of its SH2 replaced with that of SHP2. Middle: representative TIRF images of PD-1 (GFP) and SHP1 variants (mCherry) in supported lipid bilayer (SLB)-associated SHP1/2 DKO Jurkat cells expressing PD-1-mGFP and mCherry-SHP1 variants. Right: dot plots summarizing mCherry fluorescence intensity (FI) normalized to GFP FI of 40 Jurkat cells under each condition recorded on the same day with the same microscope setting. Error bars: s.d. Scale bars: 5 µm. (C) Representative immunoblots (IBs) of mCherry-SHP1 variants co-precipitated with PD-1-mGFP from indicated cell lysates. IBs of GFP indicate PD-1 input. IBs of phosphotyrosines (pY) indicate PD-1 phosphorylation. Bar graphs summarize optical density (OD) of SHP1 variants normalized to the FI of PD-1, based on flow cytometry data in Figure 4—figure supplement 1. Error bars are s.d. from three independent coculture experiments performed on different days. *p<0.05; **p<0.01; ***p<0.001; ns, not significant; Student’s t-test.
-
Figure 4—source data 1
Uncropped IBs for data shown in Figure 4C.
- https://cdn.elifesciences.org/articles/74276/elife-74276-fig4-data1-v2.pdf
-
Figure 4—source data 2
Raw data for quantification graphs in Figure 4.
- https://cdn.elifesciences.org/articles/74276/elife-74276-fig4-data2-v2.xlsx
Figure 4—figure supplement 1
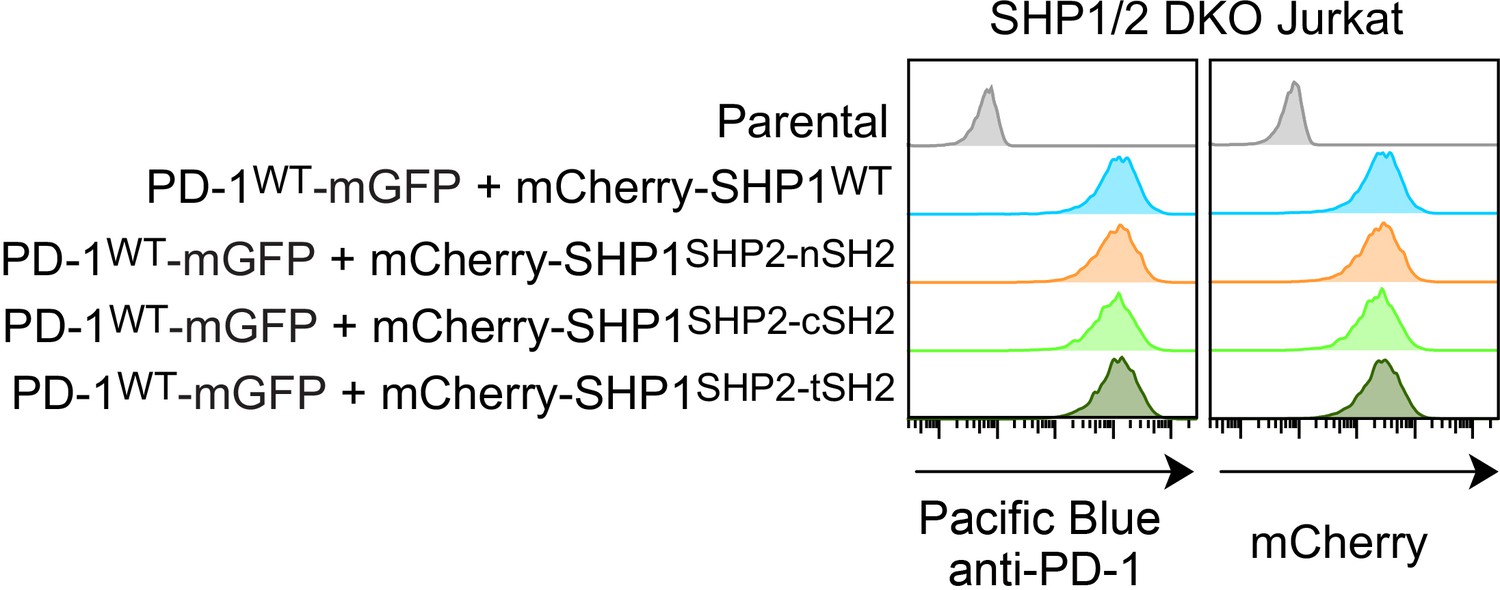
Flow cytometry histograms.
Flow cytometry histograms showing cell surface expression of PD-1 and total expressions of indicated SHP1 variants in SHP1/2 DKO Jurkat cells.
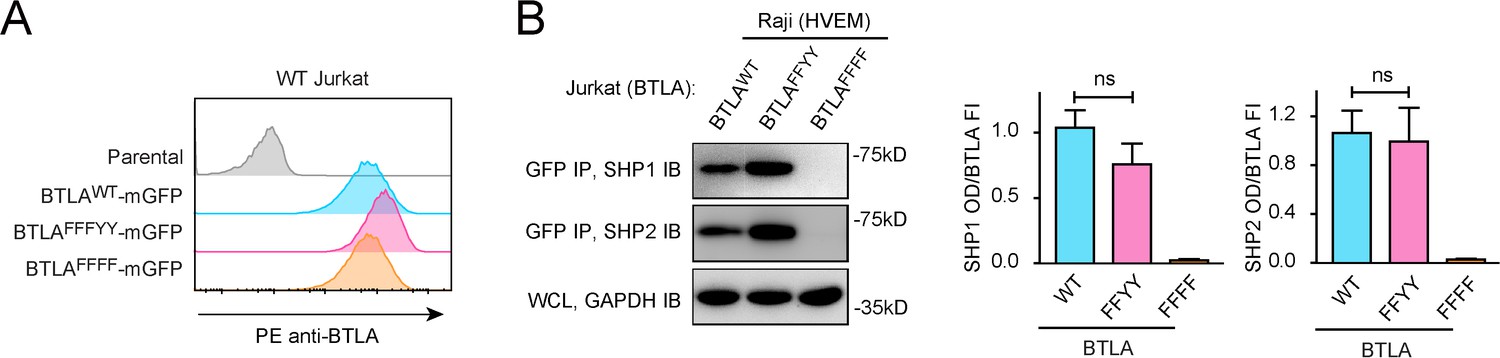
Figure 5 with 1 supplement
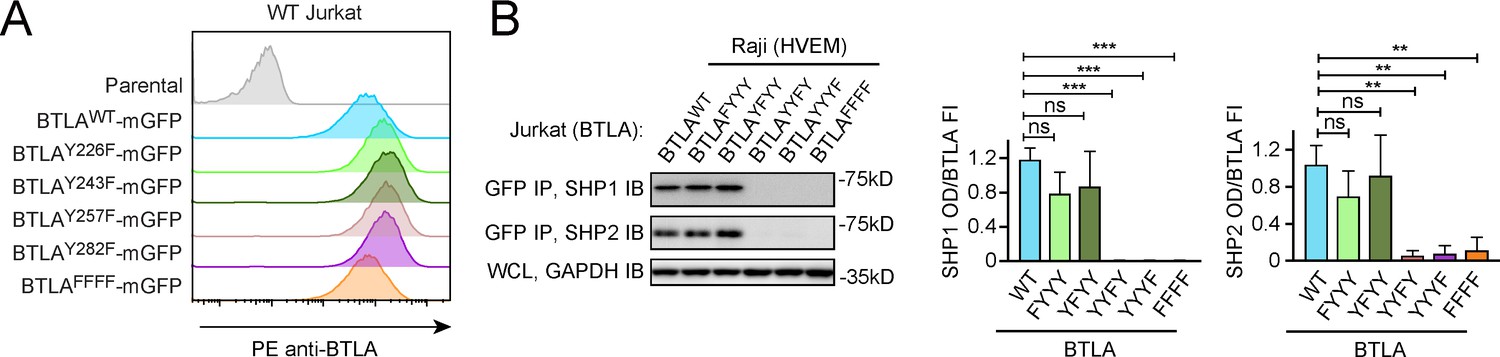
Both immunoreceptor tyrosine-based inhibitory motif (ITIM) and immunoreceptor tyrosine-based switch motif (ITSM) are required for BTLA to recruit SHP1/SHP2.
(A) Flow cytometry histograms showing BTLA surface expressions in the indicated Jurkat cells. (B) Left: representative immunoblots (IBs) showing the levels of SHP1 and SHP2 bound to the mGFP-tagged BTLA variants captured by GFP IP. GAPDH IB of the whole cell lysates (WCL) served as a loading control. Right: bar graphs summarizing SHP1 optical density (OD) and SHP2 OD normalized to the fluorescence intensity (FI) of the corresponding BTLA variants, based on flow cytometry data in (A). Error bars are s.d. from three independent coculture experiments performed on different days. **p<0.01; ***p<0.001; ns, not significant; Student’s t-test (n = 3).
-
Figure 5—source data 1
Uncropped IBs for Figure 5B and Figure 5—figure supplement 1B.
- https://cdn.elifesciences.org/articles/74276/elife-74276-fig5-data1-v2.pdf
-
Figure 5—source data 2
Raw data for bar graphs in Figure 5 and Figure 5—figure supplement 1.
- https://cdn.elifesciences.org/articles/74276/elife-74276-fig5-data2-v2.xlsx
Figure 5—figure supplement 1
Y226 and Y243 are dispensable for SHP1/SHP2 recruitment by BTLA.
(A) Flow cytometry histograms showing BTLA surface expressions in the indicated Jurkat cells. (B) Representative immunoblots (IBs) showing the levels of SHP1 and SHP2 bound to the mGFP-tagged BTLA variants captured by GFP IP. GAPDH IB of the whole cell lysates (WCL) served as a loading control. Right: bar graphs summarizing SHP1 optical density (OD) and SHP2 OD normalized to the fluorescence intensity (FI) of the corresponding BTLA variants, based on flow cytometry data in (A). Error bars are s.d. of three independent coculture experiments performed on three different days. ns, not significant in Student’s t-test.
Figure 6
Surface plasmon resonance (SPR) measurements of binding between individual SH2 of SHP1 or SHP2 and immunoreceptor tyrosine-based inhibitory motif (ITIM) or immunoreceptor tyrosine-based switch motif (ITSM) of BTLA.
(A) SPR sensorgrams (top) and the derived equilibrium binding curves (bottom) showing the interactions of indicated SH2 and phosphorylated BTLA-ITIM (BTLA FFYF) or BTLA-ITSM (BTLA FFFY) immobilized to Ni sensor chips. Individual SH2 proteins were injected at 20, 50, 100, 200, 500, and 1000 nM. Shown are representative of three independent experiments performed on three different sensorchips on three different days. The calculated Kd values are indicated in the binding curves. (B) A cartoon depicting relative binding affinities of SHP1/SHP2 individual SH2 to BTLA-ITIM/ITSM, with the thickness of arrows matching the relative affinities calculated from the SPR data in (A). (C) Possible interacting modes of SHP1/SHP2-tSH2 with BTLA.
-
Figure 6—source data 1
Raw data for equilibrium binding curves in Figure 6A.
- https://cdn.elifesciences.org/articles/74276/elife-74276-fig6-data1-v2.xlsx
Figure 7 with 2 supplements
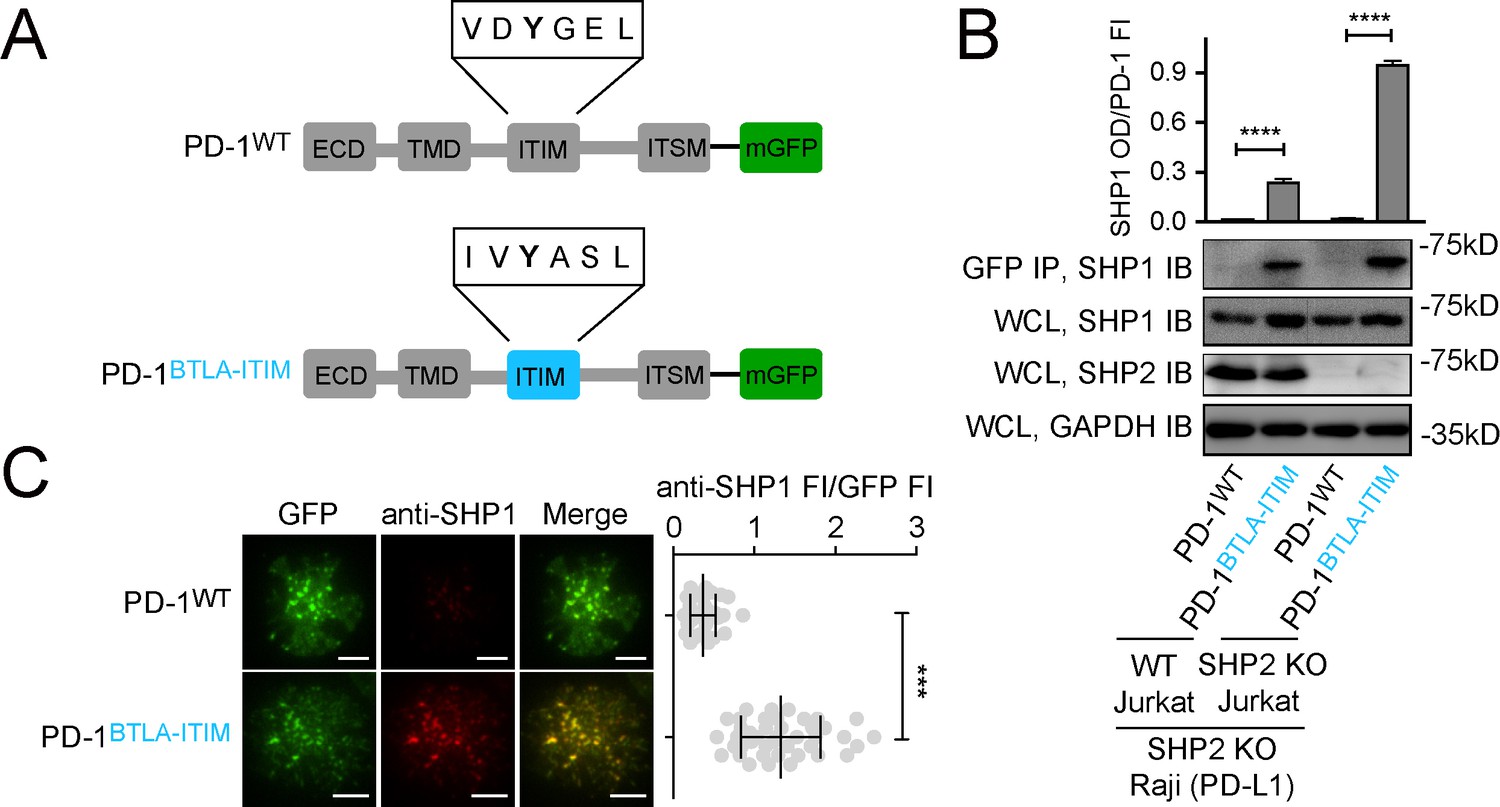
Swapping PD-1-ITIM with BTLA-ITIM induced PD-1:SHP1 interaction in T cells.
(A) Cartoons depicting the domains and motifs of PD-1WT-mGFP and PD-1BTLA-ITIM-mGFP. (B) Representative immunoblots (IBs) showing the levels of SHP1 bound to mGFP-tagged PD-1 variants pulled down from the indicated coculture lysates via GFP IP. SHP1 IB and SHP2 IB of the whole cell lysates (WCL) indicate their inputs. GAPDH IB of the WCL served as a loading control. Bar graphs summarize SHP1 optical density (OD) normalized to the fluorescence intensity (FI) of each PD-1 variant, based on flow cytometry data in Figure 7—figure supplement 1. Error bars are s.d. from three independent coculture experiments performed on three different days. (C) Left: representative TIRF images of both PD-1 (GFP) and endogenous SHP1 (stained with anti-SHP1) in a supported lipid bilayer (SLB)-associated SHP2 KO Jurkat expressing indicated PD-1 variants. Right: dot plots summarizing anti-SHP1 FI normalized to GFP FI of 40 Jurkat cells under each condition recorded on the same day using the same microscope setting; Error bars: s.d. Scale bars: 5 μm. ***p<0.001; ****p<0.0001; Student’s t-test.
-
Figure 7—source data 1
Uncropped IBs for Figure 7B and Figure 7—figure supplement 2B.
- https://cdn.elifesciences.org/articles/74276/elife-74276-fig7-data1-v2.pdf
-
Figure 7—source data 2
Raw data for quantification graphs in Figure 7 and Figure 7—figure supplement 2.
- https://cdn.elifesciences.org/articles/74276/elife-74276-fig7-data2-v2.xlsx
Figure 7—figure supplement 1
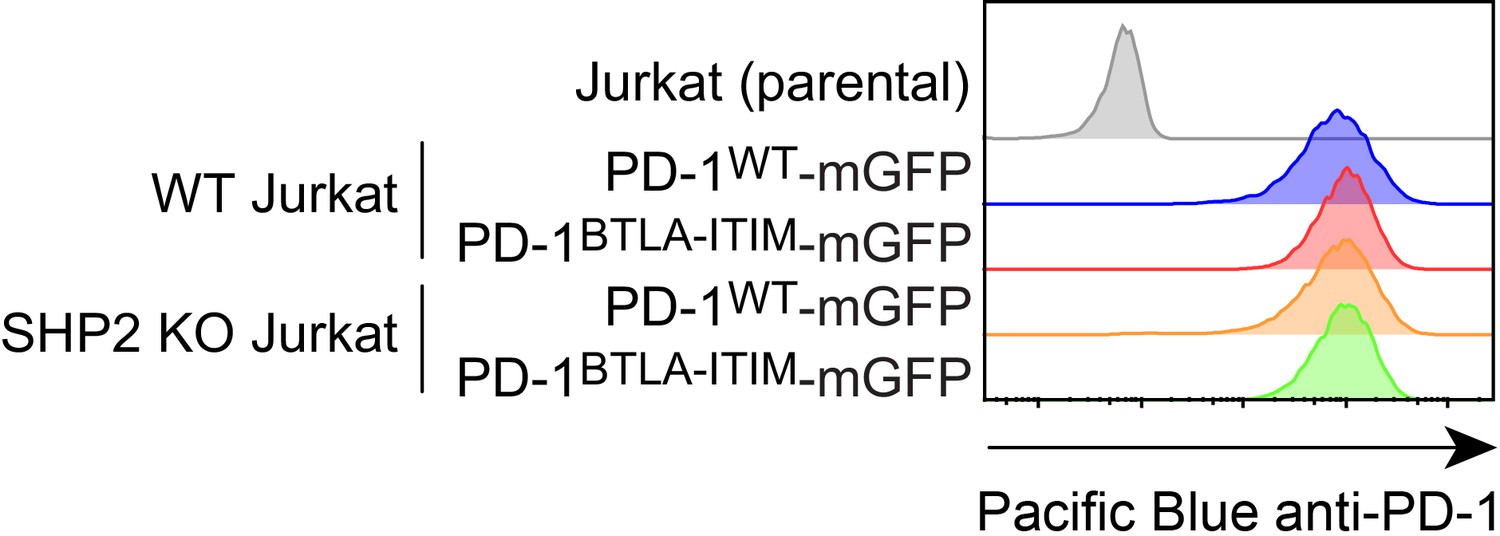
Flow cytometry histograms.
Flow cytometry histograms showing cell surface expression of indicated PD-1 variants in WT or SHP2 KO Jurkat cells.
Figure 7—figure supplement 2
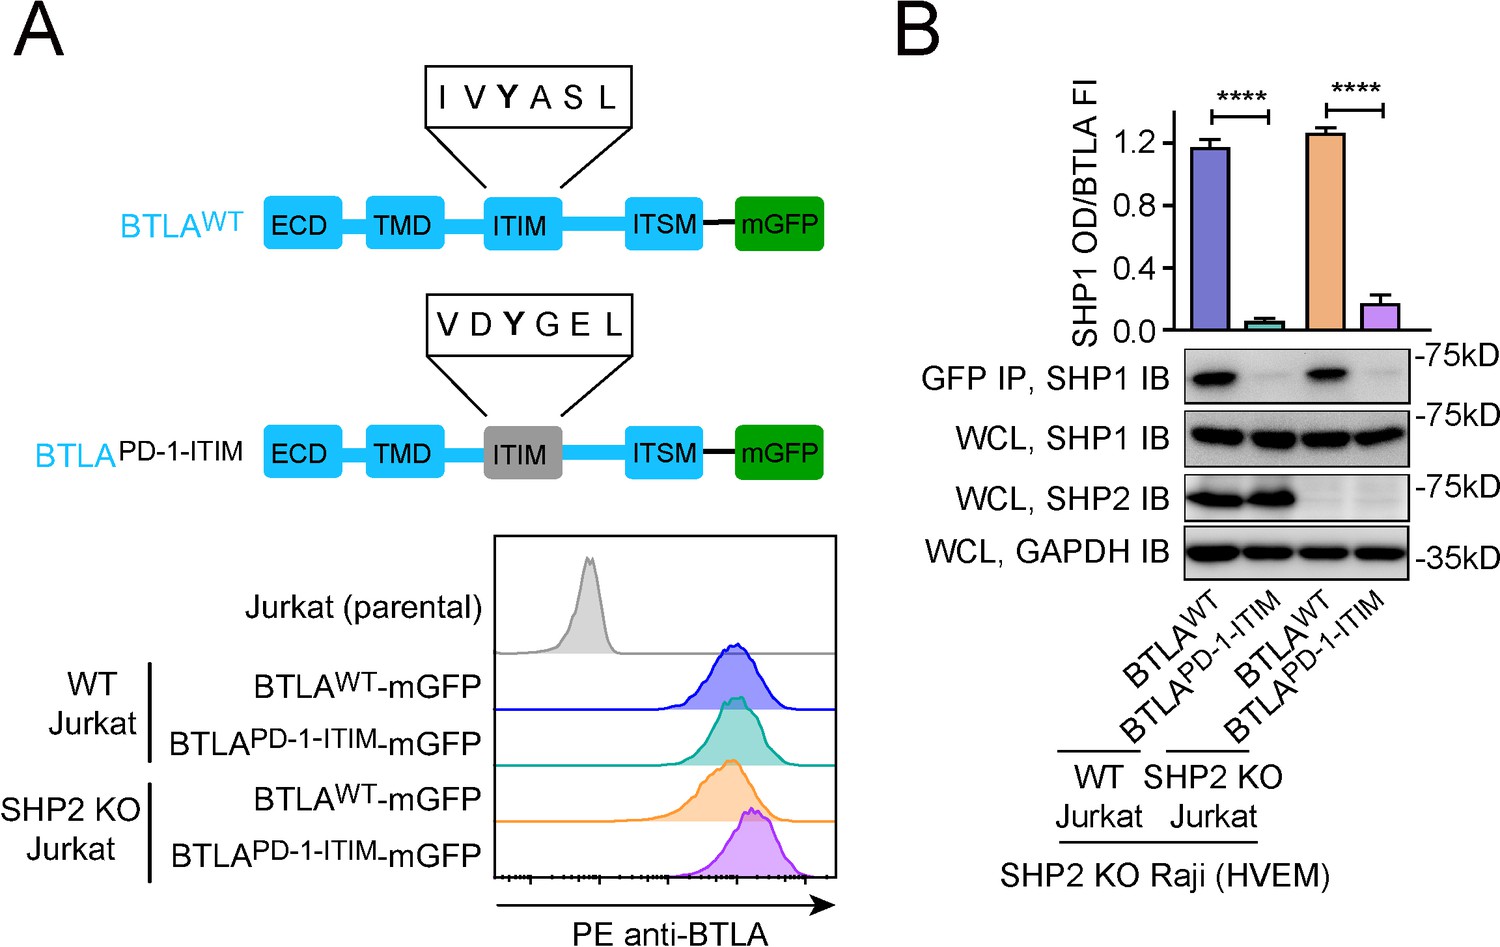
Replacing BTLA-ITIM with PD-1-ITIM abolished BTLA:SHP1 interaction in Jurkat cells.
(A) Upper: cartoons depicting the domains and motifs of BTLAWT-mGFP and BTLAPD-1-ITIM-mGFP. Lower: flow cytometry histograms showing the cell surface expressions of BTLA variants in the indicated Jurkat cells. (B) Representative immunoblots (IBs) showing the levels of SHP1 bound to mGFP-tagged BTLA variants pulled down from the indicated coculture lysates via GFP IP. SHP1 IB and SHP2 IB of the whole cell lysates (WCL) indicate their inputs. GAPDH IB of WCL serves as a loading control. The bar graphs on top summarizes SHP1 optical density (OD) normalized to the fluorescence intensity (FI) of each BTLA variant, based on flow cytometry data in (A). Error bars are s.d. from three independent coculture experiments performed on three different days. ****p<0.0001; Student’s t-test.
Figure 8 with 1 supplement
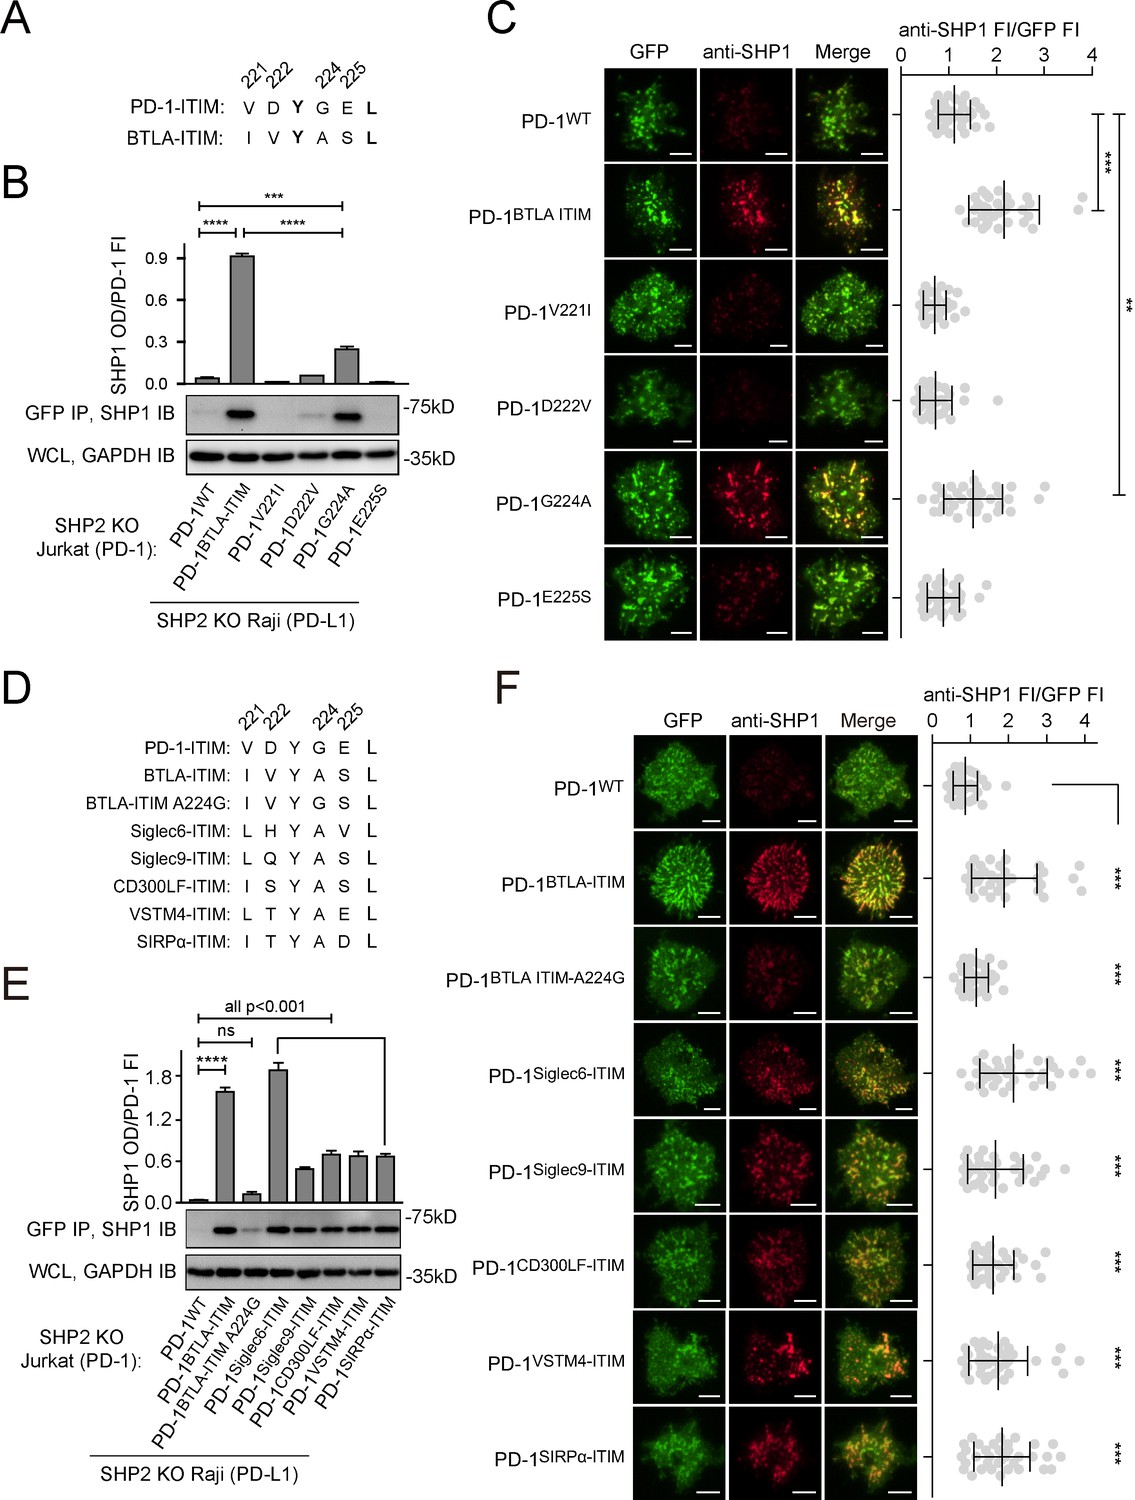
Glycine to alanine substitution at the pY+1 position of PD-1 immunoreceptor tyrosine-based inhibitory motif (ITIM) promoted SHP1 recruitment.
(A) Cartoons depicting the amino acid (AA) alignment of PD-1-ITIM and BTLA-ITIM. (B) Representative immunoblots (IBs) showing the levels of SHP1 bound to mGFP-tagged PD-1 variants pulled down from the indicated coculture lysates via GFP IP. GAPDH IB of whole cell lysates (WCL) served as a loading control. Bar graphs summarize SHP1 optical density (OD) normalized to the fluorescence intensity (FI) of each PD-1 variant, based on flow cytometry data in Figure 8—figure supplement 1A. Error bars are s.d. from three independent coculture experiments conducted on three different days. (C) Left: representative TIRF images of both PD-1 (GFP) and endogenous SHP1 (stained with anti-SHP1) in a supported lipid bilayer (SLB)-associated SHP2 KO Jurkat cell expressing indicated PD-1 variants. Right: dot plots summarizing anti-SHP1 FI normalized to GFP FI of 35 Jurkat cells under each condition recorded on the same day using the same microscope setting (see Materials and methods). (D) Cartoons showing the AA sequences of ITIM of indicated receptors. (E) Representative IBs showing the levels of SHP1 co-precipitated with mGFP-tagged PD-1 variants, with the original ITIM replaced by the indicated ITIM, from the indicated coculture lysates via GFP IP. GAPDH IB of WCL served as a loading control. Bar graphs summarize SHP1 OD normalized to the FI of each PD-1 variant, based on flow cytometry data in Figure 8—figure supplement 1C. Error bars are s.d. from three independent coculture experiments conducted on three different days. (F) Left: representative TIRF images of both PD-1 (GFP) and endogenous SHP1 (stained with anti-SHP1) in an SLB-associated SHP2 KO Jurkat cell expressing PD-1 variants with indicated ITIM. Right: dot plots summarizing anti-SHP1 FI normalized to GFP FI of 35 Jurkat cells under each condition recorded on the same day using the same microscope setting (see Materials and methods); Error bars: s.d. Scale bars: 5 µm. **p<0.01; ***p<0.001; ****p<0.0001; ns, not significant. Student’s t-test.
-
Figure 8—source data 1
Uncropped IBs for Figure 8B and E.
- https://cdn.elifesciences.org/articles/74276/elife-74276-fig8-data1-v2.pdf
-
Figure 8—source data 2
Raw data for quantification graphs in Figure 8.
- https://cdn.elifesciences.org/articles/74276/elife-74276-fig8-data2-v2.xlsx
Figure 8—figure supplement 1
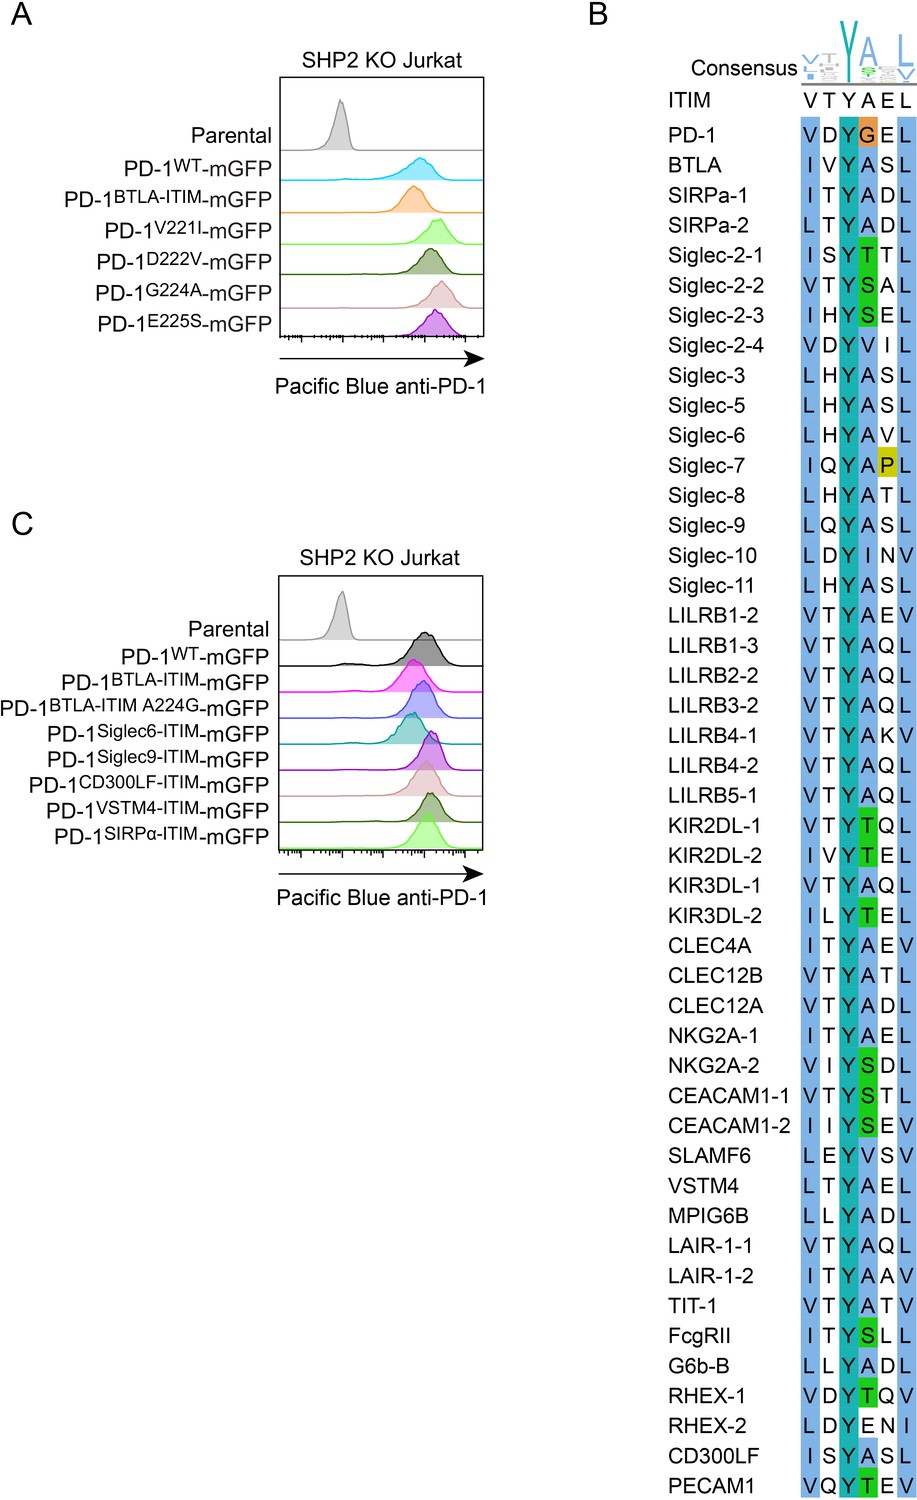
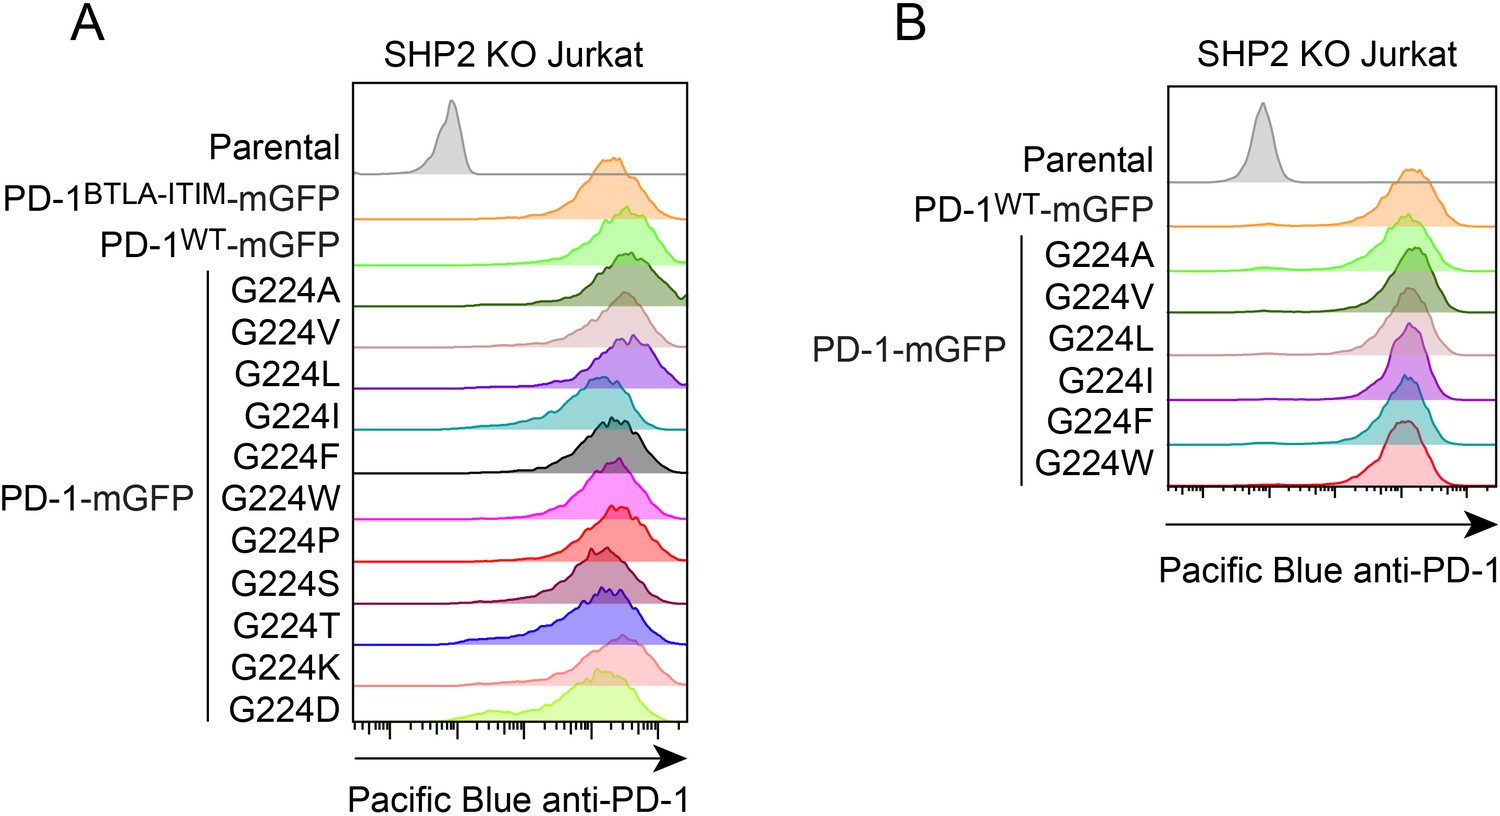
Flow cytometry histograms of PD-1 variants and sequence alignment of immunoreceptor tyrosine-based inhibitory motifs (ITIMs) in immune receptors.
(A) Flow cytometry histograms showing cell surface expression of indicated PD-1 variants in SHP2 KO Jurkat cells, used in Figure 8B and C. (B) Sequence alignment of ITIMs in immune receptors. ITIM sequences in indicated immune receptors were aligned and visualized using ClustalW and JalView. Consensus amino acids at each position in ITIM are indicated at the top.(C) Flow cytometry histograms showing cell surface expression of indicated PD-1 variants in SHP2 KO Jurkat cells, used in Figure 8E and F.
Figure 9 with 1 supplement
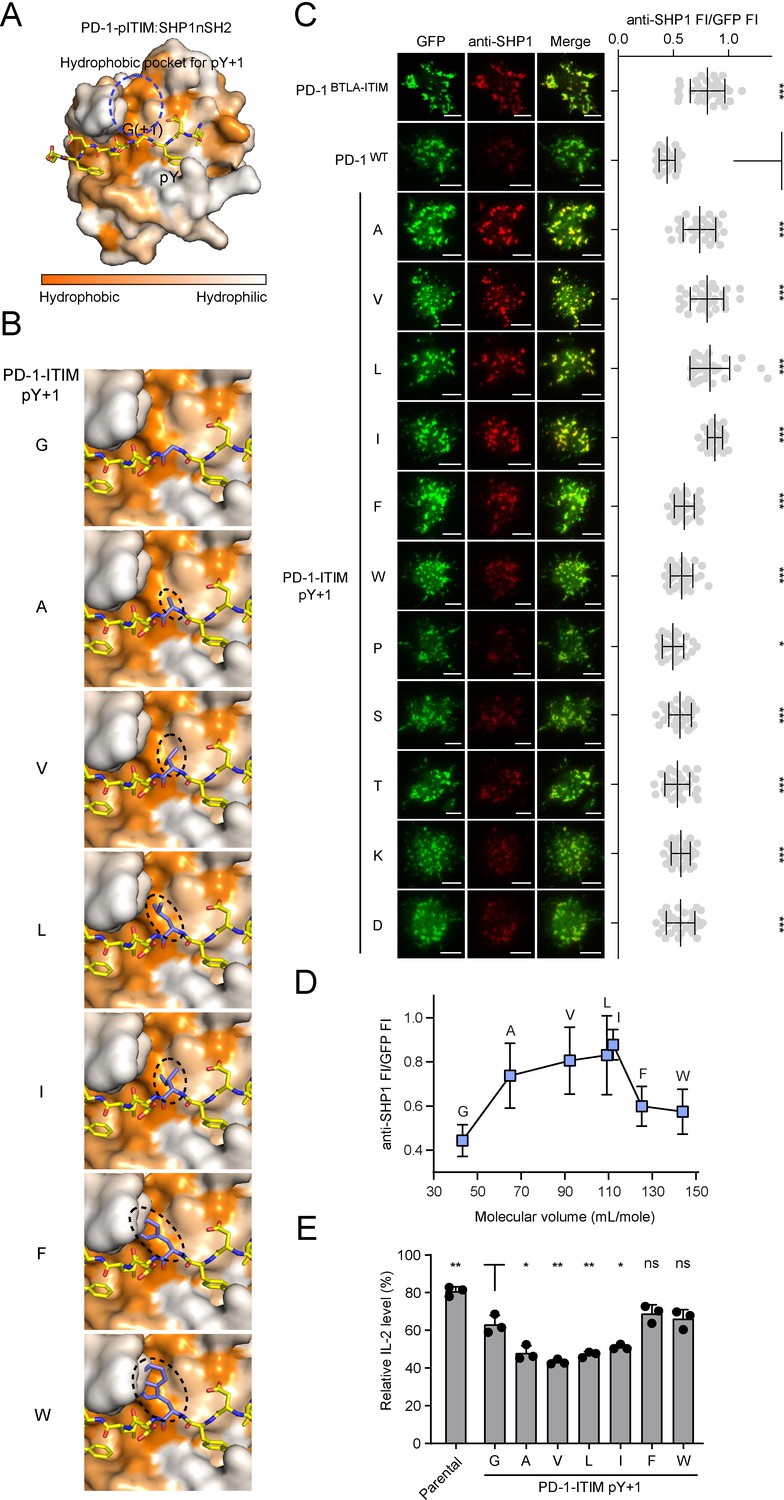
A medium-sized nonpolar residue at pY+1 position of the immunoreceptor tyrosine-based inhibitory motif (ITIM) is optimal for SHP1 recruitment.
(A) The combined surface (SHP1-nSH2) and stick (PD-1-pITIM) representation showing the hydrophobic pocket (highlighted by a blue circle) in SHP1-nSH2 for coordinating pY+1 residue of PD-1-pITIM. This structural model of SHP1-nSH2:PD-1-pITIM complex was generated by homology modeling using the SWISS-Model based on the crystal structure of SHP2-nSH2:PD-1-pITIM complex (PDB: 6ROY). (B) SWISS-Model-based homology modeling comparing SHP1-nSH2 interactions with pY+1 mutated PD-1 ITIM. Shown is a zoomed-in view of the hydrophobic pocket region with the pY+1 residue highlighted in a dashed oval. (C) Left: representative TIRF images of both PD-1 (GFP) and endogenous SHP1 (stained with anti-SHP1) in a supported lipid bilayer (SLB)-associated SHP2 KO Jurkat cell expressing indicated PD-1 variants. Right: dot plots summarizing anti-SHP1 fluorescence intensity (FI) normalized to GFP FI of 30-35 Jurkat cells under each condition recorded on the same day using the same microscope setting (see Materials and methods); Error bars: s.d. Scale bars: 5 µm. (D) Normalized anti-SHP1 FI for a subset of PD-1 variants shown in (C) plotted against the molecular volume of amino acids (AA) at the pY+1 position. (E) Relative IL-2 secretion by SHP2 KO Jurkat cells expressing indicated PD-1 variants. For each cell line, the relative IL-2 level was determined by normalizing the IL-2 level without pembrolizumab to that with 40 μg/ml (267 nM) pembrolizumab, which blocks PD-1 signaling. Error bars are s.d. from three independent coculture assays using three set of independently transduced cell lines, with each coculture assay run in technical duplicates. *p<0.05; **p<0.01; ***p<0.001; ns, not significant; Student’s t-test.
-
Figure 9—source data 1
Raw data for quantification graphs in Figure 9C and E.
- https://cdn.elifesciences.org/articles/74276/elife-74276-fig9-data1-v2.xlsx
Figure 9—figure supplement 1
Flow cytometry histograms.
(A, B) Flow cytometry histograms showing cell surface expression of indicated PD-1 variants in SHP2 KO Jurkat cells in Figure 9C and E respectively.
Tables
Key resources table
| Reagent type (species) or resource | Designation | Source or reference | Identifiers | Additional information |
|---|---|---|---|---|
| Antibody | Biotin anti-human CD3ε (OKT3, mouse monoclonal) | BioLegend | Cat#: 317320;RRID:AB_10916519 | TIRF (1:100) |
| Antibody | Anti-phosphotyrosine (pY20, mouse monoclonal) | Sigma-Aldrich | Cat#: P4110-1MG;RRID:AB_477342 | WB (1:500) |
| Antibody | Anti-GFP (rabbit polyclonal) | Invitrogen | Cat#: A-6455;RRID:AB_221570 | WB (1:1000) |
| Antibody | Anti-SHP1 (rabbit polyclonal) | Proteintech | Cat#: 24546-1-AP;RRID:AB_2879600 | WB (1:1000) |
| Antibody | Anti-SHP1 (rabbit monoclonal) | Life Technologies | Cat#: 3H20L13;RRID:AB_2809241 | IF (1:100) |
| Antibody | Anti-SHP2 (mouse monoclonal) | Santa Cruz Biotechnology | Cat#: sc-7384;RRID:AB_628252 | WB (1:200) |
| Antibody | Anti-SHP2 (mouse monoclonal) | BD Biosciences | Cat#: 610622;RRID:AB_397954 | IF (1:200) |
| Antibody | Anti-GAPDH (rabbit polyclonal) | Proteintech | Cat#: 10494-1-AP;RRID:AB_2263076 | WB (1:1000) |
| Antibody | F(ab')2-goat anti-rabbit IgG (H + L) secondary antibody, Alexa Fluor 568 | Invitrogen | Cat#: A21069;RRID:AB_2535730 | IF (1:1000) |
| Antibody | PE anti-human BTLA (MIH26) | BioLegend | Cat#: 344505;RRID:AB_2043945 | Flow (1:100) |
| Antibody | PE anti-human PD-1 (MIH4) | Thermo Fisher | Cat#: 12-9969-42;RRID:AB_10736473 | Flow (1:100) |
| Antibody | Pacific Blue anti-human PD-1 (EH12.2H7) | BioLegend | Cat#: 329916;RRID:AB_2283437 | Flow (1:100) |
| Antibody | Pembrolizumab (anti-human PD-1, IgG4) | Selleck Chemicals | Cat#: A2005 | |
| Commercial assay or kit | Human IL-2 ELISA kit | Thermo Fisher | Cat#: 88702577;RRID:AB_2574952 | |
| Recombinant protein | Human PD-L1-His | Sino Biological | Cat#: 10084-H08H | |
| Recombinant protein | Human ICAM-1-His | Sino Biological | Cat#: 10346-H08H | |
| Recombinant protein | Streptavidin | Invitrogen | Cat#: S888 | |
| Recombinant protein | SEE super antigen | Toxin Technologies | Cat#: ET404 | |
| Chemical compound, drug | Paraformaldehyde | Fisher Scientific | Cat#: 50980494 | |
| Chemical compound, drug | 100× penicillin-streptomycin | GE Healthcare | Cat#: SV30010 | |
| Chemical compound, drug | Polyethylenimine (PEI) | Fisher Scientific | Cat#: NC1014320 | |
| Chemical compound, drug | 1,2-Dioleyl-sn-glycero-3-phosphocholine (POPC) | Avanti Polar Lipids | Cat#: 850457C | |
| Chemical compound, drug | 1,2-Dioleoyl-sn-glycero-3-[(N-(5-amino-1-carboxypentyl) iminodiacetic acid) succinyl] nickel salt (DGS-NTA-Ni) | Avanti Polar Lipids | Cat#: 790404C | |
| Chemical compound, drug | 1,2-Dipalmitoyl-sn-glycero-3-phosphoethanolamine-N-(biotinyl) (sodium salt) | Avanti Polar Lipids | Cat#: 870285P | |
| Chemical compound, drug | 1,2-Dioleoyl-sn-glycero-3-phosphoethanolamine-N-[methoxy(polyethylene glycol)–5000] ammonium salt (PEG 5000-PE) | Avanti Polar Lipids | Cat#: 880230C | |
| Chemical compound, drug | Imidazole | Sigma-Aldrich | Cat#: I202 | |
| Chemical compound, drug | TCEP-HCl | Gold Biotechnology | Cat#: TCEP10 | |
| Chemical compound, drug | Alexa Fluor 647 NHS ester | Thermo Fisher | Cat#: A37573 | |
| Chemical compound, drug | SNAP ligand-JF549 | Janelia Research Campus (HHMI) | PMID:28924668 | |
| Chemical compound, drug | SNAP ligand-JF646 | Janelia Research Campus (HHMI) | PMID:28924668 | |
| Chemical compound, drug | Hellmanex III | Sigma | Cat#: Z805939-1EA | |
| Chemical compound, drug | Biotin | Sigma-Aldrich | Cat#: B4501 | |
| Chemical compound, drug | ATP | Gold Biotech | Cat#: A-081-100 | |
| Chemical compound, drug | Ni-NTA resin | Thermo Fisher | Cat#: 88223 | |
| Chemical compound, drug | GFP-Trap | Chromotek | Cat#: gta-20 | |
| Chemical compound, drug | Glutathione agarose resin | Gold Biotechnology | Cat#: G-250-50 | |
| Chemical compound, drug | Zeba Spin Desalting Columns | Thermo Fisher | Cat#: 89890 | |
| Chemical compound, drug | Gel Filtration Standard | Bio-Rad | Cat#: 1511901 | |
| Chemical compound, drug | DMEM High Glu w/Gln w/o Pyr | Thermo Fisher | Cat#: MT10017CV | |
| Chemical compound, drug | RPMI 1640, w/Gln and 25 mM HEPES | Corning | Cat#: MT 10-041CM | |
| Chemical compound, drug | Fetal bovine serum, heat-inactivated | Omega Scientific | Cat#: FB-02 | |
| Other | Glass-bottomed 96-well plate | DOT Scientific Inc | Cat#: MGB096-1-2-LG-L | |
| Other | Ni sensor chip | Nicoya | Cat#: SEN-AU-100-10-NTA | |
| Cell line (Homo sapiens) | Jurkat E6.1 | Provided by Dr. Arthur Weiss (University of California San Francisco) | RRID:CVCL_0065 | |
| Cell line (H. sapiens) | Raji | Provided by Dr. Ronald Vale (University of California San Francisco) | RRID:CVCL_0511 | |
| Cell line (H. sapiens) | HEK-293T | Provided by Dr. Ronald Vale (University of California San Francisco) | RRID:CVCL_0063 | |
| Cell line (H. sapiens) | SHP1 KO Jurkat | Xu et al., 2020 | PMID:32437509 | |
| Cell line (H. sapiens) | SHP2 KO Jurkat | Xu et al., 2020 | PMID:32437509 | |
| Cell line (H. sapiens) | SHP1/2 DKO Jurkat | Xu et al., 2020 | PMID:32437509 | |
| Cell line (H. sapiens) | Raji (PD-L1-mCherry) | Xu et al., 2020 | PMID:32437509 | |
| Cell line (H. sapiens) | Raji (HVEM-mRuby2) | Xu et al., 2020 | PMID:32437509 | |
| Cell line (H. sapiens) | SHP2 KO Raji (PD-L1-mCherry) | Xu et al., 2020 | PMID:32437509 | |
| Cell line (H. sapiens) | SHP2 KO Raji (HVEM-mRuby2) | Xu et al., 2020 | PMID:32437509 | |
| Software, algorithm | FlowJo V10 | TreeStar | RRID:SCR_008520 | Flow data processing and analysis |
| Software, algorithm | GraphPad Prism v8 | GraphPad | RRID:SCR_002798 | Graphs and statistical analysis |
| Software, algorithm | ImageJ | NIH | RRID:SCR_003070 | Image acquisition, processing, and analysis |
| Software, algorithm | Fiji | MPI-CBG | PMID:22743772;RRID:SCR_002285 | Image processing and analysis |
| Software, algorithm | Micro-Manager | GitHub | PMID:25606571;RRID:SCR_000415 | |
| Software, algorithm | ThunderStorm | GitHub | PMID:24771516;RRID:SCR_016897 | Single-molecular images analysis |
| Software, algorithm | OpenSPR | Nicoya | N/A | SPR data acquisition |
| Software, algorithm | TraceDrawer | Ridgeview Instruments | N/A | SPR data analysis |
| Software, algorithm | PyMOL | Schrödinger, Inc | RRID:SCR_000305 | Structural modeling, simulation |
Additional files
-
Supplementary file 1
Kd values of interactions between individual SH2 of SHP1/SHP2 and phosphorylated ITIM/ITSM of PD-1/BTLA; mean ± s.d. (n = 3).
- https://cdn.elifesciences.org/articles/74276/elife-74276-supp1-v2.docx
-
Supplementary file 2
Table summarizing ∆G of PD-1/BTLA:SHP1/SHP2-tSH2 interactions in a parallel or an anti-parallel mode.
- https://cdn.elifesciences.org/articles/74276/elife-74276-supp2-v2.docx
-
Supplementary file 3
Table summarizing ∆G of individual SH2:ITIM/ITSM interactions.
- https://cdn.elifesciences.org/articles/74276/elife-74276-supp3-v2.docx
-
Supplementary file 4
A list of immunoreceptors that contain both ITIM and ITSM.
- https://cdn.elifesciences.org/articles/74276/elife-74276-supp4-v2.docx
-
Transparent reporting form
- https://cdn.elifesciences.org/articles/74276/elife-74276-transrepform1-v2.docx
Download links
A two-part list of links to download the article, or parts of the article, in various formats.
Downloads (link to download the article as PDF)
Open citations (links to open the citations from this article in various online reference manager services)
Cite this article (links to download the citations from this article in formats compatible with various reference manager tools)
Molecular features underlying differential SHP1/SHP2 binding of immune checkpoint receptors
eLife 10:e74276.
https://doi.org/10.7554/eLife.74276


