A bidirectional switch in the Shank3 phosphorylation state biases synapses toward up- or downscaling
- Department of Biology, Brandeis University, United States
- Proteomics Platform, Broad Institute of MIT and Harvard, United States
- Stanley Center for Psychiatric Research, Broad Institute of MIT and Harvard, United States
Figures
Figure 1 with 1 supplement
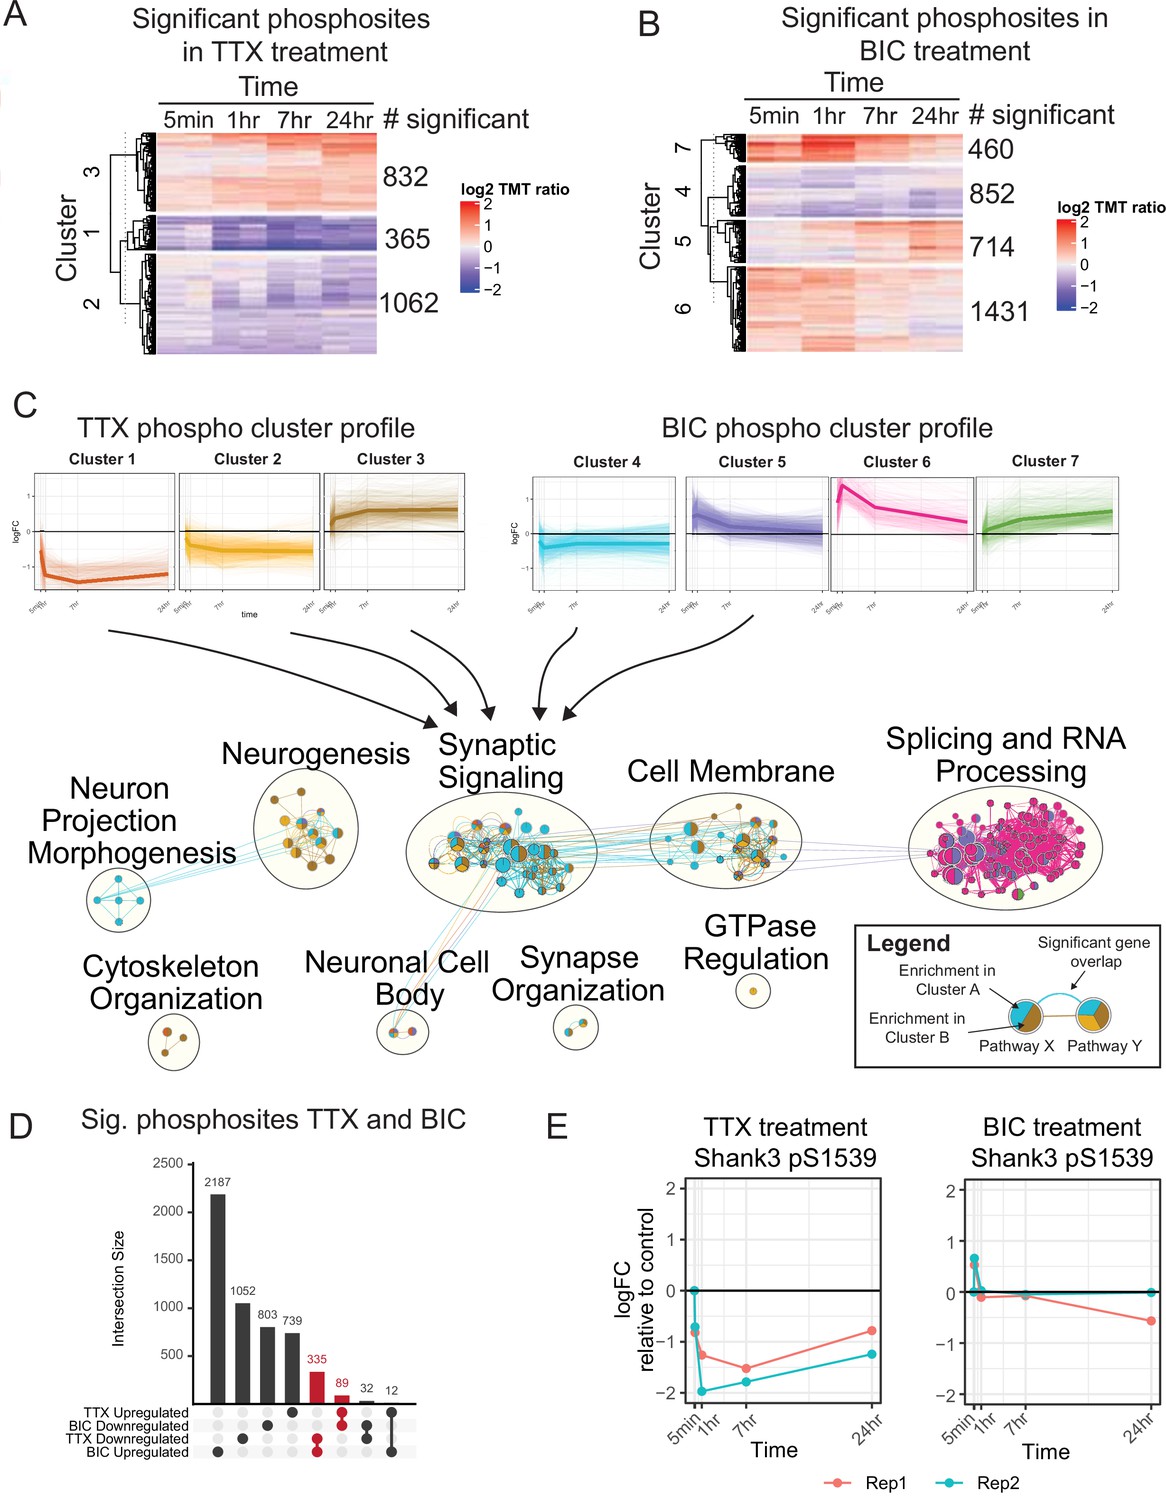
The temporal phosphoproteome response induced by synaptic scaling protocols.
(A) Heatmap showing the abundance (log2 TMT ratios to control) of phosphosites with a significant response to tetrodotoxin (TTX) treatment (F-test, adj. p<0.1). Hierarchical clustering shows three major clusters with different temporal profiles. The number of significant phosphosites in each cluster is indicated. (B) Heatmap showing the abundance (log2 TMT ratios to control) of phosphosites with a significant response to bicuculline (BIC) treatment (F-test, adj. p<0.1). Hierarchical clustering shows four major clusters with different temporal profiles. The number of significant phosphosites in each cluster is indicated. (C) Network representation of pathway enrichment results from phosphosites showing a significant response to TTX or BIC treatment. (Top) Temporal profiles are shown for the three TTX clusters and four BIC clusters; thin lines represent individual phosphosites, while thick lines represent the cluster mean. (Bottom) Network showing pathways significantly enriched in each of the TTX/BIC clusters. Pathways are shown as nodes with colors of each node indicating the associated cluster or clusters. Edges connecting the nodes indicate a significant gene overlap between pathways (Jaccard Index > 0.5). Related pathways are clustered and the overall function is summarized in text. The synaptic signaling, neurogenesis, cell membrane, neuronal cell body, and synapse organization clusters show enrichment in response to TTX and BIC treatment in both upregulated and downregulated phosphosites. (D) Upset plot showing the number of unique and overlapping regulated phosphosites across BIC and TTX datasets with directionality. Groups highlighted in red represent a total of 424 phosphosites showing regulation in both BIC and TTX datasets, with opposite directionality. (E) Temporal profile of mouse Shank3 S1539 phosphosite abundance in response to TTX (left) and BIC (right), displaying opposite response to these treatments; different colors represent two biological replicates. Also see Figure 1—figure supplement 1, Figure 1—source data 1, and Figure 1—source data 2.
-
Figure 1—source data 1
Source mass spectrometry (MS) data for Figure 1.
- https://cdn.elifesciences.org/articles/74277/elife-74277-fig1-data1-v2.xlsx
-
Figure 1—source data 2
Source data for pathway enrichment analysis in Figure 1.
- https://cdn.elifesciences.org/articles/74277/elife-74277-fig1-data2-v2.xlsx
Figure 1—figure supplement 1
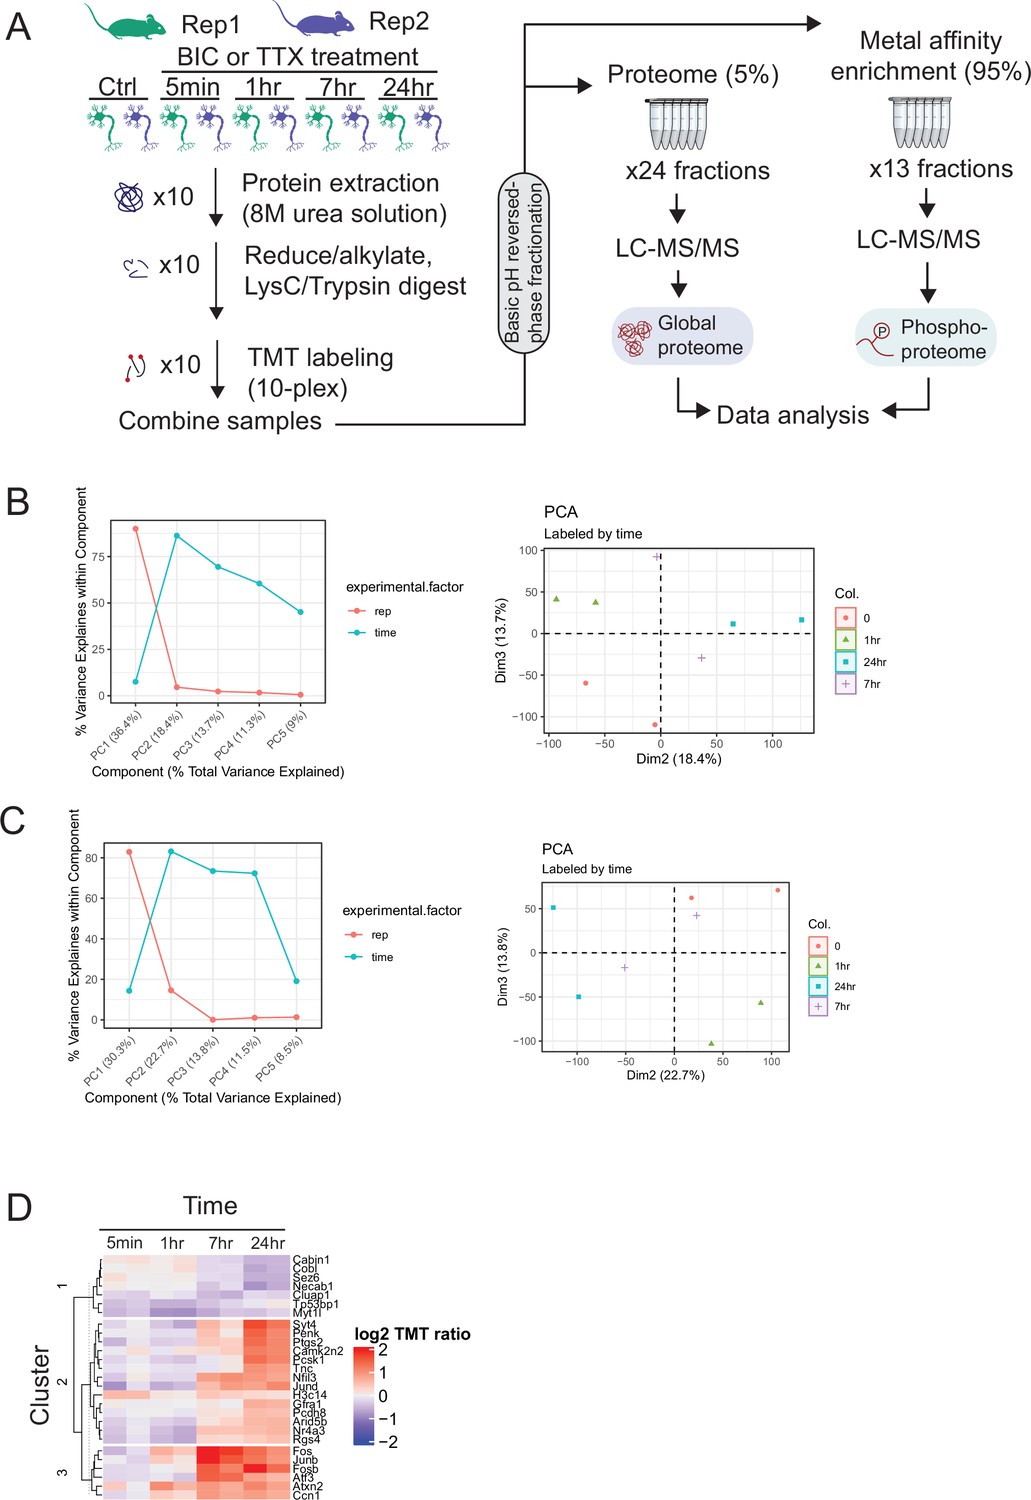
Proteome and phosphoproteome dynamics in synaptic signaling.
(A) Experimental workflow for deep proteome and phosphoproteome analysis of cortical neuron explants treated with tetrodotoxin (TTX) or bicuculline (BIC). (B) Principal component analysis (PCA) of the TTX phosphoproteome dataset. (Left) Percentage of variance explained by experimental factors in each principal component. Most of the variance is explained by the biological replicate, followed by the treatment time point. (Right) PCA plot shows grouping of replicates by time point in dimensions 2 and 3. (C) PCA of the BIC phosphoproteome dataset. (Left) Percentage of variance explained by experimental factors in each principal component. Most of the variance is explained by the biological replicate, followed by the treatment time point. (Right) PCA plot shows grouping of replicates by time point in dimensions 2 and 3. (D) Heatmap showing the abundance (log2 TMT ratios) of proteins with a significant response to BIC treatment (F-test, adj. p<0.1). The gene symbols of the 27 regulated proteins are shown next to the heatmap.
Figure 2 with 1 supplement

Neuronal activity bidirectionally modulates the phosphorylation state of Shank3.
(A) The experiment protocol for extraction of Shank3 from rat cultured neocortical neurons for further quantitative mass spectrometry (MS) or Western blot analyses. (B) Volcano plot of quantitative MS data showing Shank3 residues that were differentially phosphorylated in tetrodotoxin (TTX)-treated samples compared to untreated controls. The log2 values of fold changes, if below zero, indicated hypophosphorylation (paired t-test: S1586, adjusted p=0.034142, S1614/5, 0.014444). (C) Top: diagram showing the location of S1586 and S1615 within the rat Shank3 protein. Functional domains: ANK = ankyrin repeat; SH3 = SRC homology 3; PDZ = PSD-95/Disc Large/ZO-1; Pro-rich = proline rich; SAM = sterile alpha motif. Bottom: homology comparison of sequences flanking rat S1586 and S1615 (matching mouse S1539) across species (human Shank3: NP_001358973.1; rat Shank3: NP_067708.2; mouse Shank3: UniprotKB: Q4ACU6.3). Phosphosites of interest are labeled in red; the only residue not conserved is shown in blue. (D, E) Representative Western blot using an antibody specific for phosphorylated S1615, showing changes in Shank3 phosphorylation after 10 min (D) or 24 hr (E) treatment with TTX or picrotoxin (PTX). (F) Quantification of the fold change of Shank3 S1615 phosphorylation in (D). Dashed line indicates the baseline untreated control (one-sample t-test: TTX, ***p=0.0005, PTX, **p=0.0035, n = 5 and 10 biological replicates, respectively). (G) Quantification of the fold change of Shank3 S1615 phosphorylation in (E) (one-sample t-test: TTX, ****p<0.0001, PTX, p = 0.6336, n = 7 and 7 biological replicates, respectively). Solid colored horizontal lines indicate the mean, and error bars represent SEM. Also see Figure 2—figure supplement 1, Figure 2—source data 1, and Figure 2—source data 2.
-
Figure 2—source data 1
Source data for Figure 2.
- https://cdn.elifesciences.org/articles/74277/elife-74277-fig2-data1-v2.xlsx
-
Figure 2—source data 2
Source blot images for Figure 2.
- https://cdn.elifesciences.org/articles/74277/elife-74277-fig2-data2-v2.zip
Figure 2—figure supplement 1
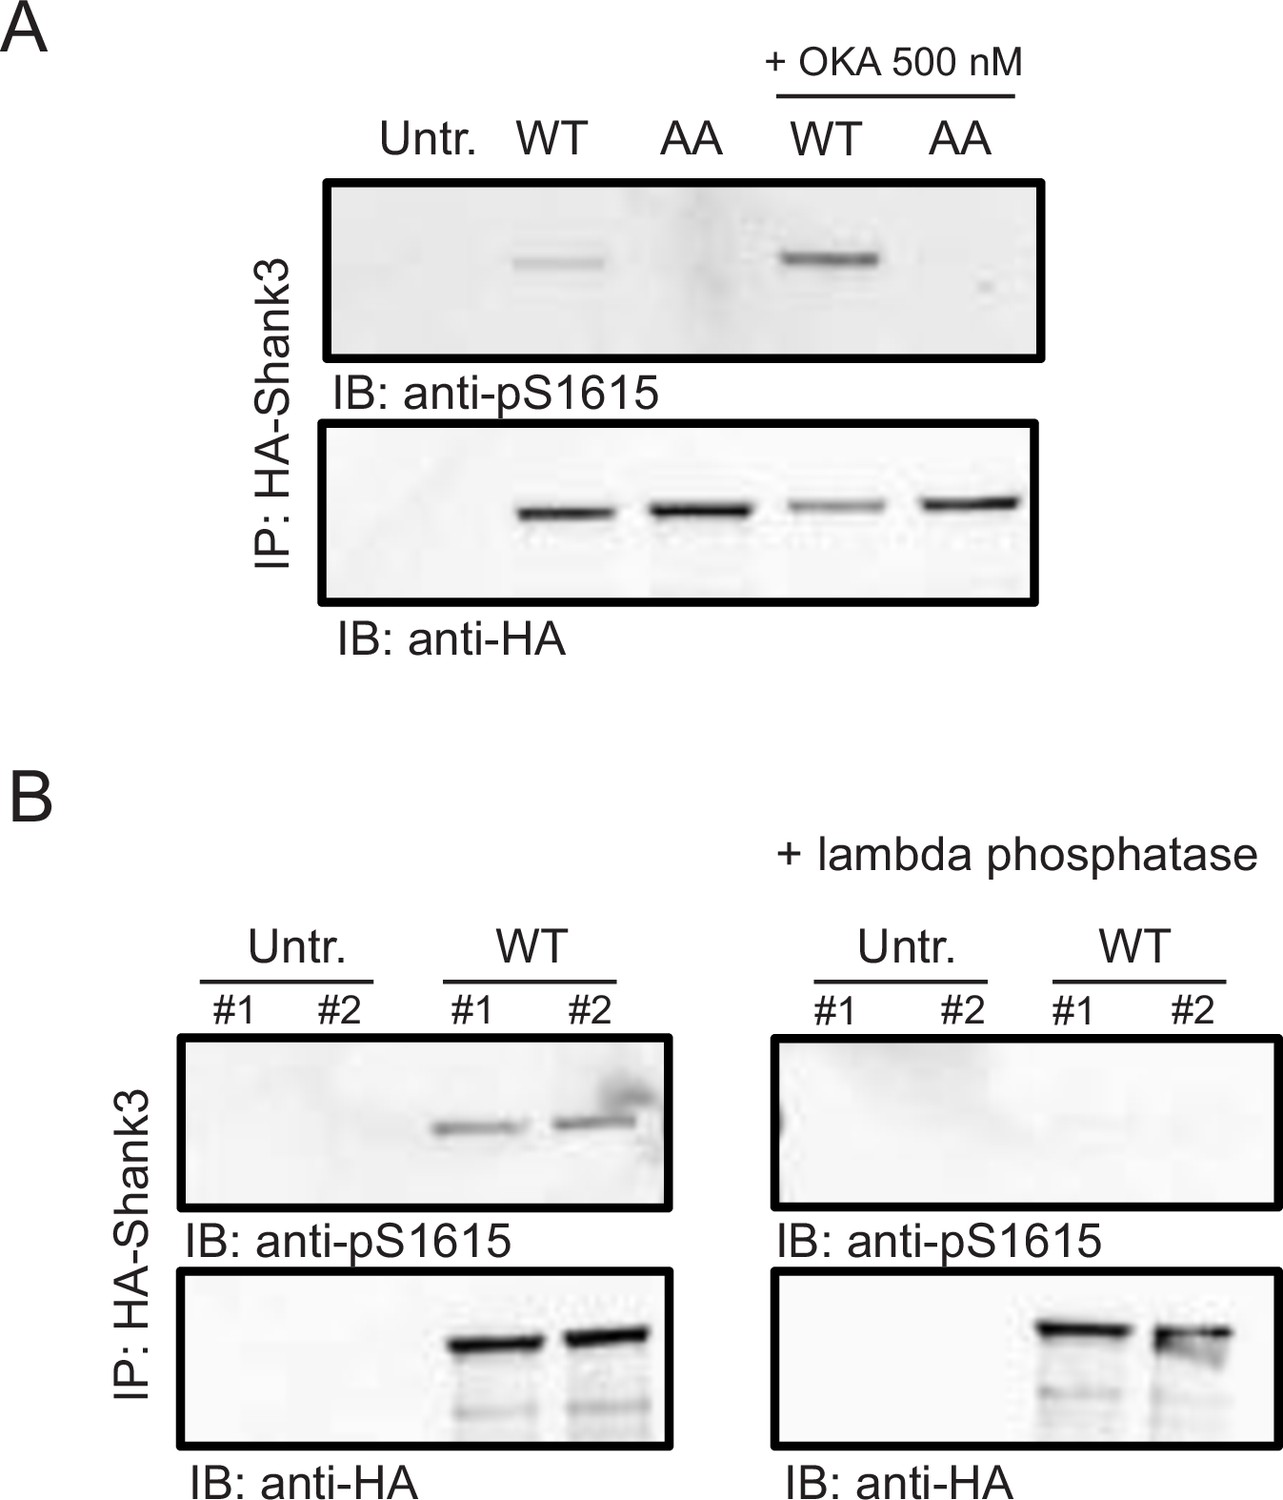
Validation of the pS1615 antibody.
(A) Western blot image showing the intensity of pS1615 in HA-tagged wild-type Shank3 or the S1586A/S1615A (AA) mutant. One set of replicates were treated with the phosphatase inhibitor, okadaic acid (OKA, 500 nM) for 30 min before lysis. Untr., untransfected control; n = 3 biological replicates. (B) Western blot image showing the intensity of pS1615 in HA-tagged wild-type Shank3 with and without the treatment of lambda phosphatase (n = 4 biological replicates). Also see Figure 2—figure supplement 1—source data 1.
-
Figure 2—figure supplement 1—source data 1
Source blot images for Figure 2—figure supplement 1.
- https://cdn.elifesciences.org/articles/74277/elife-74277-fig2-figsupp1-data1-v2.zip
Figure 3
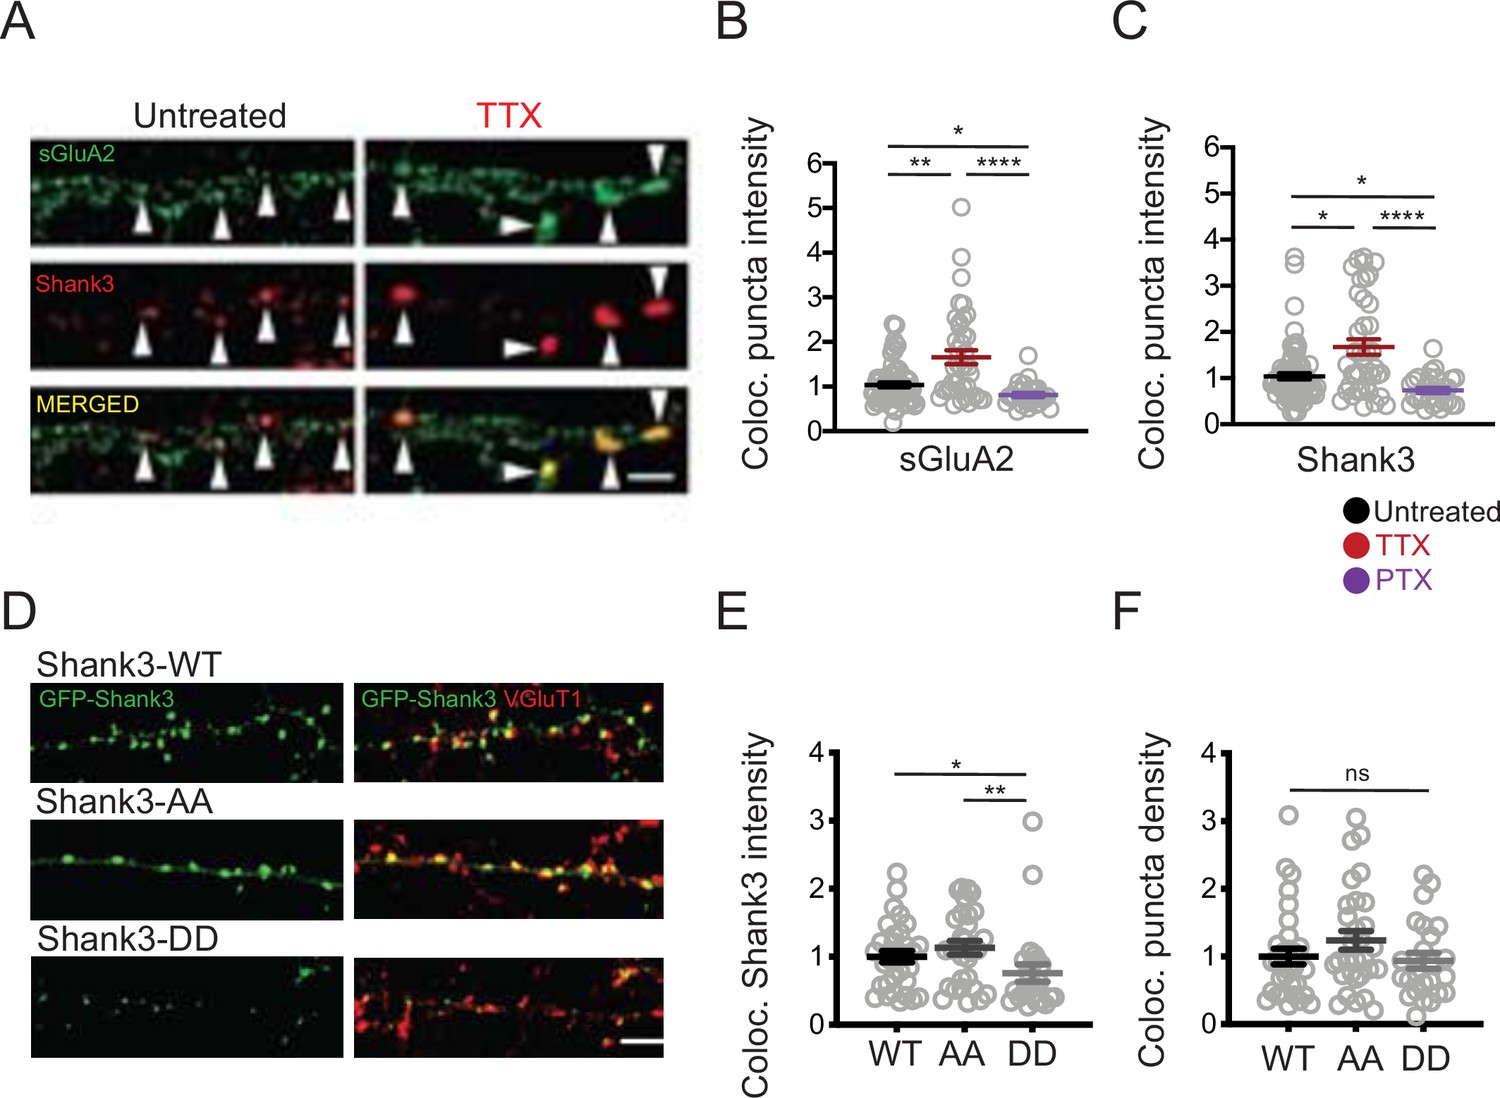
Phosphorylation state modulates activity-dependent changes in the synaptic enrichment of Shank3.
(A) Representative images of synaptic puncta colocalized with surface GluA2 (sGluA2) and Shank3 in neuron dendrites ± tetrodotoxin (TTX) (scale bar = 5 µm). (B) Quantification of synaptic sGluA2 intensity changes induced by scaling up and down protocols (number of neurons: untreated, n = 77, TTX, n = 40, picrotoxin [PTX], n = 29; Kruskal–Wallis test with post-hoc Dunn’s multiple comparison tests: Un vs. TTX, **p=0.0034, Un vs. PTX, *p=0.0408, TTX vs. PTX, ****p<0.0001). (C) Quantification of synaptic Shank3 intensity during scaling up and down protocols (Kruskal–Wallis test with post-hoc Dunn’s tests: Un vs. TTX, *p=0.0155, Un vs. PTX, *p=0.0205, TTX vs. PTX, ****p<0.0001). (D) Representative images of synaptic localization of wild-type Shank3 and Shank3 phospho-mutants (scale bar = 5 µm). (E) Quantification of synaptic intensity of Shank3 phospho-mutants (number of neurons: WT, n = 33, AA, n = 30, DD, n = 24; Kruskal–Wallis test with post-hoc Dunn’s tests: WT vs. AA, p>0.9999, WT vs. DD, *p=0.0395, AA vs. DD, **p=0.0039). (F) Quantification of the density of synaptic puncta containing Shank3 phospho-mutants (number of neurons: WT, n = 32, AA, n = 30, DD, n = 24; Kruskal–Wallis test: p=0.2814). For imaging experiments here and below, each data point represents a single pyramidal neuron, and data were collected from at least four independent experiments. Also see Figure 3—source data 1.
-
Figure 3—source data 1
Source data for Figure 3.
- https://cdn.elifesciences.org/articles/74277/elife-74277-fig3-data1-v2.xlsx
Figure 4 with 1 supplement
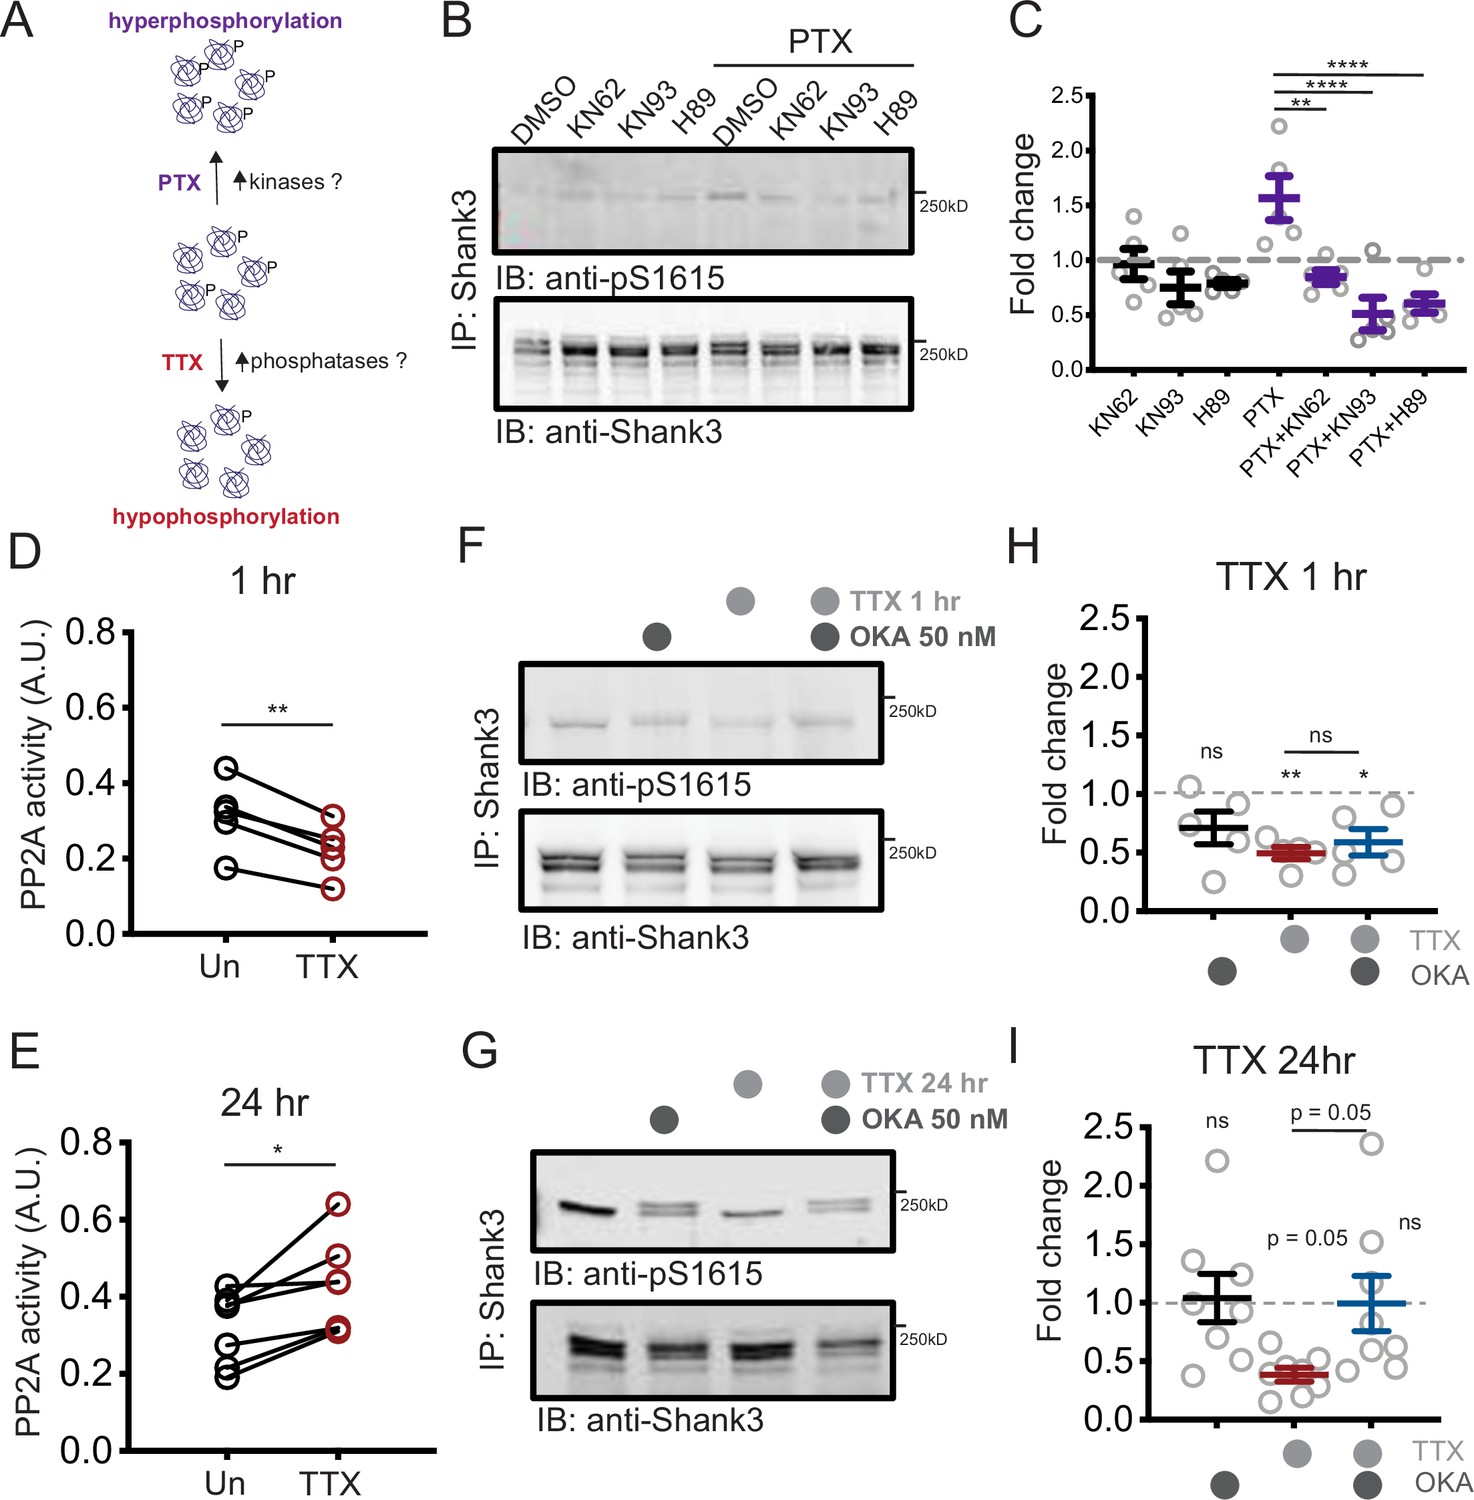
Increased PP2A activity maintains tetrodotoxin (TTX)-induced Shank3 hypophosphorylation.
(A) Diagram showing the potential roles of kinases and phosphatases in regulating activity-dependent Shank3 phosphorylation. (B) Representative Western blot showing the impacts of inhibiting CAMKII (KN62, KN93) or PKA (H89) on Shank3 phosphorylation at baseline and upon TTX treatment. (C) Quantification of S1615 phosphorylation in (B) (two-way ANOVA with post-hoc Tukey’s test: DMSO vs. KN62, p>0.9999, DMSO vs. KN93, p=0.8148, DMSO vs. H89, p=0.9112, DMSO vs. picrotoxin (PTX), *p=0.0406, PTX vs. PTX/KN62, **p=0.0040, PTX vs. PTX/KN93, ****p<0.0001, PTX vs. PTX/H89, ****p<0.0001, n = 5 biological replicates). Dashed line indicates the DMSO control. (D) Quantification of PP2A activity after 1 hr TTX treatment (Un, n = 5, TTX, n = 5; paired t-test: **p=0.0018). (E) Quantification of PP2A activity after 24 hr TTX treatment (Un, n = 7, TTX, n = 7; paired t-test: *p=0.0129). (F, G) Western blot analyses showing changes in S1615 phosphorylation after 1 hr (F) or 24 hr (G) TTX treatment, with inhibition of PP2A by okadaic acid (OKA, 50 nM) during the last hour of treatment. (H) Quantification of S1615 phosphorylation in (F) (two-way ANOVA with post-hoc Tukey’s test: Un vs. OKA, 0.1723, Un vs. TTX, **p=0.0076, Un vs. TTX/OKA, *p=0.0311, TTX vs. TTX/OKA, p=0.8942, n = 5 biological replicates). Dashed line indicates the baseline untreated control. (I) Quantification of S1615 phosphorylation in (G) (two-way ANOVA test with post-hoc Tukey’s test: Un vs. OKA, = 0.9979, Un vs. TTX, p=0.0503, Un vs. TTX/OKA, p>0.9999, TTX vs. TTX/OKA, p=0.0531, n = 8 biological replicates). Also see Figure 4—figure supplement 1, Figure 4—source data 1, and Figure 4—source data 2.
-
Figure 4—source data 1
Source data for Figure 4.
- https://cdn.elifesciences.org/articles/74277/elife-74277-fig4-data1-v2.xlsx
-
Figure 4—source data 2
Source blot images for Figure 4.
- https://cdn.elifesciences.org/articles/74277/elife-74277-fig4-data2-v2.zip
Figure 4—figure supplement 1

PP1 regulates baseline phosphorylation of Shank3.
(A) Western blot analysis showing changes in S1615 phosphorylation after 24 hr tetrodotoxin (TTX) treatment, with PP1 inhibition by okadaic acid (OKA, 500 nM) during the last hour of the regimen. (B) Quantification of S1615 phosphorylation in (A). Also see Figure 4—figure supplement 1—source data 1 and 2.
-
Figure 4—figure supplement 1—source data 1
Source data for Figure 4—figure supplement 1.
- https://cdn.elifesciences.org/articles/74277/elife-74277-fig4-figsupp1-data1-v2.xlsx
-
Figure 4—figure supplement 1—source data 2
Source blot images for Figure 4—figure supplement 1.
- https://cdn.elifesciences.org/articles/74277/elife-74277-fig4-figsupp1-data2-v2.zip
Figure 5 with 1 supplement
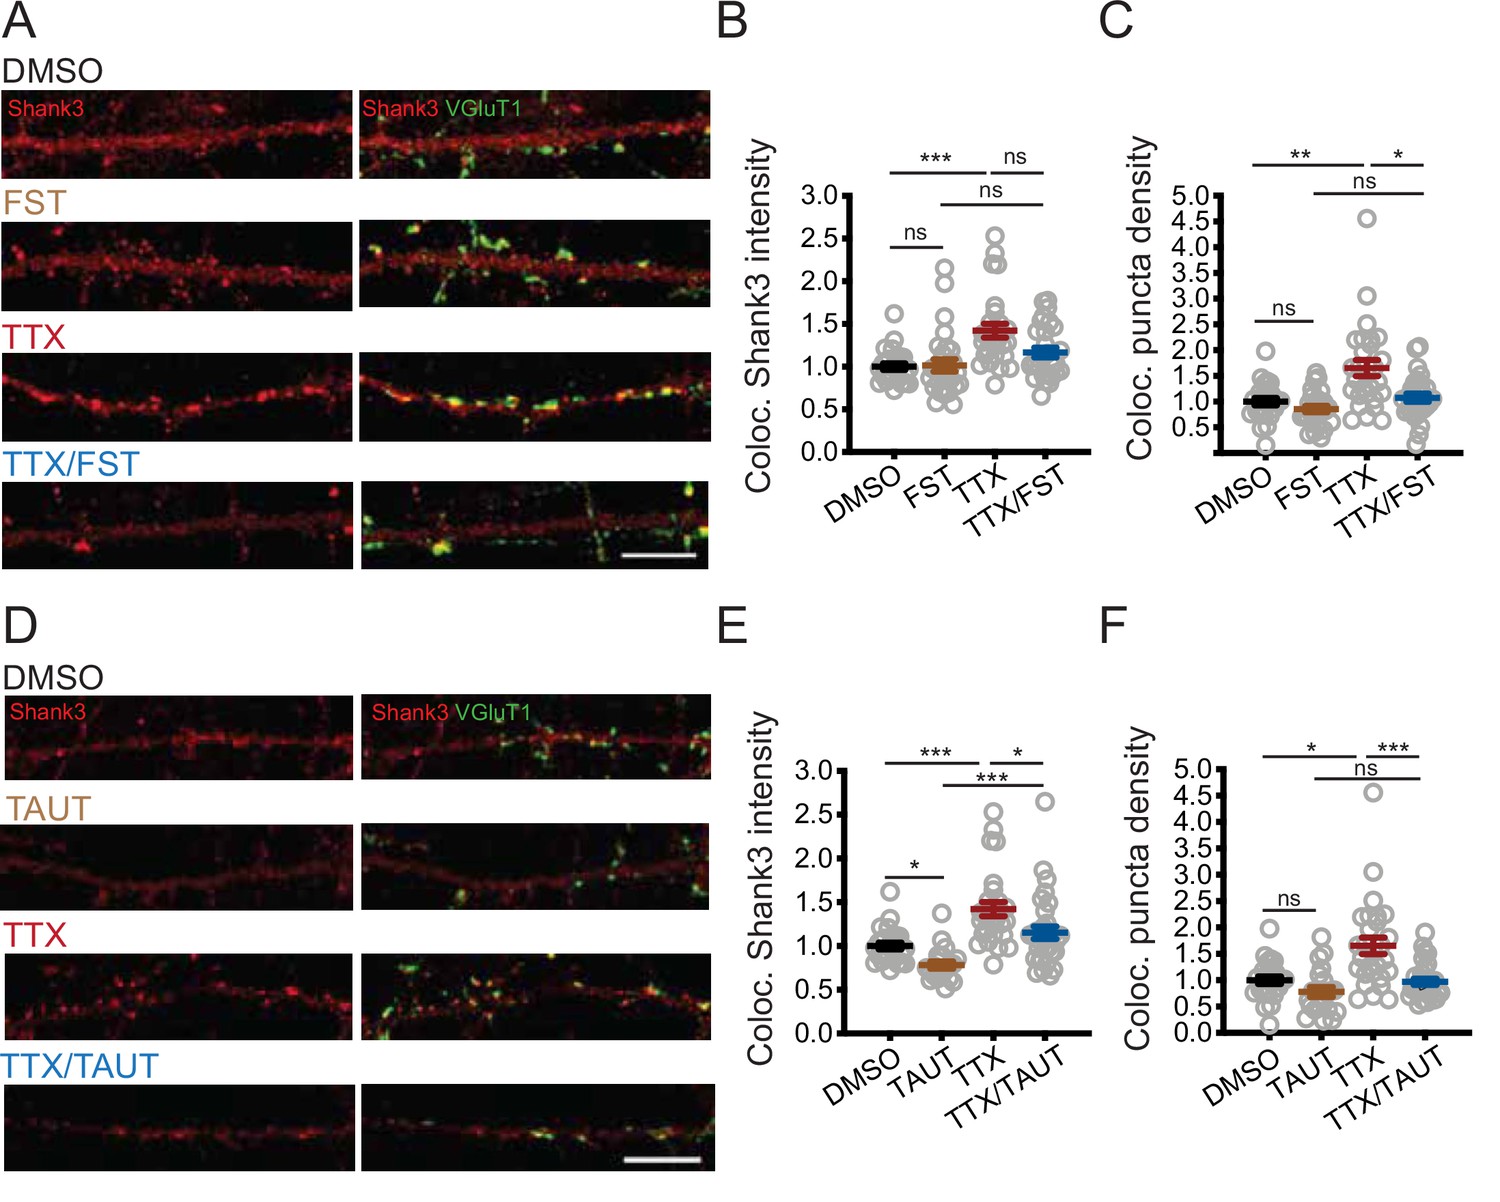
PP2A activity is required for tetrodotoxin (TTX)-induced synaptic enrichment of Shank3.
(A) Representative images of synaptic enrichment of endogenous Shank3 upon treatment with TTX and PP2A inhibitor fostriecin (FST) (scale bar = 10 µm). (B) Quantification of synaptic Shank3 intensity in (A) (number of neurons: DMSO, n = 26, FST, n = 28, TTX, n = 28, TTX/FST, n = 29; Kruskal–Wallis test with post-hoc Dunn’s tests: DMSO vs. FST, p>0.9999, DMSO vs. TTX, ***p=0.0002, FST vs. TTX/FST, p=0.1259, TTX vs. TTX/FST, p=0.1292). (C) Quantification of density of synapses containing Shank3 in (A) (Kruskal–Wallis test with post-hoc Dunn’s tests: DMSO vs. FST, p=0.9458, DMSO vs. TTX, **p=0.0051, FST vs. TTX/FST, p=0.2446, TTX vs. TTX/FST, *p=0.0273). (D) Representative images of synaptic enrichment of endogenous Shank3 upon treatment with TTX and PP1 inhibitor tautomycetin (TAUT) (scale bar = 10 µm). (E) Quantification of synaptic Shank3 intensity in (D) (number of neurons: DMSO, n = 26, TAUT, n = 21, TTX, n = 28, TTX/TAUT, n = 32; Kruskal–Wallis test with post-hoc Dunn’s tests: DMSO vs. TAUT, *p=0.0315, DMSO vs. TTX, ***p=0.0006, TAUT vs. TTX/TAUT, ***p=0.0002, TTX vs. TTX/TAUT, *p=0.0392). (F) Quantification of density of synapses containing Shank3 in (D) (Kruskal–Wallis test with post-hoc Dunn’s tests: DMSO vs. TAUT, p=0.2450, DMSO vs. TTX, *p=0.0116, TAUT vs. TTX/TAUT, p=0.6552, TTX vs. TTX/TAUT, ***p=0.0007). Also see Figure 5—figure supplement 1 and Figure 5—source data 1.
-
Figure 5—source data 1
Source data for Figure 5.
- https://cdn.elifesciences.org/articles/74277/elife-74277-fig5-data1-v2.xlsx
Figure 5—figure supplement 1
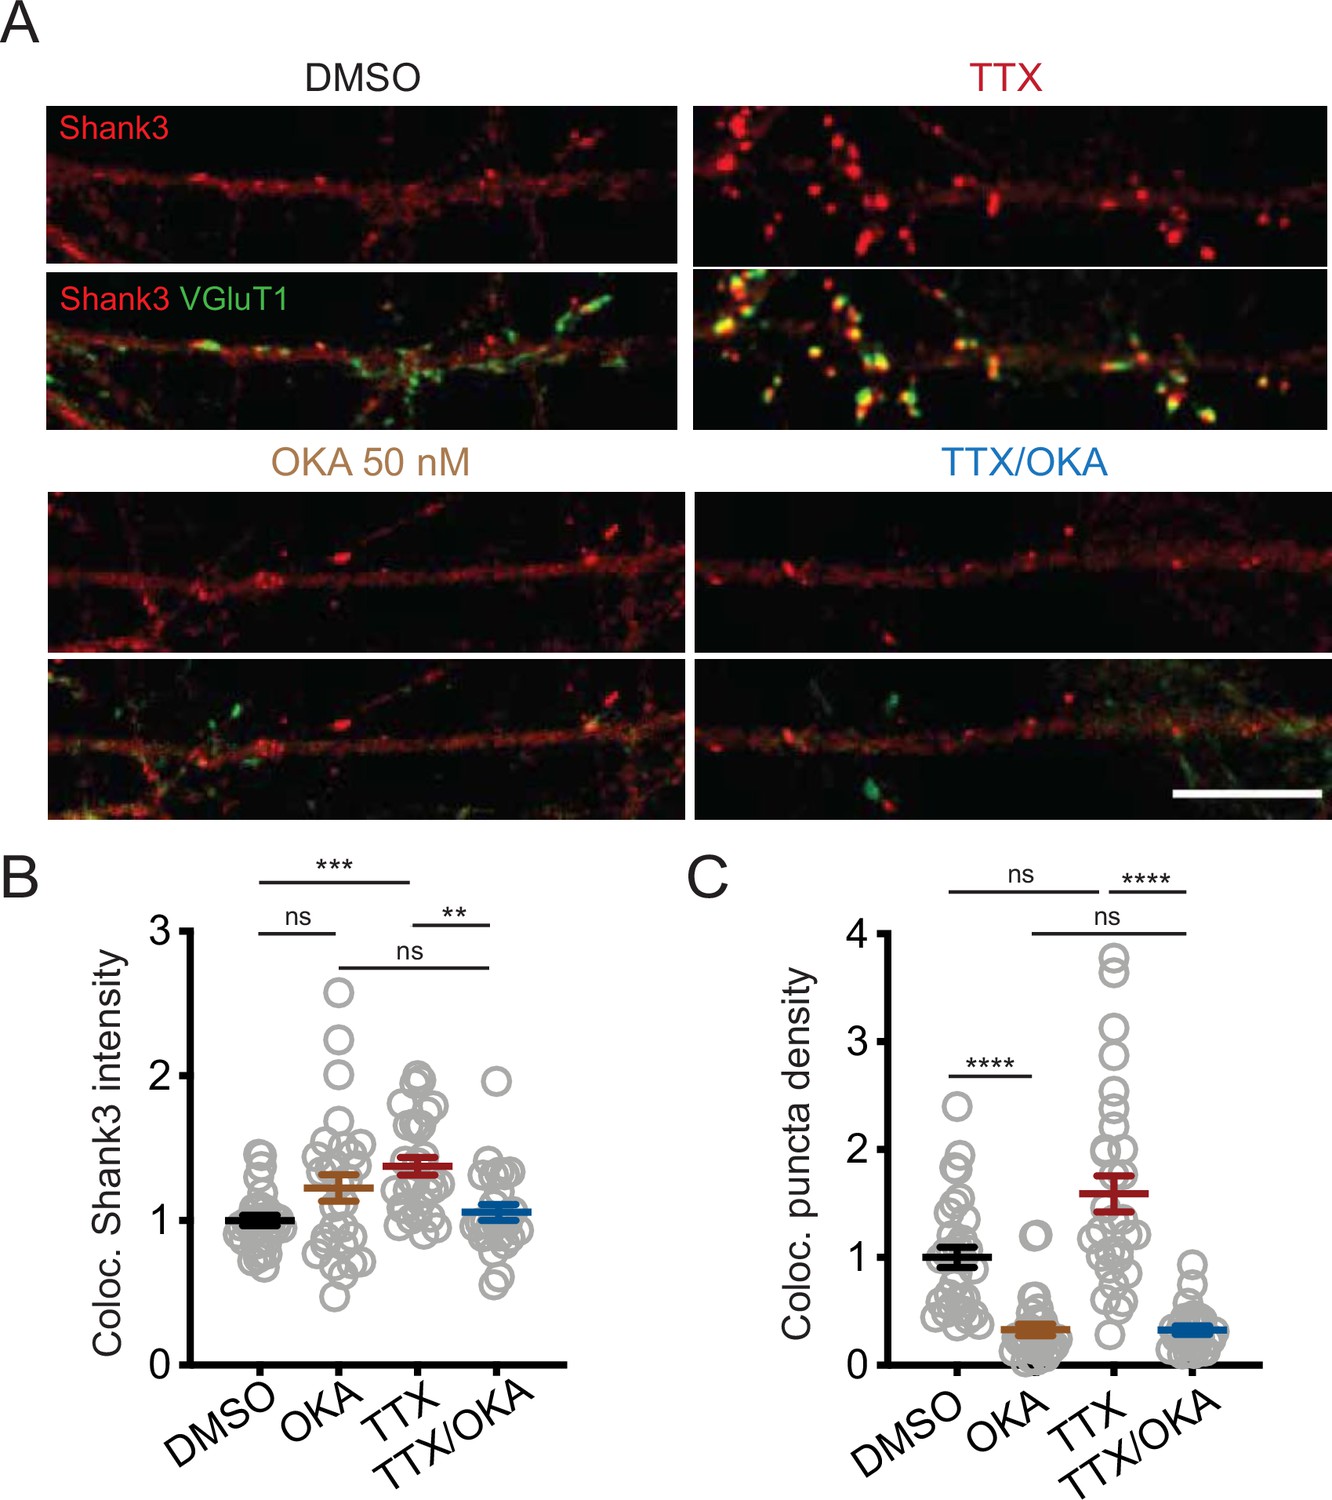
Inhibition of PP2A by okadaic acid (OKA) reverses tetrodotoxin (TTX)-induced synaptic enrichment of Shank3.
(A) Representative images of synaptic enrichment of endogenous Shank3 upon treatment with TTX and PP2A inhibitor OKA (50 nM, scale bar = 10 µm). (B) Quantification of synaptic Shank3 intensity in (A) (DMSO, n = 31, OKA, n = 29, TTX, n = 30, TTX/OKA, n = 26; Kruskal–Wallis test with post-hoc Dunn’s tests: DMSO vs. OKA, p=0.3286, DMSO vs. TTX, ***p=0.0002, OKA vs. TTX/OKA, p>0.9999, TTX vs. TTX/OKA, **p=0.0036). (C) Quantification of density of synapses containing Shank3 in (A) (Kruskal–Wallis test with post-hoc Dunn’s tests: DMSO vs. OKA, ****p<0.0001, DMSO vs. TTX, p=0.5125, OKA vs. TTX/OKA, p>0.9999, TTX vs. TTX/OKA, ****p<0.0001). Also see Figure 5—figure supplement 1—source data 1.
-
Figure 5—figure supplement 1—source data 1
Source data for Figure 5—figure supplement 1.
- https://cdn.elifesciences.org/articles/74277/elife-74277-fig5-figsupp1-data1-v2.xlsx
Figure 6 with 2 supplements
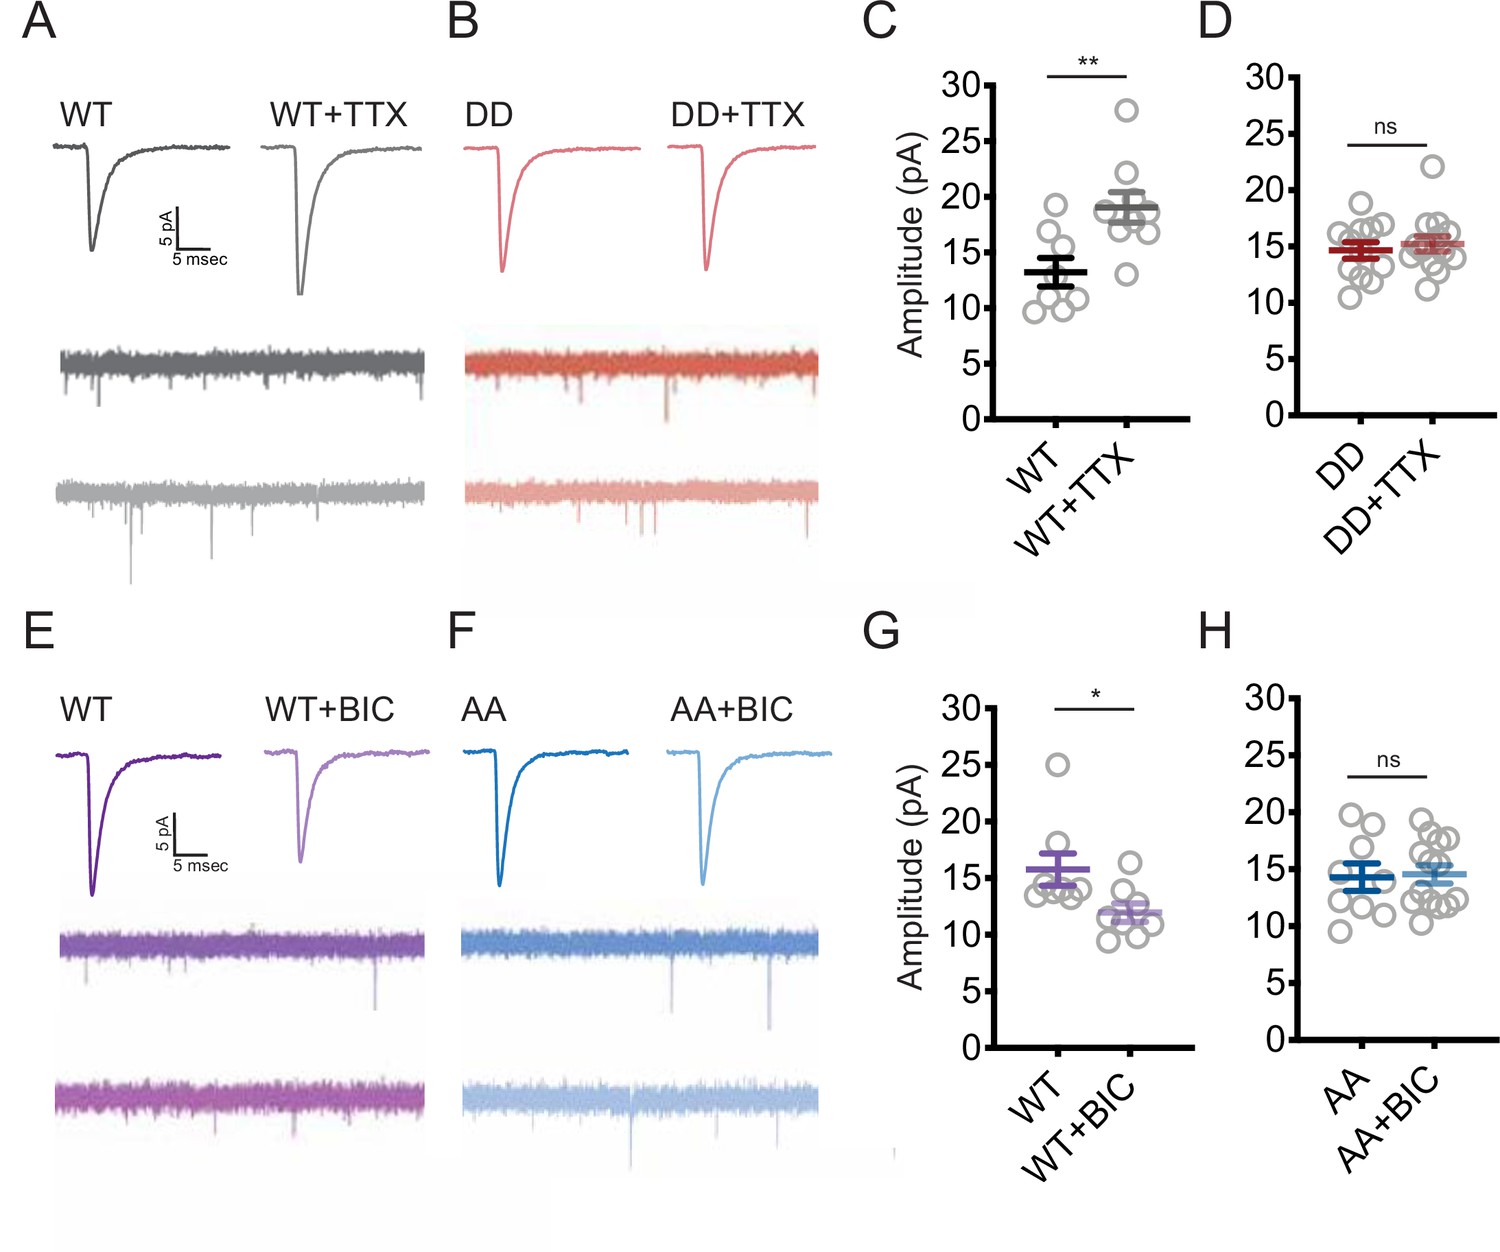
Changes in the phosphorylation state of Shank3 are crucial for bidirectional synaptic scaling.
(A, B) Representative miniature excitatory postsynaptic current (mEPSC) recordings from neurons overexpressing Shank3 WT (A) or DD mutant (B) during scaling up. (C) Quantification of average mEPSC amplitude in (A) (WT, n = 8, WT + tetrodotoxin [TTX], n = 9; unpaired two-tailed t-test: **p=0.0074). (D) Quantification of average mEPSC amplitude in (B) (number of neurons: DD, n = 12, DD + TTX, n = 14; unpaired two-tailed t-test: p=0.5708). (E, F) Representative traces of mEPSCs recorded from neurons overexpressing Shank3 WT (E) or AA mutant (F) during scaling down. (G) Quantification of average mEPSC amplitude in (E) (number of neurons: WT, n = 8, WT + bicuculline [BIC], n = 8; Mann–Whitney test: *p=0.0148). (H) Quantification of average mEPSC amplitude in (F) (AA, n = 9, AA + BIC, n = 14; unpaired two-tailed t-test: p=0.8612). Also see Figure 6—figure supplement 1, Figure 6—figure supplement 2, and Figure 6—source data 1.
-
Figure 6—source data 1
Source data for Figure 6.
- https://cdn.elifesciences.org/articles/74277/elife-74277-fig6-data1-v2.xlsx
Figure 6—figure supplement 1
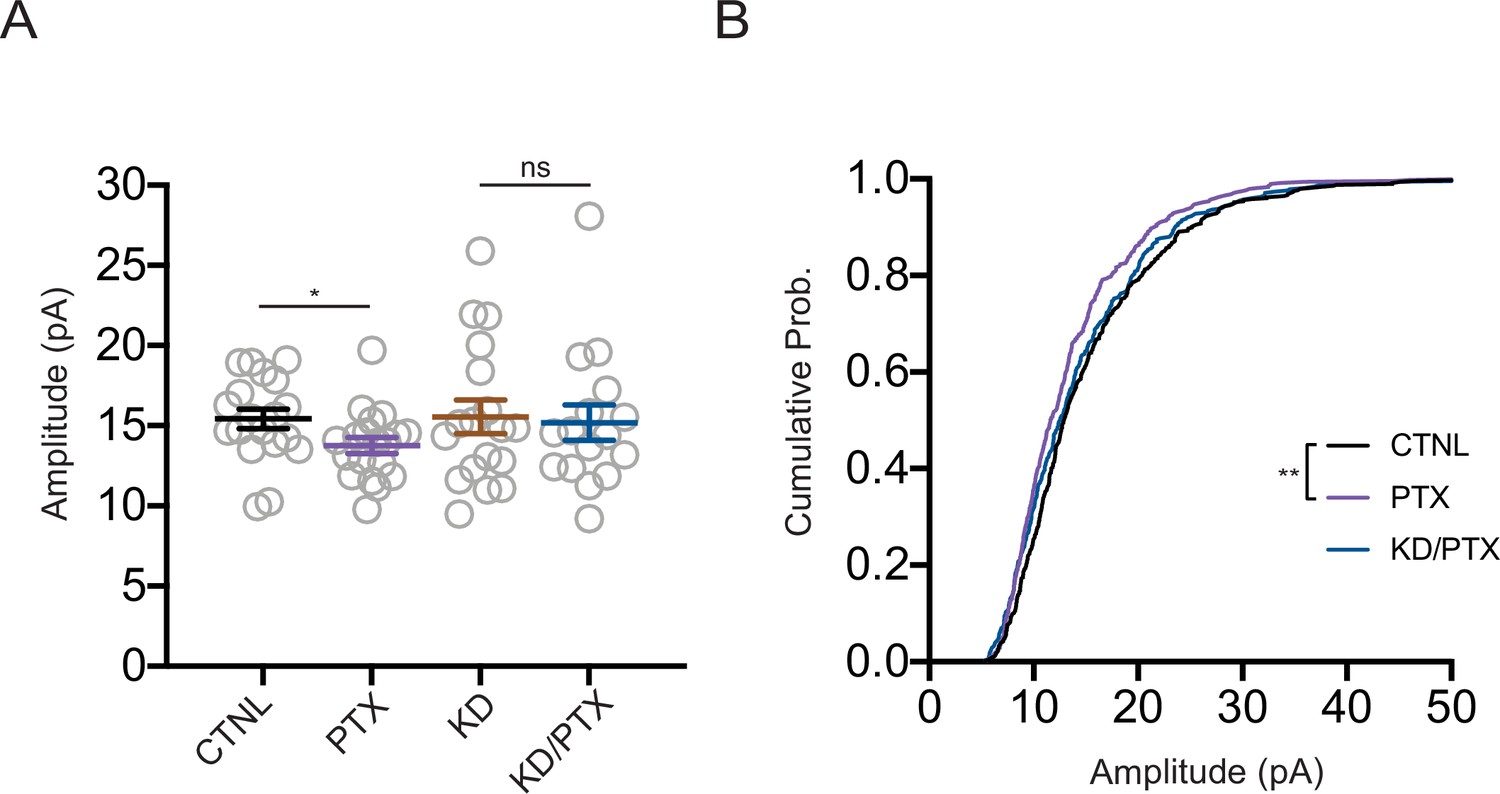
Shank3 is required for synaptic scaling down.
(A) Quantification of average miniature excitatory postsynaptic current (mEPSC) amplitudes recorded from neurons depleted of Shank3. Scaling down was induced by 24 hr treatment with picrotoxin (PTX) (CTNL, n = 19, PTX, n = 19, KD, n = 18, KD/PTX, n = 16; unpaired t-test: CTNL vs. PTX, *p=0.041; Mann–Whitney test: KD vs. KD/PTX, p=0.8515). (B) Cumulative histogram of mEPSC amplitudes (two-sample Kolmogorov–Smirnov test: CTNL vs. PTX, **p=0.0017, PTX vs. KD/PTX, p=0.0624, CTNL vs. KD/PTX, p=0.0945). Also see Figure 6—figure supplement 1—source data 1.
-
Figure 6—figure supplement 1—source data 1
Source data for Figure 6—figure supplement 1.
- https://cdn.elifesciences.org/articles/74277/elife-74277-fig6-figsupp1-data1-v2.xlsx
Figure 6—figure supplement 2
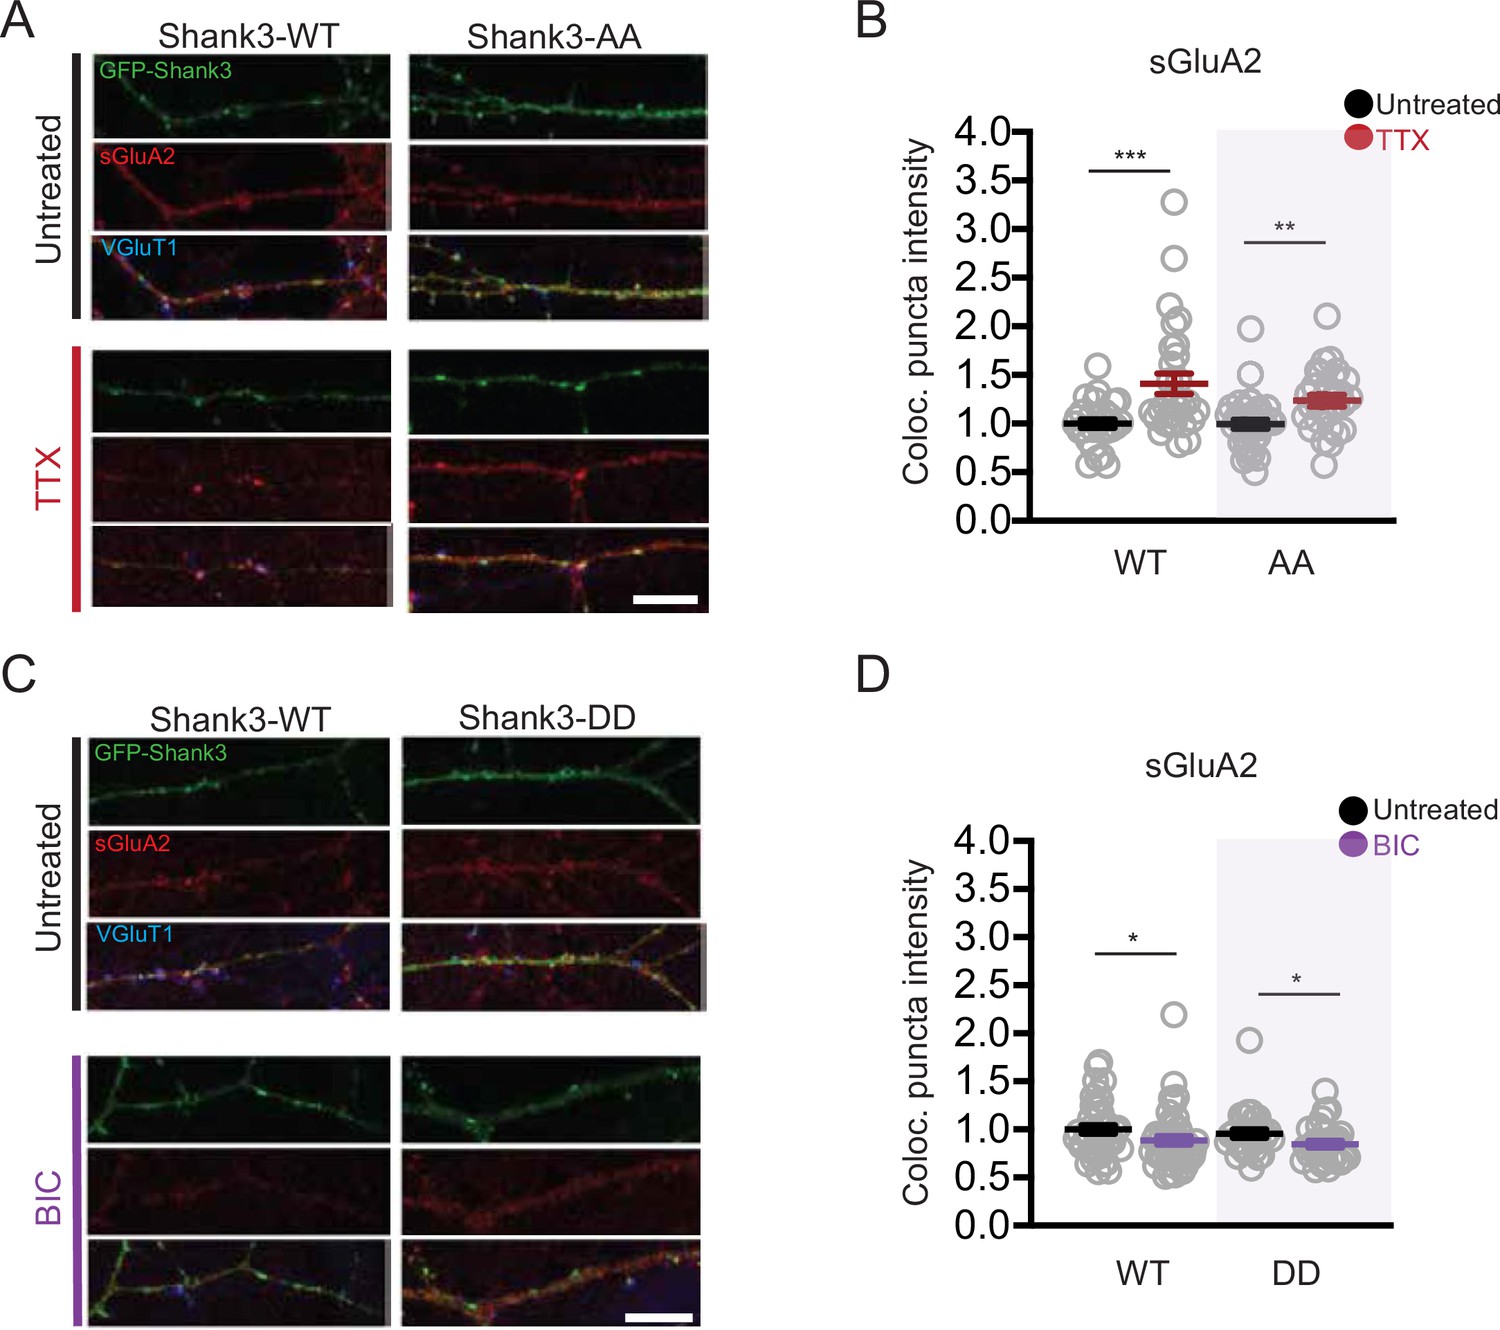
Scaling up and down remain intact in neurons overexpressing Shank3 AA and DD, respectively.
(A) Representative images of changes in synaptic sGluA2 intensity in neurons overexpressing Shank3 WT and AA during scaling up (scale bar = 10 µM). (B) Quantification of average synaptic sGluA2 intensity in (A) (WT, n = 28, WT/tetrodotoxin [TTX], n = 30, AA, n = 34, AA/TTX, n = 28; Mann–Whitney test: WT vs. WT/TTX, ***p=0.0009, AA vs. AA/TTX, **p=0.0013). (C) Representative images of changes in synaptic sGluA2 intensity in neurons overexpressing Shank3 WT and DD during scaling down (scale bar = 10 µM). (D) Quantification of average synaptic sGluA2 intensity in (C) (WT, n = 41, WT/bicuculline [BIC], n = 45, DD, n = 29, DD/BIC, n = 30; Mann–Whitney test: WT vs. WT/BIC, *p=0.023, DD vs. DD/BIC, *p=0.030). Also see Figure 6—figure supplement 2—source data 1.
-
Figure 6—figure supplement 2—source data 1
Source data for Figure 6—figure supplement 2.
- https://cdn.elifesciences.org/articles/74277/elife-74277-fig6-figsupp2-data1-v2.xlsx
Figure 7
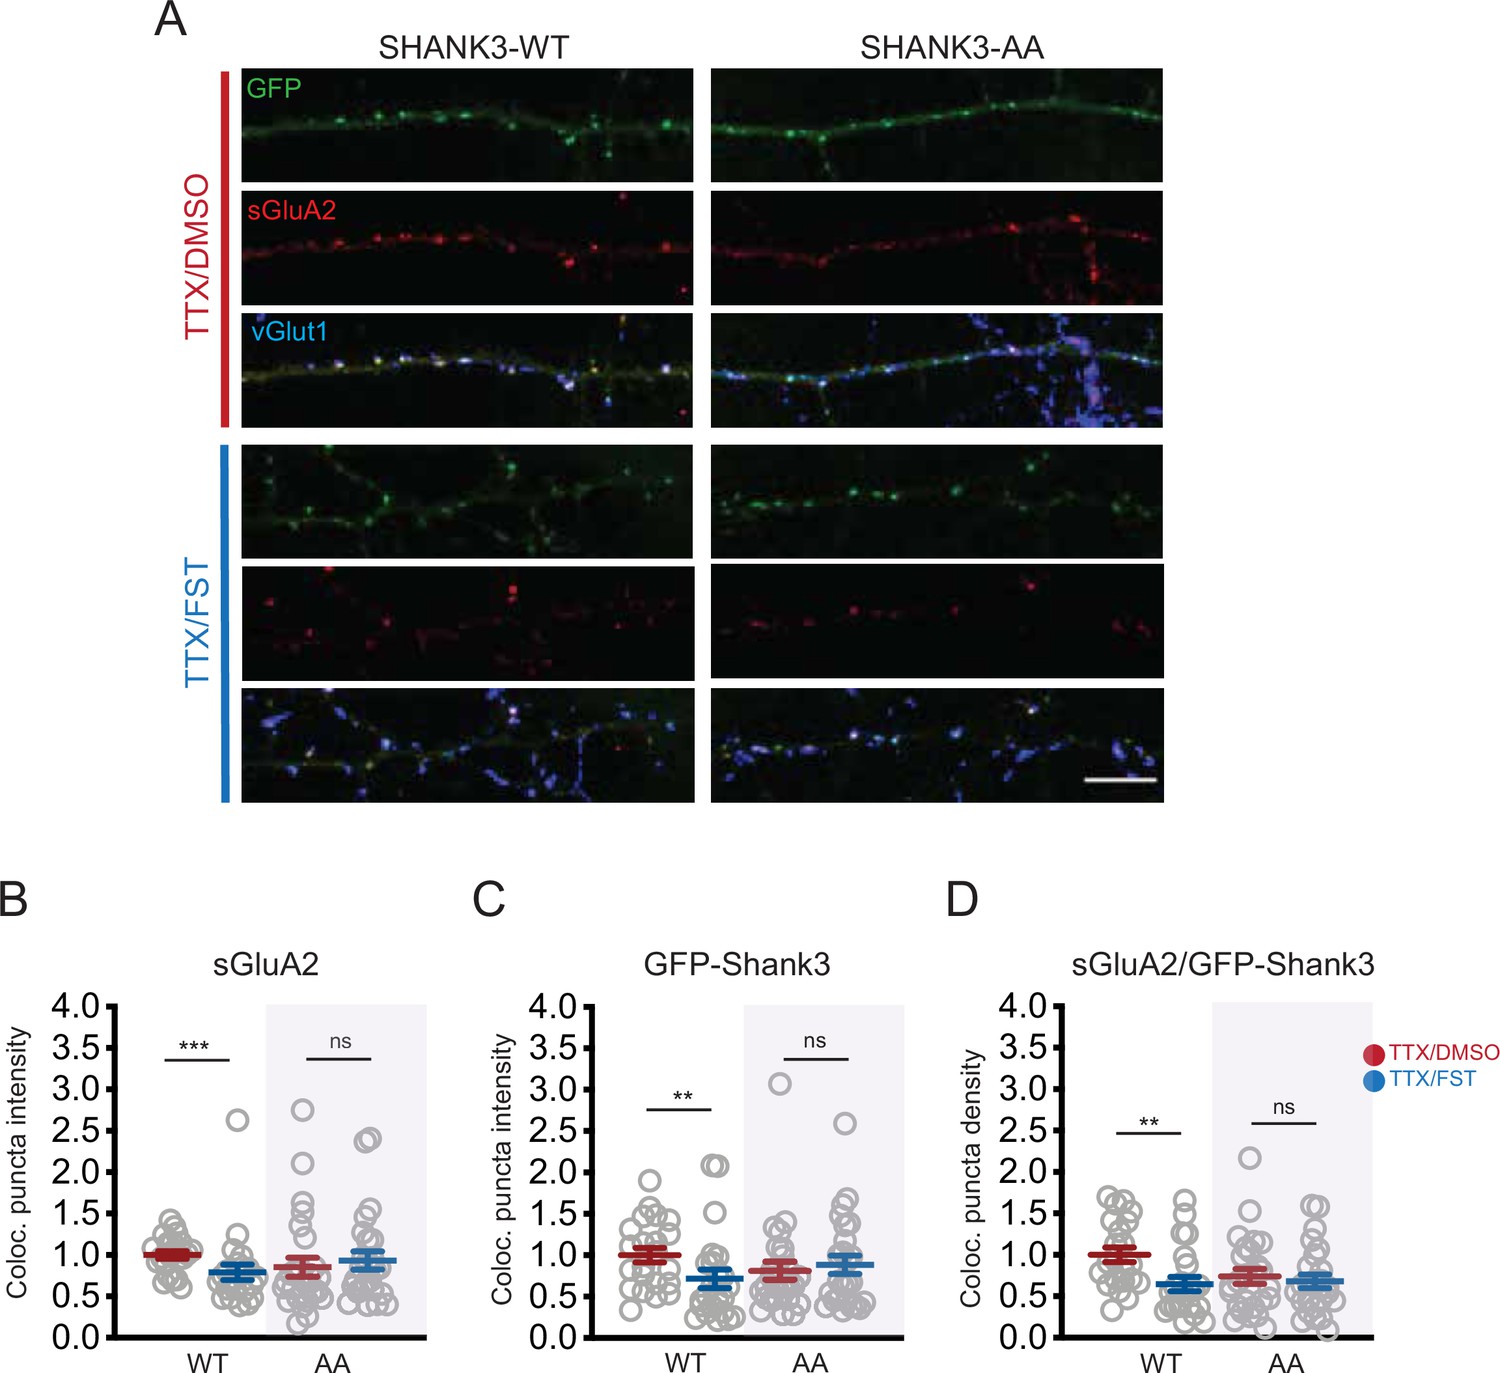
Brief PP2A inactivation reverses scaling up.
(A) Representative images showing the effects of 1 hr fostriecin (FST) treatment on synaptic sGluA2 intensity in neurons expressing Shank3 WT or AA, after 24 hr of tetrodotoxin (TTX) to scale up synaptic strengths (scale bar = 10 µm). (B) Quantification of synaptic sGluA2 intensity in (A) (number of cells: WT/TTX, n = 22, WT/TTX/FST, n = 23, AA/TTX, n = 26, AA/TTX/FST, n = 25; Mann–Whitney test: WT/TTX vs. WT/TTX/FST, ***p=0.0007, AA/TTX vs. AA/TTX/FST, p=0.3739). (C) Quantification of synaptic Shank3 intensity in (A) (Mann–Whitney test: WT/TTX vs. WT/TTX/FST, **p=0.0090, AA/TTX vs. AA/TTX/FST, p=0.7296). (D) Quantification of the density of puncta containing sGluA2 and Shank3 (Mann–Whitney test: WT/TTX vs. WT/TTX/FST, **p=0.0016, AA/TTX vs. AA/TTX/FST, p=0.7017). Each data point indicates a cell, and the total number (n) was pooled from five independent experiments. Also see Figure 7—source data 1.
-
Figure 7—source data 1
Source data for Figure 7.
- https://cdn.elifesciences.org/articles/74277/elife-74277-fig7-data1-v2.xlsx
Author response image 1
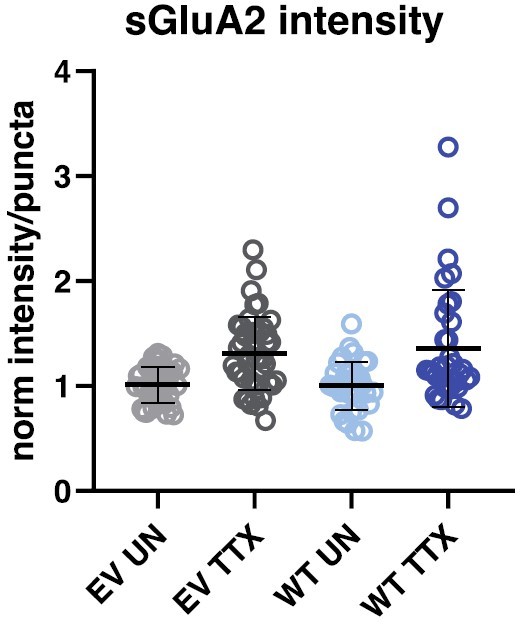
Overexpressing wild-type Shank3 does not impact synaptic surface GluA2 intensity at baseline, or the magnitude of scaling up.
Quantification of average synaptic sGluA3 intensity in neurons overexpressing Shank3-WT or a control GFP vector with and without TTX treatment (EV UN, n = 40, EV TTX, n = 45, WT UN, n = 33, WT TTX, n = 34). EV, empty vector; WT, Shank3-WT; UN, untreated.
Author response image 2
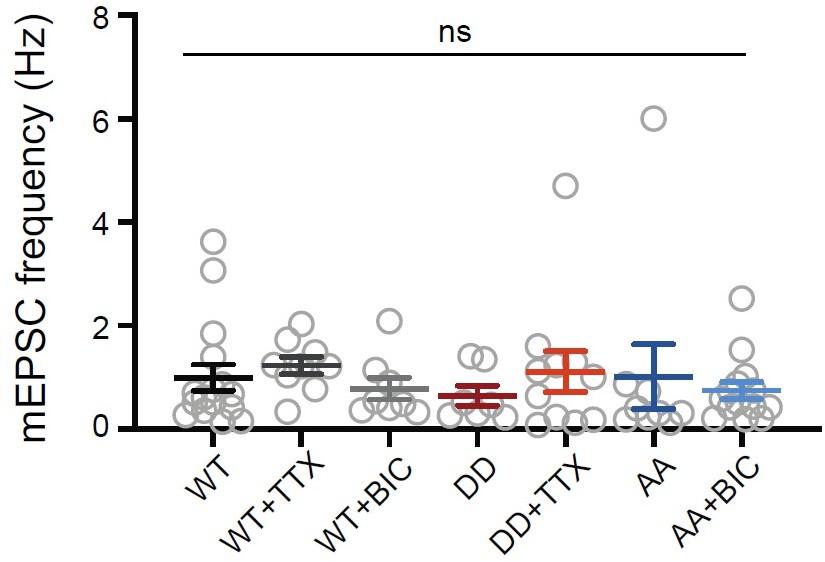
Overexpressing Shank3 phospho-mutants does not change mEPSC frequency at baseline or during the scaling protocols.
Quantification of average mEPSC frequency in neurons pooled from the dataset in Figure 6 (WT, n = 16, WT + TTX, n = 9, WT + BIC, n = 8, DD, n = 7, DD + TTX, n = 11, AA, n = 9, AA + BIC, n = 14; Kruskal- Wallis test: p = 0.2483).
Tables
Key resources table
| Reagent type (species) or resource | Designation | Source or reference | Identifiers | Additional information |
|---|---|---|---|---|
| Strain, strain background (Rattus norvegicus) | Long–Evans | Charles River Laboratories | Strain: 006; RRID:RGD_2308852 | |
| Strain, strain background (Mus musculus) | C57BL/6 | Charles River Laboratories | Strain:027; RRID:IMSR_CRL:27 | |
| Cell line | HEK293T | ATCC | CRL-3216; RRID:CVCL_0063 | |
| Antibody | Anti-Shank3(guinea pig polyclonal) | Synaptic Systems | Cat# 162304; RRID:AB_2619863 | IF (1:1000); WB (1:1000) |
| Antibody | Anti-pS1615(rabbit polyclonal) | This paper | WB (1:1000)Detailed information can be found in section ‘Generation and validation of phosphospecific Shank3 antibody’, and the reagent is available upon request | |
| Antibody | Anti-HA(rabbit monoclonal, C29F4) | Cell Signaling Technology | Cat# 3724S; RRID:AB_1549585 | IP (1:500) |
| Antibody | Anti-HA(chicken polyclonal) | Aves Labs | Cat# ET-HA100; RRID:AB_2313511 | WB (1:1000) |
| Antibody | Anti-rabbit Alexa Fluor 680(donkey polyclonal) | Jackson ImmunoResearch | Cat# 711-625-152; RRID:AB_2340627 | WB (1:5000) |
| Antibody | Anti-guinea pig IRDye 800CW(donkey polyclonal) | LI-COR | Cat# 925-32411; RRID:AB_2814905 | WB (1:5000) |
| Antibody | Anti-chicken IRDye 800CW(donkey polyclonal) | LI-COR | Cat# 925-32218; RRID:AB_2814922 | WB(1:5000) |
| Antibody | Anti-GFP(chicken polyclonal) | Aves Labs | Cat# GFP-1020; RRID:AB_2307313 | IF (1:1000) |
| Antibody | Anti-VGluT1(guinea pig polyclonal) | Synaptic Systems | Cat# 135304; RRID:AB_887878 | IF (1:1000) |
| Antibody | Anti-VGluT1(rabbit polyclonal) | Synaptic Systems | Cat# 135302; RRID:AB_887877 | IF (1:1000) |
| Antibody | Anti-GluA2(mouse monoclonal) | Gift from Eric Gouaux, OHSU | IF (1:1000) | |
| Antibody | Anti-chicken Alexa 488(goat polyclonal) | Thermo Fisher Scientific | Cat# A-11039; RRID:AB_142924 | IF (1:400) |
| Antibody | Anti-mouse Alexa 555(goat polyclonal) | Thermo FisherScientific | Cat# A-21424; RRID:AB_141780 | IF (1:400) |
| Antibody | Anti-guinea pig Alexa 555(goat polyclonal) | Thermo FisherScientific | Cat# A-21435; RRID:AB_2535856 | IF (1:400) |
| Antibody | Anti-guinea pig Alexa 647(goat polyclonal) | Thermo FisherScientific | Cat# A-21450; RRID:AB_2735091 | IF (1:400) |
| Antibody | Anti-rabbit Alexa 647(goat polyclonal) | Thermo FisherScientific | Cat# A-21245; RRID:AB_2535813 | IF (1:400) |
| Recombinant DNA reagent | Shank3 Short Hairpin (PVLTHM) | Gift from Chiara Verpelli | Verpelli et al., 2011 | |
| Recombinant DNA reagent | pDEST53-CMV-Cycle3GFP-Shank3 WT (short-hairpin insensitive) | Gift from Chiara Verpelli | Verpelli et al., 2011 | |
| Recombinant DNA reagent | pDEST53-CMV-Cycle3GFP-Shank3 S1586A/ S1615A | This paper | Detailed information can be found in the section ‘Expression constructs and generation of Shank3 mutants,’ and the reagent is available upon request | |
| Recombinant DNA reagent | pDEST53-CMV-Cycle3GFP-Shank3 S1586D/ S1615D | This paper | Detailed information can be found in the section ‘Expression constructs and generation of Shank3 mutants,’ and the reagent is available upon request | |
| Recombinant DNA reagent | pDEST53-CMV-HA-Shank3 WT | This paper | Detailed information can be found in the section ‘Expression constructs and generation of Shank3 mutants,’ and the reagent is available upon request | |
| RecombinantDNA reagent | pDEST53-CMV-HA-Shank3 S1586A/ S1615A | This paper | Detailed information can be found in the section ‘Expression constructs and generation of Shank3 mutants,’ and the reagent is available upon request | |
| Recombinant DNA reagent | pAAV-CMV-PI-EGFP-WPRE-bGH | Gift from James M. Wilson | Addgene# 105530; RRID:Addgene_105530 | |
| Commercial assay or kit | Lipofectamine 2000 | Thermo FisherScientific | Cat# 11668-027 | |
| Commercial assay or kit | Gibson Assembly Master Mix | New England Biolabs | Cat# E2611S | |
| Commercial assay or kit | Lambda protein phosphatase | New England Biolabs | Cat# P0753S | |
| Commercial assay or kit | BCA Protein Assay Kit | Thermo FisherScientific | Cat# 23227 | |
| Commercial assay or kit | Protein-G Magnetic Beads | Thermo FisherScientific | Cat# 88847 | |
| Commercial assay or kit | SimplyBlue SafeStain | Thermo FisherScientific | Cat# LC6060 | |
| Commercial assay or kit | PP2A Immunoprecipitation Phosphatase Assay Kit | Millipore | Cat# 17-313 | |
| Commercial assay or kit | Ni-NTA Superflow Agarose Beads | QIAGEN | Cat# 30410 | |
| Chemical compound, drug | Tetrodotoxin | Tocris | Cat# 1069 | |
| Chemical compound, drug | Bicuculline methobromide | Tocris | Cat# 0109 | |
| Chemical compound, drug | Picrotoxin | Sigma-Aldrich | Cat# P1675 | |
| Chemical compound, drug | Okadaic acid | Santa Cruz | Cat# sc-3513 | |
| Chemical compound, drug | Tautomycetin | Tocris | Cat# 2305 | |
| Chemical compound, drug | Fostriecin | Tocris | Cat# 1840 | |
| Chemical compound, drug | KN62 | Tocris | Cat# 1277 | |
| Chemical compound, drug | KN93 | Tocris | Cat# 1278 | |
| Chemical compound, drug | H89 | Tocris | Cat# 2910 | |
| Chemical compound, drug | Sequencing-grade trypsin | Promega | Cat# V5111 | |
| Chemical compound, drug | Tandem Mass Tag (TMT) 10plex | Thermo FisherScientific | Cat# 90110 | |
| Software, algorithm | Image Lab Software | Bio-Rad | RRID:SCR_014210 | https://www.bio-rad.com/en-us/product/image-lab-software?ID=KRE6P5E8Z&source_wt=imagelabsoftware_surl |
| Software, algorithm | ZEN Black | Zeiss | RRID:SCR_018163 | https://www.zeiss.com |
| Software, algorithm | Metamorph | Molecular Devices | RRID:SCR_002368 | http://www.moleculardevices.com/Products/Software/Meta-Imaging-Series/MetaMorph.html |
| Software, algorithm | Fiji | Fiji | RRID:SCR_002285 | http://fiji.sc |
| Software, algorithm | GraphPad Prism | GraphPad | RRID:SCR_002798 | http://www.graphpad.com/ |
| Software, algorithm | IGOR pro | Wavemetrics | RRID:SCR_000325 | https://www.wavemetrics.com/products/igorpro/igorpro.htm |
| Software, algorithm | Spectrum mill v.7.00.208 | Agilent Technologies | ||
| Software, algorithm | R v 4.0 | The R Foundation | RRID:SCR_001905 | https://www.R-project.org/ |
| Software, algorithm | Cytoscape v 3.8.2 | Cytoscape | RRID:SCR_003032 | http://cytoscape.org |
| Software, algorithm | EnrichmentMap | EnrichmentMap | RRID:SCR_016052 | http://baderlab.org/Software/EnrichmentMap |
| Other | Odyssey Blocking Buffer | LI-COR | Cat# 927-40000 | Detailed information can be found in the section ‘Immunoprecipitation and Western blotting’ |
| Other | DAPI-Fluoromount-G | SouthernBiotech | Cat# 0100-20 | Detailed information can be found in the section ‘Immunocytochemistry’ |
Additional files
Download links
A two-part list of links to download the article, or parts of the article, in various formats.
Downloads (link to download the article as PDF)
Open citations (links to open the citations from this article in various online reference manager services)
Cite this article (links to download the citations from this article in formats compatible with various reference manager tools)
A bidirectional switch in the Shank3 phosphorylation state biases synapses toward up- or downscaling
eLife 11:e74277.
https://doi.org/10.7554/eLife.74277


