Dynamics and nanoscale organization of the postsynaptic endocytic zone at excitatory synapses
- Cell Biology, Neurobiology and Biophysics, Department of Biology, Faculty of Science, Utrecht University, Netherlands
Figures
Figure 1 with 1 supplement
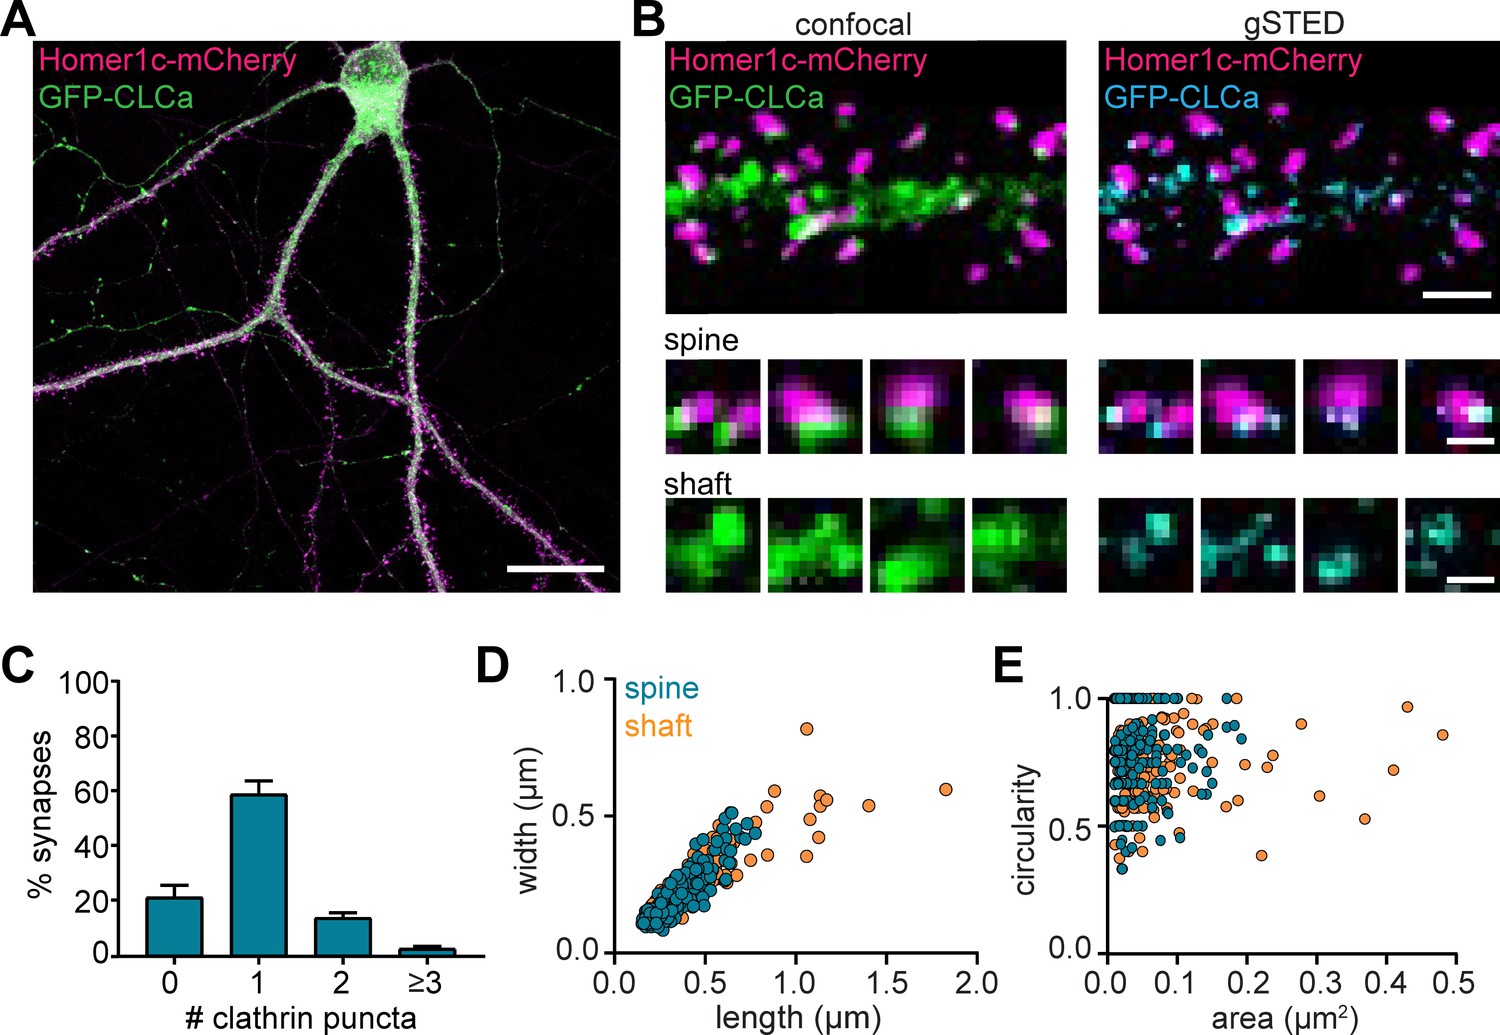
Heterogenous morphology of clathrin-coated structures in dendrites.
(A) Example image of neuron expressing Homer1c-mCherry and GFP-CLCa. Scale bar: 20 µm. (B) Comparison of confocal and gSTED images of dendrite expressing Homer1c-mCherry and GFP-CLCa. Scale bars dendrite: 2 µm, zooms: 500 nm. (C) Number of CCSs per PSD per neuron, represented as mean ± SEM (N = 12 neurons). (D) Scatterplot of the length (µm) and width (µm) of CCSs in the dendritic shaft and associated with Homer1c based on ferret dimensions (spine: n = 248, shaft: n = 301). (E) Circularity ratio plotted against area (µm2) (spine: n = 248, shaft: n = 301).
-
Figure 1—source data 1
Excel sheet with numerical data represented as plots in Figure 1C, D and E.
- https://cdn.elifesciences.org/articles/74387/elife-74387-fig1-data1-v2.xlsx
Figure 1—figure supplement 1

Distribution of endogenously tagged CLCa in neurons.
(A) Example image of neuron expressing Homer1c-mCherry and GFP-CLCa knock-in construct. Scale bar: 20 µm. (B) Example image of CCSs in the dendrite (upper panel) and zooms of individual synapses associated with an EZ (lower panel). Scale bars: 2 µm, zooms: 500 nm. (C) Quantification of the average number of CCSs per synapse, plotted as mean ± SEM (n = 6).
-
Figure 1—figure supplement 1—source data 1
Excel sheet with numerical data represented as plot in Figure 1—figure supplement 1C.
- https://cdn.elifesciences.org/articles/74387/elife-74387-fig1-figsupp1-data1-v2.xlsx
Figure 2
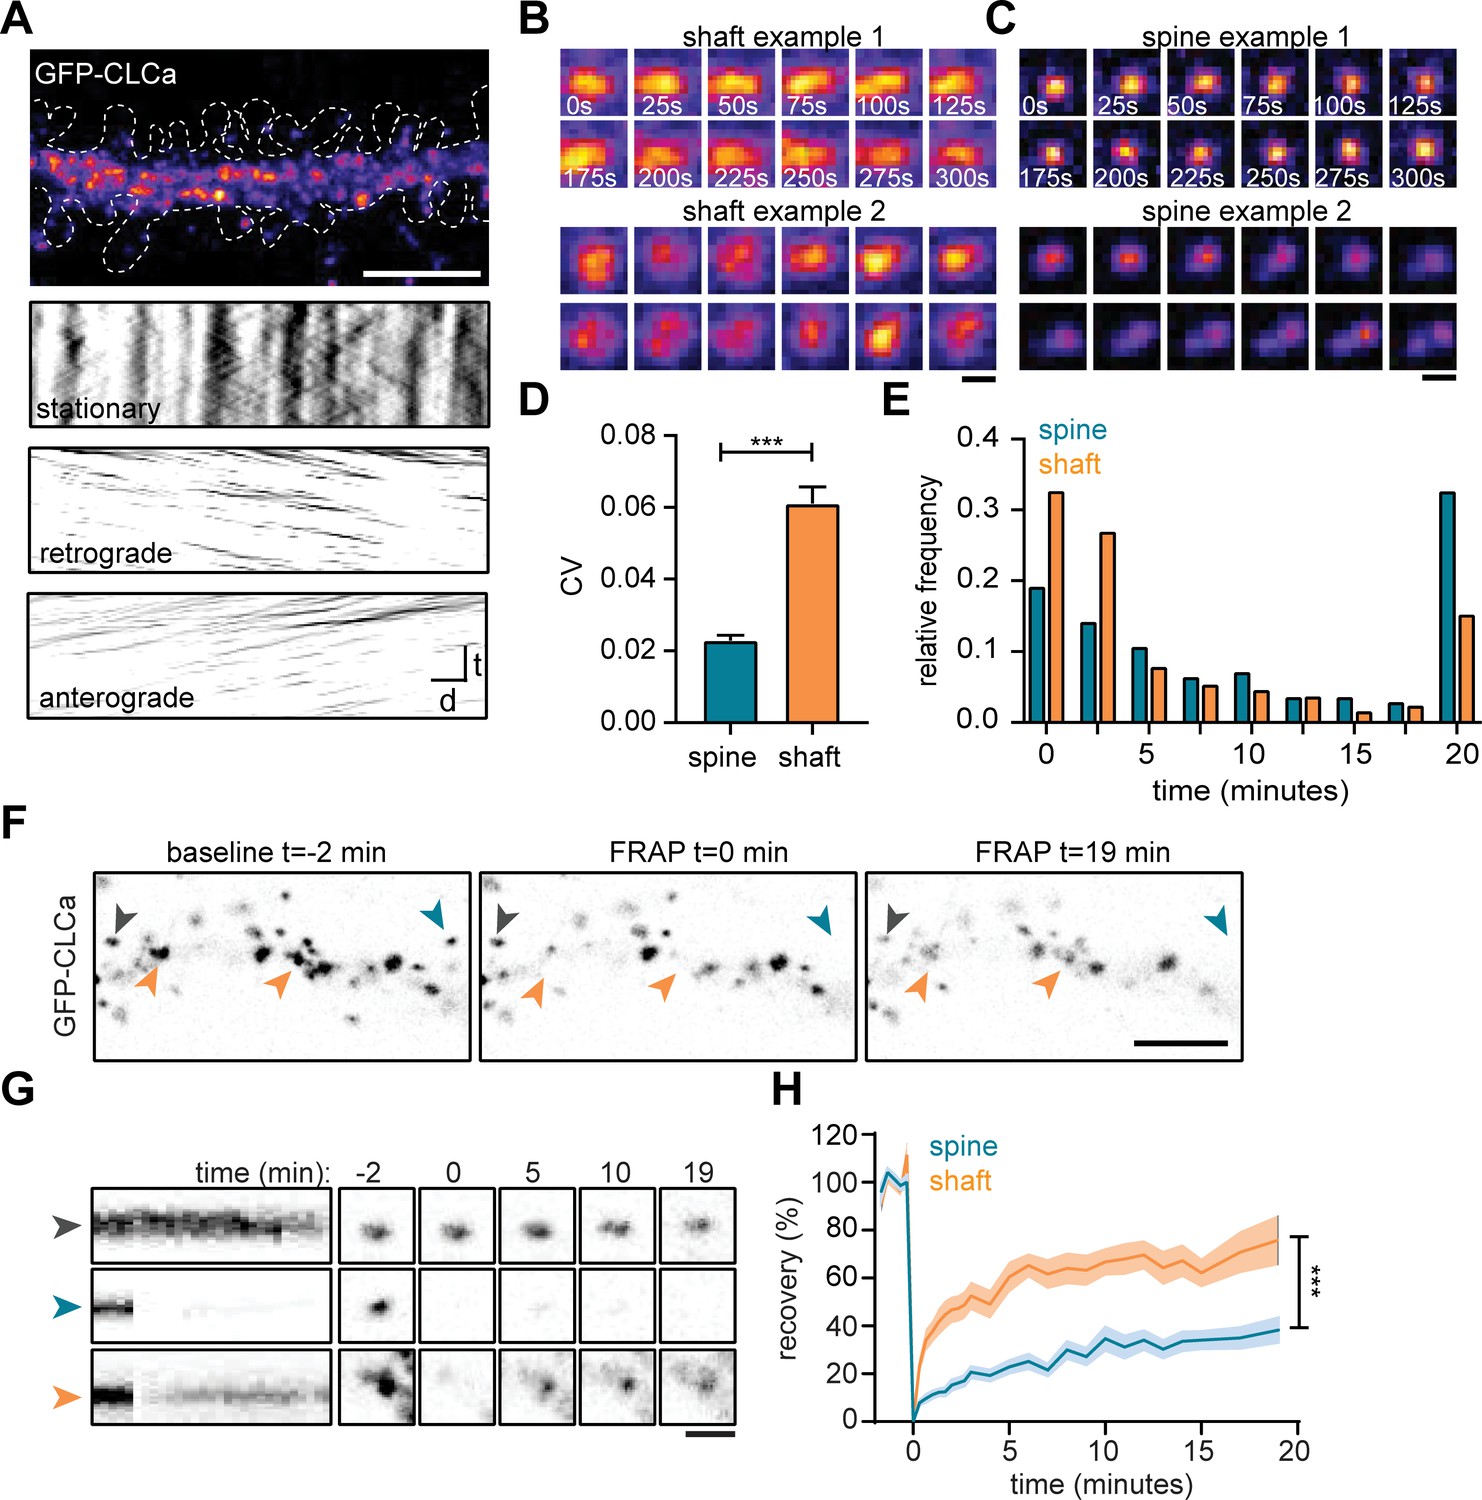
The EZ is dynamically distinct from shaft CCSs.
(A) Representative dendrite expressing GFP-CLCa, scale bar: 5 µm, and kymographs of CCSs in the dendritic shaft only, separated in stationary (upper panel), retrograde (middle panel) and anterograde (lower panel) particles. Scale: time t, on the y-axis is 5 min, and distance d on x-axis is 20 µm. (B) Two examples of intensity fluctuations in stationary dendritic shaft structures. Scale bar: 1 µm. (C) Two examples of intensity fluctuations in spine structures. Scale bar: 1 µm. (D) Fluctuations in intensity plotted as the coefficient of variance (CV) between shaft and spine (spine: n = 48, shaft: n = 49, p < 0.001). Data represented at mean ± SEM. (E) Histogram of the lifetime of CCSs in shaft and spine (spine: n = 171, shaft n = 769), data represented as fraction. (F) Example images of GFP-CLCa before (left panel), directly after FRAP (middle panel) and recovery (right panel), scale bar: 5 µm. Gray arrow indicates control, unbleached region, blue indicated bleached EZ, orange indicates bleached stationary dendritic shaft structures. (G) Kymograph and example images of the structures indicated in F. Kymograph shows 22-min acquisition, scale bar: 1 µm. (H) Percentage of recovery in shaft (orange, n = 14) and spine (blue, n = 30).
-
Figure 2—source data 1
Excel sheet with numerical data represented as plots Figure 2D, E and H.
- https://cdn.elifesciences.org/articles/74387/elife-74387-fig2-data1-v2.xlsx
Figure 3 with 1 supplement

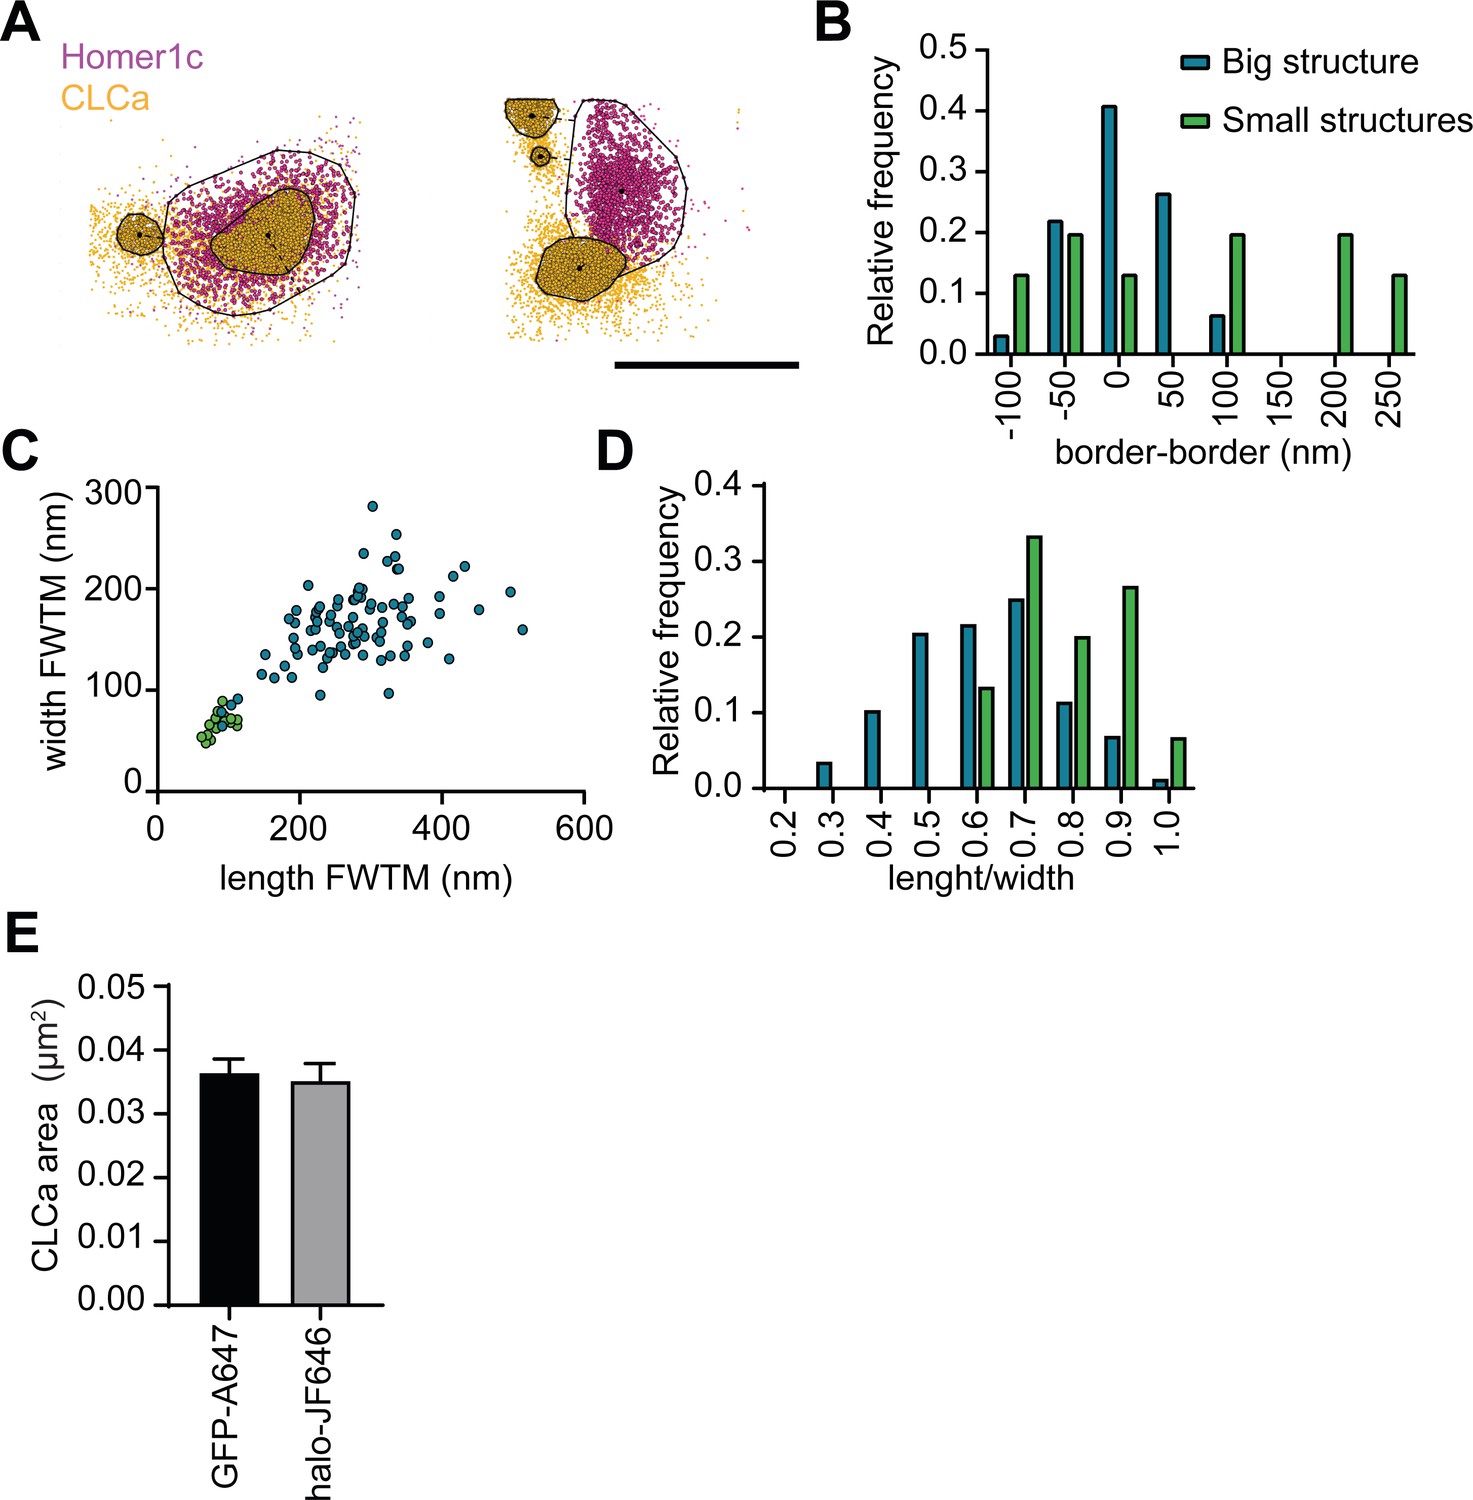
Nanoscale organization of the postsynaptic endocytic zone.
(A) SMLM image of dendrite expressing Homer1c-mCherry and GFP-CLCa labeled with CF568 and A647 and zooms of individual EZs, respectively. Scale bar upper panel: 2 µm, zooms: 250 nm. (B) Individual molecules of Homer1c (magenta) and CLCa (orange) are outlined using DBScan. Black dot and line indicate center of the EZ (dot) and distance to the border of the PSD (line). Scale bar: 500 nm. (C) Histogram of the border (Homer1c) to center (CLCa) distance in nm. (D) Scatterplot of the FWTM length (nm) and FWTM width (nm) of the EZ. (E) Histogram of the area of the EZ plotted as x103 nm2. (C–E) n = 107.
-
Figure 3—source data 1
Excel sheet with numerical data represented as plots Figure 3C, D and E.
- https://cdn.elifesciences.org/articles/74387/elife-74387-fig3-data1-v2.xlsx
Figure 3—figure supplement 1
SMLM reveals nanoscale scale architecture of PSD-associated CLCa structures.
(A) Example plots visualizing the individual localizations obtained for Homer1c (magenta) and CLCa (orange). Two or more individual CLCa structures can be observed per PSD. Scale bar: 500 nm. (B–D) Data visualized in these plots is the same data represented in Figure 3, but here a distinction was made between PSDs containing one (blue) or two (green) CLCa structures is made. (B) Histogram of the distance from the border of the PSD to the border of CLCa structures. (C) Scatterplot showing the dimensions of larger (blue) CLCa structures, most likely representing the EZ, and smaller CLCa structures (green) (big structures: n = 92, small structures: n = 13). (D) Histogram showing circularity ratio of CLCa structures. (E) Comparison of the average area of CLCa puncta labelled with different strategies (GFP-CLCa labeled with monoclonal GFP and CF568, Halo-CLCa labeled with halo-JF646), plotted as mean ± SEM (GFP-CF568: n = 103, Halo-JF646: n = 50).
-
Figure 3—figure supplement 1—source data 1
Excel sheet with numerical data represented as plots in Figure 3—figure supplement 1B,C,D,E.
- https://cdn.elifesciences.org/articles/74387/elife-74387-fig3-figsupp1-data1-v2.xlsx
Figure 4 with 1 supplement
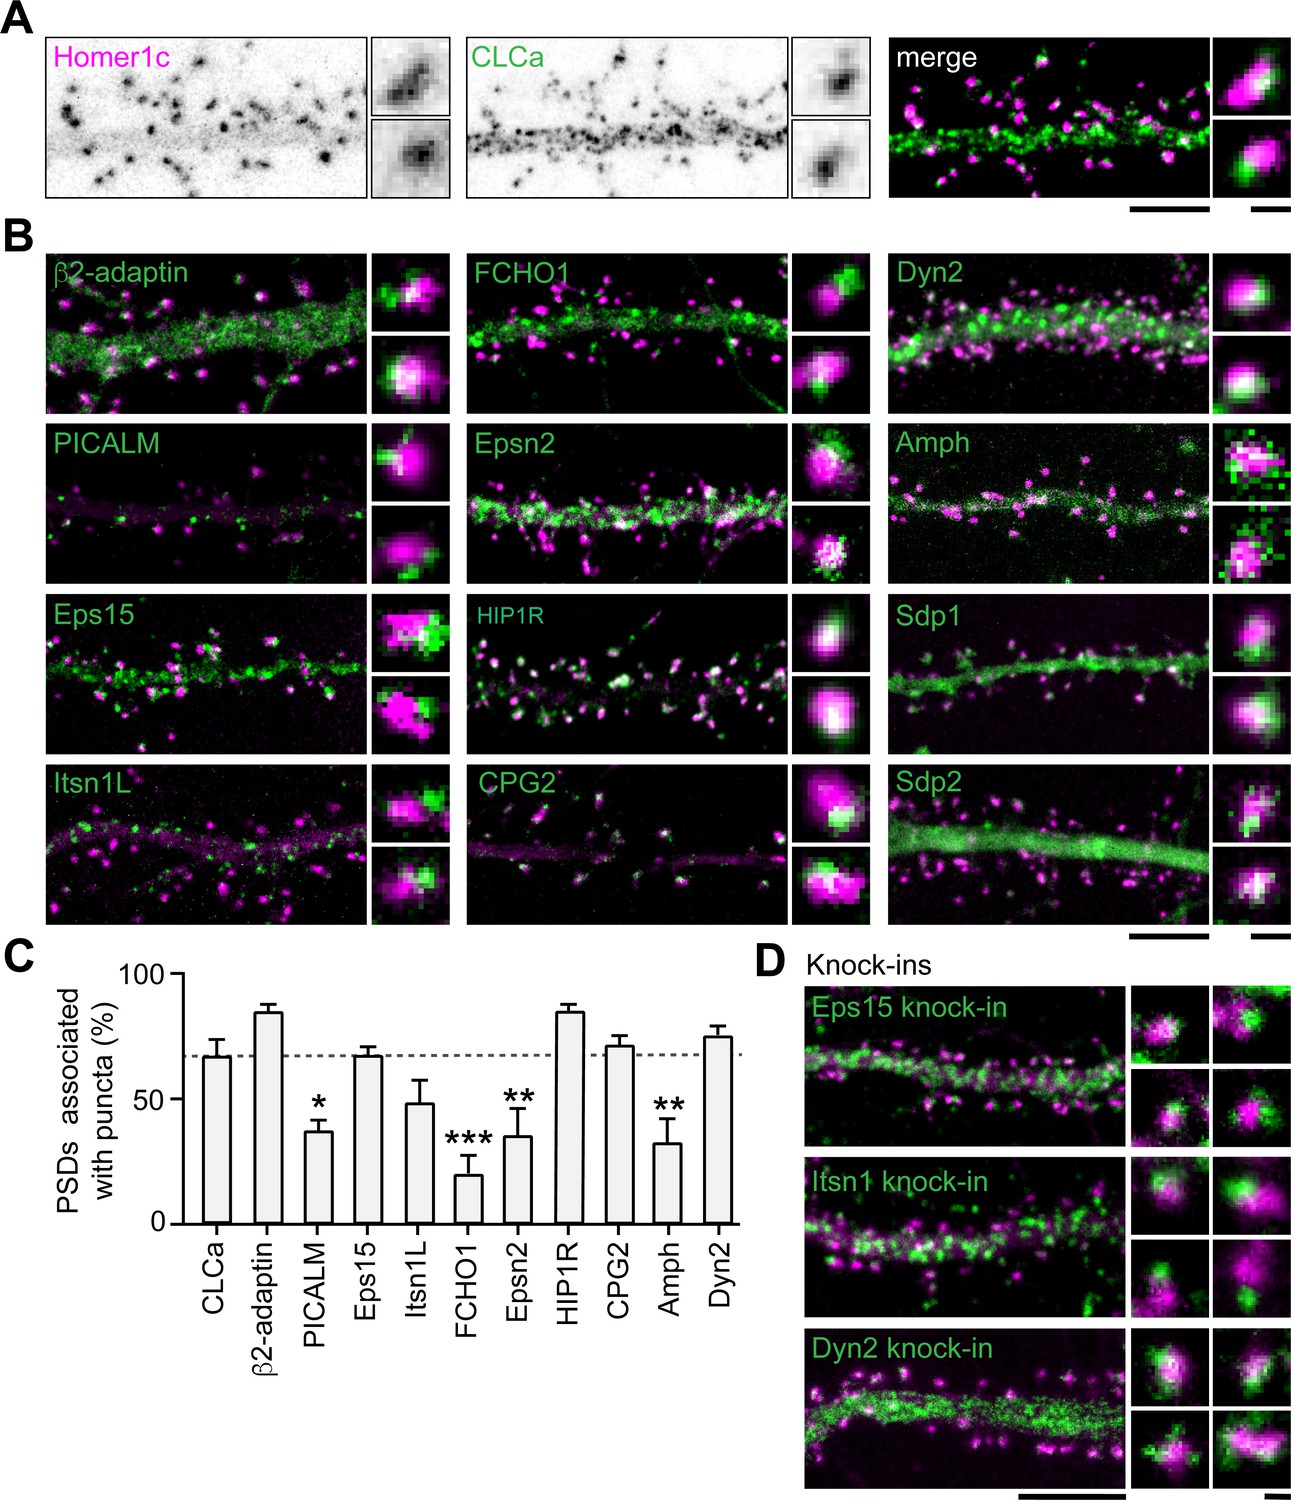
Endocytic accessory proteins are associated with the PSD.
(A) Example images of dendrites expressing Homer1c-mCherry to mark PSDs and GFP-CLCa visualized as black and white images (left, middle panel), and merge (right panel). (B) Example images of neurons co-expressing tagged endocytic proteins relative to Homer1c. (A–B) Scale bars: 5 µm, zoom dimensions: 1 µm. (C) Percentage of synapses associated with endocytic proteins, represented as mean ± SEM. Relative to Homer1c-CLCa association (N = 8), PICALM-mCherry (N = 6, p < 0.05), FCHO1-mCherry (N = 6, p < 0.001), Epsn2-mCherry (N = 9, p < 0.01), and Amph-mCherry (N = 6, p < 0.01) were significantly less often associated with the PSD, while β2-adaptin- GFP (N = 6), GFP-Eps15 (N = 5), GFP-Itsn1L (N = 5), HIP1R-GFP (N = 9), GFP-CPG2 (N = 5), Dyn2-GFP (N = 5) were not different from GFP-CLCa. (D) Example images of neurons expressing Homer1c-ALFA labeled with Cy3 (magenta) and endogenously GFP-tagged endocytic proteins using CRISPR/Cas9-mediated genome editing (green). Scale bar: 5 µm, zoom: 500 nm. Data represented as mean ± SEM.
-
Figure 4—source data 1
Excel sheet with numerical data represented as plots Figure 4C.
- https://cdn.elifesciences.org/articles/74387/elife-74387-fig4-data1-v2.xlsx
Figure 4—figure supplement 1
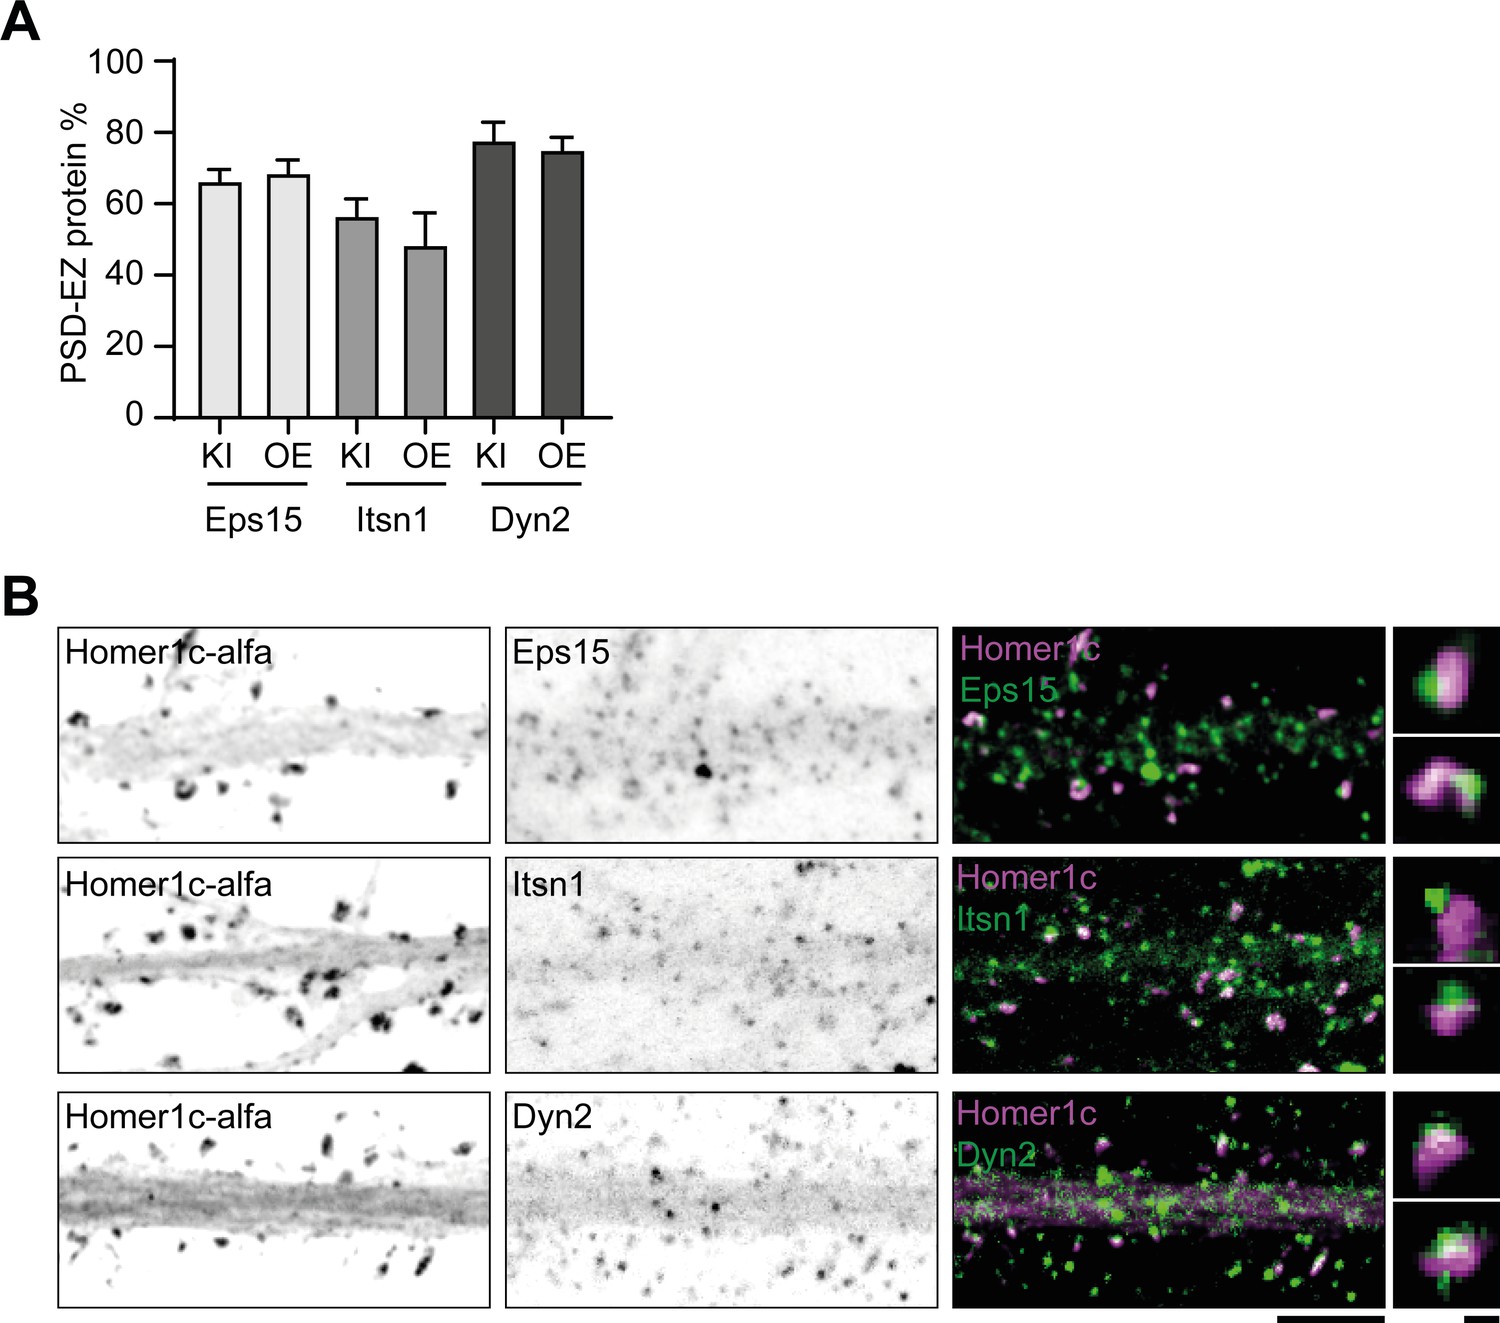
Endogenous labeling of endocytic proteins in neurons.
(A) Quantification of the average number of EZ proteins puncta per synapse after overexpression (OE) or knock-in (KI). OE data represented is a copy from the data shown in Figure 4C. KI Eps15 (N = 8), KI Itsn1 (N = 9), KI Dyn2 (N = 7). Data is plotted as mean ± SEM. (B) Example images (confocal) of Homer1c-ALFA labeled with Cy3 and endogenous labeling of EZ proteins using antibodies. Scale bar: 5 µm, zoom: 500 nm.
-
Figure 4—figure supplement 1—source data 1
Excel sheet with numerical data represented as a plot in Figure 4—figure supplement 1A.
- https://cdn.elifesciences.org/articles/74387/elife-74387-fig4-figsupp1-data1-v2.xlsx
Figure 5 with 2 supplements
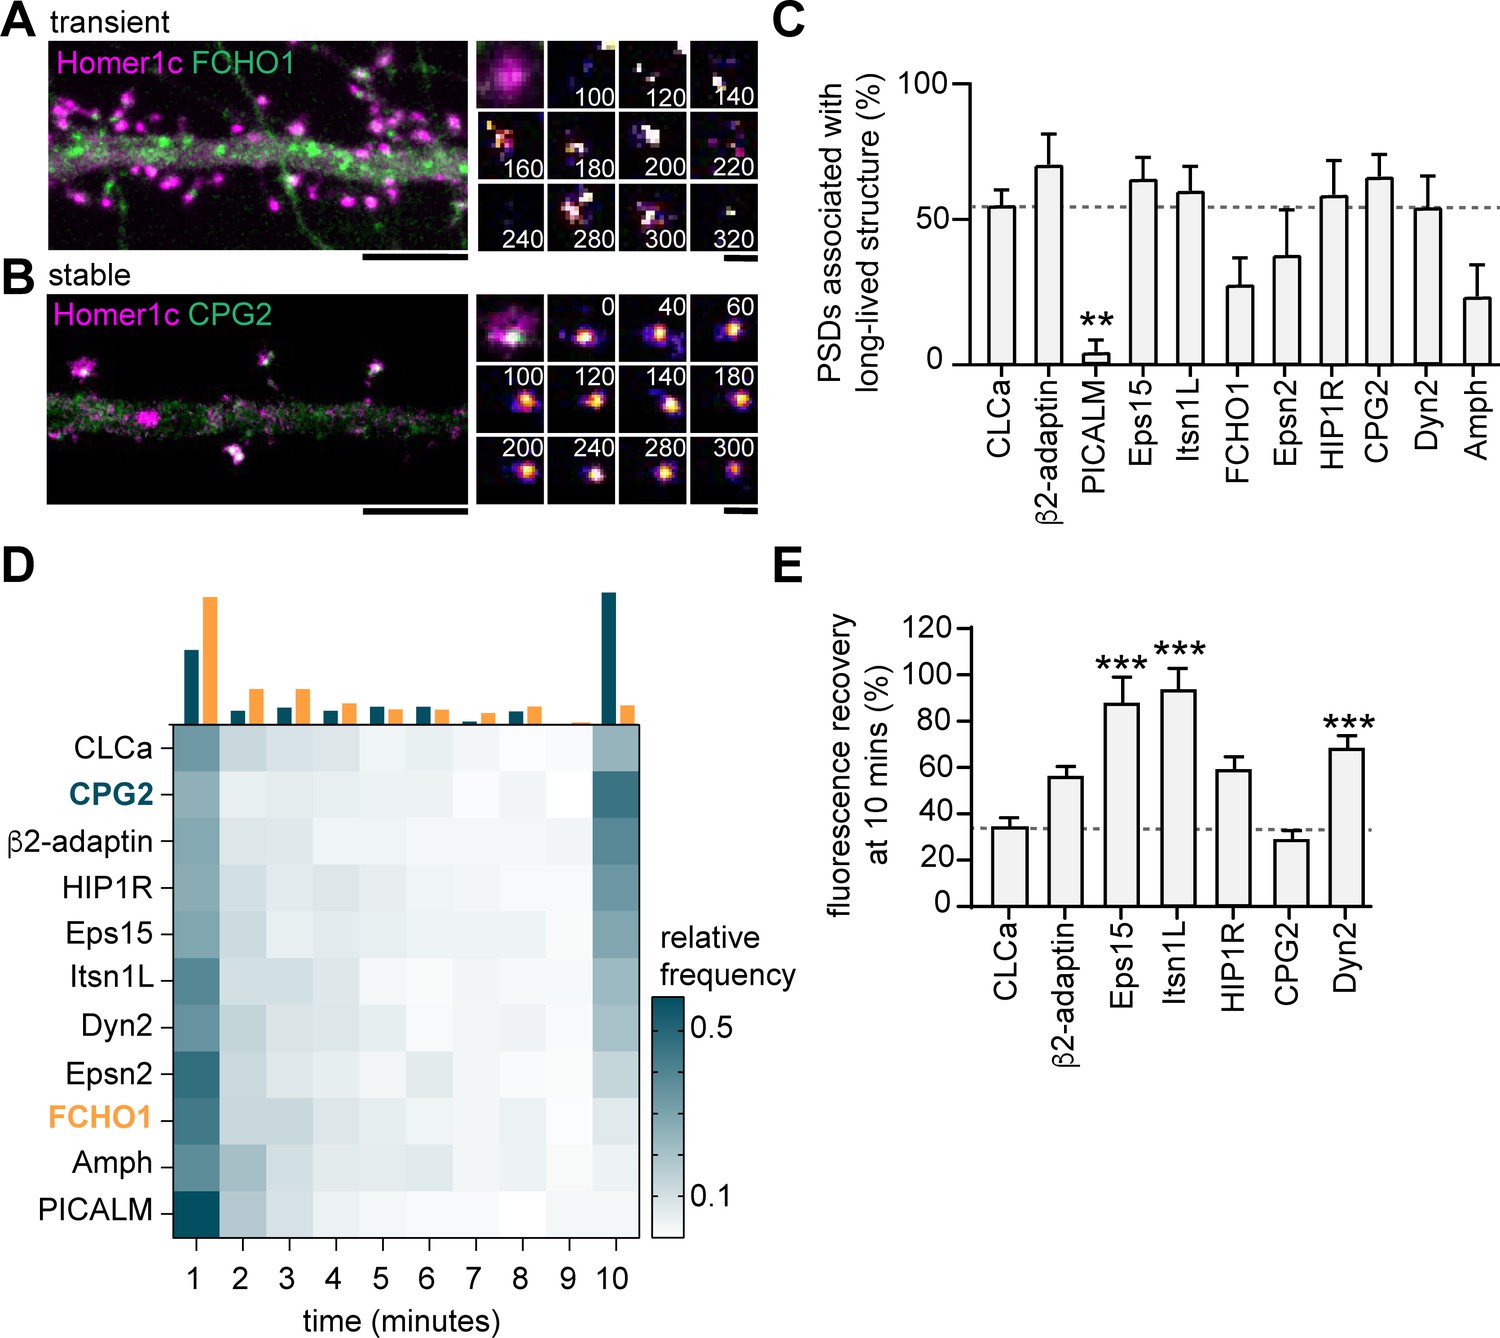
Endocytic proteins are differentially associated with the PSD.
(A) Example image of FCHO1 (green) that is transiently associated with Homer1c (magenta). Zooms show temporal recruitment of FCHO1. Scale bar: 5 µm, zoom: 500 nm. (B) Example image of CPG2 that is stably associated with Homer1c. Zooms show temporal dynamics of CPG2. Scale bar: 5 µm, zoom: 500 nm. (C) Percentage of synapses that contain at least one stable structure (persisting for >9 min). Only PICALM-mCherry (N = 5, p < 0.01) was significantly less often stably associated with the PSD compared to GFP-CLCa (N = 6). β2-adaptin-GFP (N = 6), GFP-Eps15 (N = 6), GFP-Itsn1L (N = 6), FCHO1-mCherry (N = 5), Epsn2-mCherry (N = 5), HIP1R-GFP (N = 6), GFP-CPG2 (N = 8), Amph-mCherry (N = 5), Dyn2-GFP (N = 7), were not different from GFP-CLCa. (D) Heatmap visualizing the frequency distribution of the lifetime of endocytic proteins associated with the PSD. The histogram on top is an example of FCHO1 (orange) that is mostly short-lived, and CPG2 (blue) that is mostly stable, plotted as relative frequency. (E) Summary graph of the recovery 10 min after FRAP for GFP-Eps15 (n = 23, p < 0.001), GFP-Itsn1L (n = 20, p < 0.001), HIP1R-GFP (n = 44, p < 0.01), Dyn2-GFP (n = 51, p < 0.001) had significantly higher turnover compared to GFP-CLCa (n = 32). GFP-CPG2 (n = 22) and β2-adaptin GFP (n = 13) were not different compared to GFP-CLCa. Data plotted as mean ± SEM.
-
Figure 5—source data 1
Excel sheet with numerical data represented as plots in Figure 5C, D and E.
- https://cdn.elifesciences.org/articles/74387/elife-74387-fig5-data1-v2.xlsx
Figure 5—figure supplement 1

FRAP curves of endocytic proteins compared to CLCa.
(A–F) FRAP curves of endocytic proteins (gray) and CLCa (blue) after bleaching on t = 0 for (A) β2-adaptin (n = 13), (B) Eps15 (n = 23), (C) Itsn1L (n = 20), (D) CPG2 (n = 22), (E) HIP1R (n = 44) and (F) Dyn2 (n = 51).
All graphs show the same CLCa (n = 32) data for comparison. All data is plotted as mean ± SEM.
-
Figure 5—figure supplement 1—source data 1
Excel sheet with numerical data represented as plots in Figure 5—figure supplement 1A,B,C,D,E,F.
- https://cdn.elifesciences.org/articles/74387/elife-74387-fig5-figsupp1-data1-v2.xlsx
Figure 5—figure supplement 2
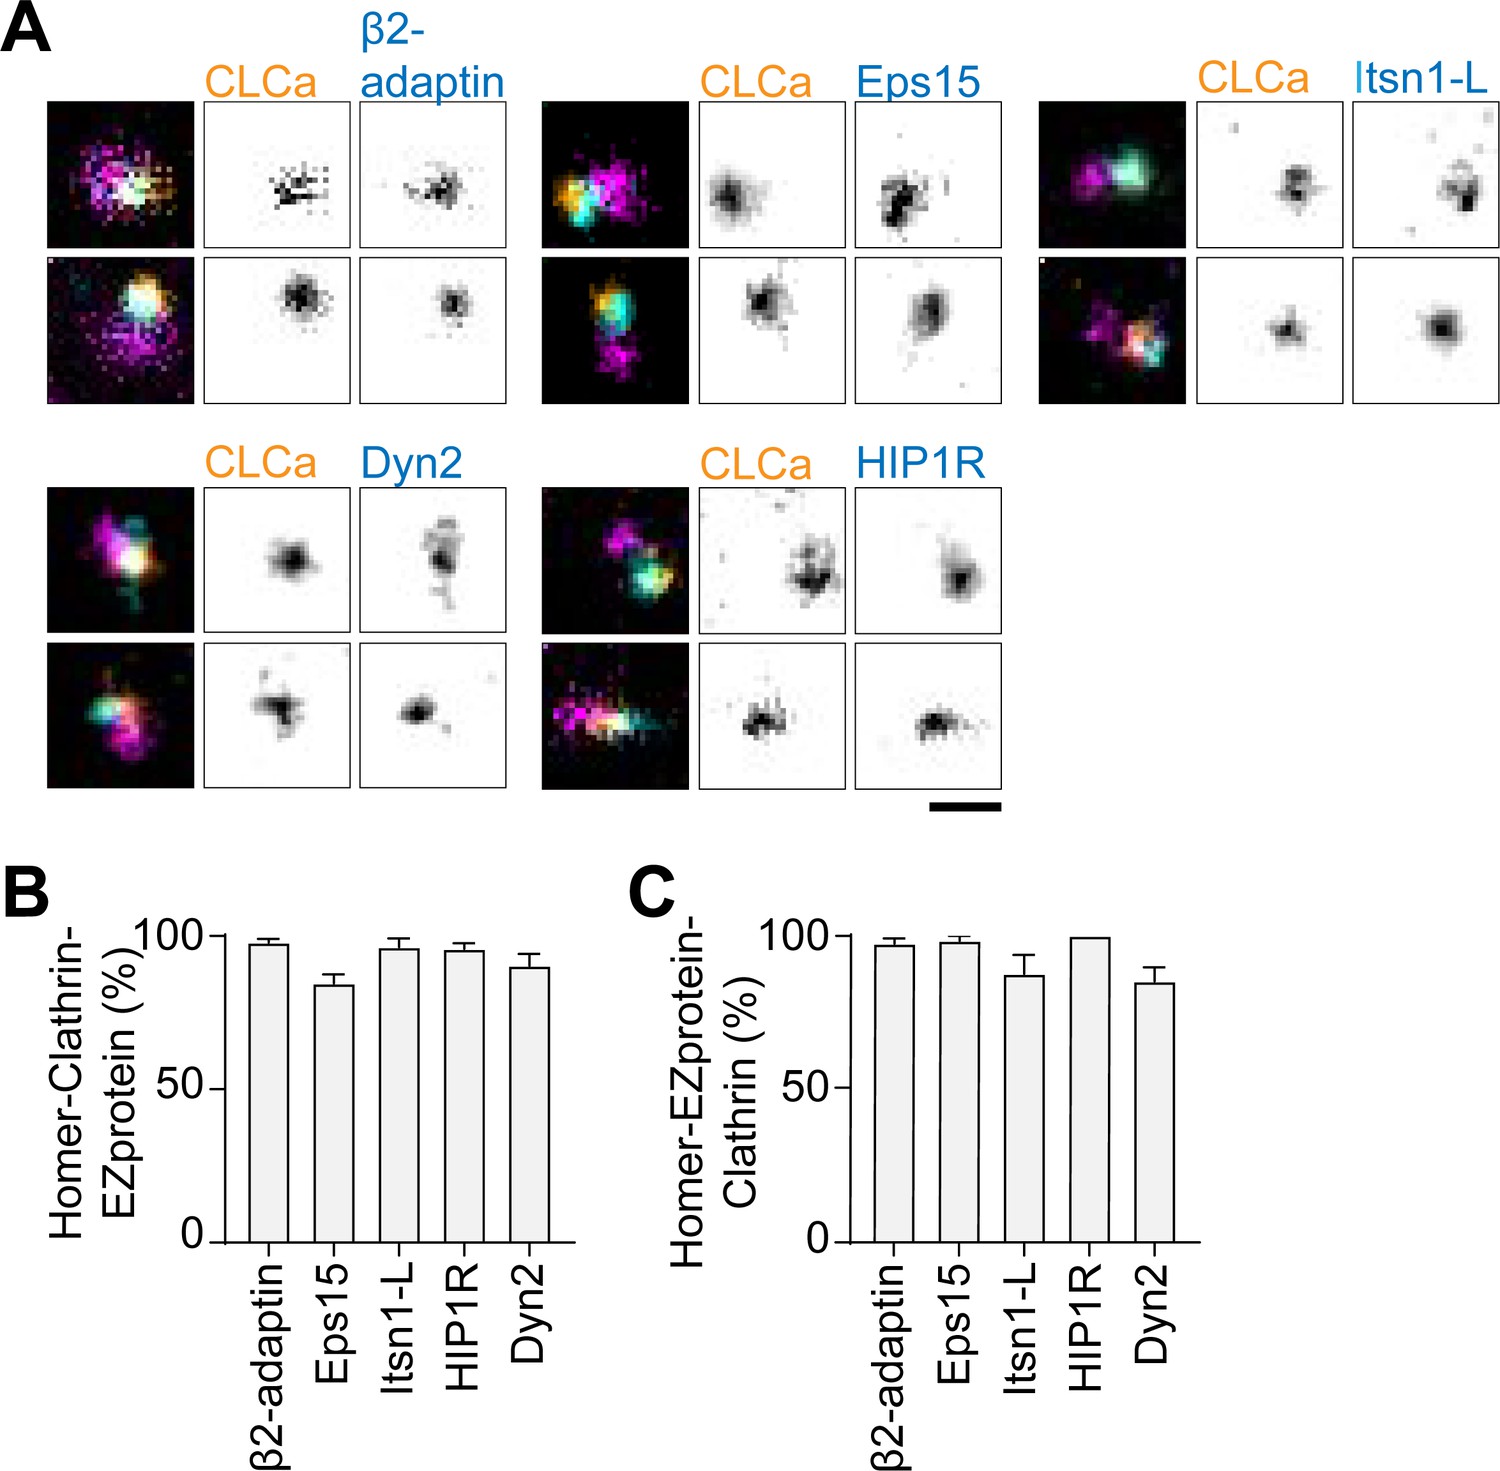
Endocytic proteins colocalize with the EZ.
(A) Examples of endogenous Homer1b/c (eHomer1b/c) labelled with anti-Homer1 antibody (magenta), combined with Halo-CLCa labeled with JF646 (orange) and co-expressed with endocytic proteins fused to GFP labeled with CF568 (cyan). eHomer1b/c was imaged using confocal, for CLCa and endocytic proteins gSTED was applied. Scale bar: 500 nm. (B) Percentage of eHomer1c-associated CLCa puncta overlapping with endocytic protein signal. (C) Percentage of eHomer1c-associated endocytic protein puncta overlapping with CLCa signal. Bar graphs show mean ± SEM, normalized to the average of the representative controls described in Materials and method section.
-
Figure 5—figure supplement 2—source data 1
Excel sheet with numerical data represented as plots in Figure 5—figure supplement 2B,C.
- https://cdn.elifesciences.org/articles/74387/elife-74387-fig5-figsupp2-data1-v2.xlsx
Figure 6
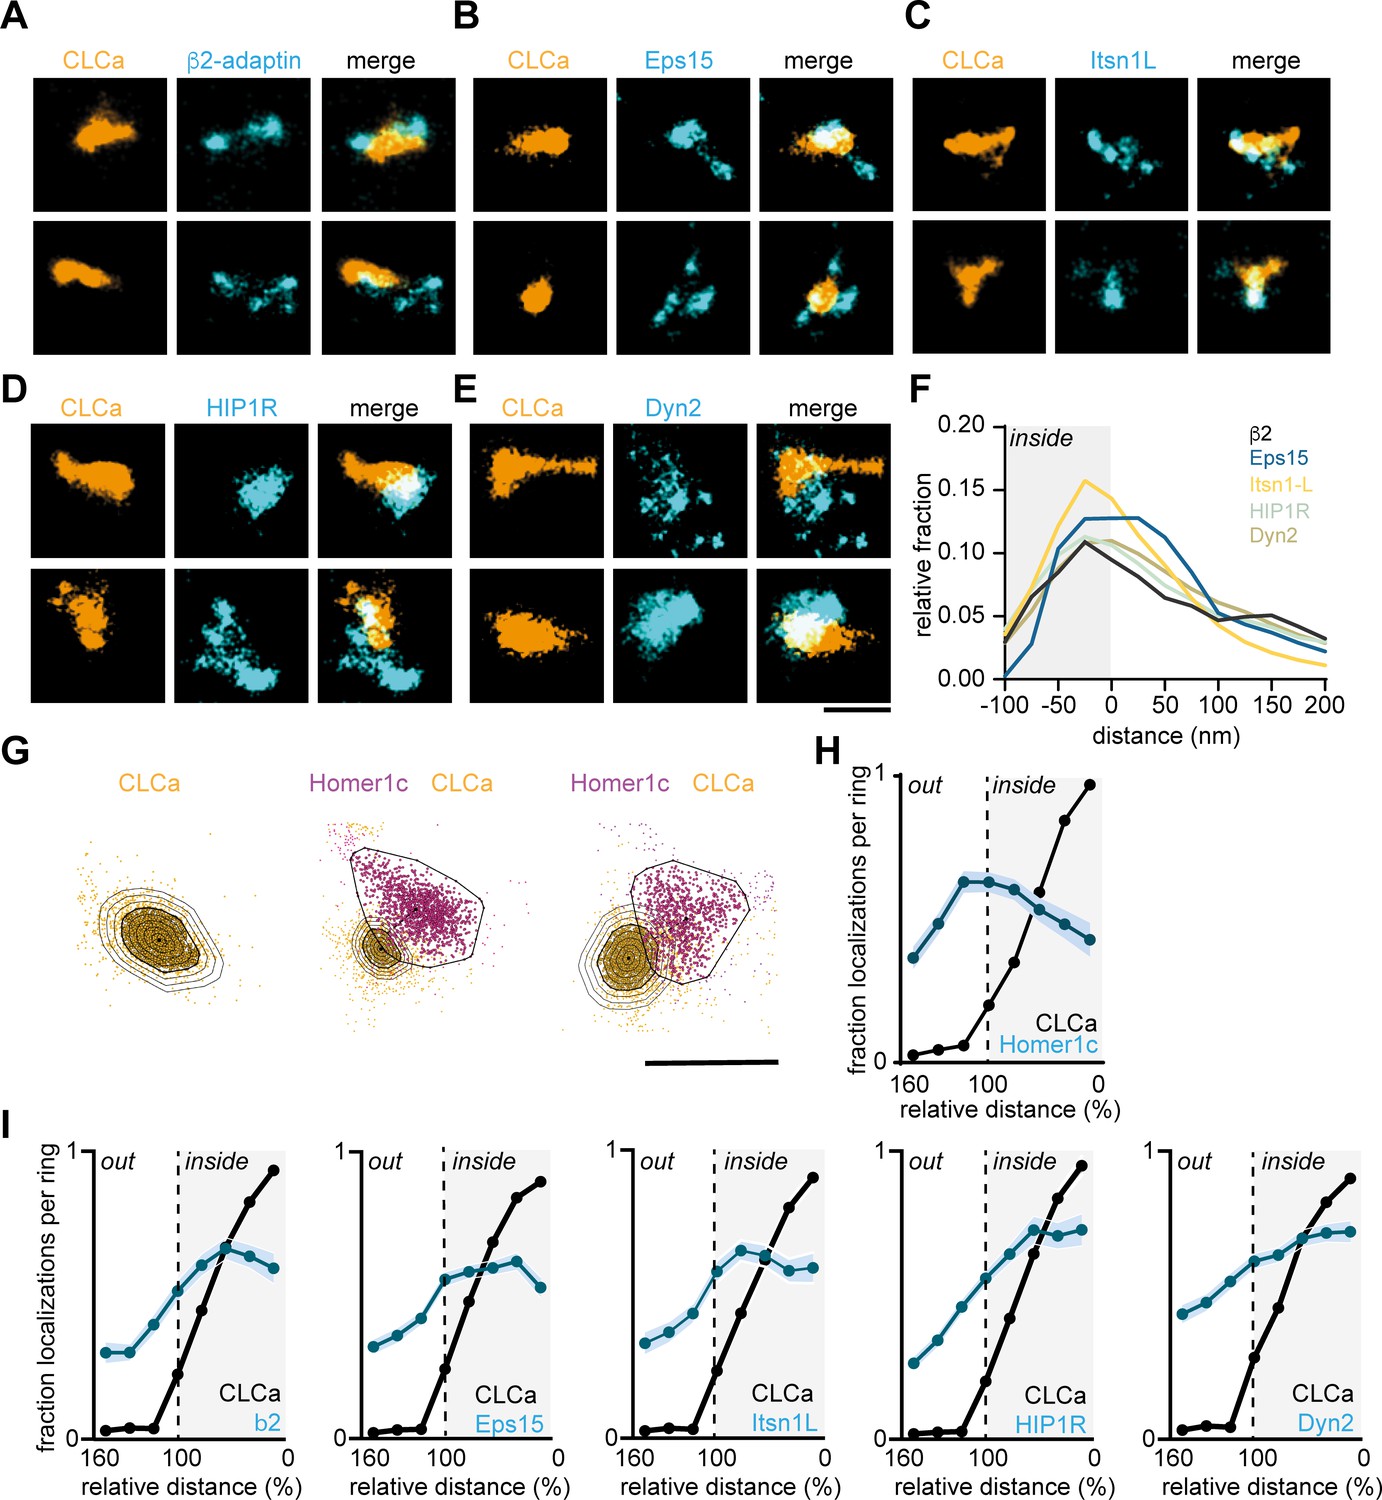
Endocytic proteins have distinct spatial organization relative to the clathrin structure marking the EZ.
(A–E) High-resolution example images of Halo-CLCa labelled with JF647 (orange) co-expressed with endocytic proteins fused to GFP labelled with CF568 (cyan). Scale bar: 500 nm. (F) Histogram visualizing the relative frequency of the distance of individual localizations relative to the border of CLCa. (G) Example plots of CLCa with rings based on the size of the structure (left panel), and example plots of individual CLCa and Homer1c localizations. The border outlining the EZ (bold black outline around the orange localizations) represents the 100% mark in graphs H and I. Scale bar: 500 nm. (H) Fraction of localizations per ring. Dotted line depicts the border of CLCa (Homer1c n = 65, CLCa n = 66). (I) Fraction of localizations per ring. Dotted line depicts the border of CLCa. β2-adaptin (n = 87), GFP-Eps15 (n = 126), GFP-Itsn1L (n = 58), GFP-HIP1R (n = 72), GFP-Dyn2 (n = 82).
-
Figure 6—source data 1
Excel sheet with numerical data represented as plots Figure 6F, H1.
- https://cdn.elifesciences.org/articles/74387/elife-74387-fig6-data1-v2.xlsx
Figure 7

Interactions with the PSD, but not with the membrane or actin cytoskeleton are required for positioning of the EZ.
(A) Example images of dendrites expressing Homer1c-ALFA and endocytic proteins fused to GFP co-expressed with control or mirShank-mCherry construct. Scale bar: 2 µm. (B) Fraction of PSDs associated with an EZ after Shank-KD relative to control plotted as mean ± SEM. GFP-CLCa (N = 8, p < 0.001), β2-adaptin (N = 10, p < 0.01), Eps15 (N = 12, p < 0.05), Itsn1L (N = 10, p < 0.05), HIP1R (N = 11 p > 0.05), Dyn2 (N = 12, p > 0.05), CPG2 (N = 13, p > 0.05). (C) Illustration of possible mechanisms that could maintain the EZ adjacent to the PSD. (D) Example images of dendrites co-expressing Homer1c-ALFA and GFP-CLCa in dendrites treated with LatB, CK666, or Jasp. Scale bar: 2 µm. (E) Example images of dendrites expressing control constructs, CLCb-EED/QQN (left panel) and AP2m2-P1 (middle panel), or Itsn1 KD construct (mirItsn1; right panel). Scale bar: 2 µm. (F) Fraction of EZ-associated PSDs relative to control, plotted as mean ± SEM. Jasp (N = 4), LatB (N = 8), CK666 (N = 12), CLCb-EED/QQN (N = 7), AP2m2-P1 (N = 5), mirItsn1 (N = 11), shCPG2 (N = 8).
-
Figure 7—source data 1
Excel sheet with numerical data represented as plots Figure 7D and F.
- https://cdn.elifesciences.org/articles/74387/elife-74387-fig7-data1-v2.xlsx
Figure 8
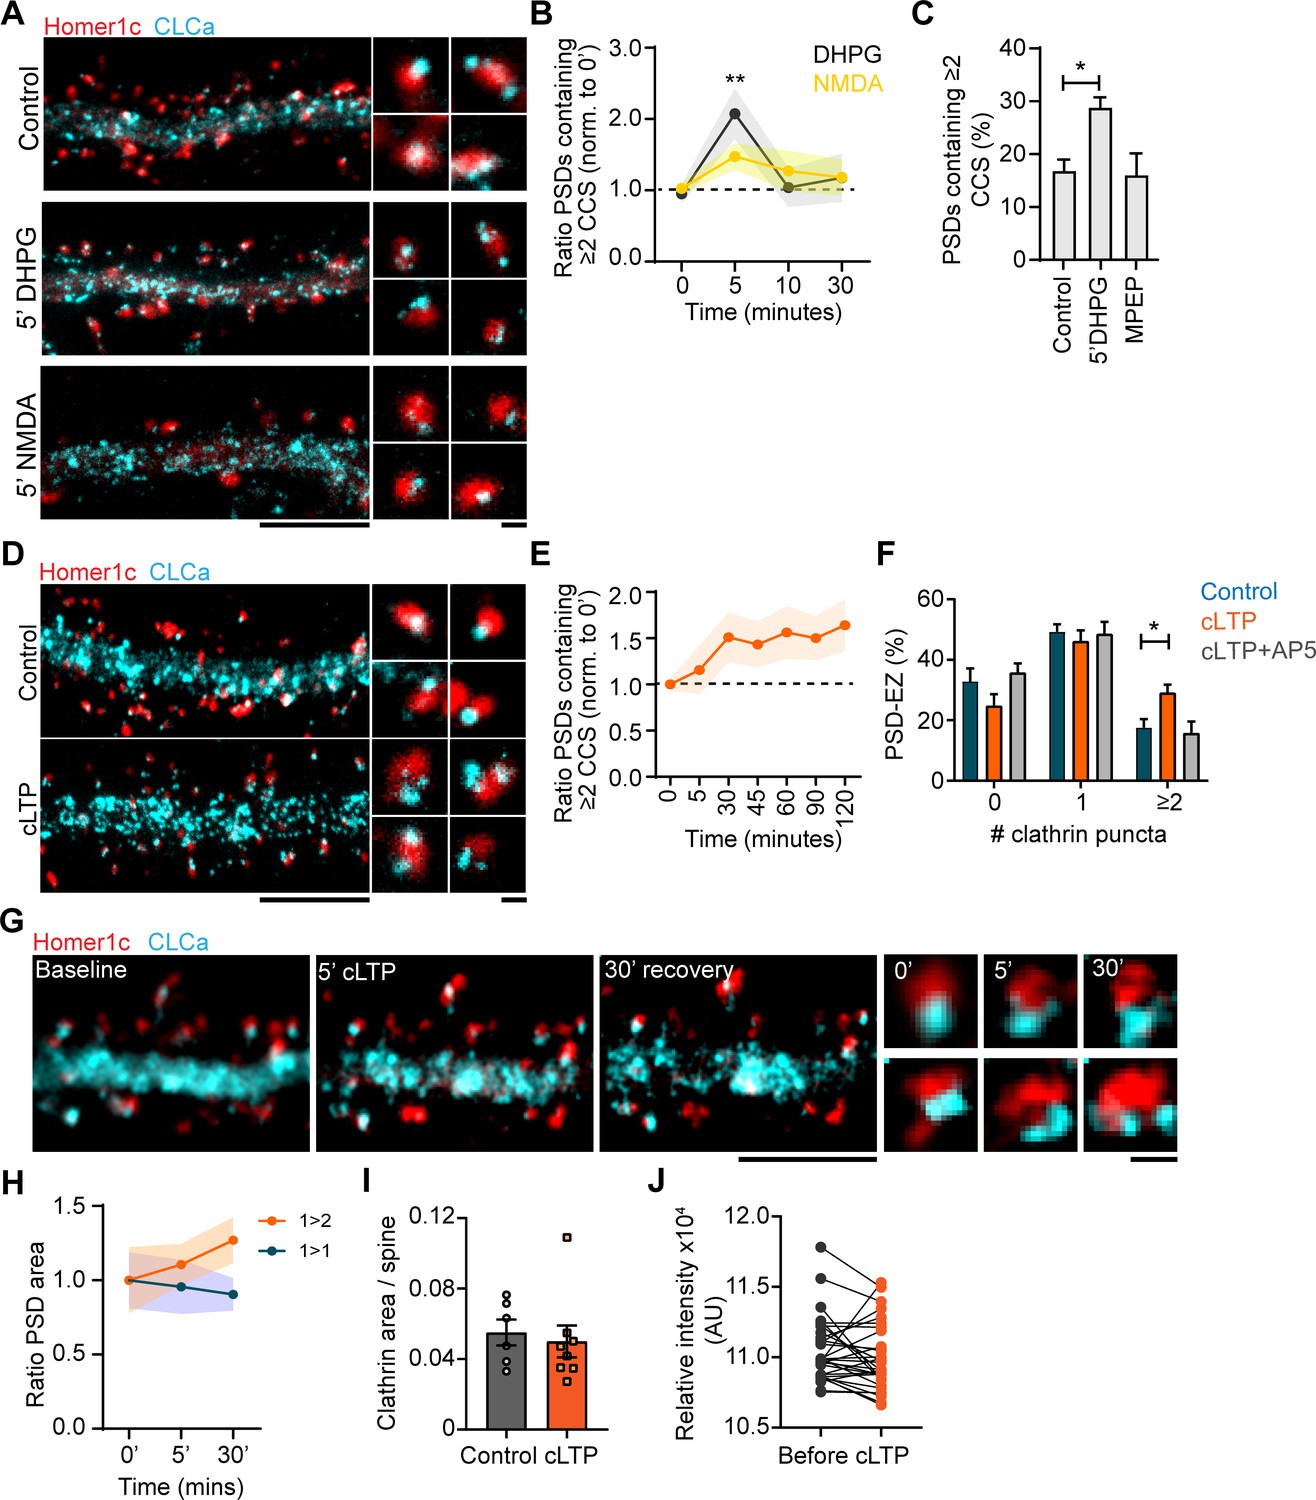
Plasticity-induced reorganization of the EZ.
(A) Example gSTED images of Homer1c-ALFA labeled with Cy3, and CLCa-GFP labeled with At647N under basal conditions (upper panel, control), after 5 min of DHPG (100 µM, middle panel) and after 5 min of NMDA (20 µM, lower panel). Scale bar: 5 µm, zoom: 500 nm. (B) Quantification of the number of PSDs associated with multiple CCSs after different timepoints of DHPG and NMDA bath application, normalized to timepoint 0. DHPG significantly increased the number of PSDs associated with multiple CCSs after 5 min (timepoint 0: N = 19, timepoint 5: N = 11, p > 0.01), while NMDA did not alter PSD-EZ association (timepoint 0: N = 13, timepoint 5: N = 7, p > 0.05). (C) Percentage of PSDs associated with multiple CCSs. Five min DHPG significantly increases PSD-EZ association (Control: N = 17, DHPG: N = 13, p < 0.05). MPEP blocked the effect of DHPG (N = 10, p > 0.05). (D) Example gSTED images as described in A, under basal conditions (upper panel) and after cLTP (lower panel). Scale bar: 5 µm, zoom 500 nm. (E) Quantification of the number of PSDs associated with multiple CCSs after cLTP, normalized to timepoint 0 (N = 8–13). (F) Number of CCSs per PSD under basal conditions and after 5 min cLTP followed by 25 min recovery. At timepoint 30, the number of CCSs per PSD was significantly increased (Control: N = 9, cLTP: N = 11, p < 0.05) and the effect was completely blocked in the presence of AP5 (N = 8). (G) Example images of live-cell gSTED on Homer1c-mCherry and Halo-CLCa labeled with JF646. Three sequential images were taken before cLTP (left), directly after (middle left) and after recovery (middle right). Two example spines were selected where reorganization of CLCa was observed (right). Scale bar: 5 µm, zoom: 500 nm. (H) Quantification of a subset of PSDs that increased in size (orange), or remained the same size during imaging (blue). PSDs that were enlarged in response to cLTP were associated with multiple CCSs (N = 4). (I) GFP-CLCa area per spine under basal conditions and after cLTP (Basal: N = 6, cLTP: N = 8). (J) Relative intensity of GFP-CLCa before and after cLTP imaged using live-cell confocal imaging (n = 31).
-
Figure 8—source data 1
Excel sheet with numerical data represented as plots Figure 8B, C, E, F, H1 and J.
- https://cdn.elifesciences.org/articles/74387/elife-74387-fig8-data1-v2.xlsx
Additional files
Download links
A two-part list of links to download the article, or parts of the article, in various formats.
Downloads (link to download the article as PDF)
Open citations (links to open the citations from this article in various online reference manager services)
Cite this article (links to download the citations from this article in formats compatible with various reference manager tools)
Dynamics and nanoscale organization of the postsynaptic endocytic zone at excitatory synapses
eLife 11:e74387.
https://doi.org/10.7554/eLife.74387


