Identification of a stereotypic molecular arrangement of endogenous glycine receptors at spinal cord synapses
- Institut de Biologie de l'ENS (IBENS), École Normale Supérieure, CNRS, Inserm, PSL University, France
- Institute for Clinical Neurobiology, University Hospital, Julius-Maximilians-University, Germany
- Diseases and Hormones of the Nervous System (DHNS), Inserm U1195, Université Paris-Saclay, France
Figures
Figure 1 with 4 supplements
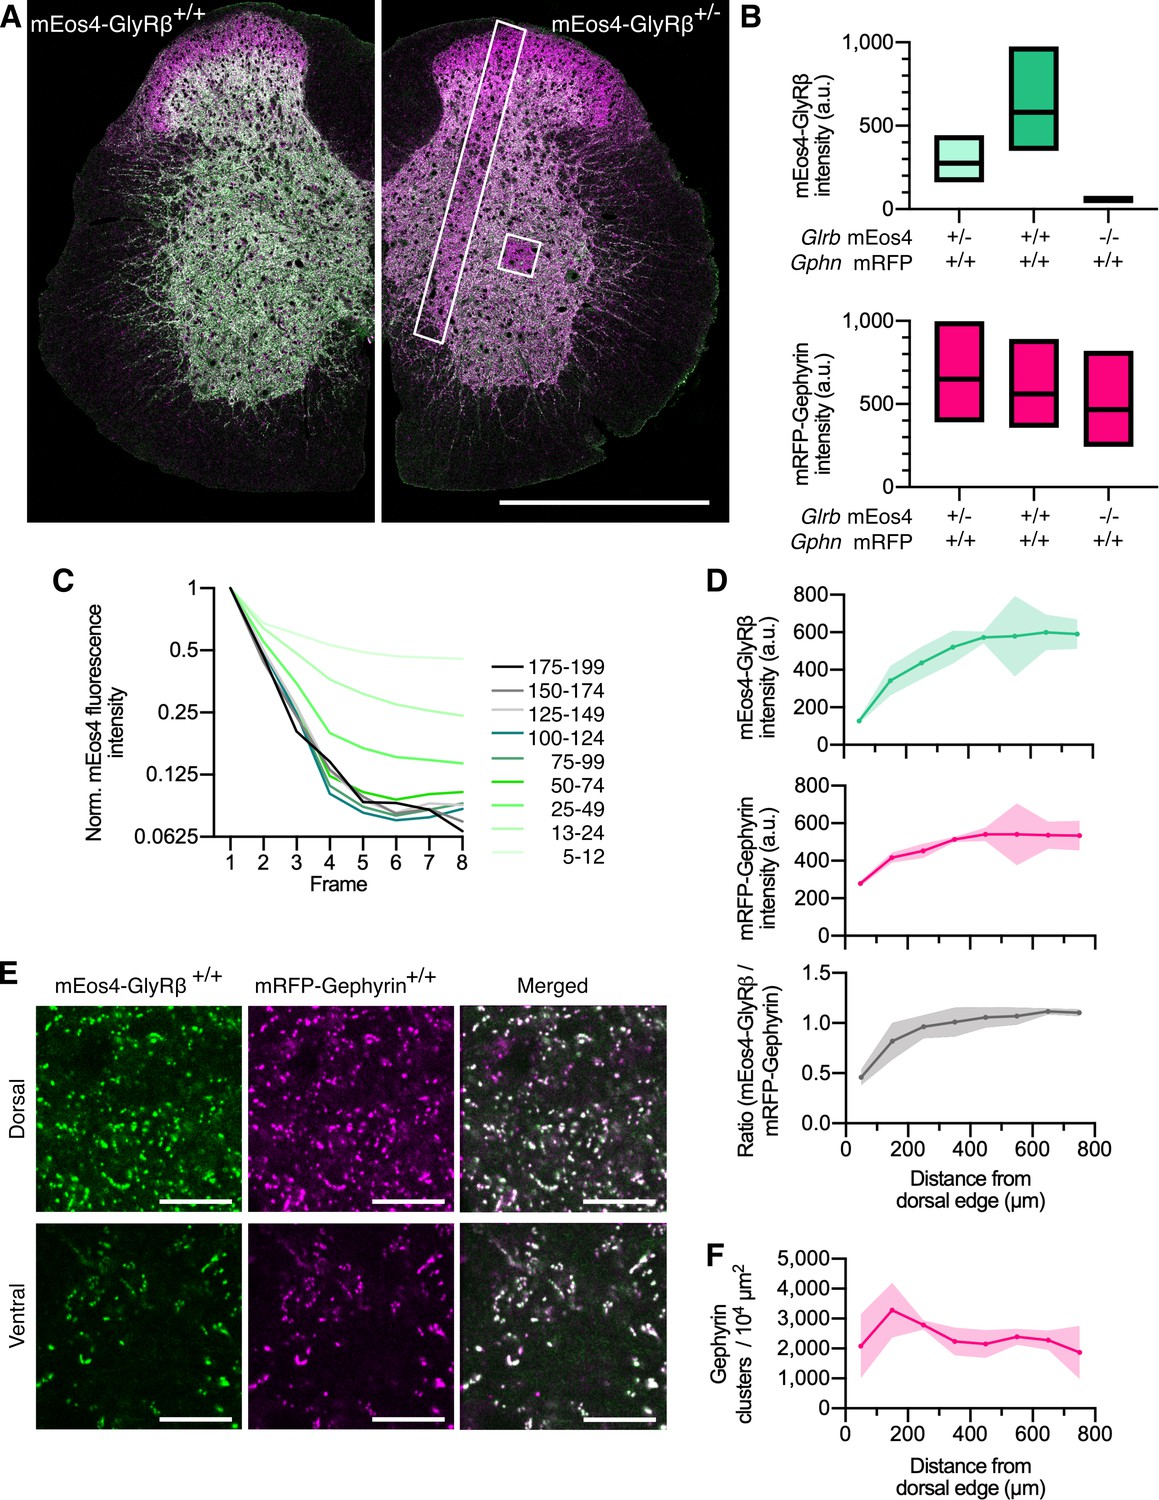
Quantitative confocal imaging of endogenous glycine receptors (GlyRs) in spinal cord tissue.
(A) Representative confocal images of 40 μm spinal cord tissue sections from homozygous (+/+) and heterozygous (+/-) mEos4b-GlyRβ mice (green). Both mice are homozygous for mRFP-gephyrin (magenta). Scale bar = 0.5 mm. (B) Quantification of mEos4b-GlyRβ and mRFP-gephyrin fluorescent intensity of homozygous and heterozygous 2-month-old animals measured in the area indicated by the white square in (A). Plots show median and quartiles. N = 5–6 images from 5 to 6 tissue slices per genotype from 2 mice per age group. (C) Normalized fluorescent decay traces of homozygous mEos4b measured in the area indicated by the white square in (A) over eight consecutive frames. Intensities were binned in the first image and tracked on an individual synapse basis across the eight frames. (D) Mean intensity ± 95% confidence interval of mEos4b-GlyRβ and mRFP-gephyrin measured from distal edge of spinal cord in 2-month-old homozygous mice. Intensities measured in region as indicated by white rectangle in (A). N = 3 images from three tissue slices from two mice per condition. (E) Representative images of homozygous mEos4b-GlyRβ and mRFP-gephyrin at dorsal and ventral synapses. Scale bar = 10 μm. (F) Quantification of numbers of gephyrin clusters across the spinal cord. Plot shows mean ± 95% confidence interval. N = 3 images from three tissue slices from two mice per condition.
Figure 1—figure supplement 1
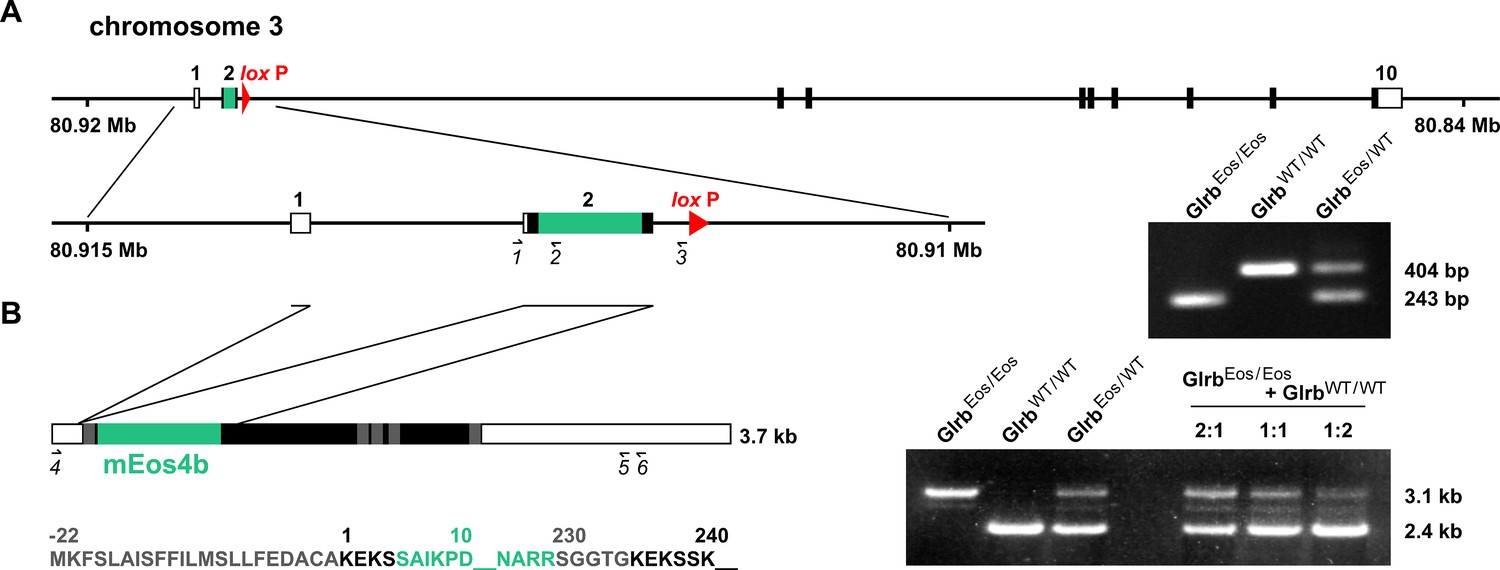
Generation of the mEos4b-GlyRβ knock-in mouse model.
(A) The coding sequence of mEos4b (green) was inserted in exon 2 of the Glrb gene by homologous recombination, as shown by the amplification of a 243 bp PCR product in genomic DNA from GlrbEos/Eos and GlrbEos/WT animals using the primers 1, 2 and 3. (B) Splicing and transcript expression. The mEos4b sequence is inserted after the signal peptide (shown in gray) before the extracellular domain of the GlyRβ subunit. Right panel: Semi-quantitative RT-PCR. Mixing of spinal cord mRNA from GlrbEos/Eos and GlrbWT/WT animals at a 1:1 ratio and amplification with primers 4 and 5 produces a PCR pattern that matches the amplification of the two alleles from the heterozygous GlrbEos/WT mRNA.
Figure 1—figure supplement 2
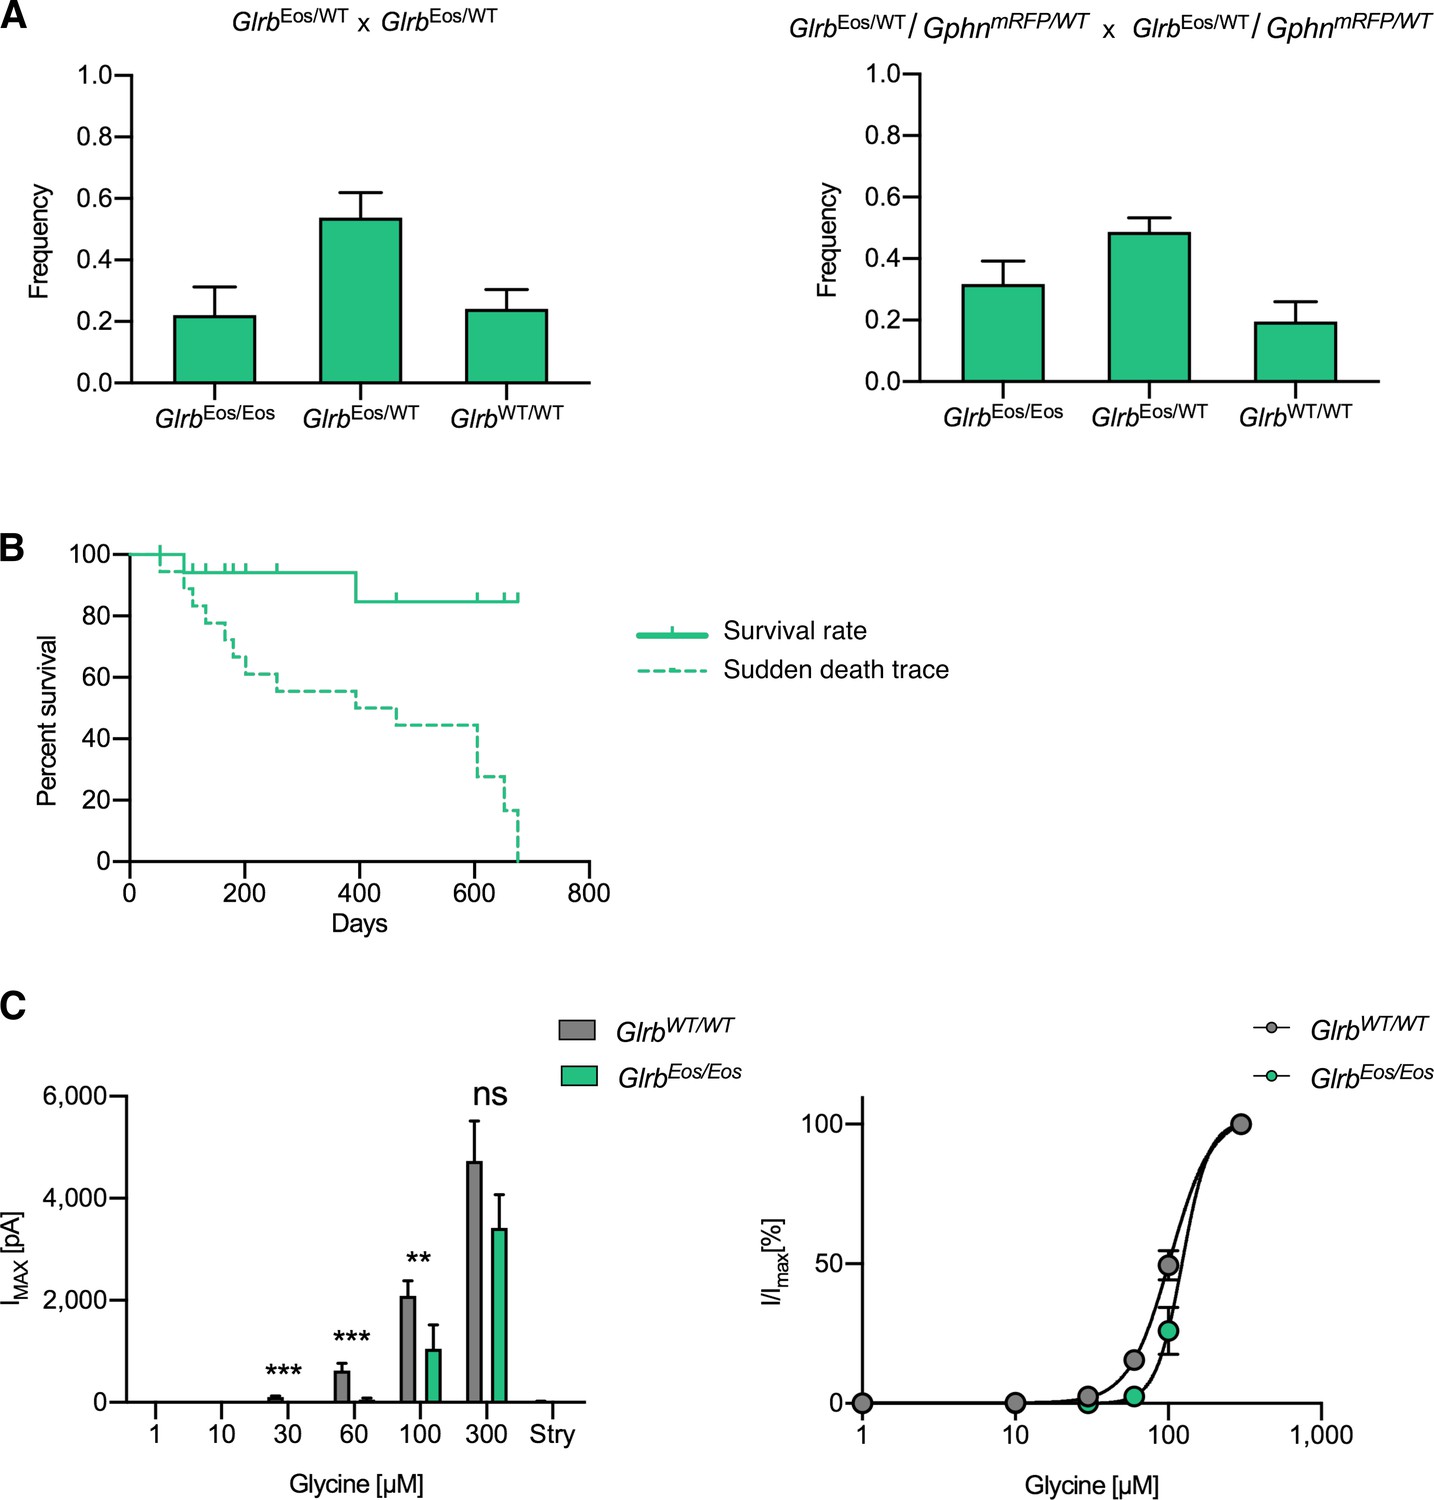
Physiological and functional characterization of mEos4b-GlyRβ knock-in mice.
(A) Mendelian inheritance of GlrbEos/Eos, GlrbEos/WT and GlrbWT/WT genotypes in the offspring of heterozygous single KI matings GlrbEos/WT x GlrbEos/WT (left panel), and heterozygous double KI matings GlrbEos/WT/GphnmRFP/WT x GlrbEos/WT/GphnmRFP/WT (right panel). Left panel: N = 42 pups from 5 litters, plot shows mean ± SEM; right panel: N = 45 pups from 7 litters. (B) Survival plot of homozygous knock-in mEos4b-GlyRβ mice (GlrbEos/Eos). N = 19 mice. Survival rate refers to the age that the animals (indicated by green ticks along the line) have attained at the time of counting. Sudden death trace simulates the survival curve if all the animals were to die immediately at the time of counting. (C) Left panel: Comparison of mean maximal currents (Imax) at different concentrations of glycine (1-300 μM) for GlrbWT/WT (N = 10) and GlrbEos/Eos (N = 11 neurons). Glycinergic currents were blocked with 10 μM strychnine (Stry) at the end of each recording. Right panel: Normalized dose response curves for GlrbWT/WT and GlrbEos/Eos show a subtle shift in the EC50 of mEos4b-GlyRβ containing receptors compared to the wild type. Plots show mean ± SEM. **p < 0.01, ***p < 0.001.
Figure 1—figure supplement 3
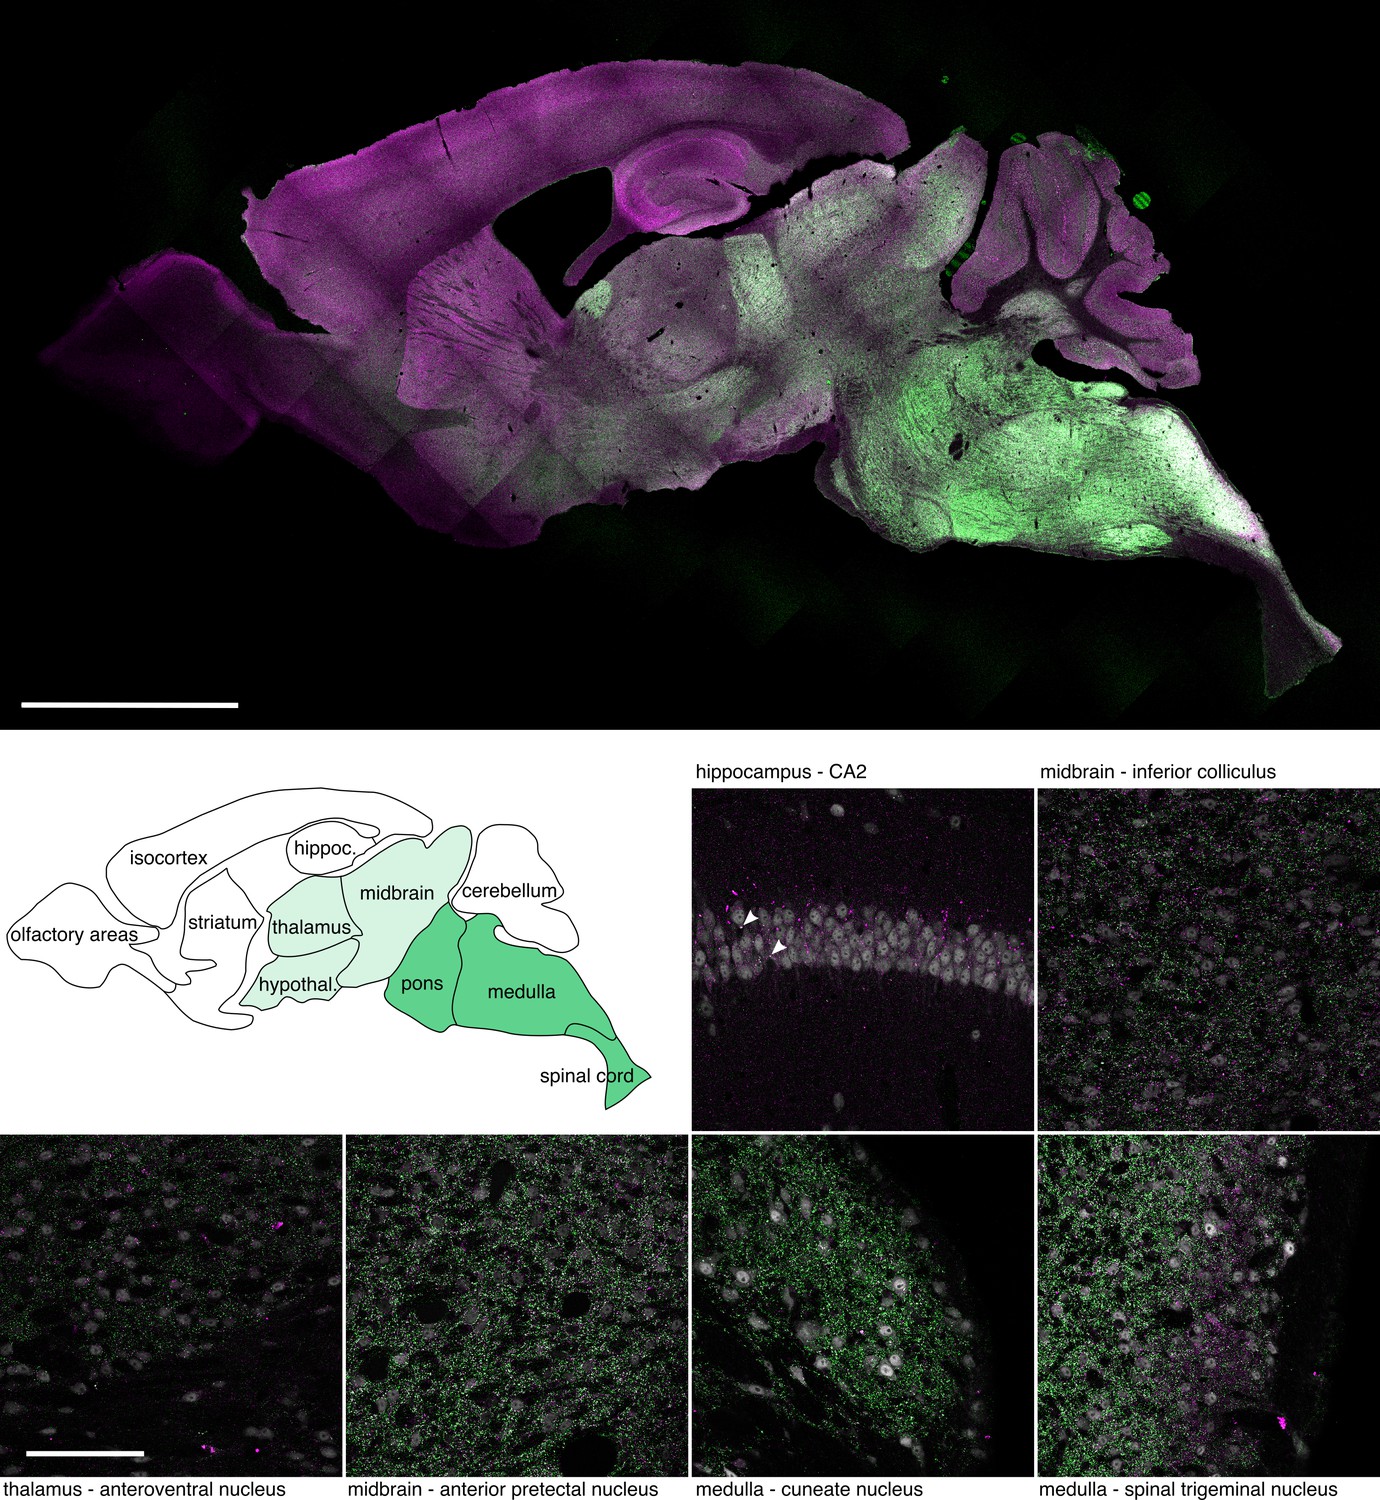
Protein expression of mEos4b-GlyRβ in brain sections of knock-in mice.
Expression of mEos4b-GlyRβ (green) and mRFP-gephyrin (magenta) across brain regions (confocal image of a sagittal vibratome section of a double knock-in GlrbEos/Eos / GphnmRFP/mRFP mouse at 2 months of age). Scale bar = 2.5 mm. The brain atlas depicts the various brain regions with reference to the overall mEos4b-GlyRβ expression levels (white = none-low expression, light green = medium expression, darker green = high expression). High magnification images: Confocal images of various brain regions from the same vibratome section, showing the expression of mEos4b-GlyRβ (green) and mRFP-gephyrin (magenta), as well as NeuN immunolabeling (grey). Arrowheads depict synaptic puncta in the pyramidal cell body layer of the hippocampus that are positive for mEos4b-GlyRβ. Scale bar = 100 μm.
Figure 1—figure supplement 4
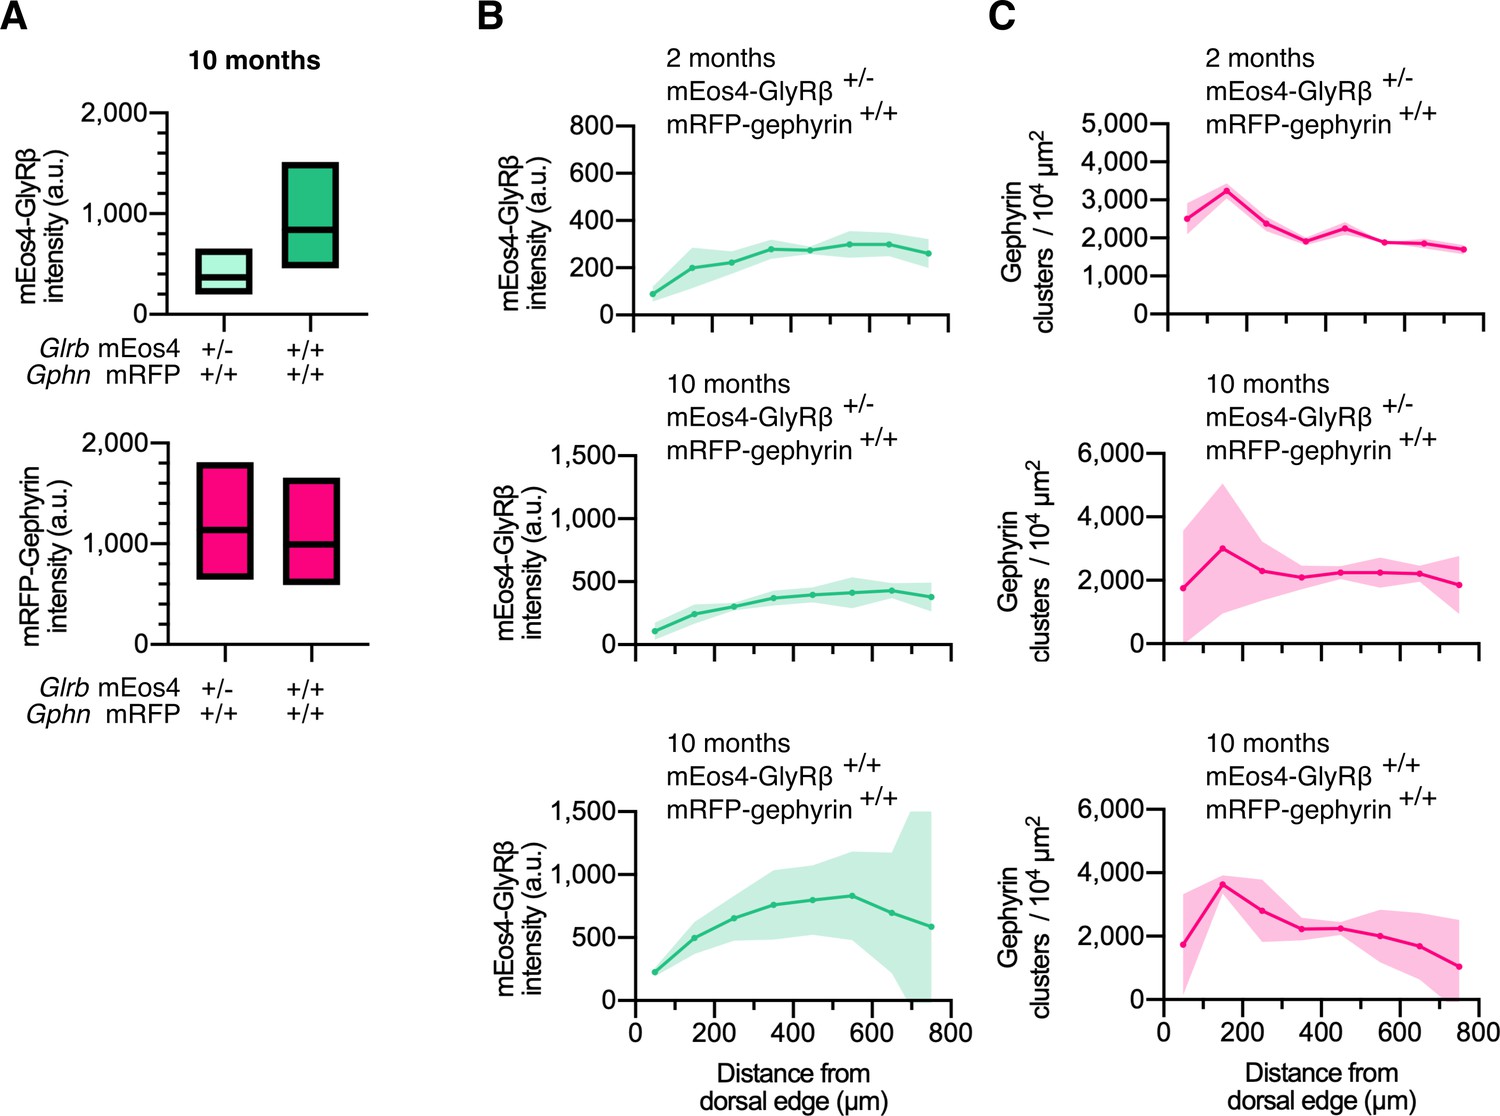
Quantitative confocal imaging in 10 month old animals.
(A) Intensity of mEos4b-GlyRβ and mRFP-gephyrin at spinal cord synapses in homozygous and heterozygous mEos4b-GlyRβ mice, measured in the area indicated by the white square in Figure 1A. Plots show median and quartiles. N = 5 images per condition from 5 tissue slices per genotype from 2 mice per age group. (B) Quantification of mEos4b-GlyRβ intensity at gephyrin-positive puncta across the spinal cord in 2 month old heterozygous (+/-; GlrbEos/WT) and 10 old month homozygous (+/+; GlrbEos/Eos) and heterozygous animals. Intensities measured in regions as indicated by rectangle in (Figure 1A). Plots show mean ± 95% confidence interval. N = 2-4 images from 2-4 tissue slices from 2 mice per genotype. (C) Quantification of numbers of gephyrin clusters across the spinal cord in 2 month old heterozygous and 10 month old homozygous and heterozygous animals. Plots show mean ± 95% confidence interval. N = 2-4 images from 2-4 tissue slices from 2 mice per genotype.
Figure 2 with 4 supplements
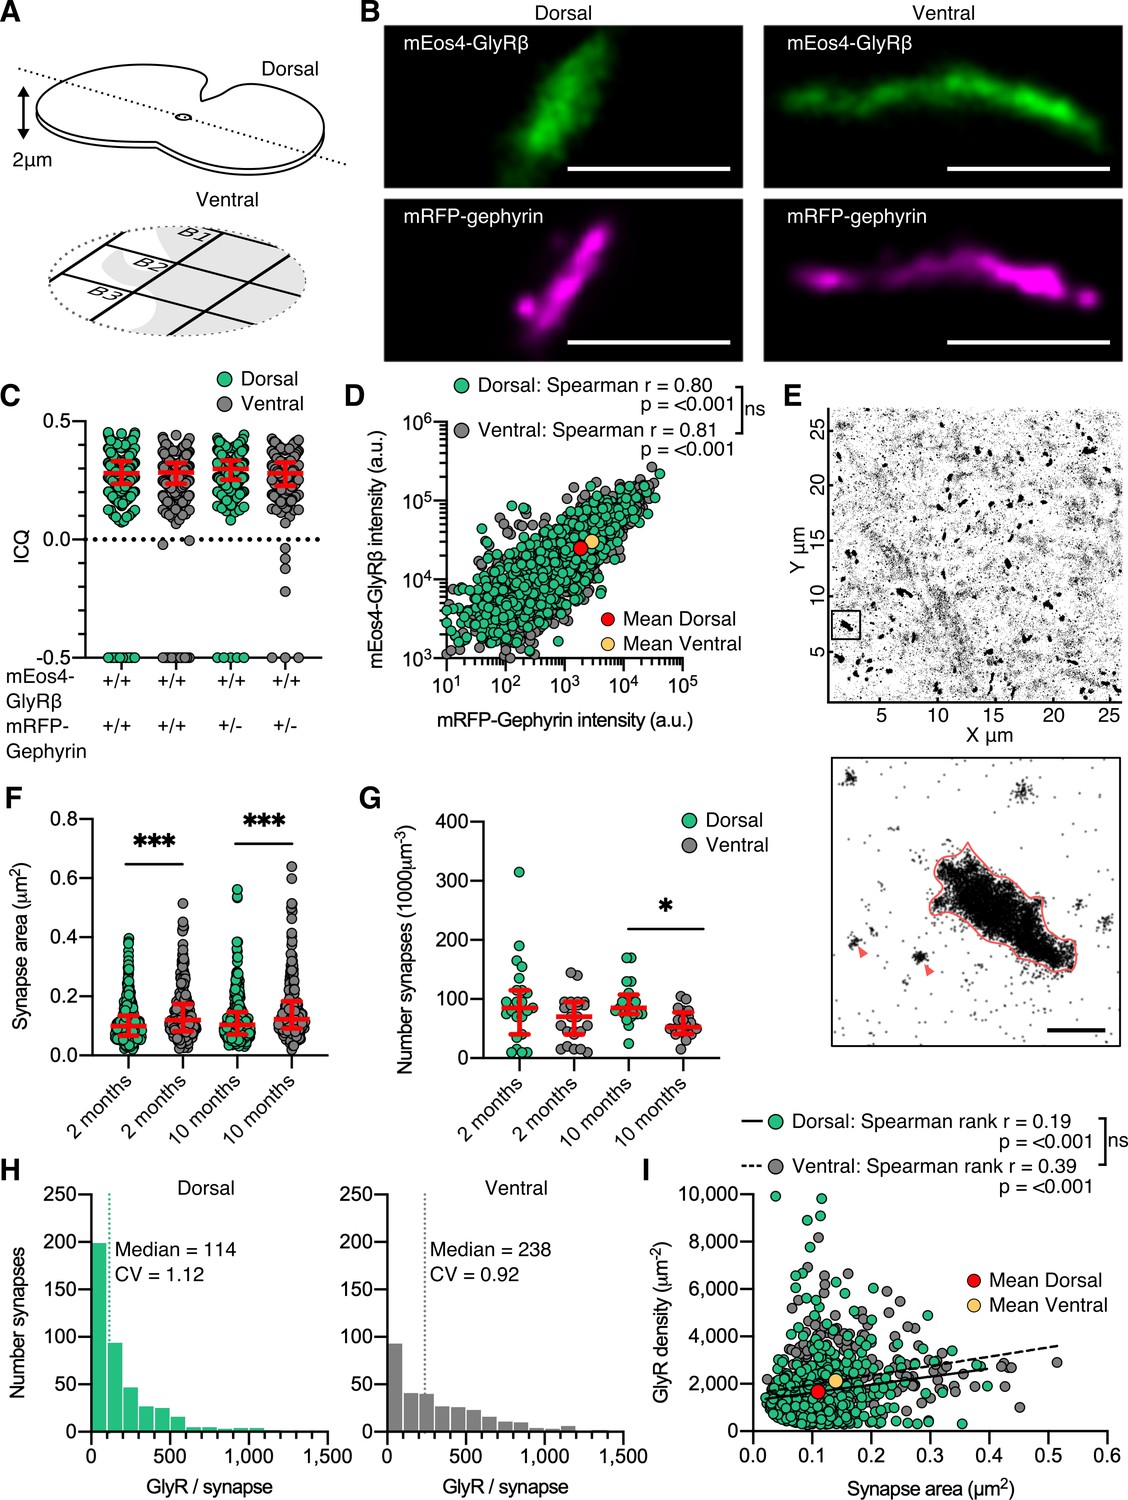
Dual-color super-resolution imaging of mEos4b-GlyRβ and mRFP-gephyrin.
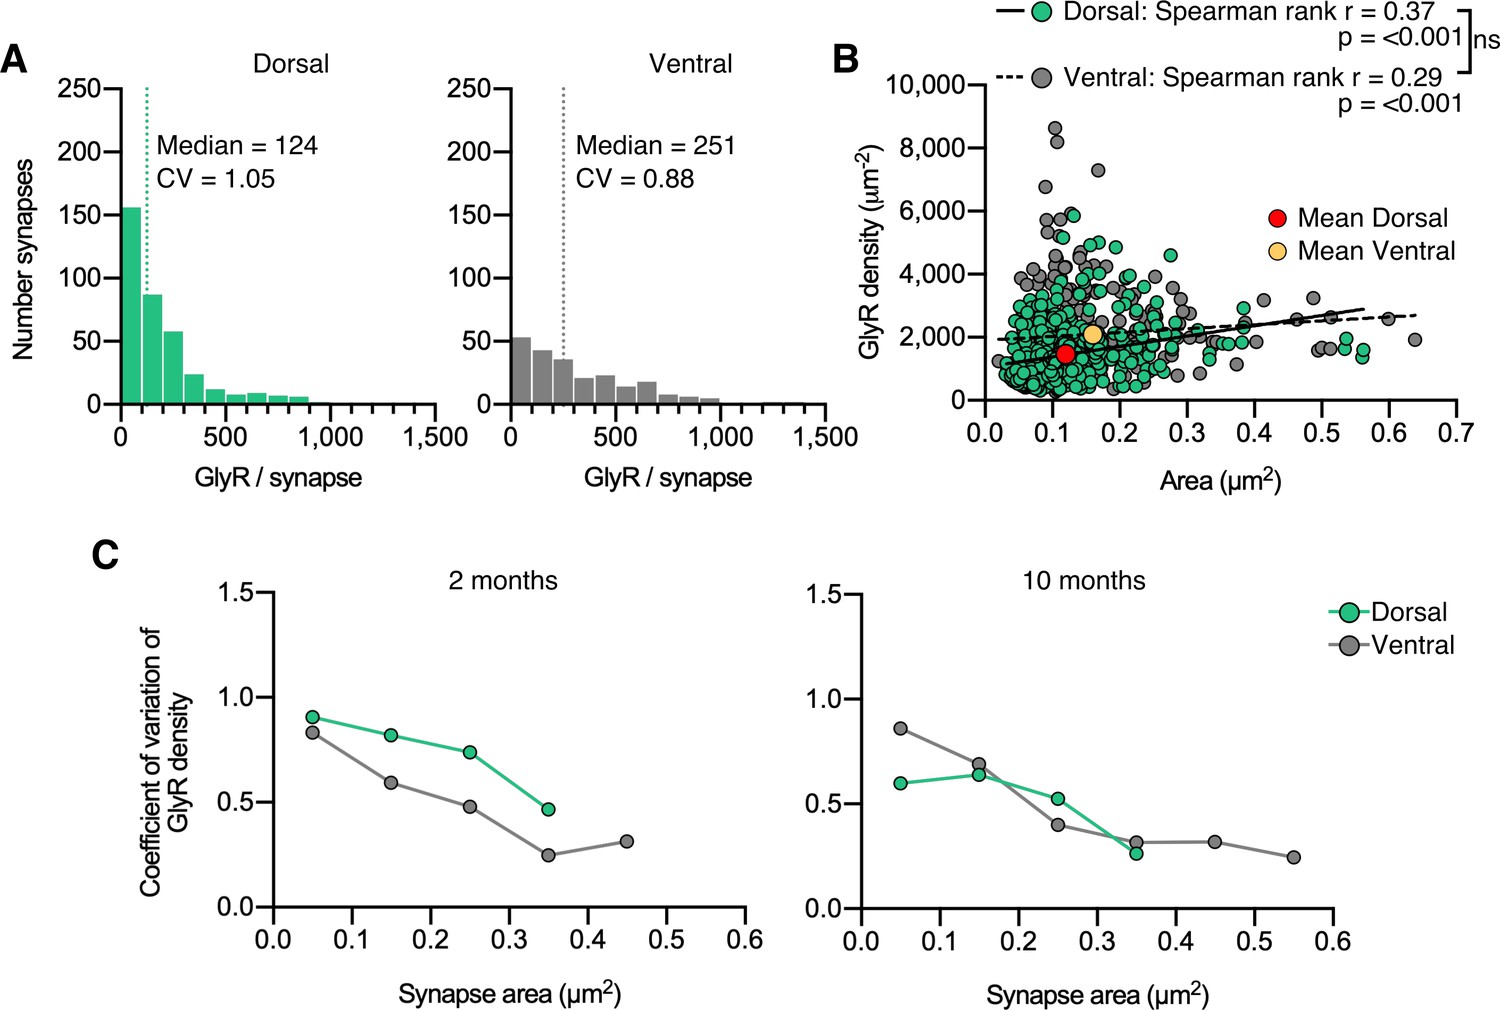
(A) 2 µm cryosections of spinal cord tissue were cut from dorsal and ventral tissue and placed on gridded glass coverslips. (B) Representative photo-activated localization microscopy (PALM) reconstruction of mEos4b-GlyRβ and super-resolution radial fluctuation (SRRF) reconstruction of mRFP-gephyrin at single dorsal and ventral synapses. Scale bar = 500 nm. (C) Intensity correlation quotient (ICQ) of mEos4b-GlyRβ and mRFP-gephyrin in heterozygous and homozygous 2-month-old mice. Plot shows median ± interquartile range. N = 357–604 synapses from 23 dorsal and 23 ventral images from 9 and 8 tissue slices, respectively, from 2 mice per condition. (D) Quantification of GlyR-gephyrin occupancy in 2-month-old homozygous mice (GlrbEos/Eos/GphnmRFP/mRFP). Nonparametric Spearman’s rank shows the same positive correlation at dorsal and ventral synapses. N = 1115 dorsal synapses and 1107 ventral synapses. (E) Pointillist reconstruction of mEos4b-GlyRβ detections. Inset shows a single synapse; red arrows indicate extrasynaptic receptor complexes. Scale bar = 500 nm. (F) Area of dorsal vs. ventral synapses in 2- and 10-month-old homozygous mice. Plot shows median ± interquartile range. N = 234–433 synapses from 20 to 23 images from 7 to 9 tissue slices from 2 mice per age per condition. Nonparametric Kruskal–Wallis ANOVA with Dunn’s multiple comparison test. (G) Number of synapses in dorsal and ventral tissue in 2- and 10-month-old homozygous mice. Plot shows median ± interquartile range. N = 20–23 images from 7 to 9 tissue slices from 2 mice per age per condition. Nonparametric Kruskal–Wallis ANOVA with Dunn’s multiple comparison test. (H) Histogram of the number of glycine receptors (GlyRs) per synapse calculated from the molecular conversion of detections (see Figure 2—figure supplements 3 and 4) in 2-month-old homozygous mice. N = 433 dorsal synapses and 304 ventral synapses from 23 dorsal and 23 ventral images from 9 and 8 tissue slices, respectively, from 2 mice. CV, coefficient of variation. (I) Scatter plot of GlyR density vs. synapse area in 2-month-old homozygous mice shows no difference between dorsal and ventral synapse densities. N = 433 dorsal synapses and 304 ventral synapses. *p<0.05, **p<0.01, ***p<0.001.
Figure 2—figure supplement 1
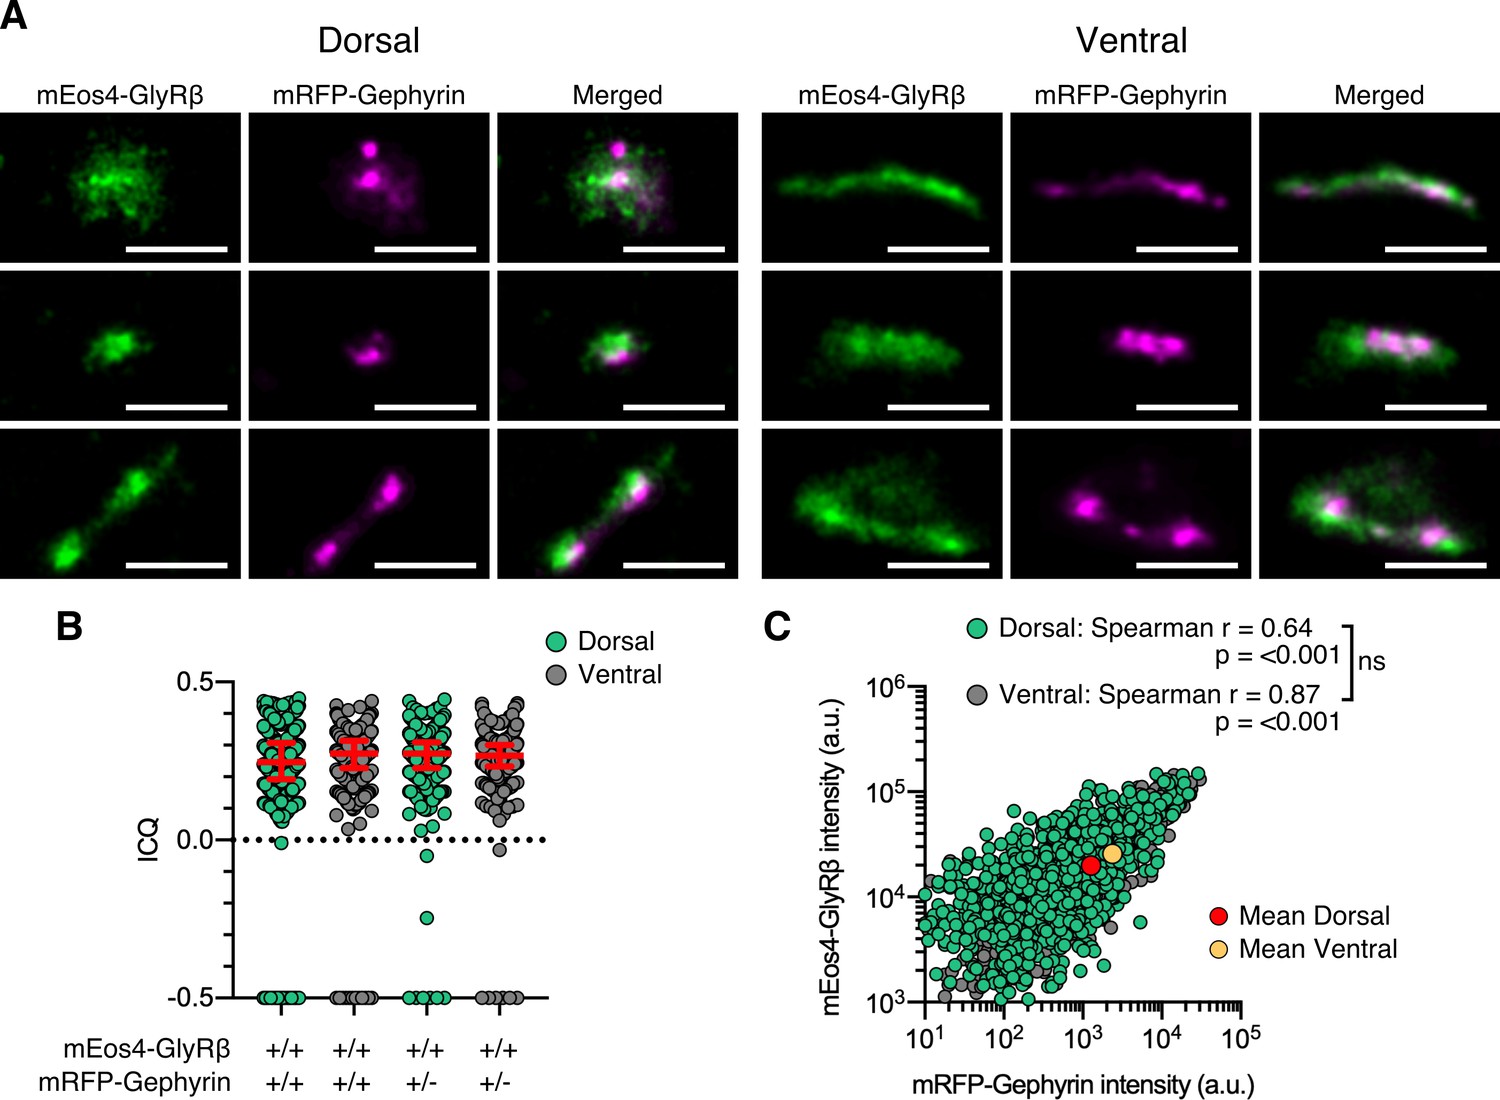
Dual-color super-resolution synapse shape & 10 month correlation analysis.
(A) Examples of synapse shapes and sizes in dorsal and ventral tissue. Scale bar = 500 nm. (B) Intensity correlation quotient (ICQ) of mEos4b-GlyRβ and mRFP-gephyrin in 10 month old heterozygous and homozygous mice. Plot shows median ± interquartile range. N = 466-611 synapses from 17 dorsal and 19 ventral images from 7 tissue slices per spinal cord region from 2 mice per condition. (C) Quantification of GlyR-gephyrin occupancy in 10 month old homozygous mice (GlrbEos/Eos / GphnmRFP/mRFP). Non-parametric Spearman’s rank shows the same positive correlation at dorsal and ventral synapses. N = 1241 dorsal synapses and 813 ventral synapses. ns = not significant.
Figure 2—figure supplement 2
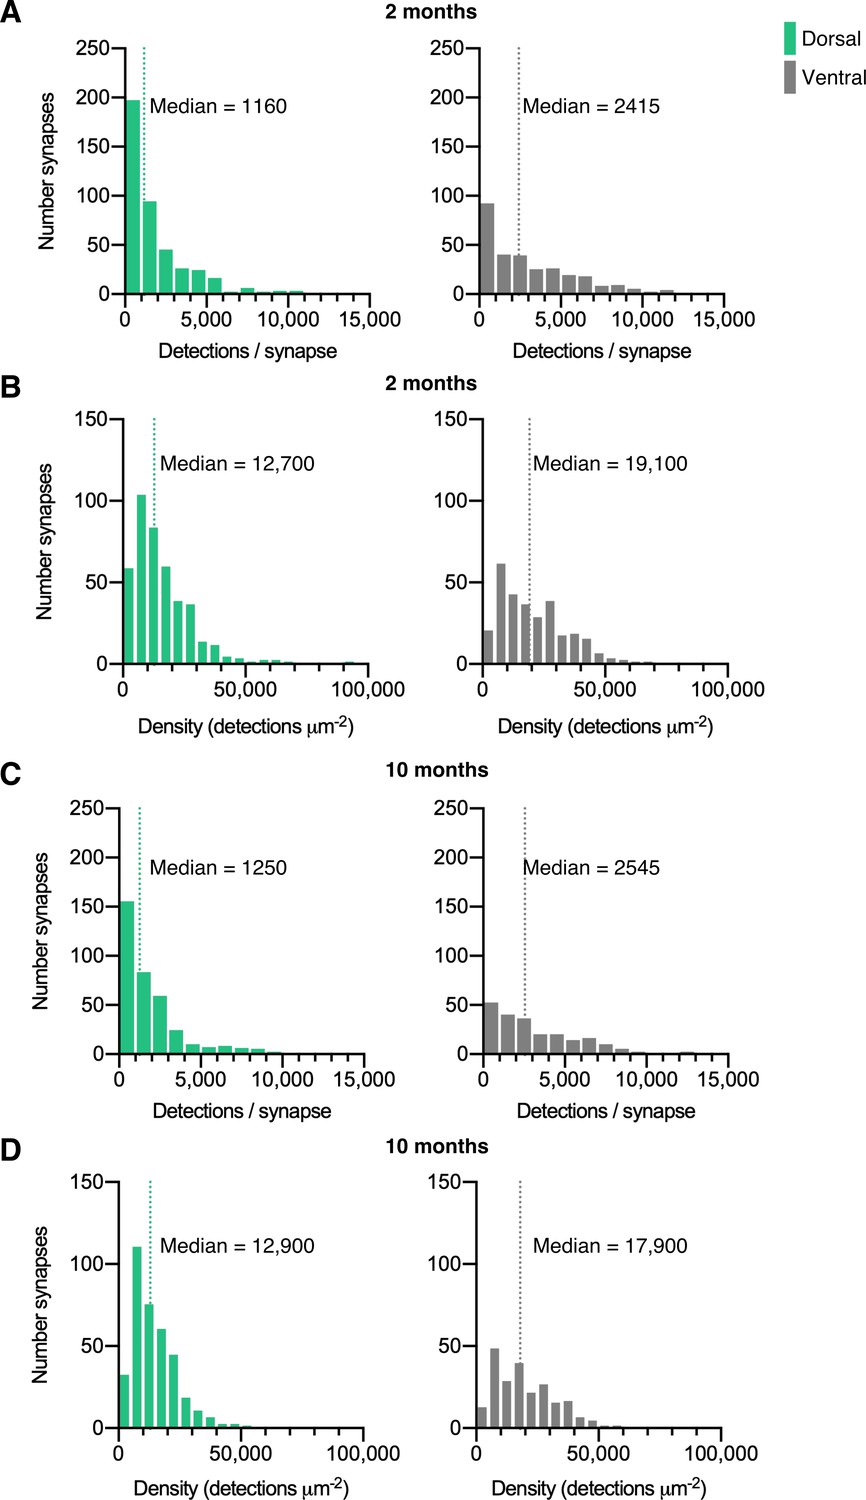
Quantification of mEos4b detections at synapses.
Histograms of mEos4b-GlyRβ detections per synapse (A & C) and density of detections (B & D). N = 433 dorsal synapses and 304 ventral synapses in 2 month old mice. N = 372 dorsal synapses and 234 ventral synapses in 10 month old mice.
Figure 2—figure supplement 3
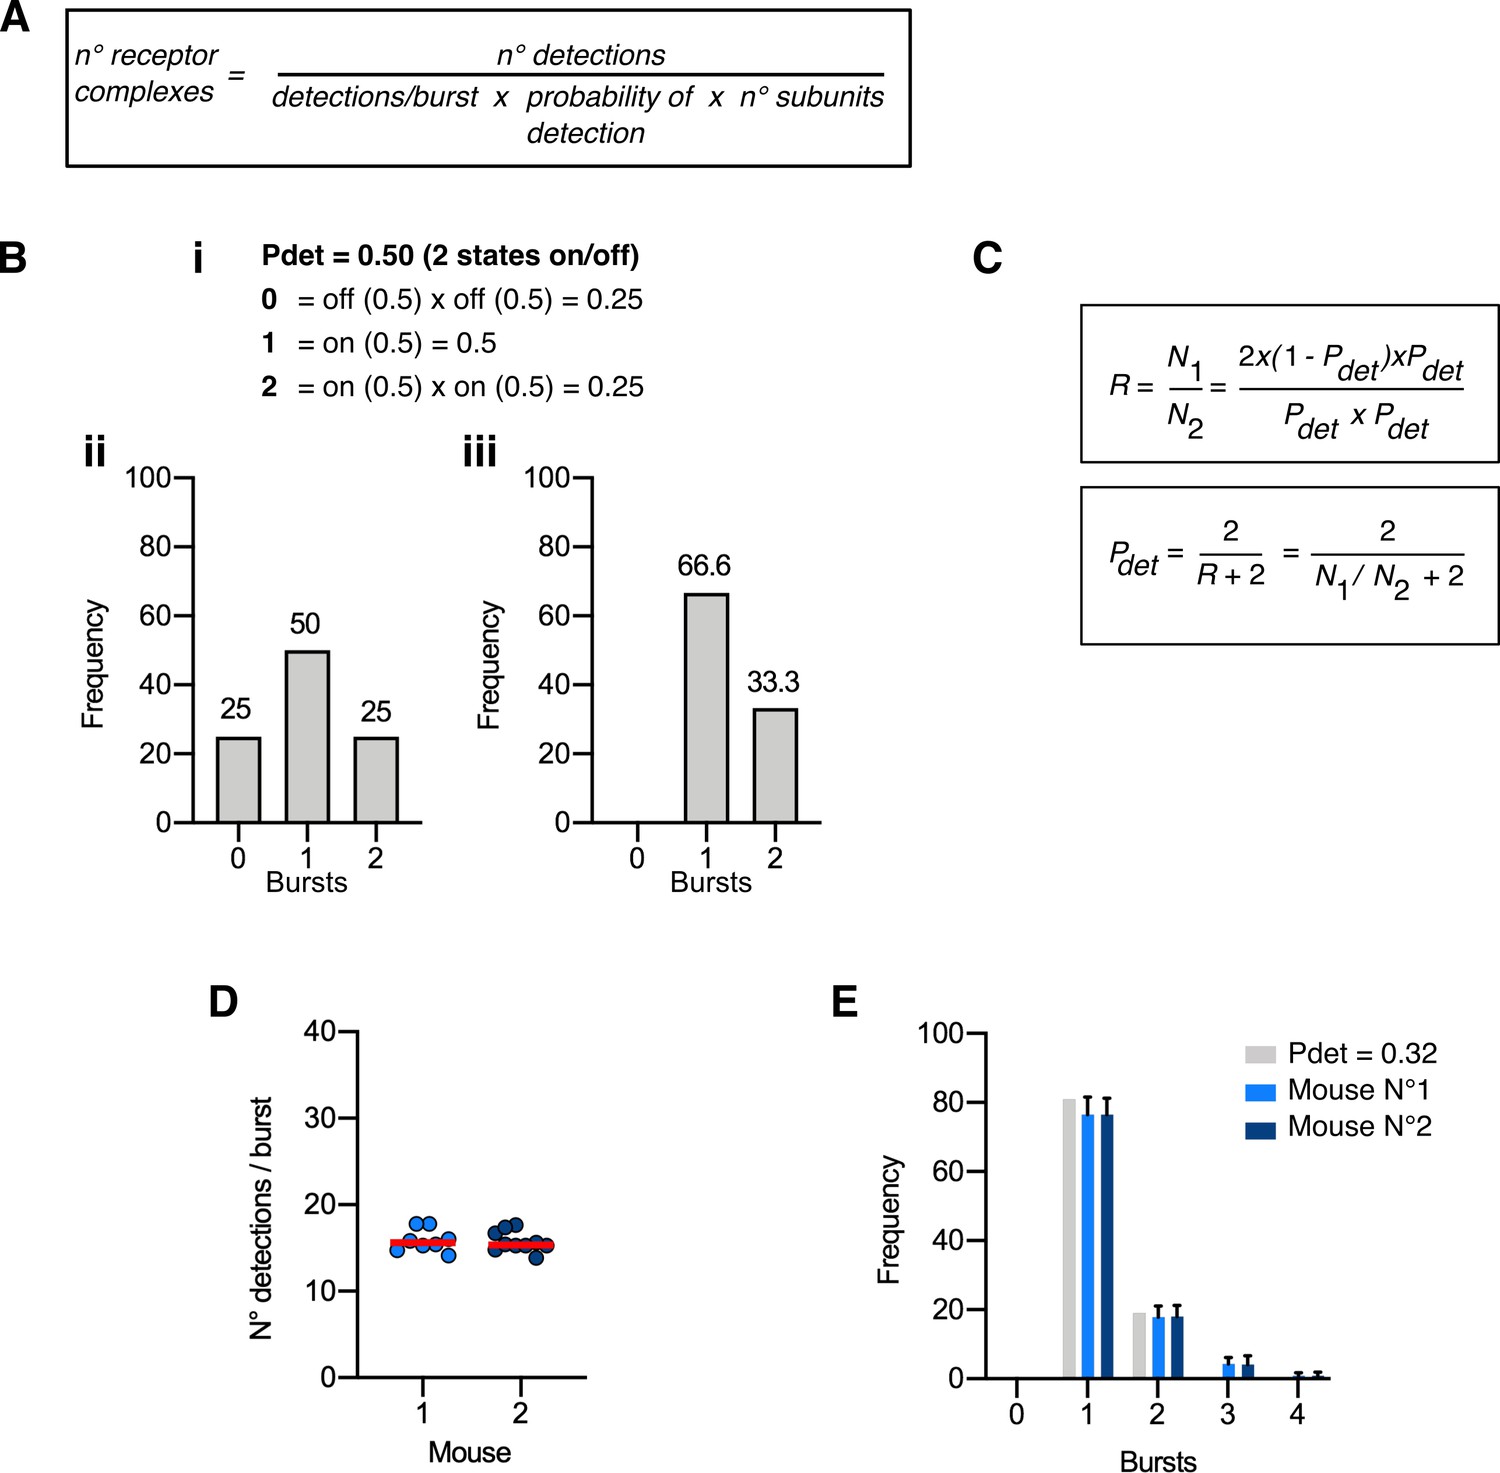
Molecule conversion of mEos4b-GlyRβ detections into GlyRs copy numbers.
(A) Descriptive formula for converting fluorophore detections into molecule numbers based on SMLM recordings in sparsely populated, extrasynaptic membrane compartments (Patrizio et al., 2017). Three parameters are required: the number of repetitive detections of the single fluorophores (average detections per burst), the probability that the fluorophore is functional (the probability of detection Pdet), and the stoichiometry of the heteropentameric GlyR complex based on a α3:β2 receptor stoichiometry (Durisic et al., 2014, Patrizio et al., 2017). (B) Theoretical binomial distribution of the number of bursts of fluorescently labeled GlyRβ subunits (imaging 0, 1 or 2 subunits) and a Pdet = 0.5 (i, ii), adjusted for the experimental situation in which only the counts of 1 and 2 bursts per cluster are visible (iii). (C) Derivation of the formula for calculating Pdet, using the counts of 1 and 2 bursts of detections. (D) Number of mEos4b detections per burst in homozygous GlrbEos/Eos animals from our experimental data. N = 8-9 images per mouse from 2 mice. (E) Distribution of the number of bursts of mEos4b detections in homozygous GlrbEos/Eos mice. N = 8-9 images per mouse from 2 mice. The light gray bars represent the adjusted distribution for Pdet = 0.32 that was calculated from the experimental data (blue bars) according to the formula given in (C).
Figure 2—figure supplement 4
Copy numbers and GlyRs densities at synapses (10 months).
(A) Histogram of the number of GlyRs per synapse calculated from the molecular conversion of detections in 10 month old mice (see Figure 2—figure supplements 2 and 3). N = 372 dorsal and 234 ventral synapses from 20 images from 7 tissue slices per region from 2 mice. CV = coefficient of variation. (B) Scatter plot of GlyR density vs synapse area shows no difference between dorsal and ventral synapse densities. ns = not significant. (C) Analysis of the coefficient of variation of GlyR density with respect to synapse area for dorsal and ventral synapses in 2 and 10 month old mice.
Figure 3 with 1 supplement
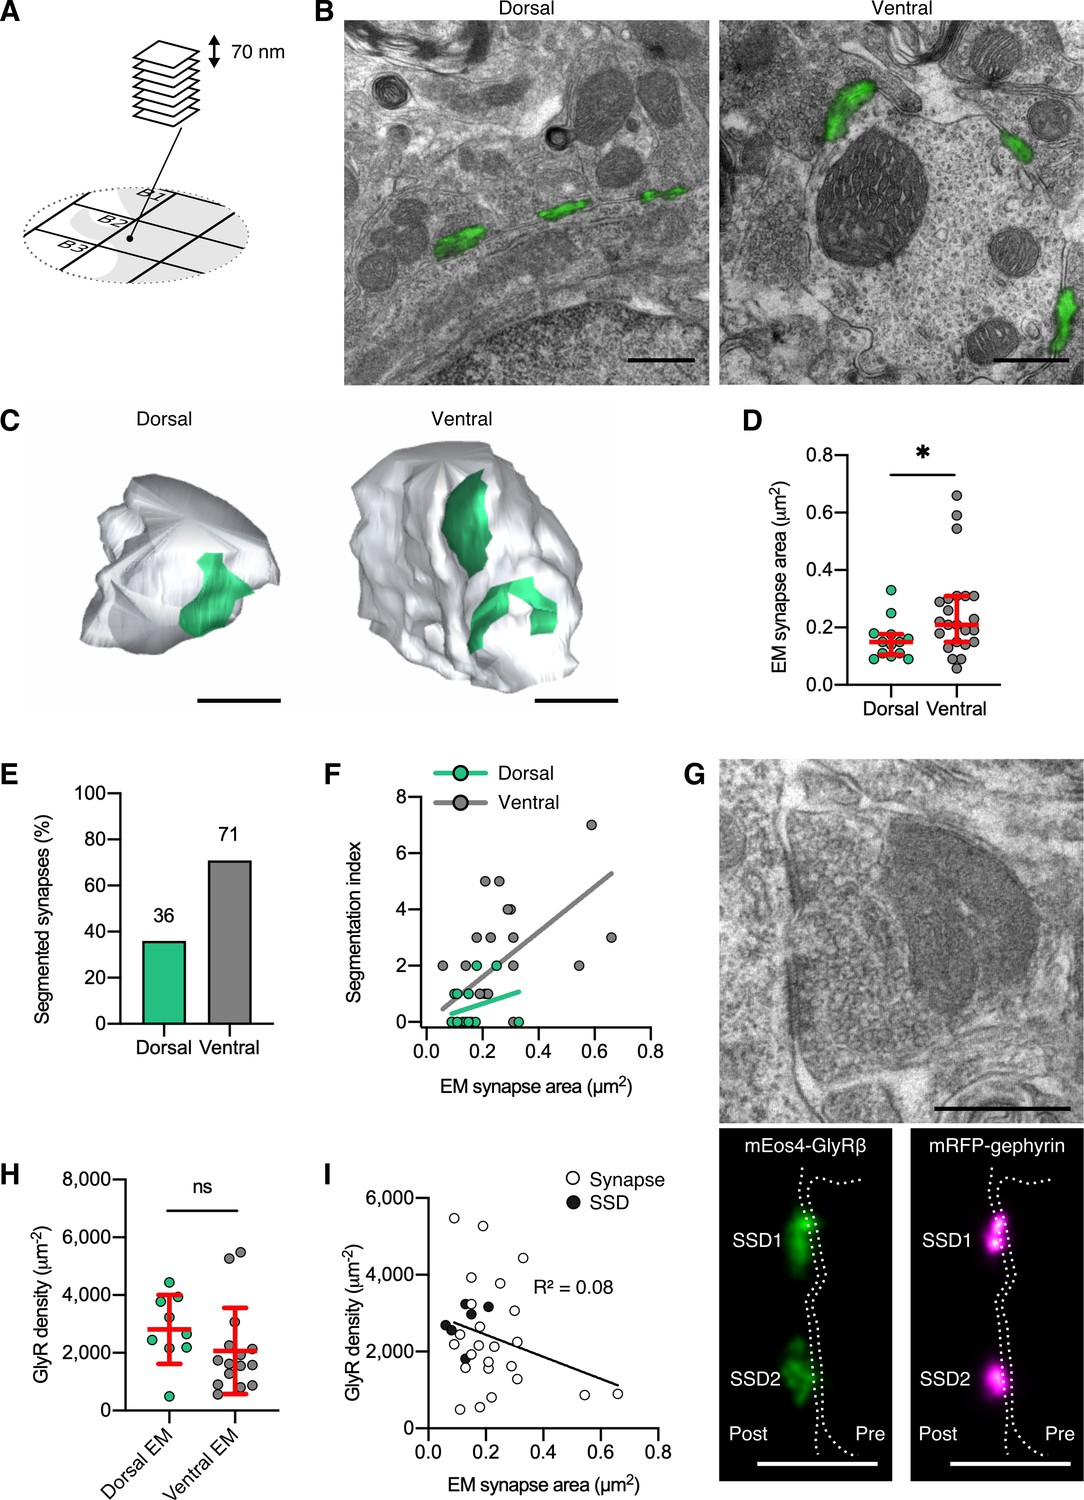
Quantitative super-resolution correlative light and electron microscopy (SR-CLEM) of endogenous glycine receptor (GlyR) molecular organization.
(A) Samples used for photo-activated localization microscopy (PALM) were re-sectioned as serial ultra-thin 70 nm sections for CLEM. (B) Representative dorsal and ventral synapses imaged with PALM (mEos4b-GlyRβ; green) and super-imposed with their corresponding electron micrographs. Scale bar = 500 nm. (C) Representative 3D reconstructions of dorsal and ventral synapses. Green, postsynaptic site; gray, presynaptic bouton. Scale bar = 500 nm. (D) Area of dorsal and ventral synapses measured by EM. Plot shows median ± interquartile range. Nonparametric unpaired two-tailed t-test, Mann–Whitney post hoc. (E) Percentage of total synapses measured in EM with segmented shapes. (F) Comparison of segmentation index with synaptic area in dorsal and ventral synapses. (G) Juxtaposition of a raw electron micrograph and reconstructed PALM/super-resolution radial fluctuation (SRRF) images of sub-synaptic domains (SSDs) in the same ventral synapse. Scale bar = 500 nm. (H) Analysis of GlyR density following correction for EM area measurements. Plot shows mean ± SD. (I) Combined scatter plot of dorsal and ventral synapse densities shows density is independent of synapse size. White, all synapses; black, SSDs. N = 13 dorsal and 23 ventral synapses from 2 mice. *p<0.05, ns, not significant.
Figure 3—figure supplement 1
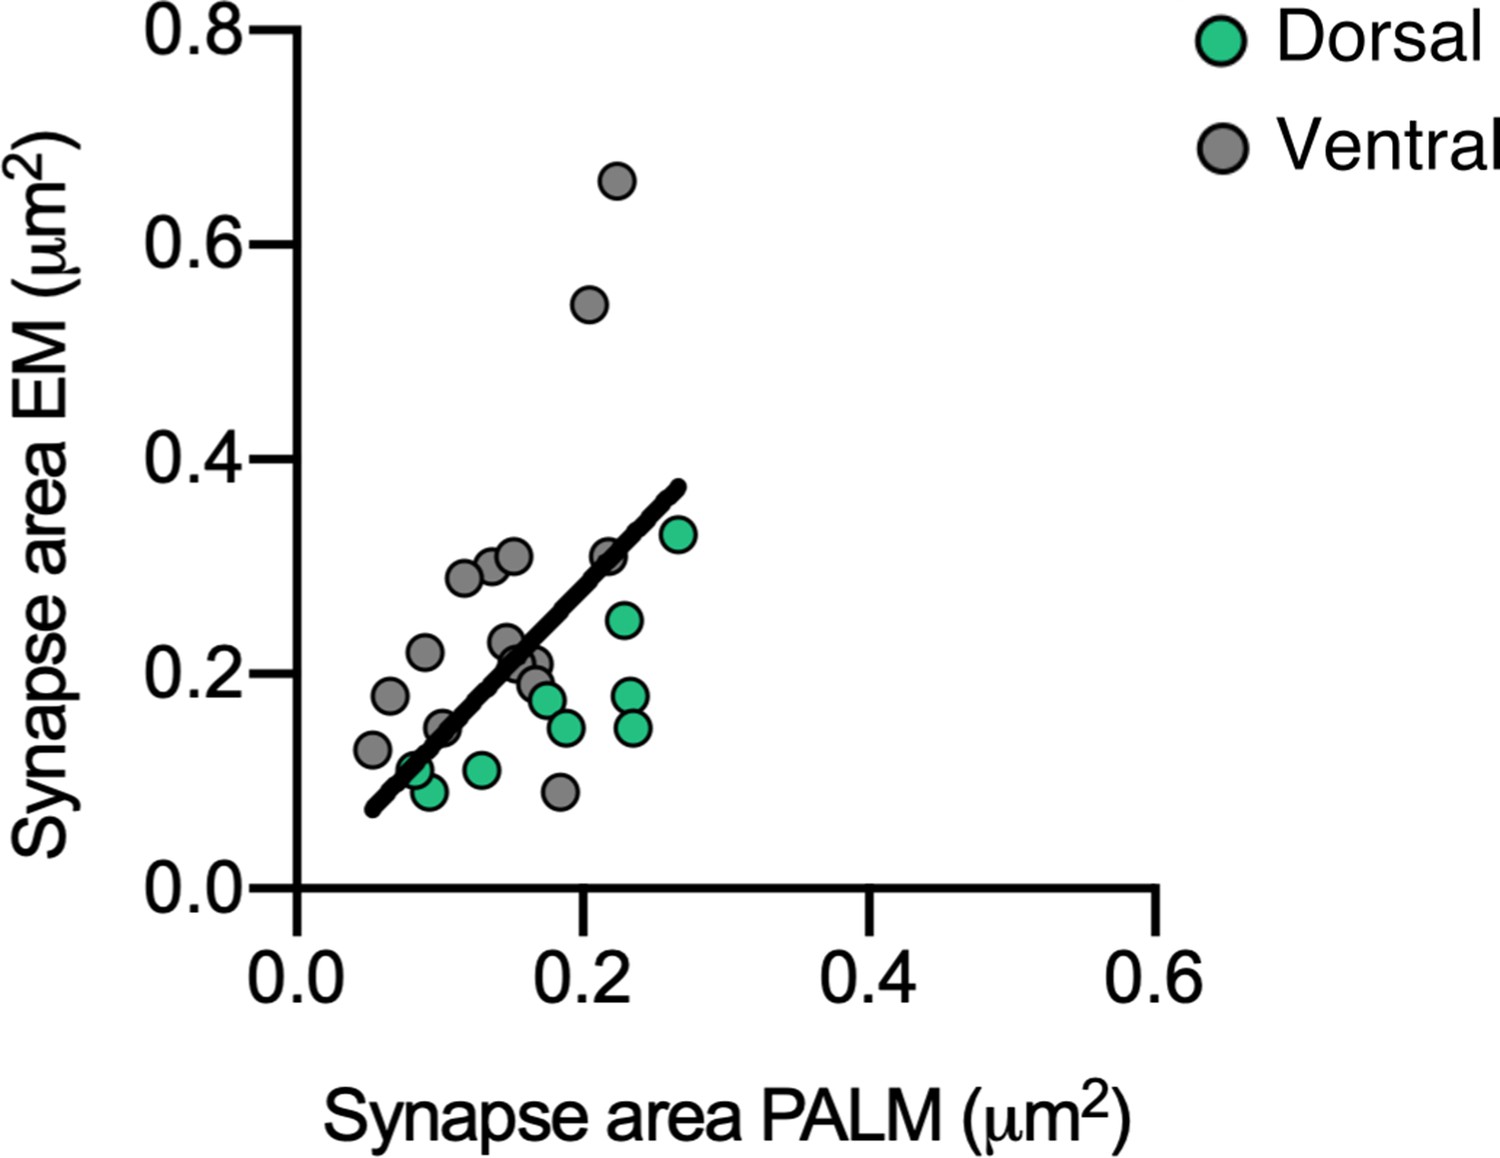
Comparison of PALM and EM area measurements.
Comparison of synapse areas measured by PALM and EM shows a close correspondence.
Figure 4 with 1 supplement
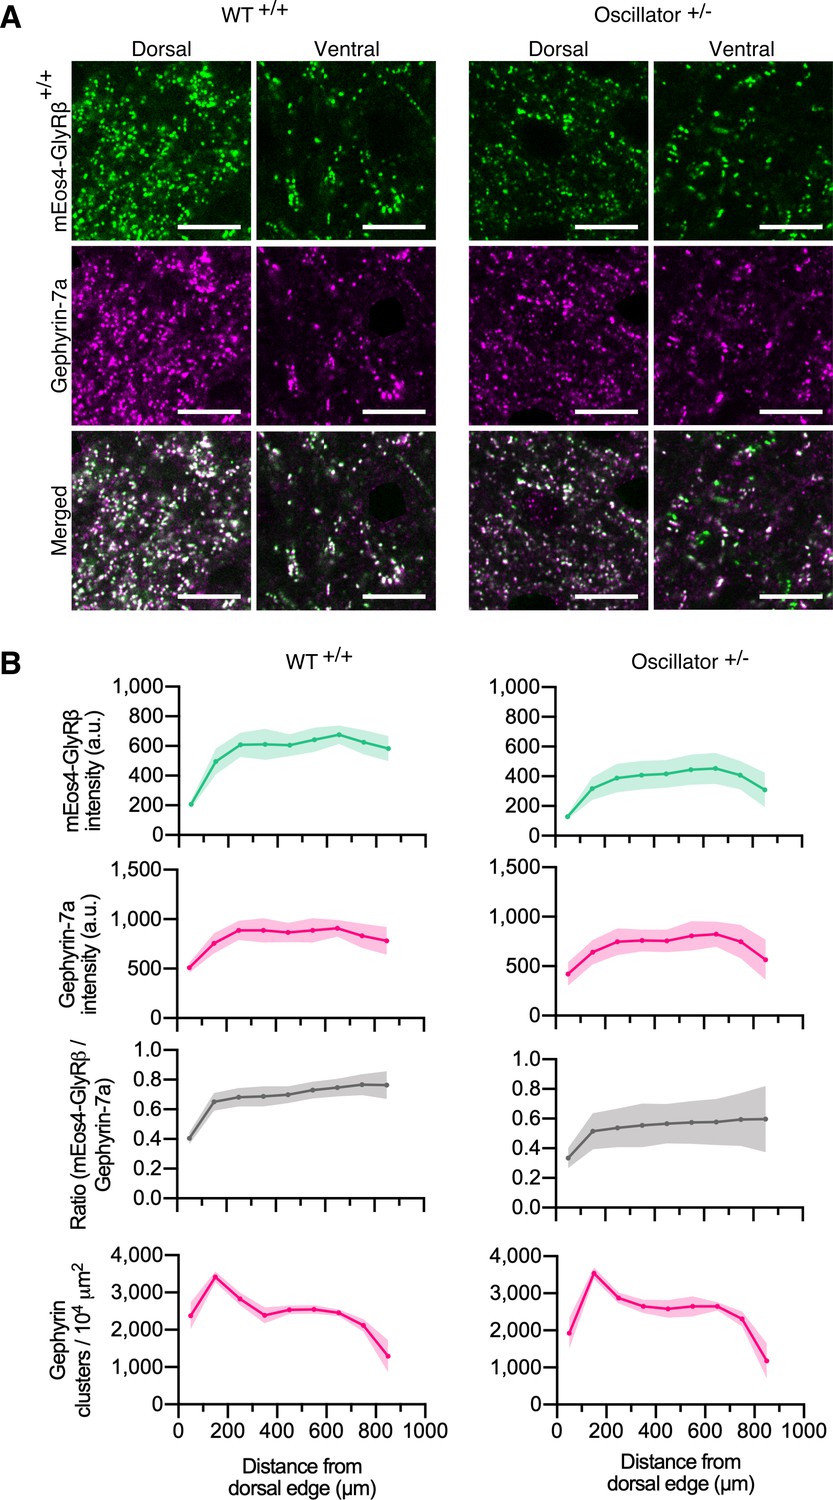
Quantitative confocal imaging of endogenous glycine receptors (GlyRs) in the oscillator mouse model.
(A) Representative confocal images of dorsal and ventral synapses from heterozygous oscillator mice (+/-) compared to homozygous WT (+/+) littermates. All mice are homozygous for mEos4b-GlyRβ (green), with gephyrin-7a immunolabeling (magenta). Scale bar = 10 μm. (B) Mean intensity ± 95% confidence interval of mEos4b-GlyRβ and gephyrin-7a at gephyrin-positive puncta, and numbers of gephyrin clusters measured from distal edge of spinal cord in 2-month-old mice. N = 9–11 images from 9 to 11 tissue slices from 2 mice per genotype.
Figure 4—figure supplement 1
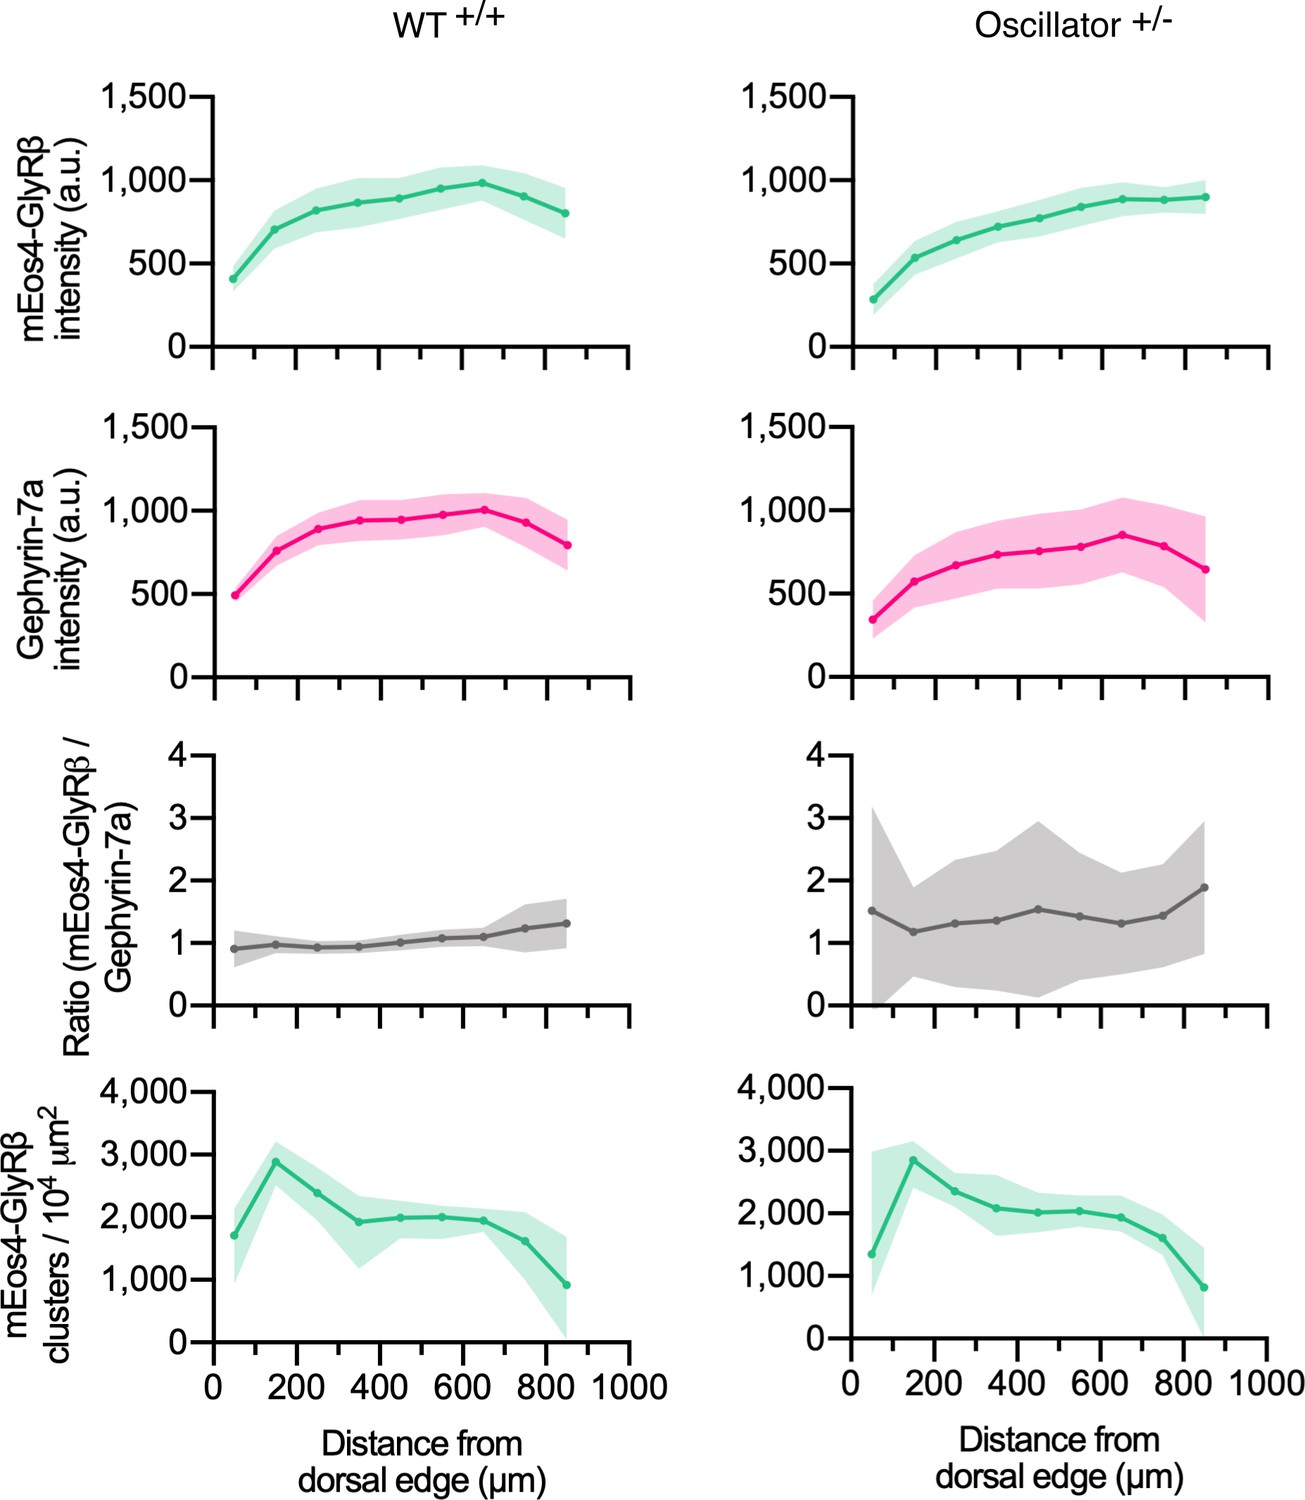
Quantitative confocal analysis at mEos4 puncta of the oscillator mouse model.
Intensity of mEos4b-GlyRβ and mRFP-gephyrin at mEos4-positive puncta across the spinal cord in mice heterozygous (+/-) for oscillator compared to homozygous WT (+/+) littermates. All mice are homozygous for mEos4b-GlyRβ. Intensities measured in regions as indicated by rectangle in (Figure 1A). Plots show mean ± 95% confidence interval. N = 9-11 images from 9-11 tissue slices from 2 mice per genotype (same data as in Figure 4, but using a mask generated in the mEos4b channel instead of the Cy3 immunolabeled gephrin).
Figure 5 with 2 supplements
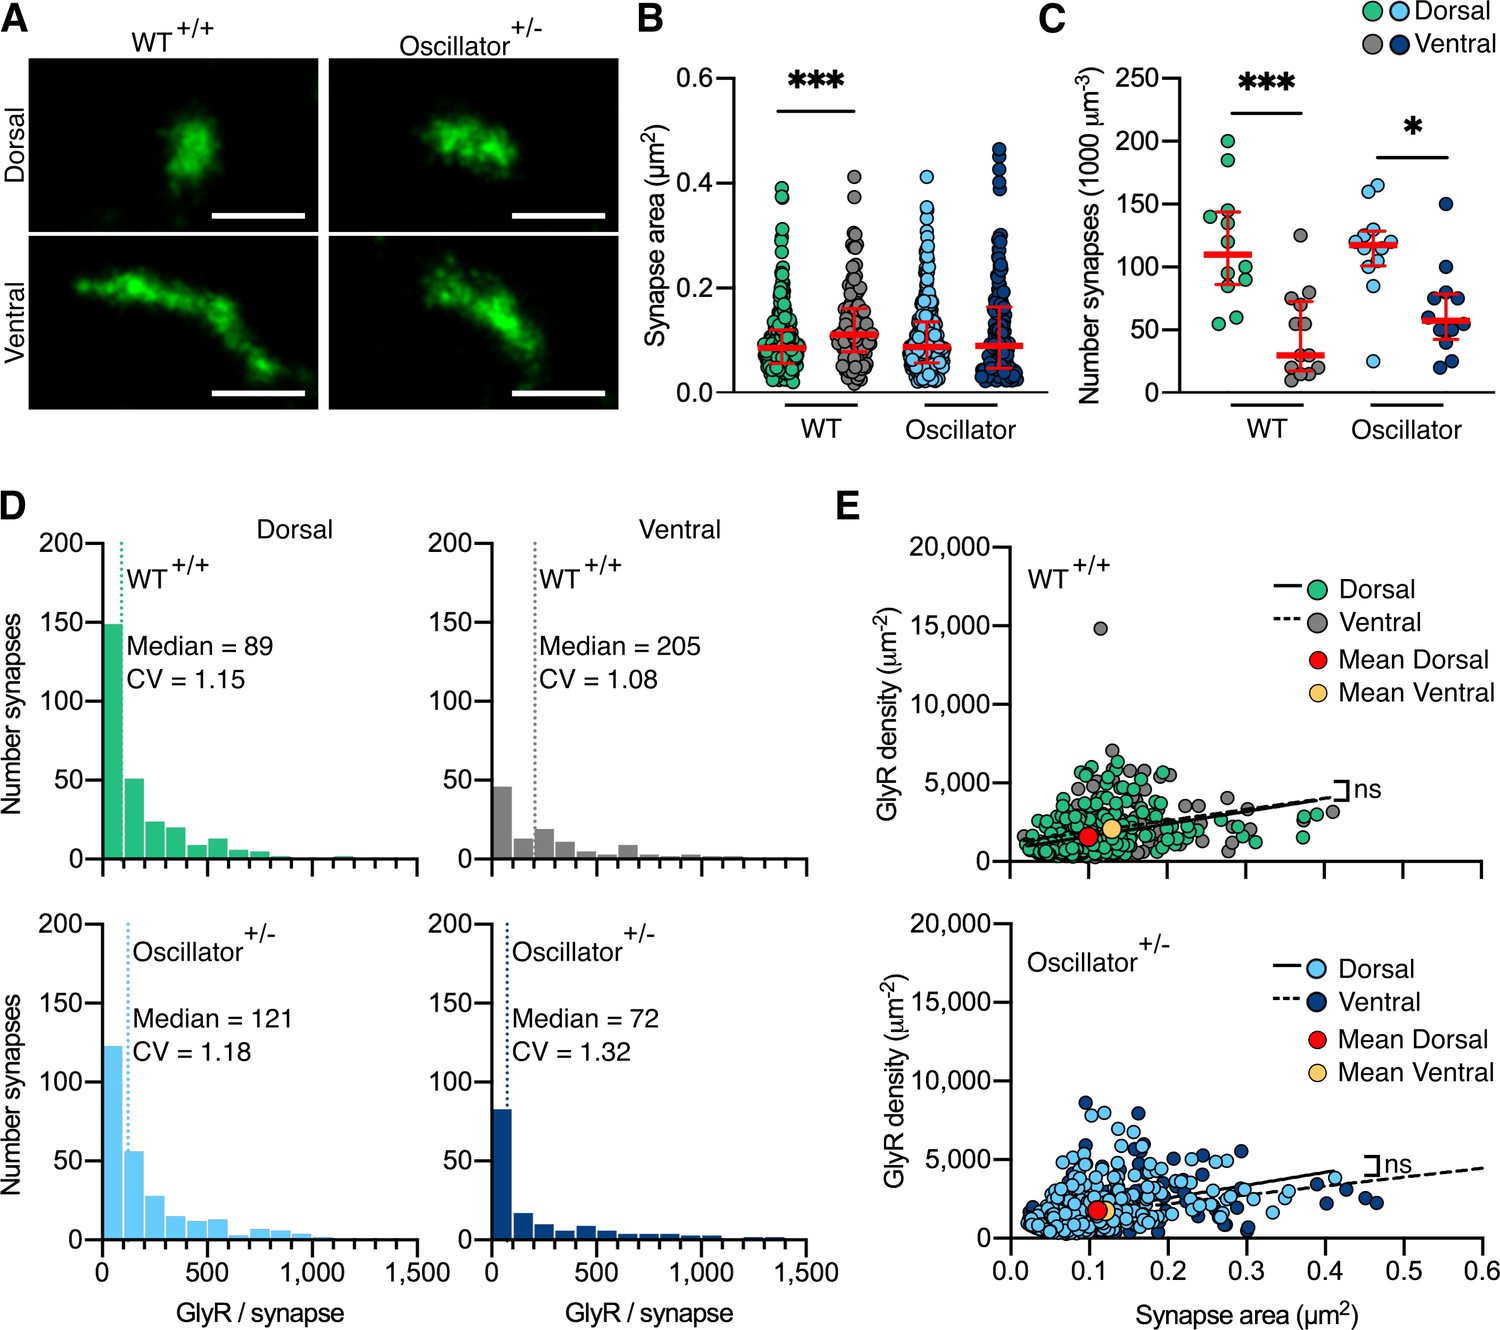
Photo-activated localization microscopy (PALM) imaging of the glycine receptor (GlyR) in the oscillator mouse model.
(A) Representative PALM reconstructions of mEos4b-GlyRβ at single dorsal and ventral synapses in heterozygous (+/-) oscillator and homozygous (+/+) wild-type (WT) littermates. All mice are homozygous for mEos4b-GlyRβ. Scale bar = 500 nm. (B) Area of dorsal vs. ventral synapses in heterozygous oscillator vs. WT littermates. Plot shows median ± interquartile range. N = 120–282 synapses from 24 images from 9 to 11 tissue slices from 2 mice per genotype. Nonparametric Kruskal–Wallis ANOVA with Dunn’s multiple comparison test. (C) Number of synapses in dorsal and ventral tissue in heterozygous oscillator vs. WT mice. Plot shows median ± interquartile range. N = 12–13 images from 2 mice per genotype. Parametric one-way ANOVA with Tukey’s multiple comparison test. (D) Histogram of the number of GlyRs per synapse calculated from the molecular conversion of detections (see Figure 2—figure supplement 3, and Figure 5—figure supplements 1 and 2). N = 282 WT dorsal and 120 ventral synapses, 273 oscillator dorsal and 156 ventral synapses from 24 images from 9 to 11 tissue slices from 2 mice per genotype. CV, coefficient of variation. (E) Scatter plots of GlyR density vs. synapse area show no difference between dorsal and ventral synapse densities in WT and oscillator. N = same as in (D). *p<0.05, ***p<0.001, ns, not significant.
Figure 5—figure supplement 1

Quantification of mEos4b detections at synapses in the oscillator mouse model.
Histograms of mEos4b-GlyRβ detections per synapse in heterozygous (+/-) oscillator and homozygous (+/+) WT littermates. N = 282 WT dorsal and 120 ventral synapses, 273 oscillator dorsal and 156 ventral synapses from 2-4 tissue slices and 2 mice for all conditions. CV = coefficient of variation, MAD = median absolute deviation.
Figure 5—figure supplement 2
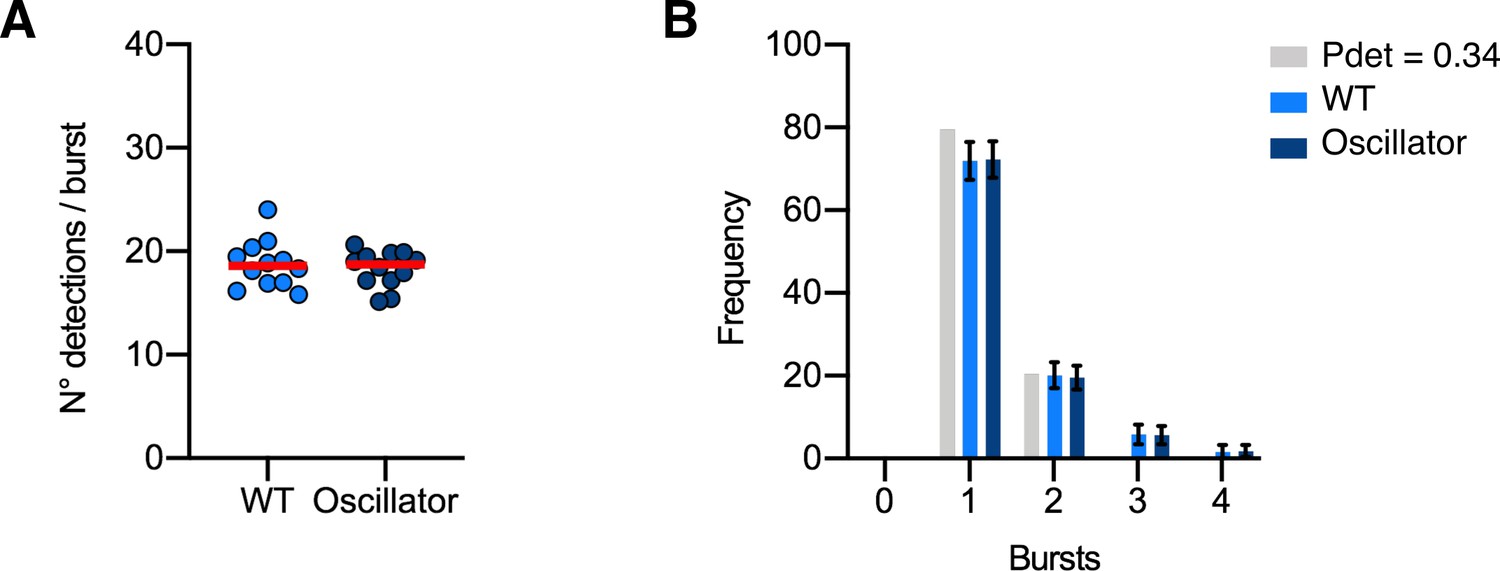
Molecule conversion of mEos4b-GlyRβ detections into GlyRs copy numbers in the oscillator mouse model.
(A) Number of mEos4b detections per burst in homozygous GlrbEos/Eos mice in heterozygous oscillator and homozygous WT littermates. N = 12 images per mouse. (B) Frequency distribution of bursts of mEos4b detections in homozygous GlrbEos/Eos mice. The light gray bars indicate a binomial distribution for Pdet = 0.34 that was calculated from the experimental data as described in Figure 2—figure supplement 3. N = 12 images per mouse.
Additional files
Download links
A two-part list of links to download the article, or parts of the article, in various formats.
Downloads (link to download the article as PDF)
Open citations (links to open the citations from this article in various online reference manager services)
Cite this article (links to download the citations from this article in formats compatible with various reference manager tools)
Identification of a stereotypic molecular arrangement of endogenous glycine receptors at spinal cord synapses
eLife 10:e74441.
https://doi.org/10.7554/eLife.74441


