Stability of motor representations after paralysis
- California Institute of Technology, United States
- T&C Chen Brain-Machine Interface Center at Caltech, United States
- Institute of Cognitive Neuroscience, University College London, United Kingdom
- Casa Colina Hospital and Centers for Healthcare, United States
- UT Southwestern Medical Center, United States
Figures
Figure 1 with 6 supplements

Robust brain–computer interface (BCI) control of individual fingers.
(a) Main finger flexion task. When a letter was cued by the red crosshair, the participant looked at the cue and immediately attempted to flex the corresponding finger of her right (contralateral) hand. We included a null condition ‘X’, during which the participant looked at the target but did not move her fingers. Visual feedback indicated the decoded finger 1.5 s after cue presentation. To randomize the gaze location, cues were located on a grid (three rows, four columns) in a pseudorandom order. The red crosshair was jittered to minimize visual occlusion. (b) Confusion matrix showing robust BCI finger control (86% overall accuracy, 4016 trials aggregated over 10 sessions). Each entry (i, j) in the matrix corresponds to the ratio of movement i trials that were classified as movement j. (c–f) Mean firing rates for four example neurons, color-coded by attempted finger movement. Shaded areas indicate 95% confidence intervals (across trials of one session). Gaussian smoothing kernel (50 ms standard deviation [SD]).
Figure 1—figure supplement 1
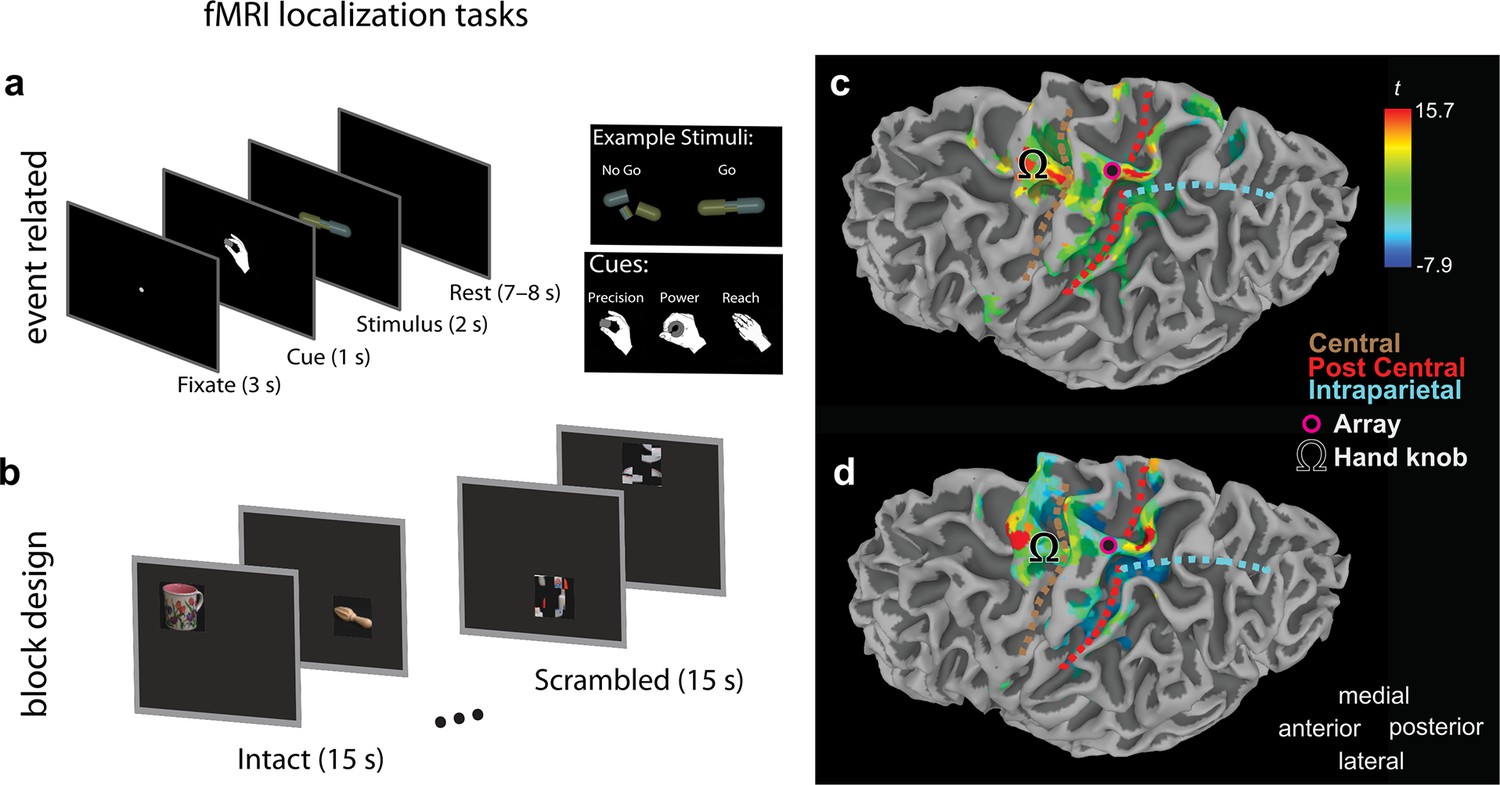
Multielectrode array implant location.
Figure 1—figure supplement 1 and legend text have been reproduced from Figure S1 of Aflalo et al., 2020. The original image and legend text are published under the terms of the Creative Commons Attribution-NonCommercial 4.0 International license (CC BY-NC 4.0) https://creativecommons.org/licenses/by-nc/4.0/. We used fuctional magnetic resonance imaging (fMRI) to identify cortical regions involved in imagined reaching and grasping actions. The participant performed two complementary tasks to ensure activation was robust across paradigms. (a) Event-related task design. Following an intertrial interval, the subject was cued with a specific imagined movement (precision grasp, power grasp, or reach without hand shaping). Following the cue, a cylindrical object was displayed. If the object was intact, the subject imagined performing the cued movement. If the object was broken, the subject withheld movement. (b) Block task design. Eight blocks were presented for 30 s per run. During the first 15 s of each block, common objects were presented every 3 s in varying spatial locations. Before each run, the subject was instructed to either imagine pointing at, imagine reaching and grasping, or look naturally at the object. During the last 15 s of each block, scrambled images were presented and the subject was instructed to guess the identity of the object. (c) Statistical parametric map showing voxels with significant activity for grasping (‘Go’ vs. ‘No-Go’) (p < 0.01, FDR-corrected), based on task (a). Array location and cortical landmarks are depicted in the legend. (d) Statistical parametric map showing voxels with significant activation (p < 0.01, FDR-corrected) for grasping versus looking, based on task (b).
© 2020, Aflalo et al. 2020. Figure S1 of Aflalo et al., 2020. The original image and legend text are published under the terms of the Creative Commons Attribution-NonCommercial 4.0 International license (CC BY-NC 4.0)
Figure 1—figure supplement 2
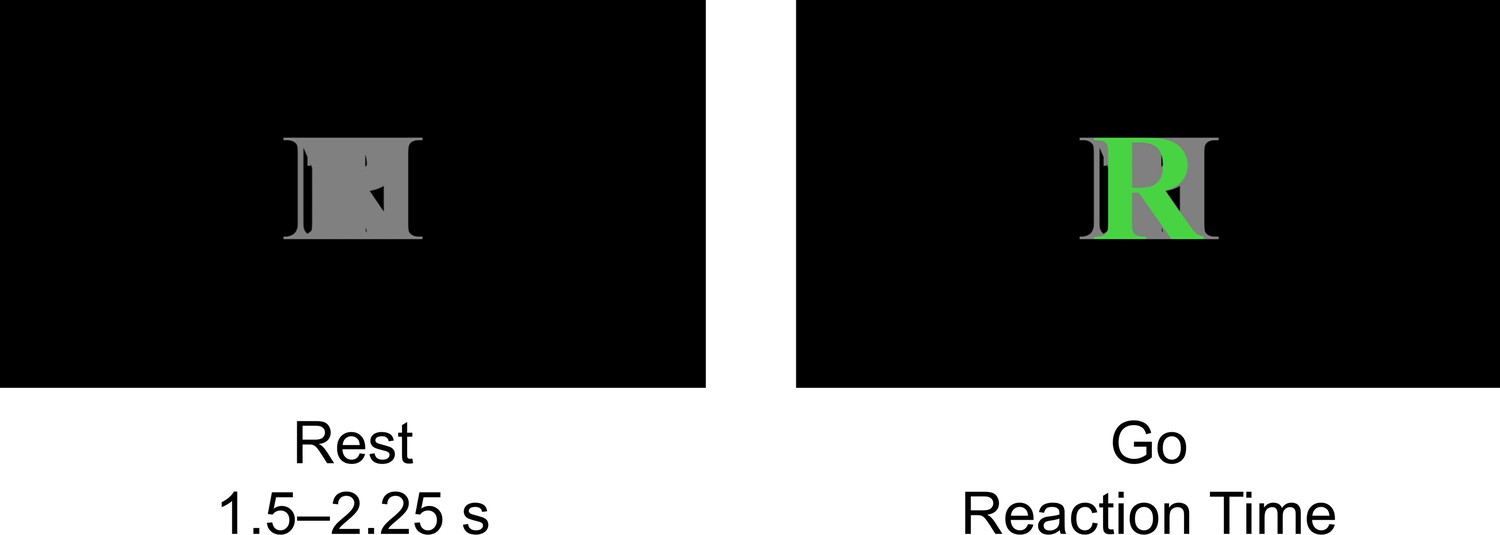
Calibration task.
Task structure, single trial. Each trial consisted of an intertrial interval (ITI) and a reaction-time Go phase. During the Go phase, green text specified which finger to flex. All letters were overlaid in gray to minimize visual differences between ITI and Go phases. T = thumb, I = index, M = middle, R = ring, P = pinky, X = no movement.
Figure 1—figure supplement 3

Brain–computer interface (BCI) classification accuracy across sessions.
Finger classification accuracy in the main task across 10 sessions. Session 1 accuracy excludes No-Go (X) trials (see Methods).
Figure 1—figure supplement 4
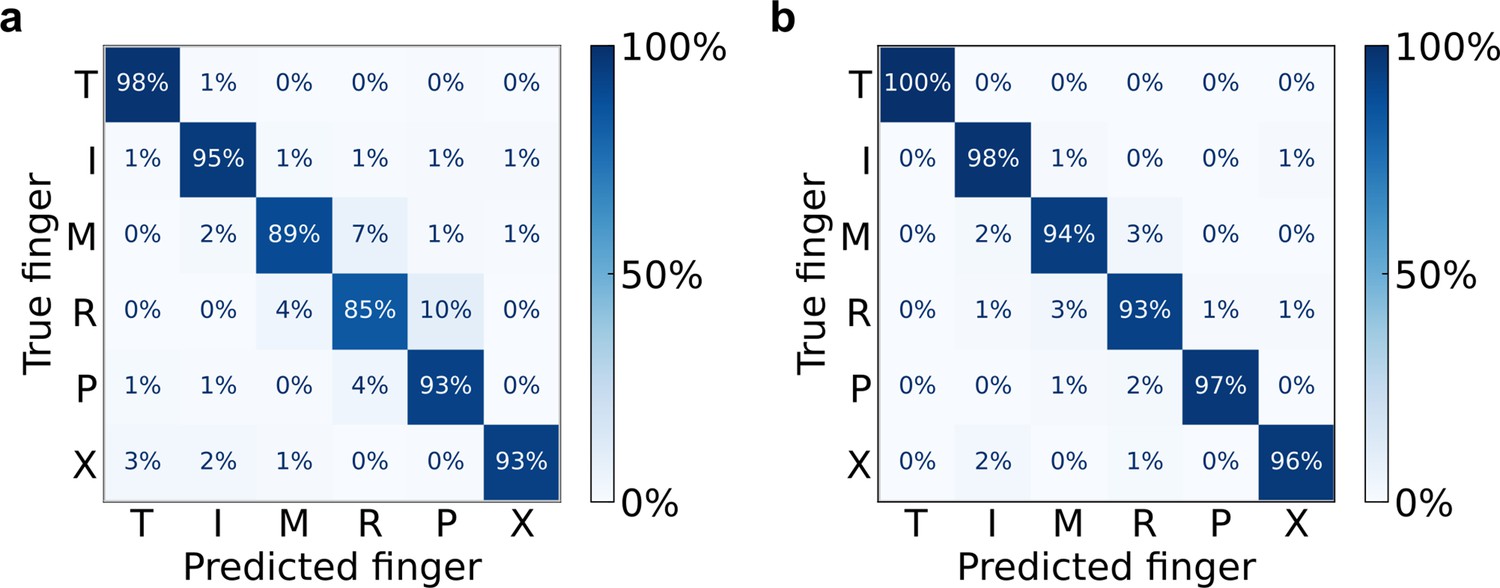
Robust cross-validated finger classification during main and calibration tasks.
(a) Confusion matrix of offline finger classification, cross-validated within single sessions. 4080 trials of the main task aggregated over 10 sessions. (b) Confusion matrix of offline finger classification, cross-validated within single sessions. Five hundred and thirty trials of the calibration task aggregated over nine sessions. T = thumb, I = index, M = middle, R = ring, P = pinky, X = no movement. Each entry (i, j) in the matrix corresponds to the ratio of movement i trials that were classified as movement j.
Figure 1—figure supplement 5
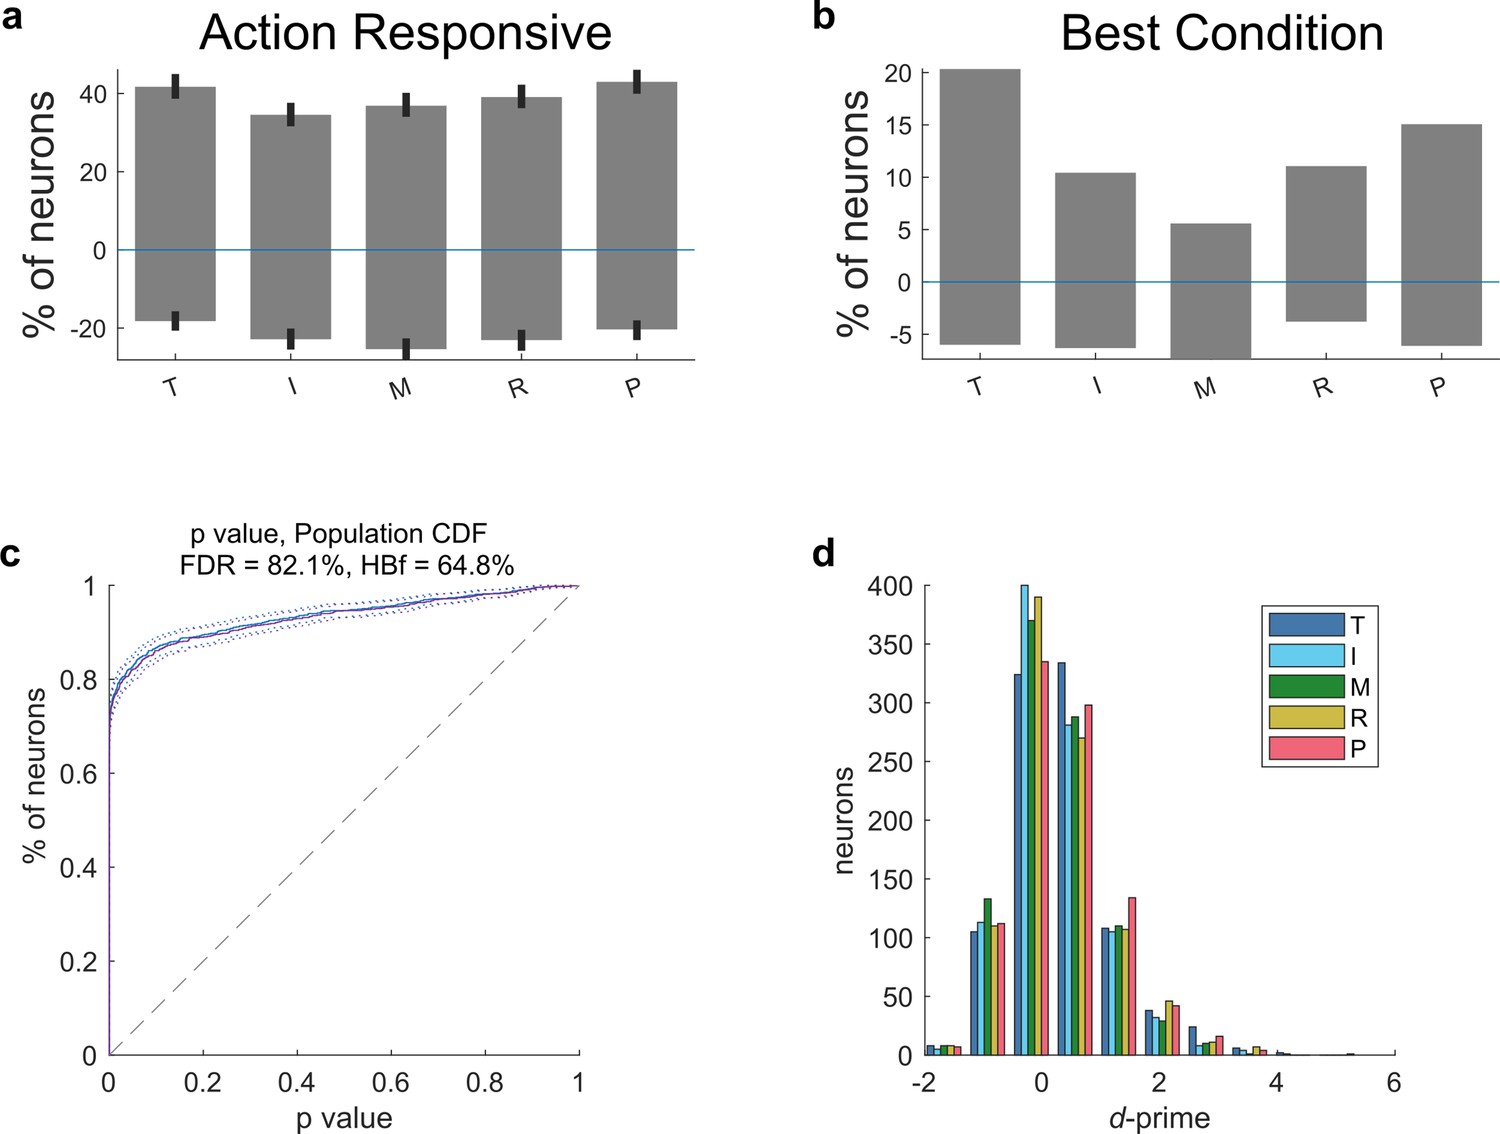
Single-neuron encoding of individual fingers.
All five fingers of the right (contralateral) hand were encoded within the population during movement execution. (a) Percentage of the population tuned significantly (p < 0.05, FDR-corrected) to flexion of each finger. Positive percentages indicate neurons that increased firing rate during finger movement and negative percentages indicates neurons that decreased firing rate. Error bars indicate a 95% bootstrap confidence interval. (b) Percentage of the population tuned best to each finger. (c) Cumulative distribution function of the population’s tuning significance p values. (d) Histogram of d′ (discriminability index) values across neurons. (a–d) Neurons were pooled across sessions.
Figure 1—figure supplement 6
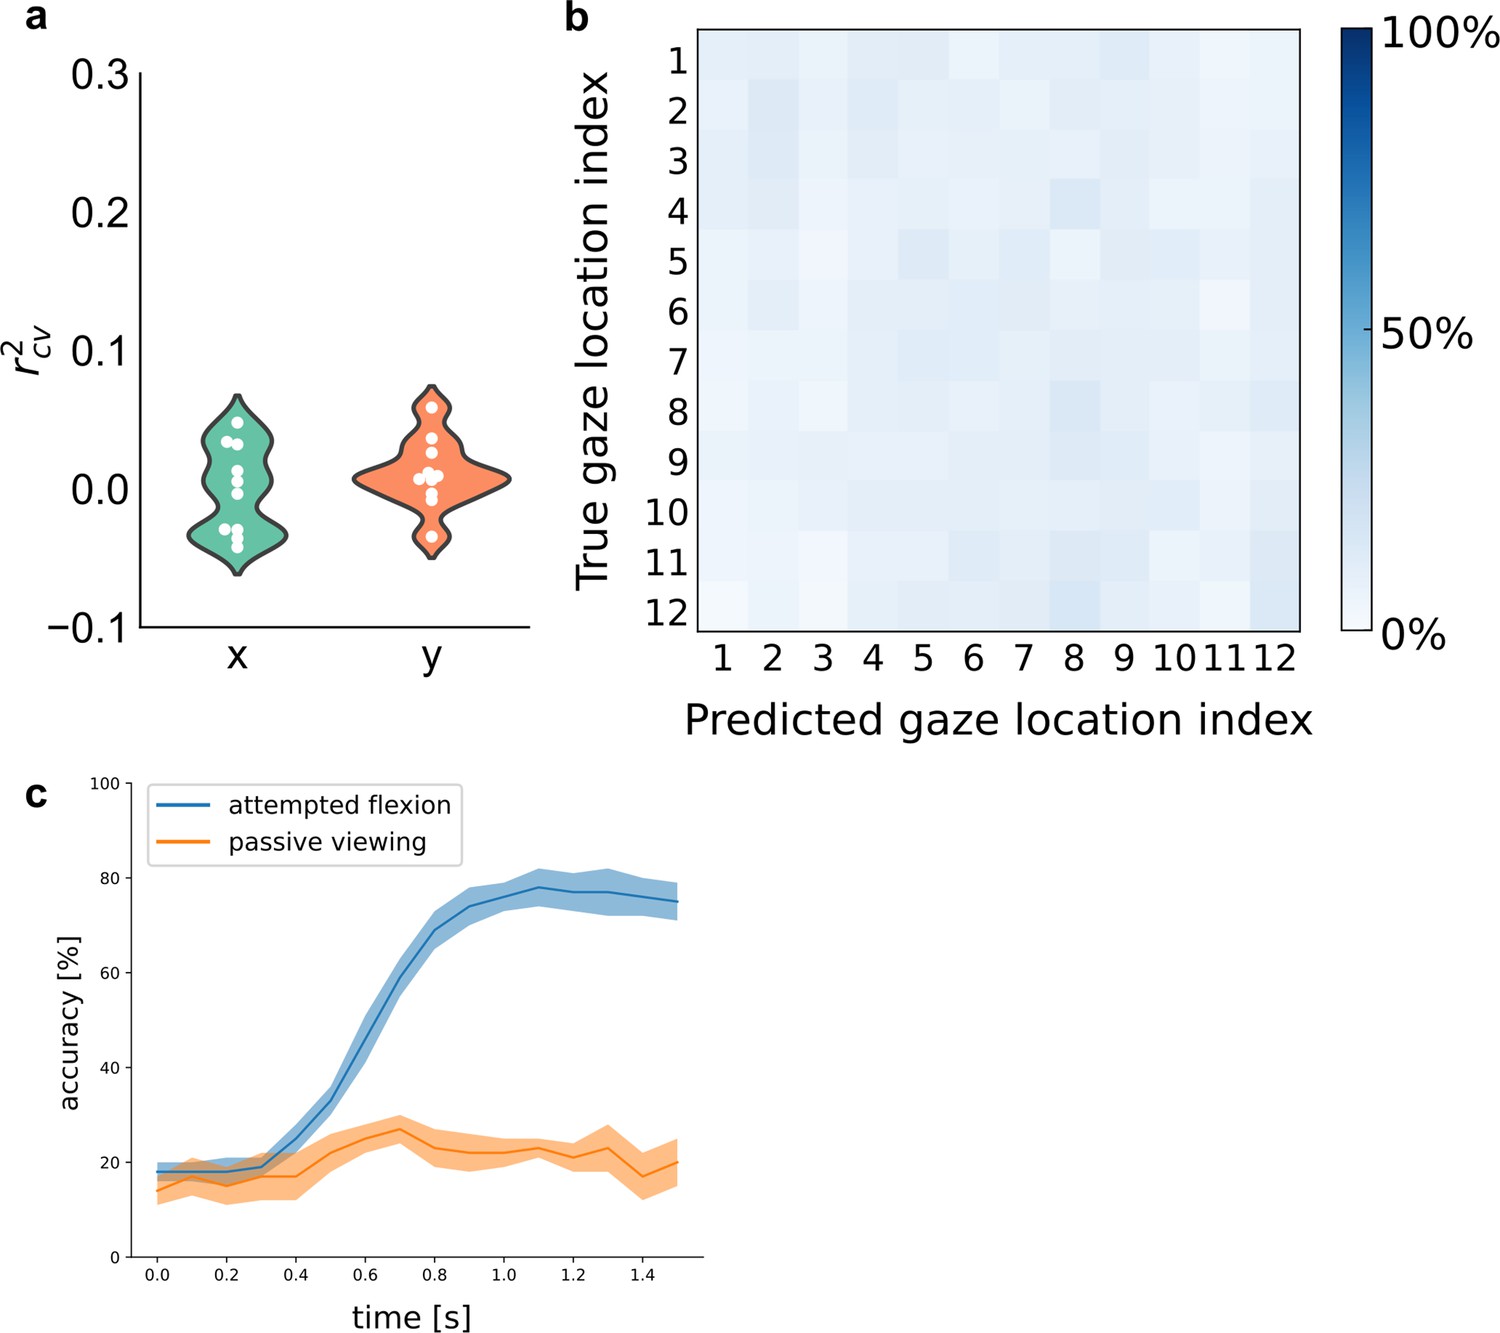
Gaze location did not affect finger decoding during the attempted-movement period.
(a) Linear regression could not decode target location [x, y] coordinates from the neural activity during the attempted-movement period. Violin plot shows that cross-validated regression r2 values are close to 0 across sessions, with each circle marking a single session. (b) A linear classifier (diagonal linear discriminant analysis [LDA]) could not classify the gaze location from neural activity during the attempted-movement period. Confusion matrix depicts cross-validated classifications of cue location. (c) Cross-validated classification accuracy for main and control tasks: a linear classifier (diagonal LDA) could not classify finger movements from neural activity during passive observation (orange) of the finger press task. Sliding bin width: 200 ms. The shaded region indicates ± standard error of the mean (SEM) (six sessions passive viewing, 10 sessions attempted flexion).
Figure 2 with 5 supplements
Representational structure during brain–computer interface (BCI) finger control matches the structure of able-bodied individuals.
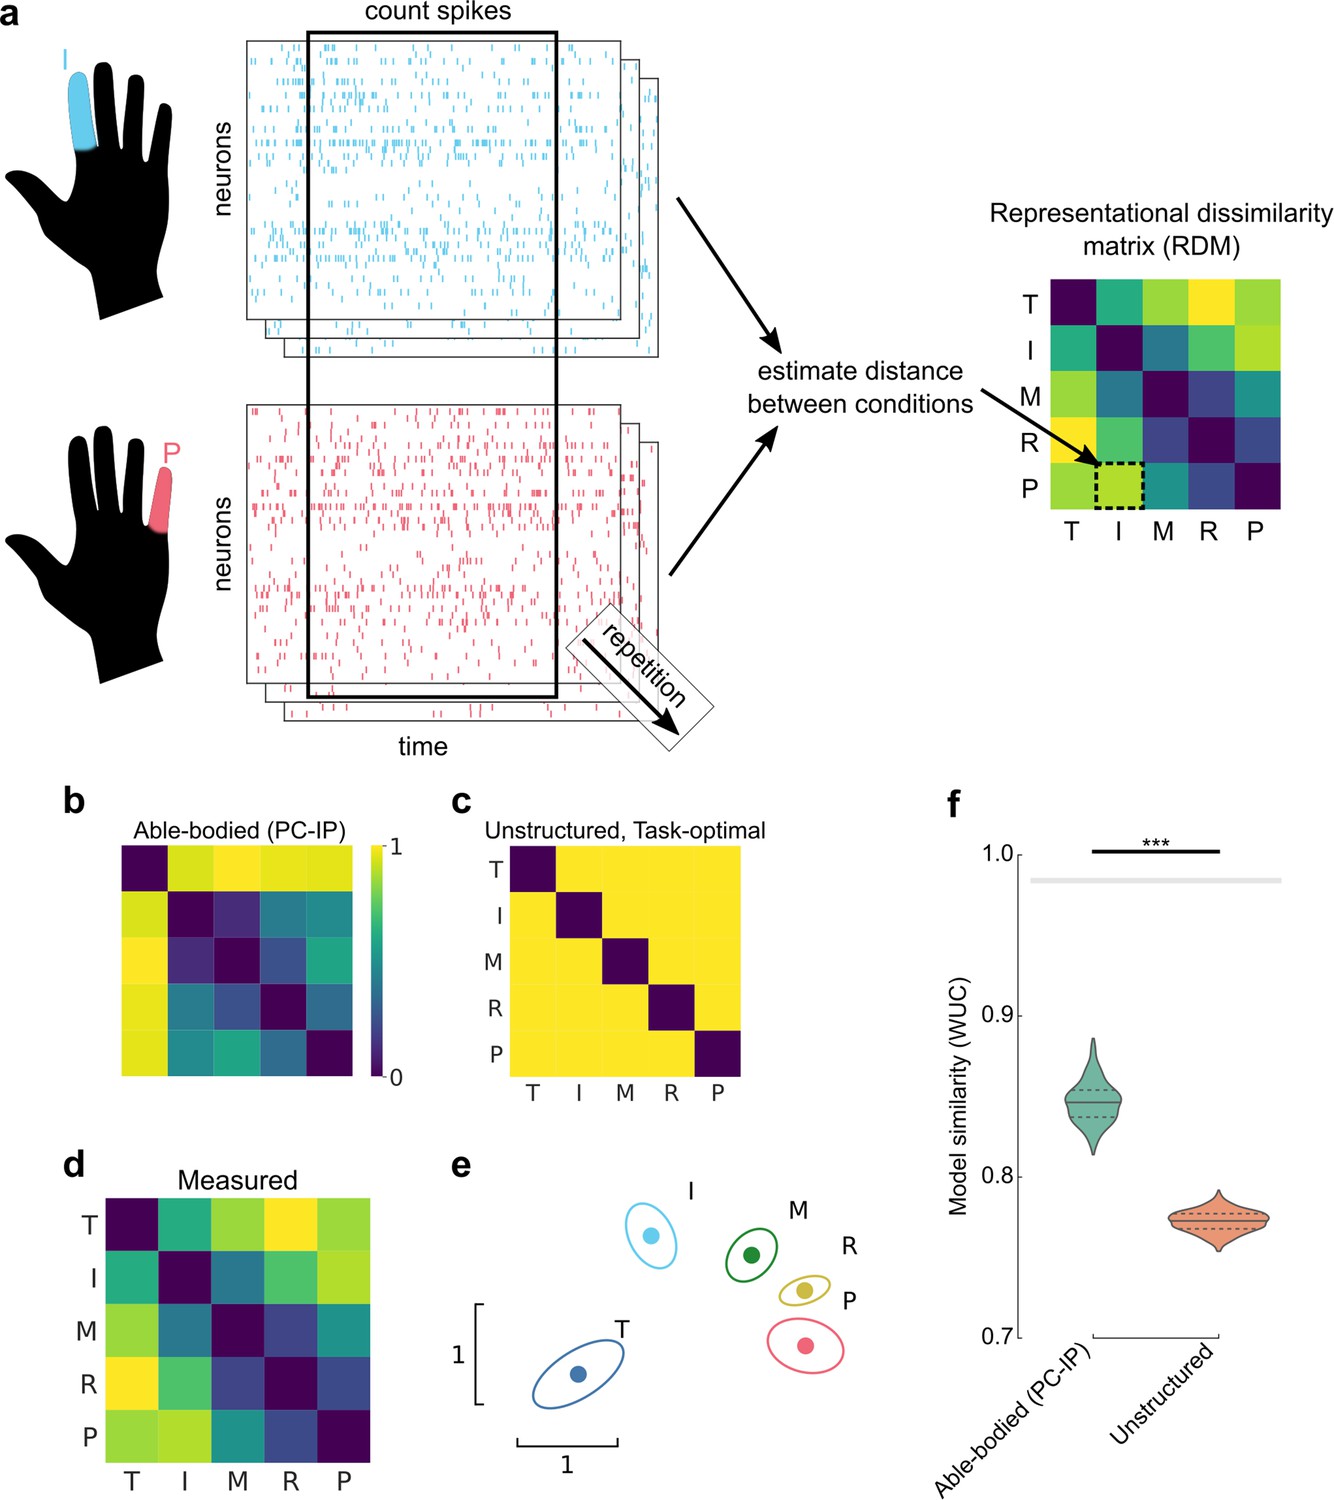
(a) To calculate the representational dissimilarity matrix (RDM), a vector of firing rates was constructed for each trial. Repetitions were collected for each condition. Then, pairwise distances were estimated between conditions using a cross-validated dissimilarity metric. This process was repeated to generate an RDM for each session. We drop the No-Go condition (X) here to match previous finger studies (Ejaz et al., 2015; Kikkert et al., 2016). (b) Representational structure hypothesized by the preserved-representation hypothesis: average RDM for 36 able-bodied individuals performing a finger-press task. RDMs were measured at the junction of the postcentral and intraparietal sulci (PC-IP) using fMRI (Ejaz et al., 2015; Kieliba et al., 2021). Max-scaled to [0, 1]. (c) Representational structure hypothesized by the despecialization and task-optimal hypotheses: pairwise-equidistant RDM. Max-scaled to [0, 1]. (d) Finger representational structure measured in tetraplegic participant NS: cross-validated Mahalanobis distances (Methods) between neural activity patterns, averaged across 10 recording sessions. Max-scaled to [0, 1]. (e) Intuitive visualization of the distances in (d) using multidimensional scaling (MDS). Ellipses show mean ± standard deviation (SD) (10 sessions) after Generalized Procrustes alignment (without scaling) across sessions. (f) Measured RDMs (d) match the able-bodied PC-IP fMRI RDM (b) better than they match the task-optimal, unstructured model (c), as measured by the whitened unbiased cosine similarity (Diedrichsen et al., 2021) (WUC) (Methods). Mean differences were significant (able-bodied vs. unstructured, p = 5.7 × 10⁻⁵; two-tailed t-test, 1000 bootstrap samples over 10 sessions). Violin plot: solid horizontal lines indicate the median WUC over bootstrap samples, and dotted lines indicate the first and third quartiles. Noise ceiling: gray region estimates the best possible model fit (Methods). Asterisks denote a significant difference at ***p < 0.001. For convenience, a similar figure using a correlation-based similarity metric is shown in Figure 2—figure supplement 3.
Figure 2—figure supplement 1

fMRI representational structure for finger movements, from Kieliba et al., 2021.
fMRI representational dissimilarity matrices (RDMs) for three individual subjects and the group mean (N = 29). Intuitive visualization of distances using multidimensional scaling (MDS) and Generalized Procrustes alignment (without scaling); ellipses show mean ± standard deviation (SD) across subjects. Regions of interest (ROIs): motor cortex (MC, top row) and the junction of the postcentral and intraparietal sulci (PC-IP, bottom row).
Figure 2—figure supplement 2
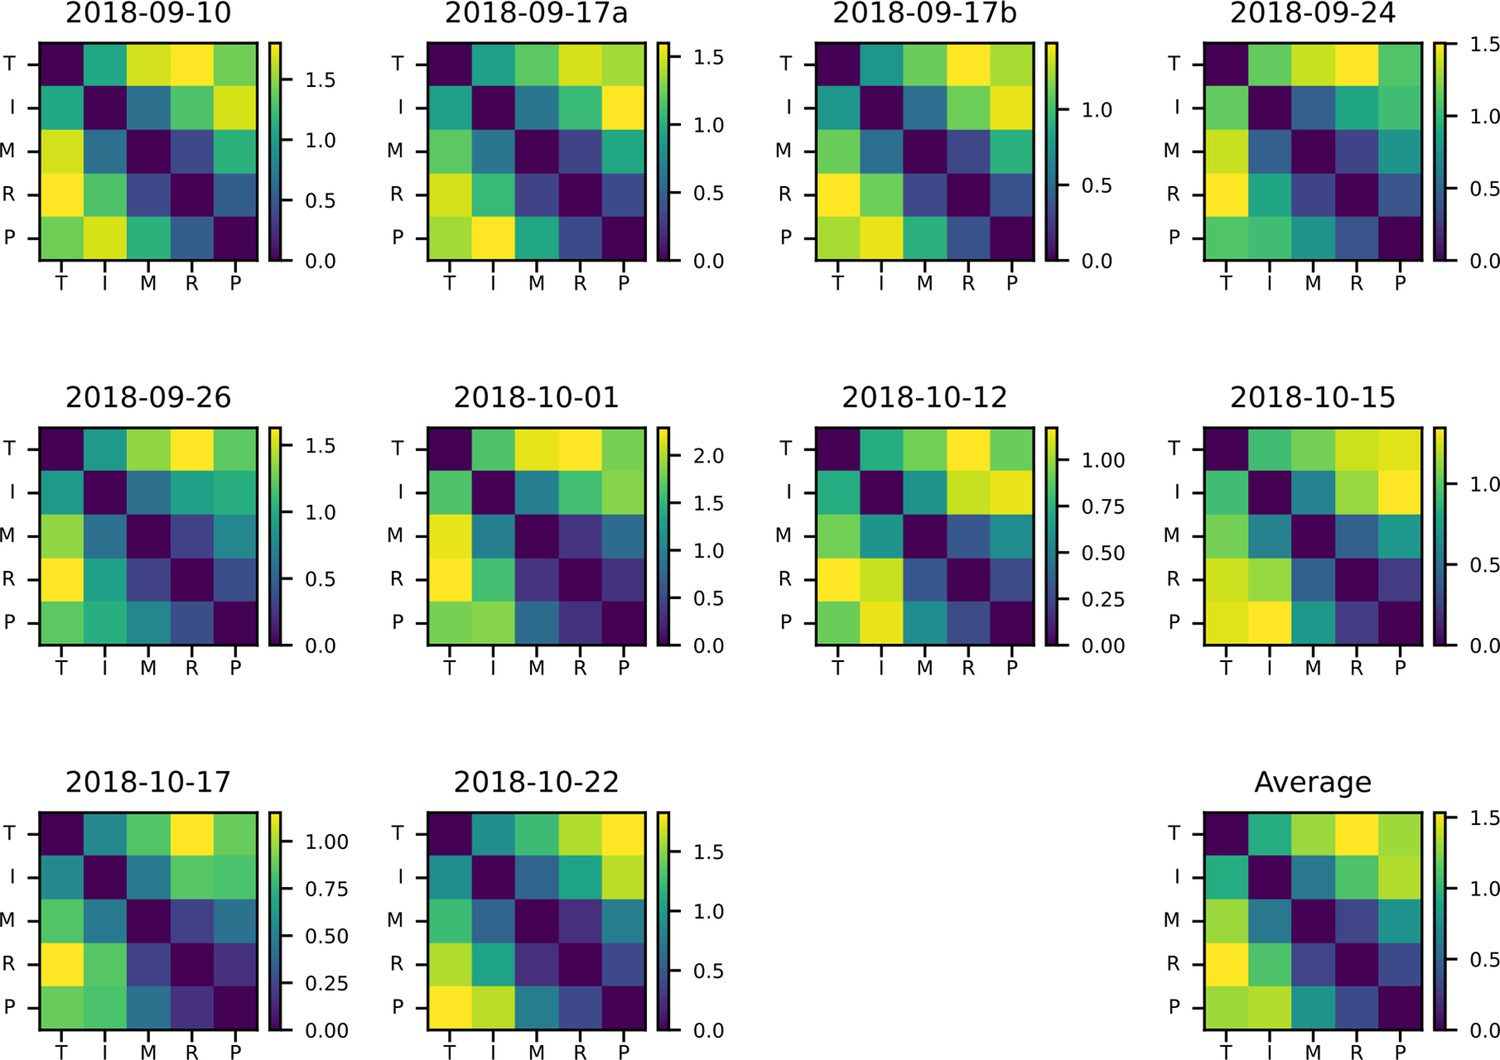
Individual representational dissimilarity matrices (RDMs) for each session.
RDMs across all sessions, using the cross-validated Mahalanobis distance. ‘Average’ RDM matches Figure 2d.
Figure 2—figure supplement 3
Representational structure during brain–computer interface (BCI) finger control matches the structure of able-bodied individuals when using alternative analysis parameters.
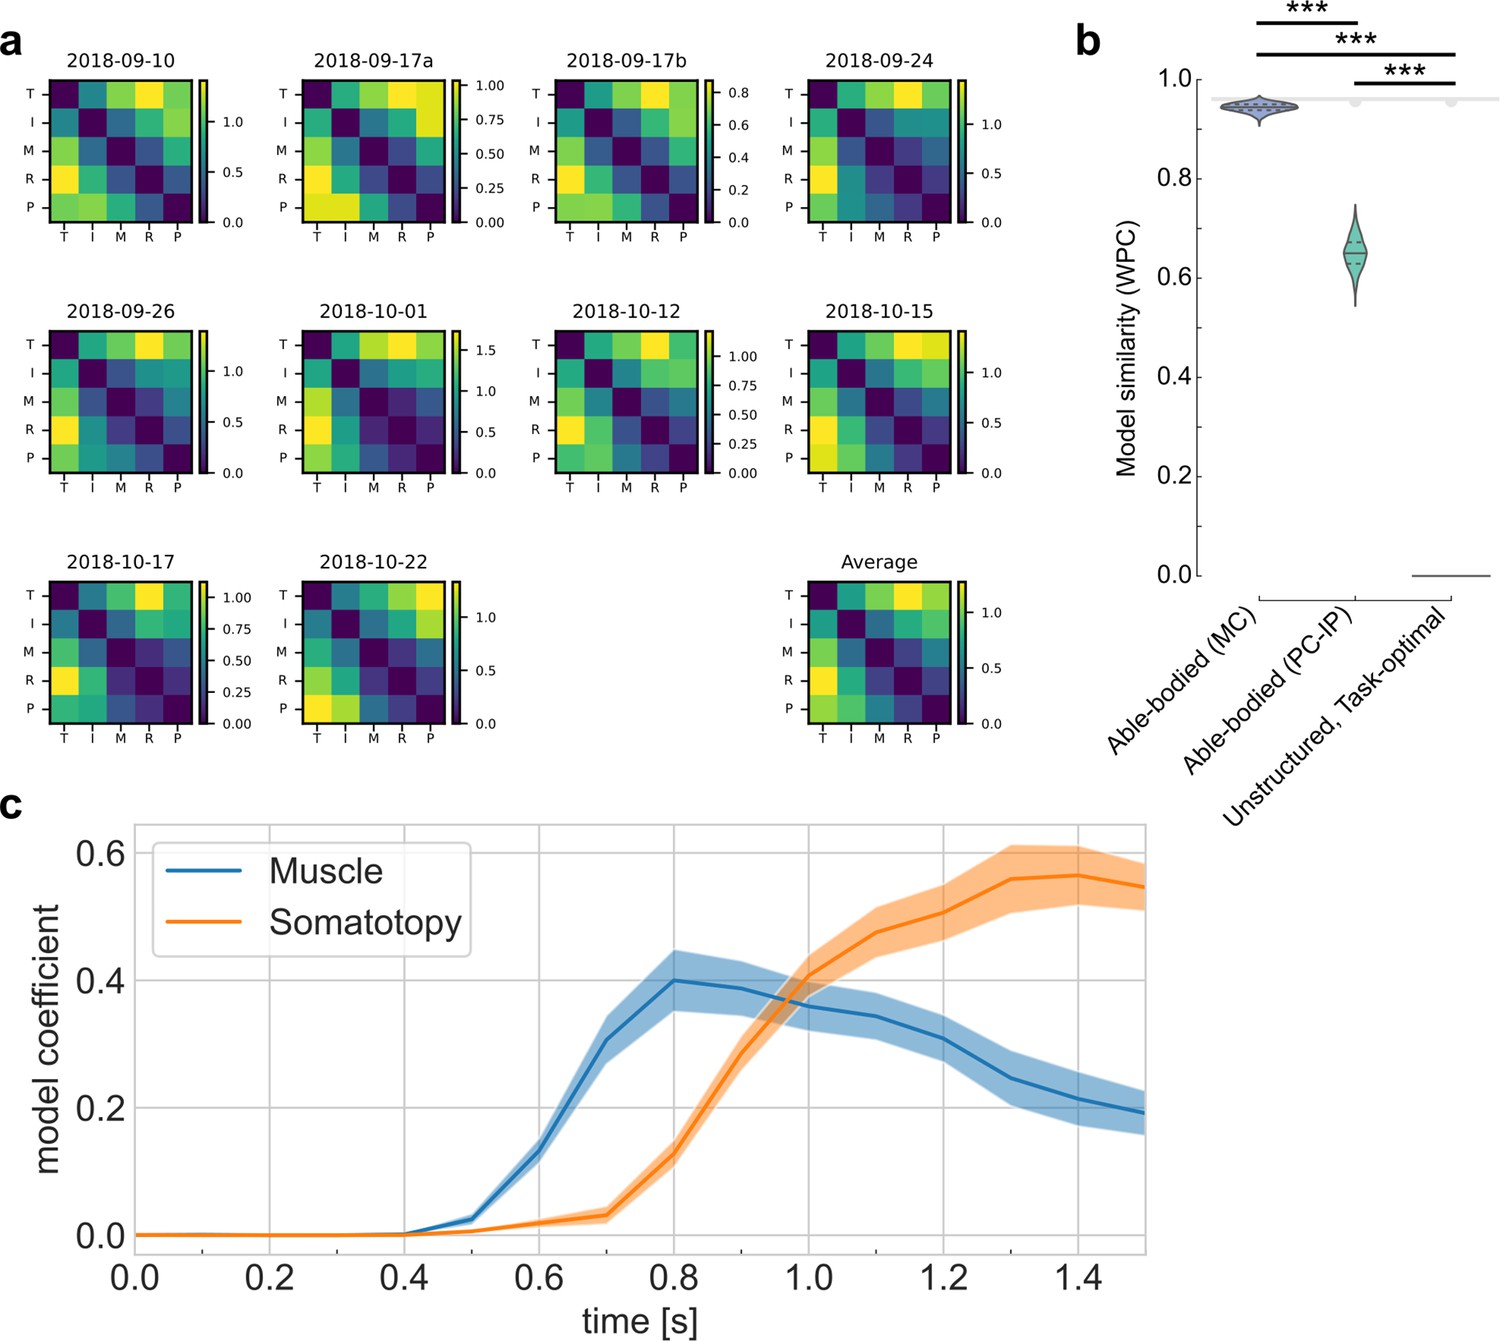
(a) Representational dissimilarity matrices (RDMs) calculated with an alternative dissimilarity metric: cross-validated Poisson KL-divergence (Schütt et al., 2019). Units: nats/neuron. Related to Figure 2—figure supplement 2a and Figure 2d. (b) Fit between measured RDMs and motor-intact BOLD data using alternative metrics. Distance metric: cross-validated Poisson KL-divergence. Similarity metric: whitened RDM Pearson correlation (Diedrichsen et al., 2021). Asterisks denote significant differences at ***p < 0.001.Similar to Figure 2f. (c) Representational dynamics calculated with an alternative dissimilarity metric: cross-validated Poisson KL-divergence. Similar to Figure 4e.
Figure 2—figure supplement 4
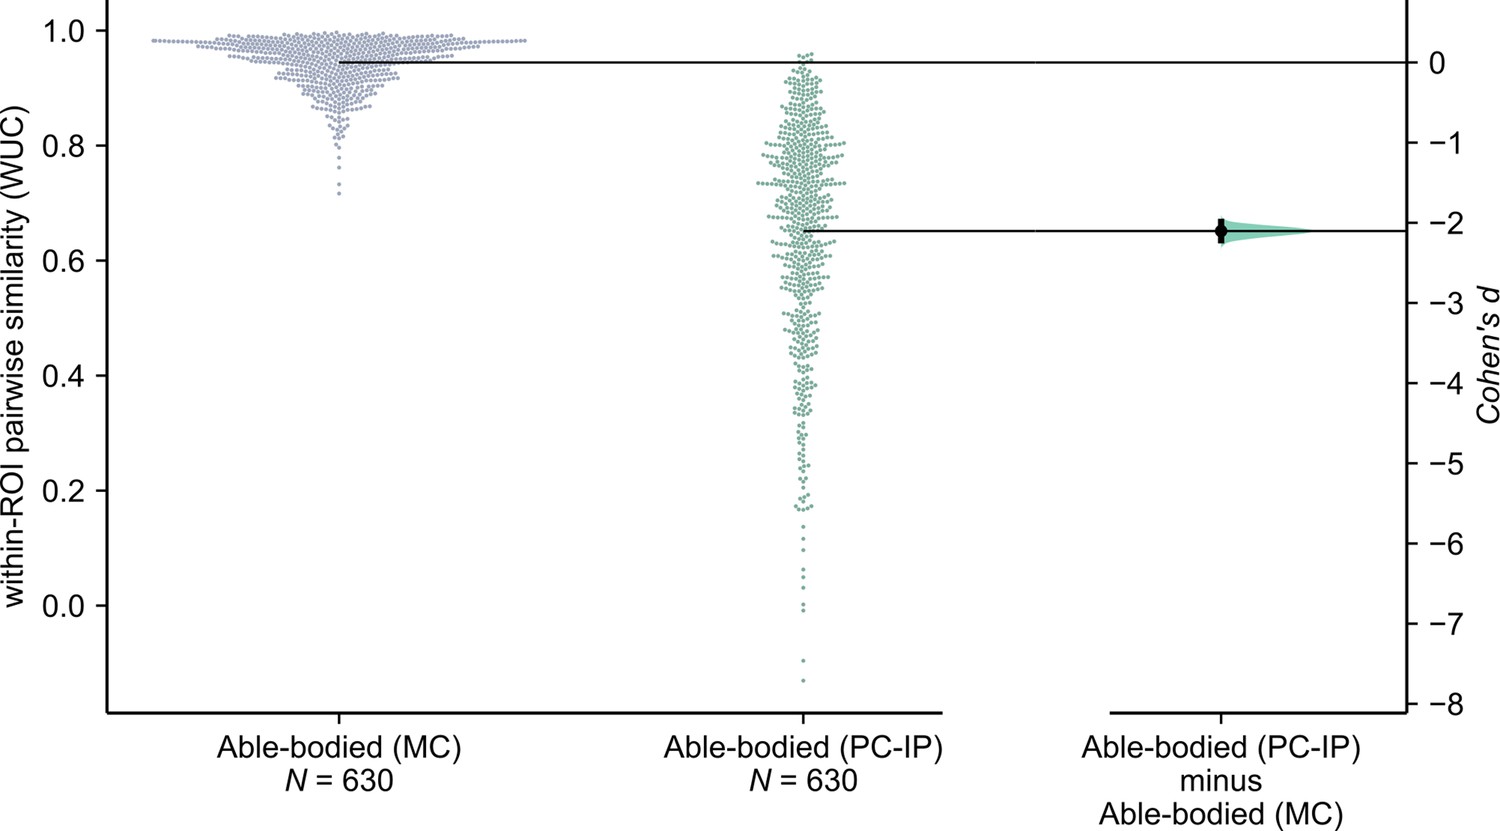
fMRI finger representational dissimilarity matrices (RDMs) are more consistent across able-bodied participants in motor cortex (MC) than in the junction of postcentral and intraparietal sulci (PC-IP).
Gardner—Altman estimation plot (Ho et al., 2019) of the WUC similarity between same-region of interest (ROI) pairs of RDMs (N = 630 pairs between 36 subjects). Each circle on the swarm plot (left) marks the similarity for a pair of subjects. Horizontal black lines mark the mean pairwise similarity within each ROI. The curve (right) indicates the resampled (N = 5000) distribution of the effect size between ROIs, as measured by Cohen’s d. Cohen’s d of PC-IP minus MC: −2.1 (95% CI: [−2.22, −1.99]).
Figure 2—figure supplement 5
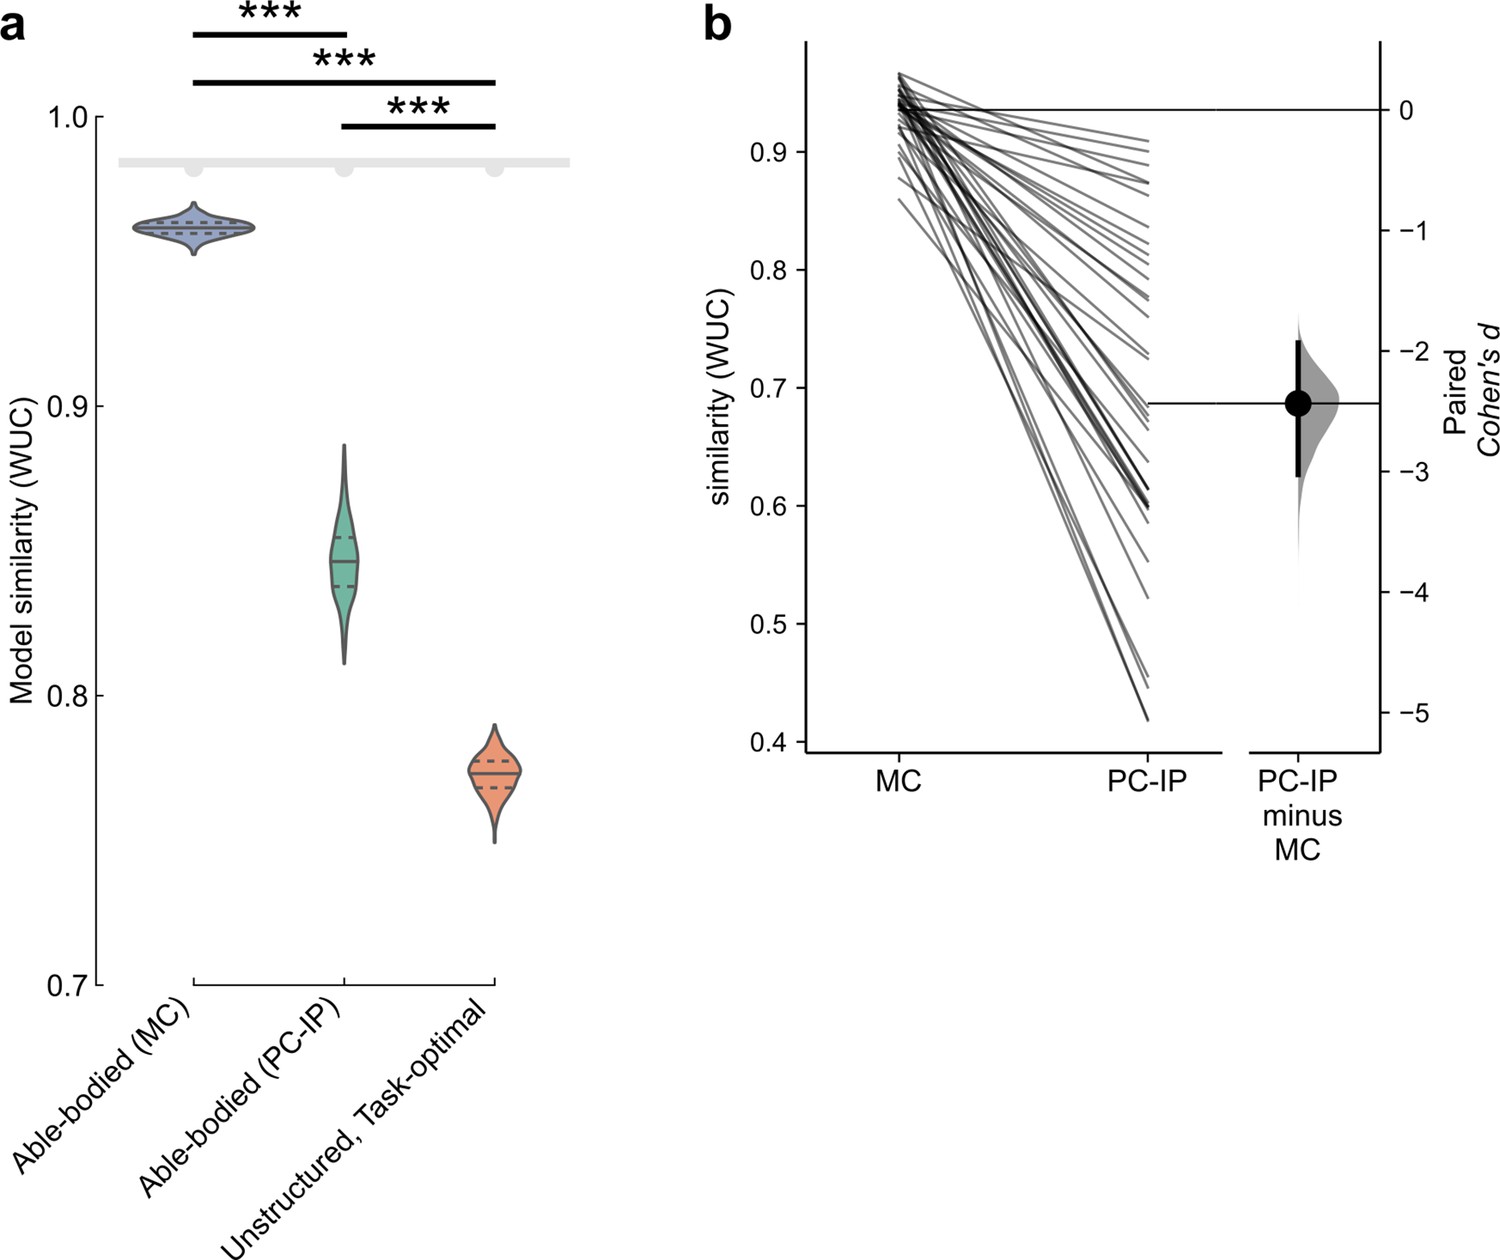
Finger representational structure of the tetraplegic individual, measured at the junction of the postcentral and intraparietal sulci (PC-IP), matches fMRI representational dissimilarity matrices (RDMs) from motor cortex (MC) even better than fMRI RDMs from PC-IP.
(a) Measured RDMs match the able-bodied MC fMRI RDM better than they match the able-bodied PC-IP fMRI RDM (p = 1.9 × 10⁻⁶; two-tailed t-test, 1000 bootstrap samples over 10 sessions), as measured by the whitened unbiased cosine similarity (Diedrichsen et al., 2021) (WUC) (Methods). Violin plot: solid horizontal lines indicate the median WUC over bootstrap samples, and dotted lines indicate the first and third quartiles. Noise ceiling: gray region estimates the best possible model fit (Methods). Asterisks denote significant differences at ***p < 0.001. Similar to Figure 2f. (b) Paired Gardner–Altman estimation plot (Ho et al., 2019) of the similarity (WUC) between participant NS (average RDM across sessions) and individual MC and PC-IP RDMs from able-bodied fMRI participants. The slopegraph’s connected points (left) show each fMRI participant’s (N = 36) MC and PC-IP similarities with participant NS’s mean finger RDM. Mean difference between PC-IP and MC similarities (right) presented as Cohen’s d (N = 5000 bootstrap samples).
Figure 3 with 1 supplement
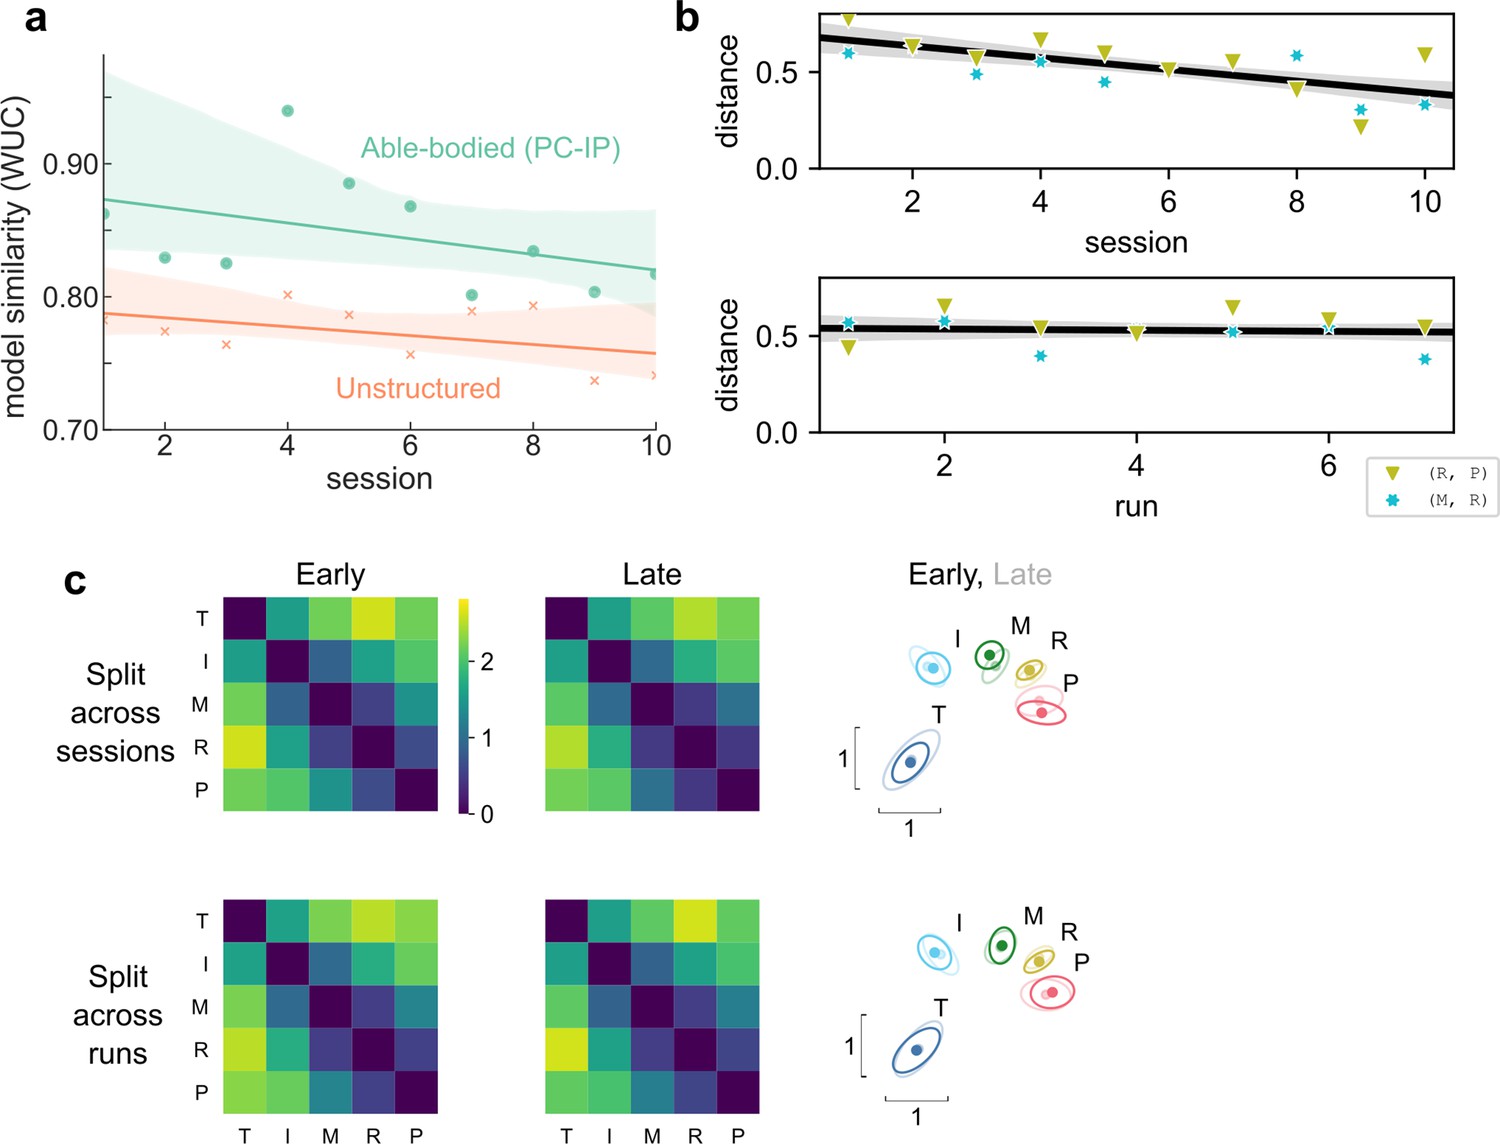
Hand representation changed minimally after weeks of brain–computer interface (BCI) control.
(a) Slope comparison shows that the model fit did not trend toward the unstructured model over sessions (p = 0.32). (b) The distance between high-error finger pairs (middle-ring and ring-pinky) did not increase across sessions or runs (within sessions), as shown by partial regression plots. Distance metric: cross-validated Mahalanobis, averaged across runs (for the session plot) or averaged across sessions (for the run plot). The black line indicates linear regression. The gray shaded region indicates a 95% confidence interval. Each run consisted of 8 presses per finger. (c) Minimal change in representational structure between early and late sessions or between early and late runs. Mean representational dissimilarity matrix (RDM), when grouped by sessions (top row) or individual runs (bottom row). Grouped into early half (left column) or late half (center column). Multidimensional scaling (MDS) visualization (right column) of early (opaque) and late (translucent) representational structures after Generalized Procrustes alignment (without scaling, to allow distance comparisons).
Figure 3—figure supplement 1
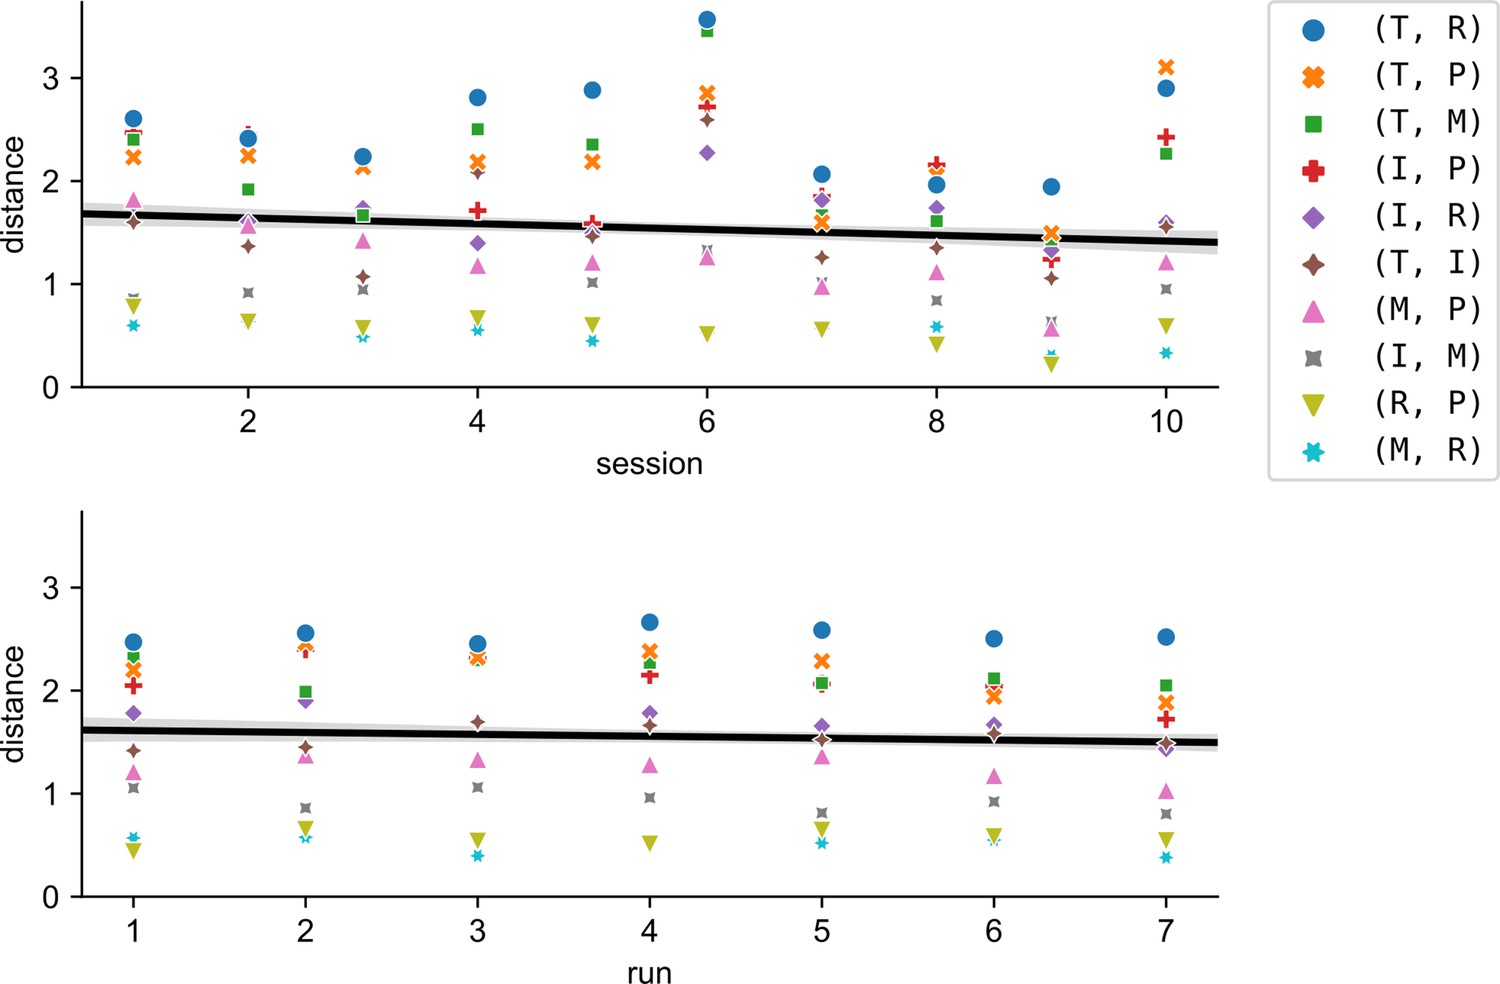
Inter-finger distances did not increase across sessions or within sessions.
Brain–computer interface (BCI) classification errors could have encouraged inter-finger distances to increase to improve separability, but this did not occur. Inter-finger distances instead decreased slightly (across sessions: t(8) = −4.0, two tailed t-test p = 0.004; across runs within sessions: t(82) = −2.4, two-tailed t-test p = 0.019), although the effect size was very small (across sessions: Cohen’s = 0.008; across runs within sessions: =0.005). Markers indicate average pairwise distance for each finger pair and session (top) or run-within-session (bottom).
Figure 4 with 4 supplements
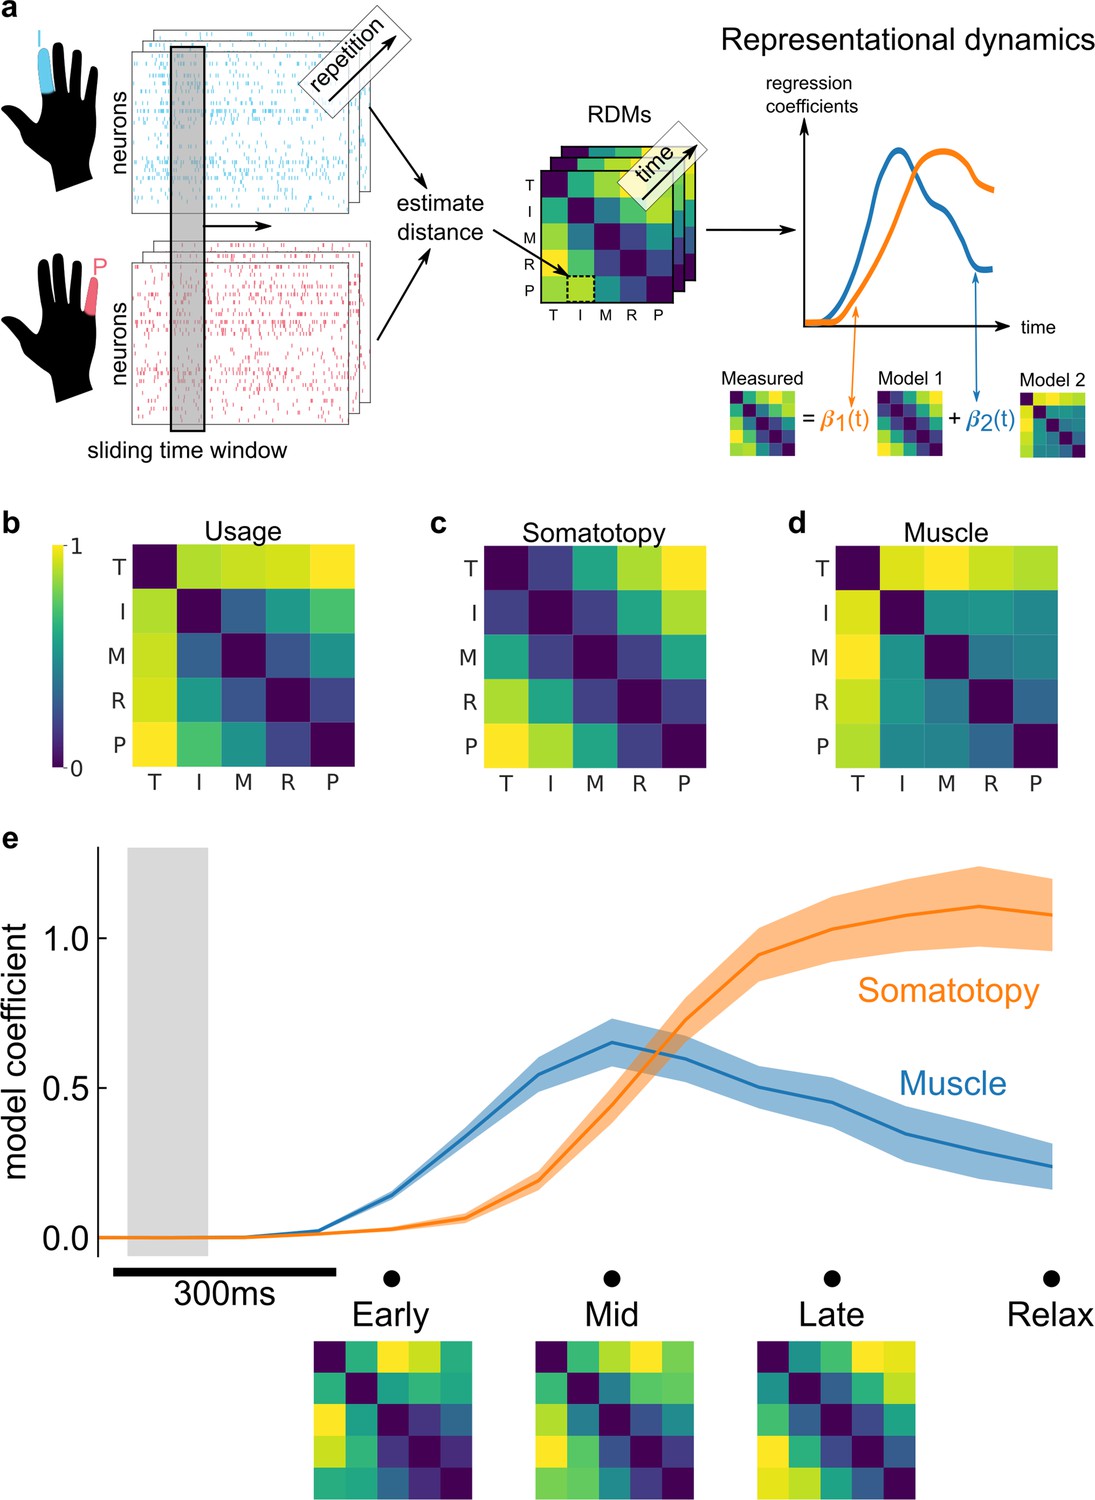
Representational dynamics analysis (RDA) dissociates neural processes over time.
(a) RDA performs representational similarity analysis (RSA) in a sliding window across time. Here, we model the measured representational structure as a non-negative linear combination of component model representational dissimilarity matrices (RDMs). (b–d) Hypothesized explanatory component RDMs: usage, muscle, and somatotopy (Ejaz et al., 2015). Max-scaled to [0, 1]. (e) RDA of the measured RDM over time shows an early fit to the muscle model and a late fit to the somatotopy model. Confidence intervals indicate ± standard error of the mean (SEM) bootstrapped across 10 sessions. Gray shaded region indicates the approximate onset time of the saccade to cue (interquartile range across trials). Difference in model start time (170 ms, Methods) was significant (p = 0.002, two-sided Wilcoxon signed-rank test). RDM snapshots (bottom, each max-scaled to [0, 1]) intuitively visualize the change in representational structure over time from muscle-like to somatotopic.
Figure 4—figure supplement 1
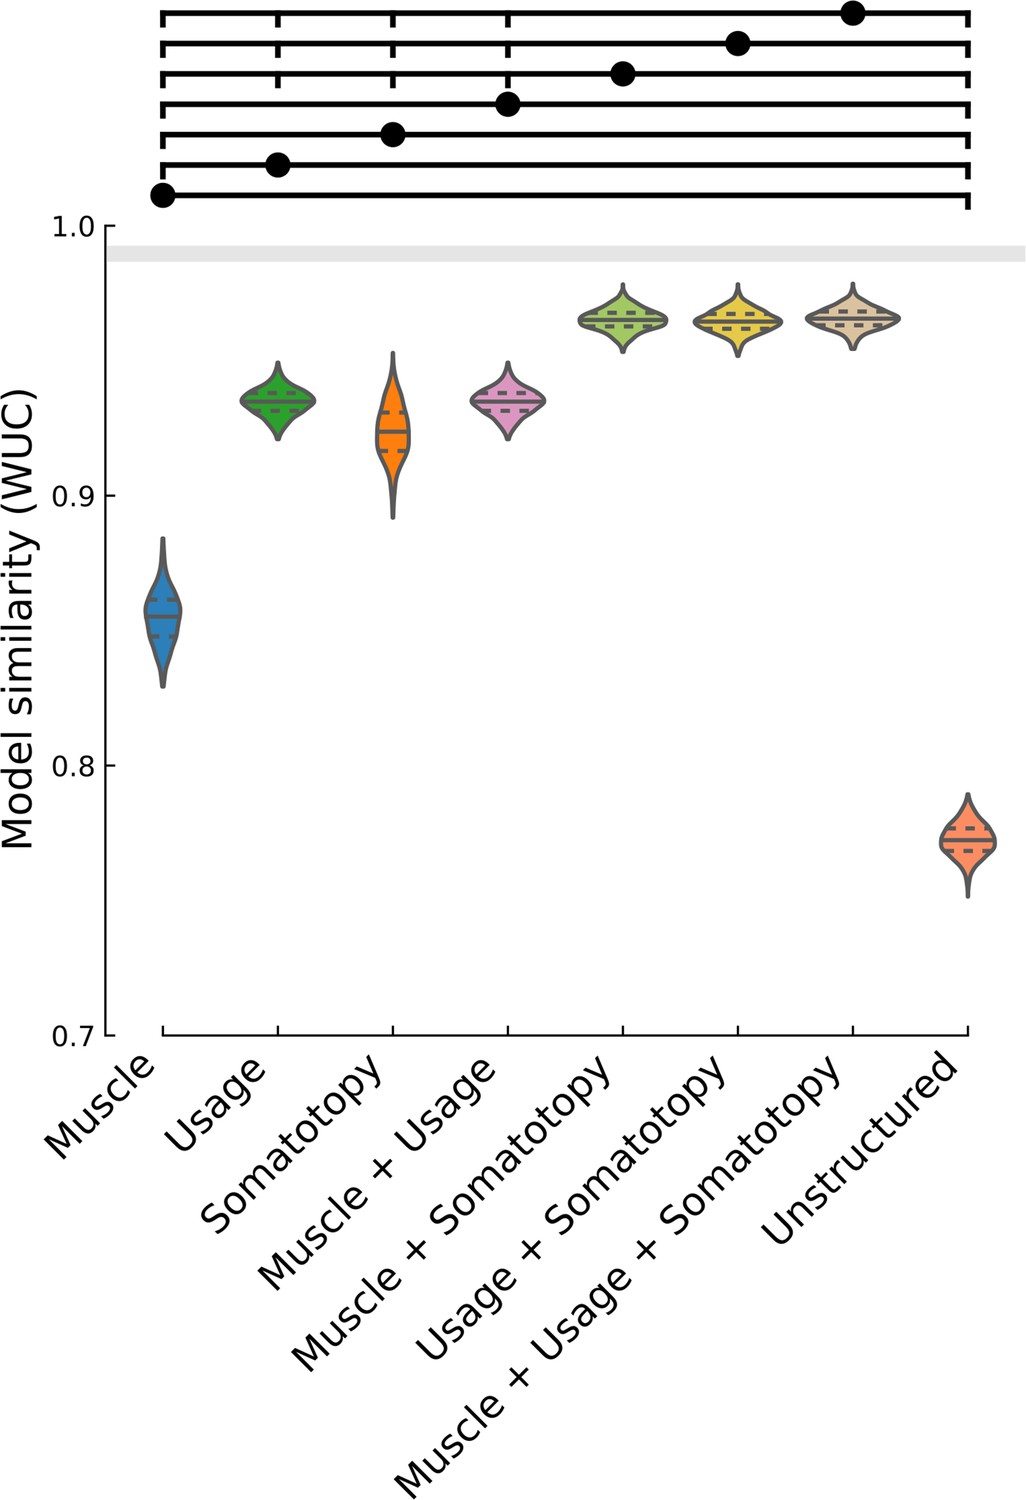
Fit between measured representational dissimilarity matrix (RDM) and linear combinations of models.
Violin plot of WUC similarity between the measured RDM (N = 1000 bootstrap samples over 10 sessions) and the corresponding model combination. Violin plot: solid horizontal lines indicate the mean WUC over bootstrap samples, and dotted lines indicate the first and third quartiles. Horizontal lines (above) indicate significance groups, where the circle-indicated model is significant over the vertical-tick-indicated models (two-tailed t-test, q < 0.01, FDR-corrected for 28 model-pair comparisons). For example, the muscle + somatotopy combined model is significant over the individual muscle, hand usage, somatotopy, combined muscle + hand usage, and pairwise-equidistant/unstructured (null) models.
Figure 4—figure supplement 2
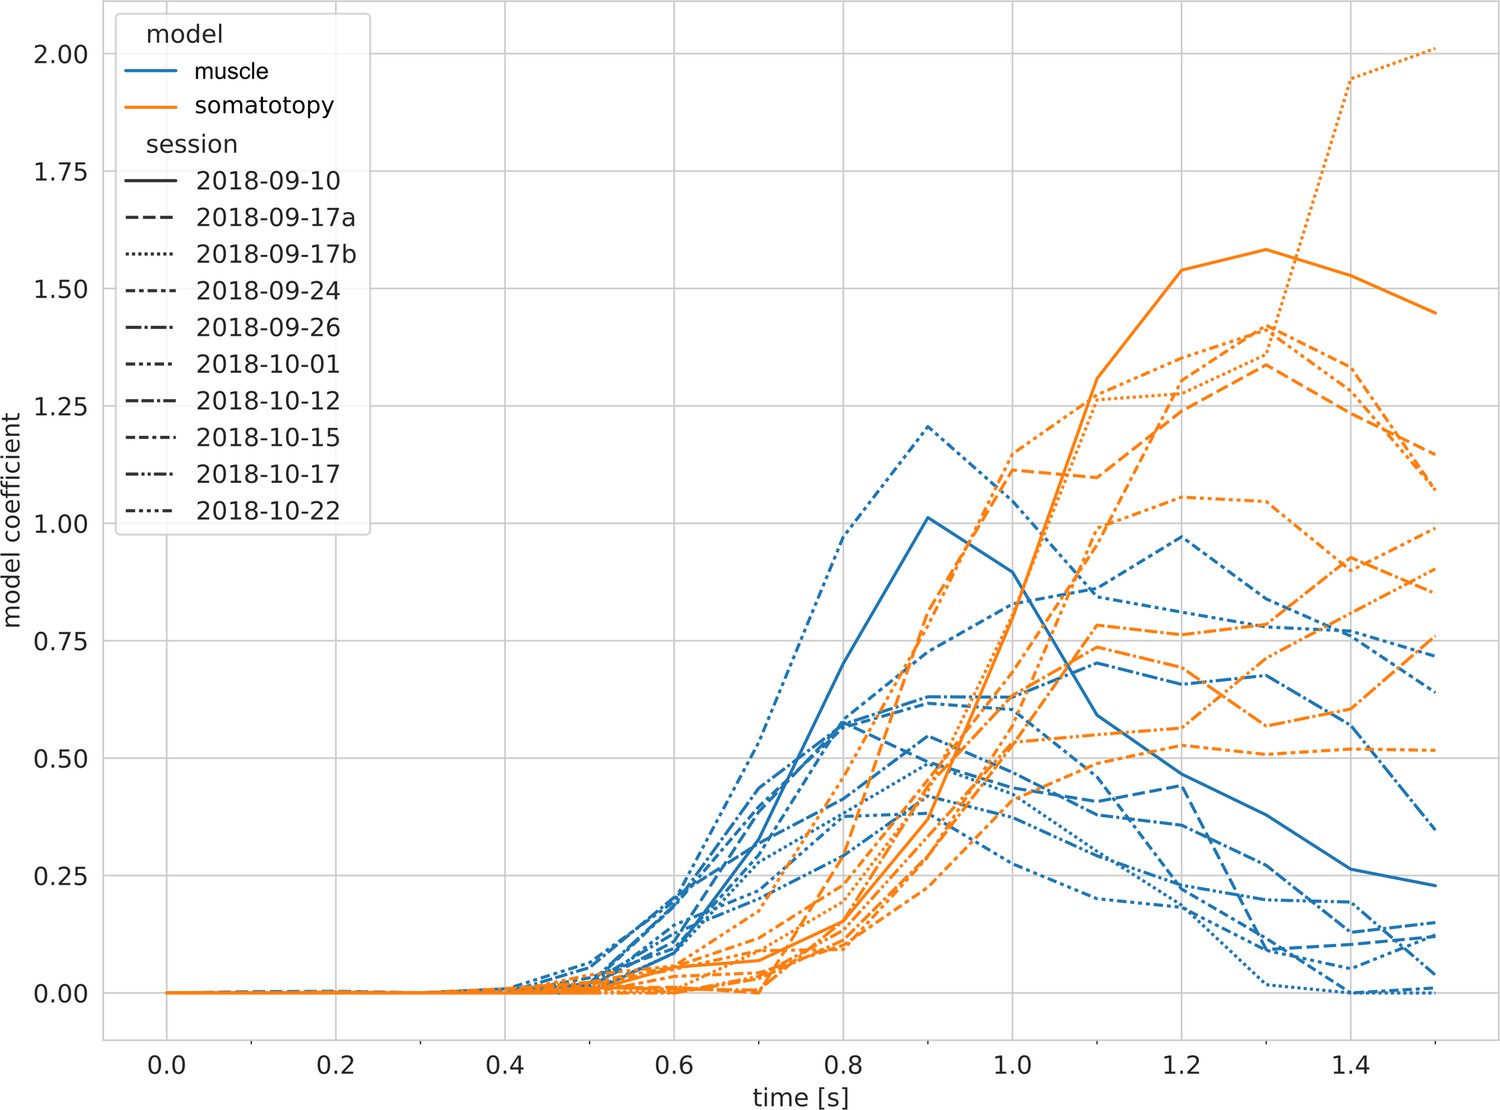
Temporal delays between component models are consistent across single sessions.
When linear modeling within single sessions, the muscle model (blue) consistently preceded the somatotopy model (orange). Time difference: 170 ± 66 ms (SD across sessions) (p = 0.002, two-sided Wilcoxon signed-rank test). Line styles indicate session. Related to Figure 4e.
Figure 4—figure supplement 3
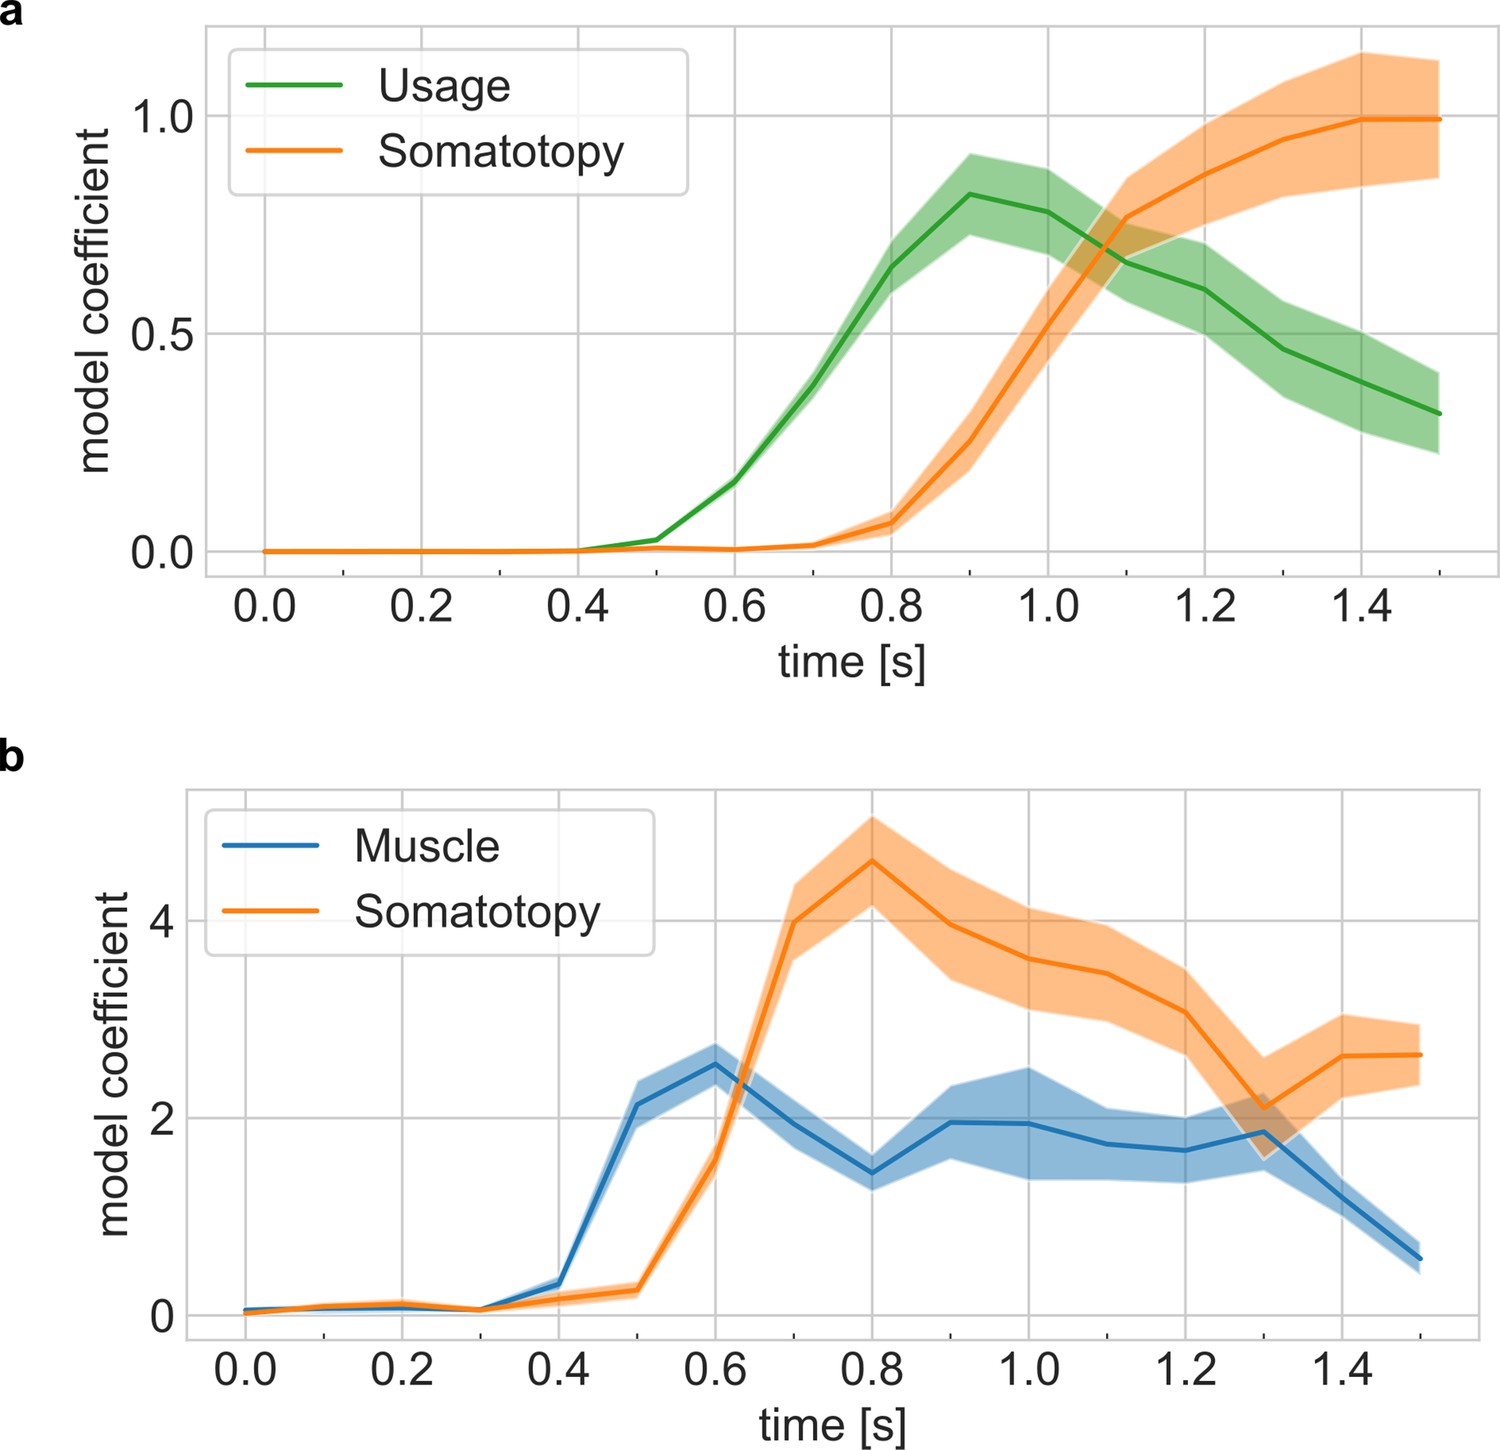
Representational dynamics are robust across tasks and model combination choices.
(a) Representational dynamics analysis shows an early fit to the hand-usage model and a late fit to the somatotopy model. Confidence intervals indicate ± standard error of the mean (SEM) across sessions. Related to Figure 4e. (b) Representational dynamics analysis shows a consistent delay between models during the calibration task. Note: The absolute timing differs from the main task because the calibration task does not require an initial saccade to read the cue. Related to Figure 4e.
Figure 4—figure supplement 4
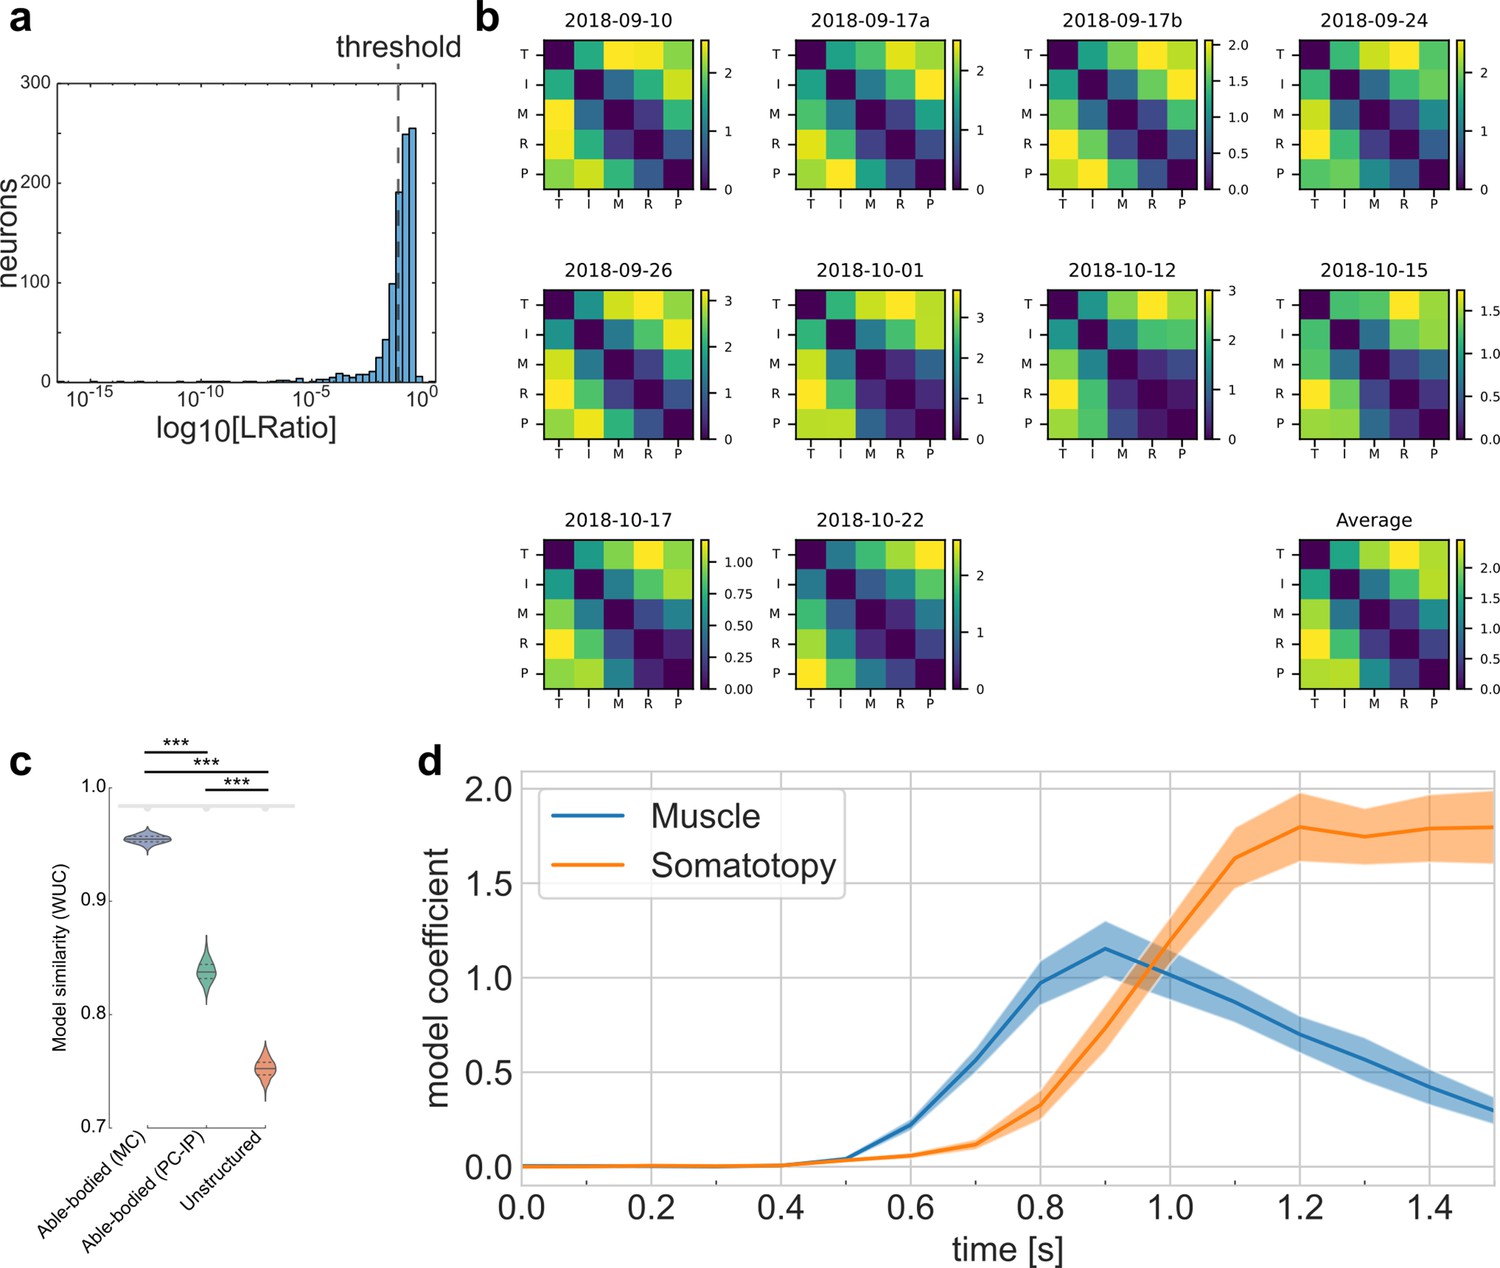
Well-isolated single neurons of the tetraplegic participant match the finger representational structure of able-bodied individuals.
(a) Histogram of L-ratio, a spike-sorting cluster metric. Threshold for well-isolated units: 33% quantile (Lratio < 10−1.1). (b) Representational dissimilarity matrices (RDMs) calculated only using well-isolated units, using the cross-validated Mahalanobis distance. Similar to Figure 2d and Figure 2—figure supplement 2a. (c) Whitened unbiased similarity (WUC) between measured (b) RDMs (using only well-isolated units) and model predictions (Figure 2b, c), showing that the measured RDMs match the able-bodied fMRI RDM significantly better than they match the unstructured model (p = 3.1 × 10⁻¹⁰, two-tailed t-test) and the SPLa fMRI RDM (p = 1.7 × 10⁻⁸). Error bars indicate ± standard error of the mean (SEM). Noise ceiling: gray region estimates the best possible model fit (Methods). Gray downward-semicircle indicates that the noise ceiling is significantly higher (p < 0.001) than the fit of the SPLa fMRI RDM and the unstructured model. Asterisks denote significant differences at ***p < 0.001. Similar to Figure 2f. (d) Representational dynamics analysis, repeated using only well-isolated units, shows an early fit to the muscle model and a late fit to the somatotopy model. Confidence intervals indicate ± SEM across sessions. Similar to Figure 4e.
Videos
Video 1
Example brain–computer interface (BCI) control of a virtual reality hand.
Using a BCI, participant NS controls the individual fingers of a virtual reality hand. She views a virtual hand, table, and cues through an Oculus headset. Similar to the main finger movement task, she acquires green jewels by pressing the corresponding finger and avoids red amethysts by resting. Green jewels disappear when the correct finger is classified (or at the start of the next trial, if incorrectly classified). The screen copies the view that participant NS sees through the Oculus headset.
Additional files
Download links
A two-part list of links to download the article, or parts of the article, in various formats.
Downloads (link to download the article as PDF)
Open citations (links to open the citations from this article in various online reference manager services)
Cite this article (links to download the citations from this article in formats compatible with various reference manager tools)
Stability of motor representations after paralysis
eLife 11:e74478.
https://doi.org/10.7554/eLife.74478


