SARS-CoV-2 host-shutoff impacts innate NK cell functions, but antibody-dependent NK activity is strongly activated through non-spike antibodies
- Division of Infection and Immunity, School of Medicine, Cardiff University, United Kingdom
- Cambridge Institute for Therapeutic Immunology & Infectious Disease, Jeffrey Cheah Biomedical Centre, Cambridge Biomedical Campus, University of Cambridge, United Kingdom
- Department of Infectious Diseases, School of Immunology & Microbial Sciences, King's College London, United Kingdom
- Department of Infectious Diseases, Guy’s and St Thomas’ NHS Foundation Trust, United Kingdom
- MRC - University of Glasgow Centre for Virus Research, United Kingdom
Figures
Figure 1 with 3 supplements
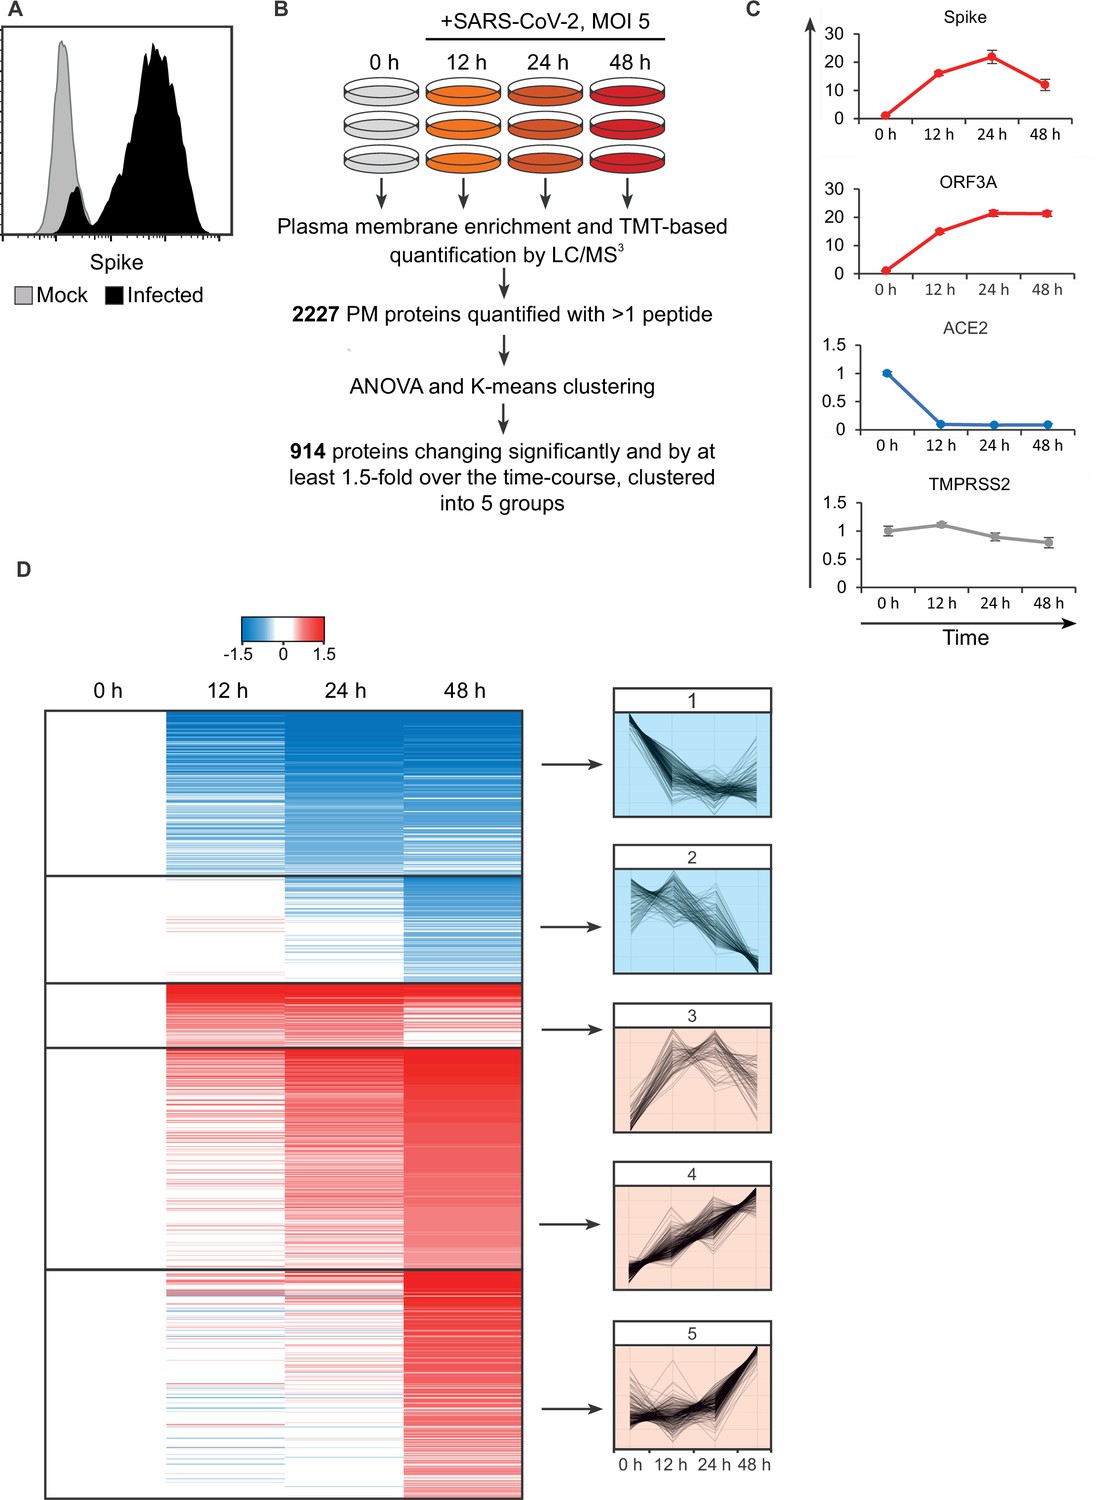
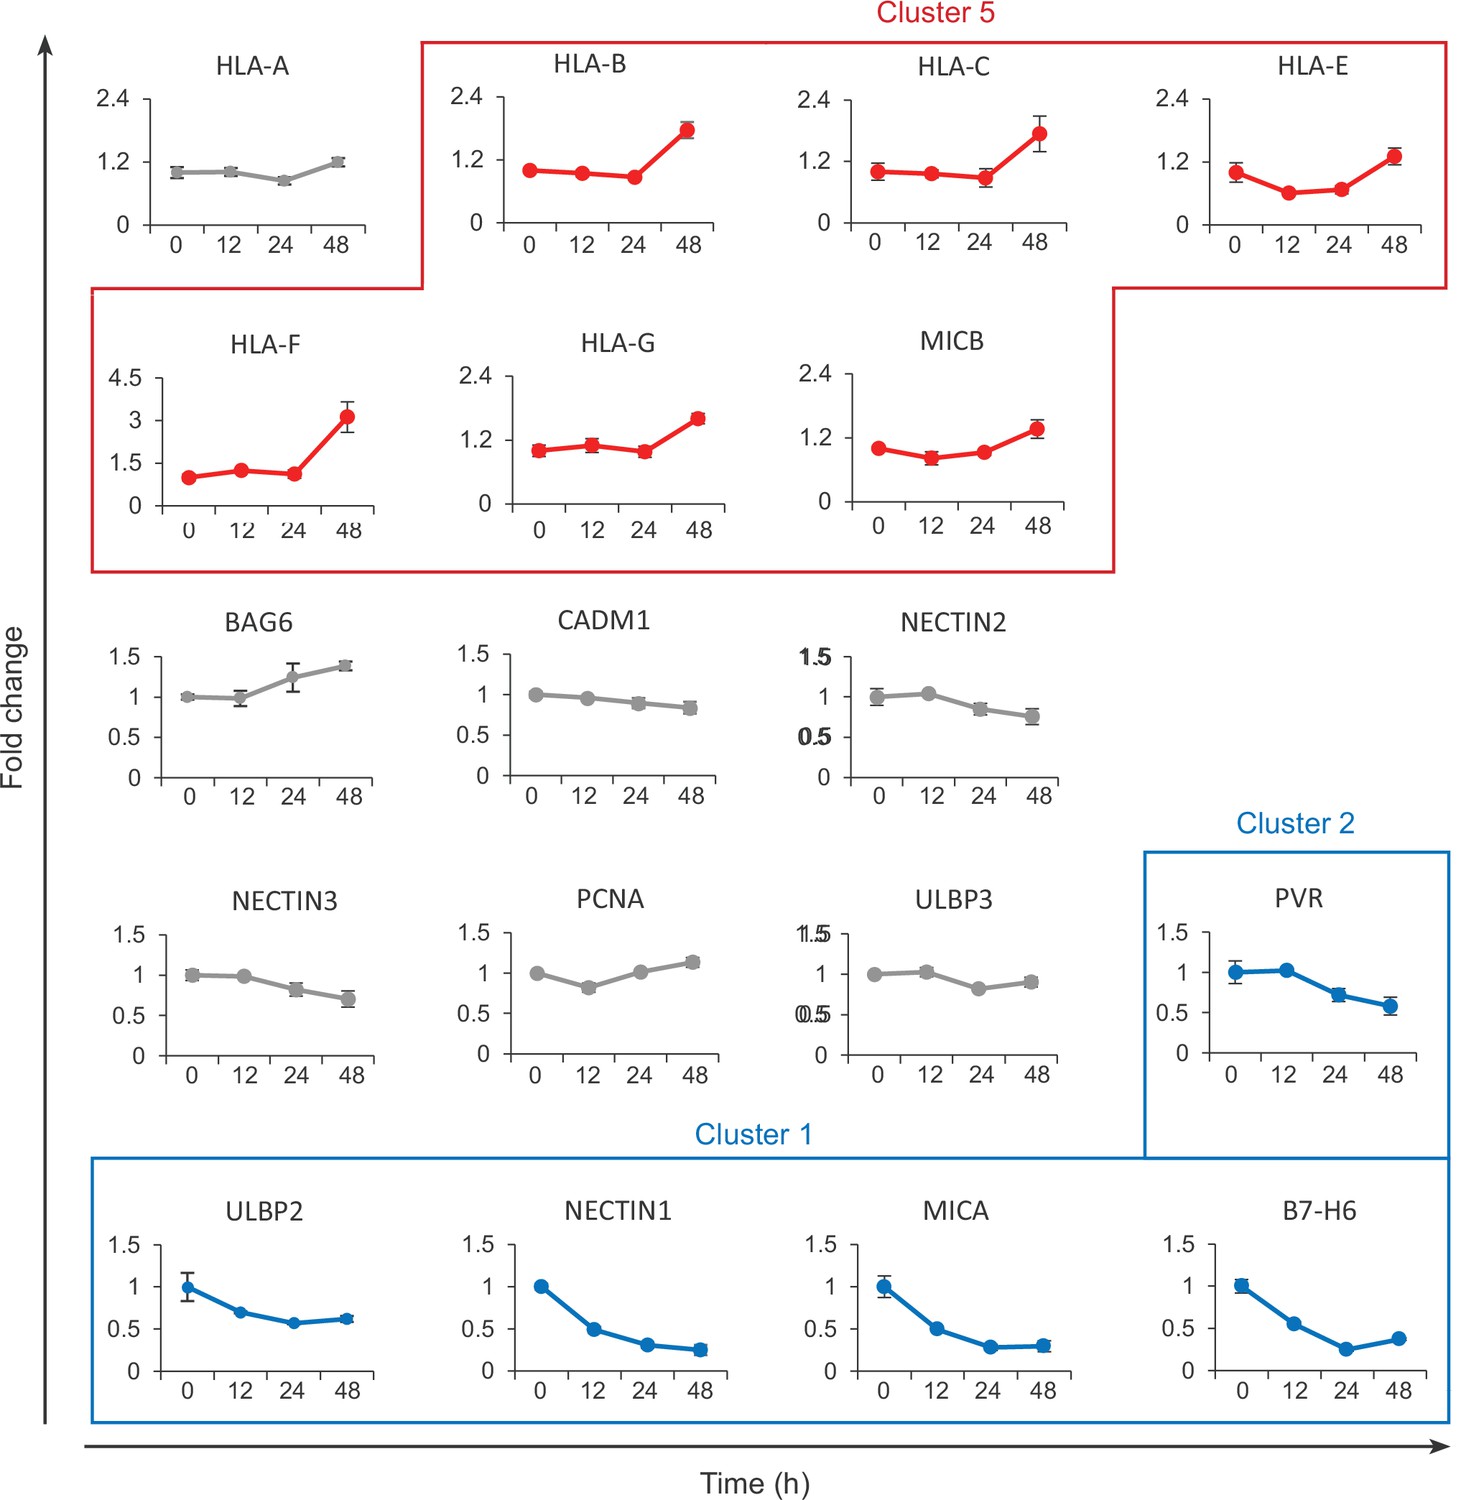
SARS-CoV-2 remodels the plasma membrane proteome.
(A) AAT cells were infected with SARS-CoV-2 in biological triplicate (MOI = 5). Twenty-four hr later, they were detached with trypsin, fixed and permeabilised, stained for Spike protein, and analysed by flow cytometry. (B) Schematic of plasma membrane profiling and analysis pathway. (C). Examples of temporal profiles of viral and cellular genes, fold change is compared to 0 hr timepoint. Data points show mean ± SD. (D). Left – heat map of the 914 significantly changing proteins clustered by k-mean, colour indicates log2 fold change compared to 0 hr, right, Z-score normalised temporal profiles of proteins within each cluster.
Figure 1—figure supplement 1
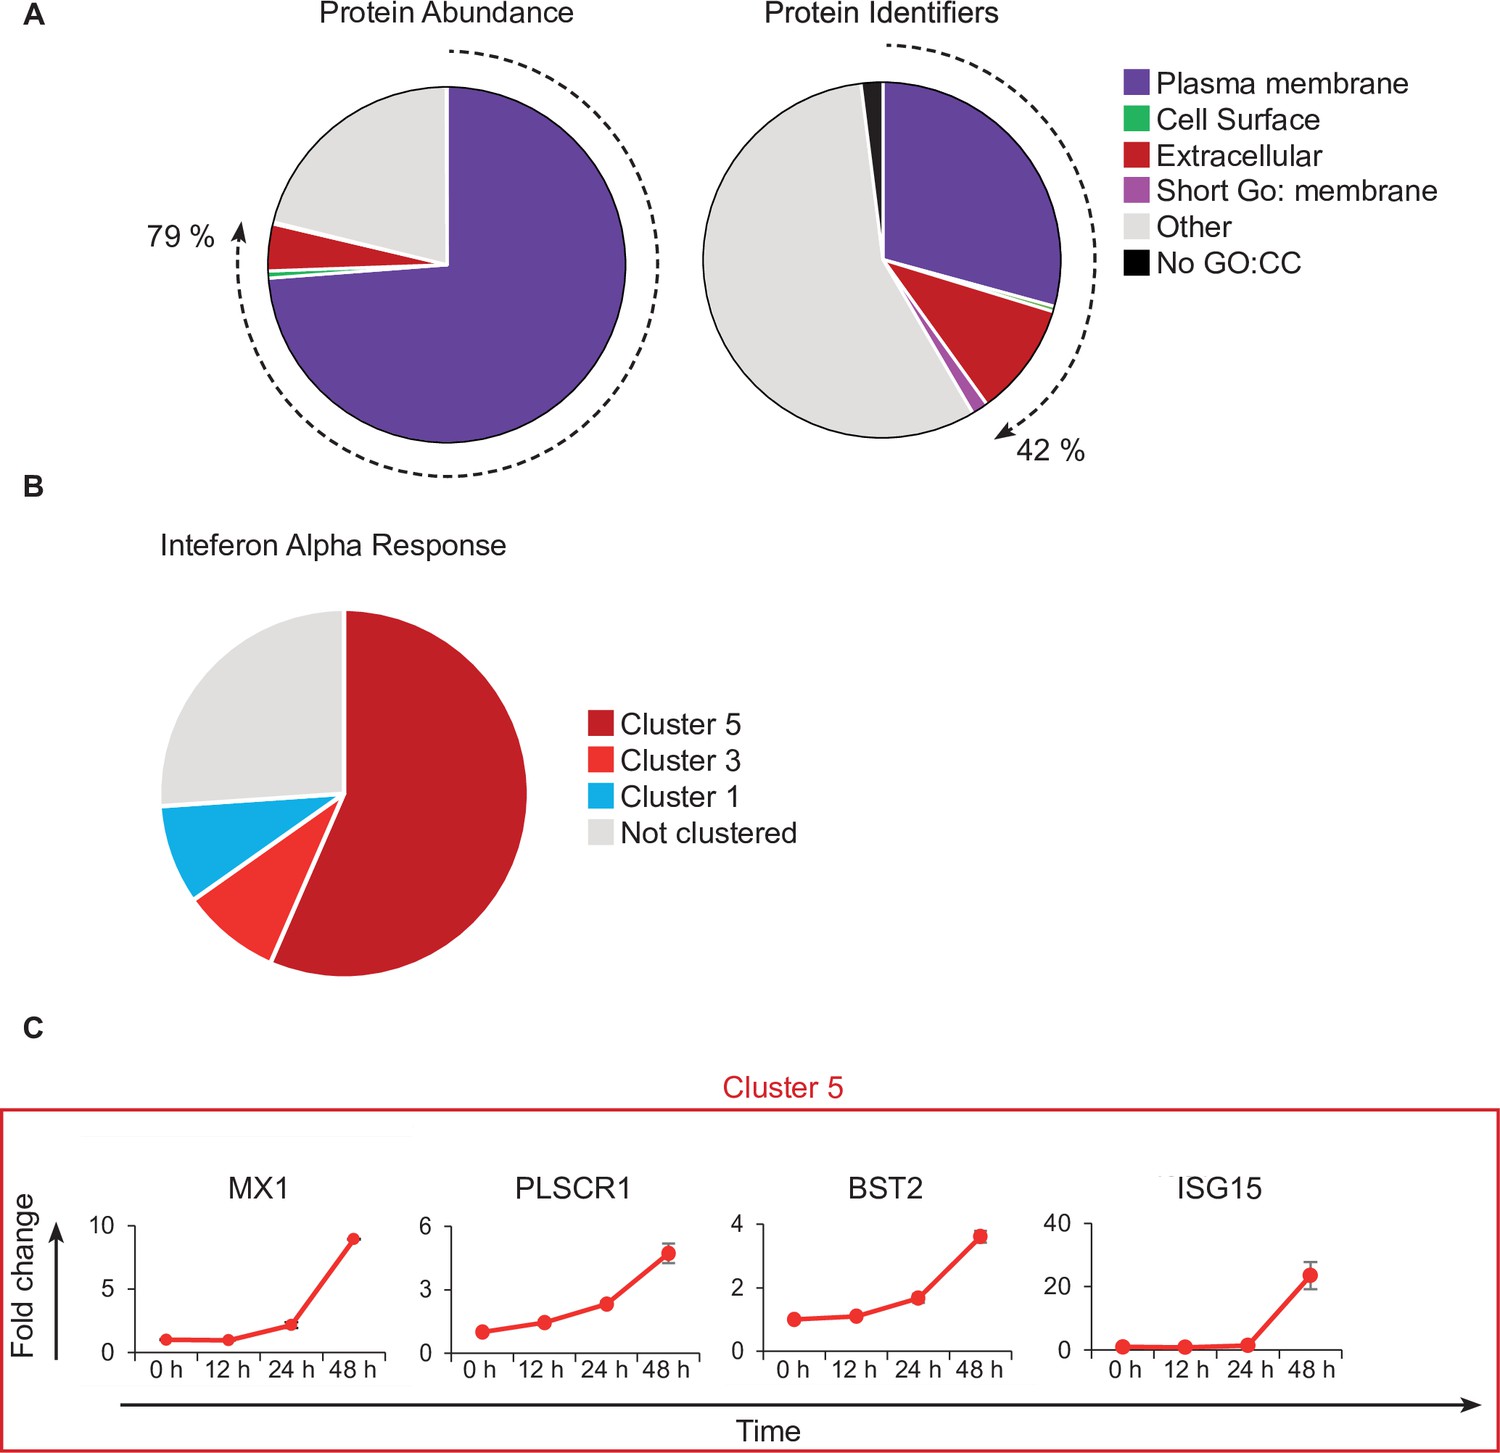
Plasma membrane proteins are enriched in the PMP dataset.
(A) Pie charts showing the proportion of proteins falling into previously defined annotation categories for plasma membrane proteins by left, protein abundance, or right, protein identifiers. (B) Pie chart showing the distribution of proteins defined by the Molecular Signatures Database (MSigDB) gene set ‘Hallmark Interferon Alpha Response’ into the defined temporal clusters. (C). Example temporal profiles of type I interferon inducible genes upregulated in cluster 5, y-axis shows fold change compared to 0 hr timepoint.
Figure 1—figure supplement 2
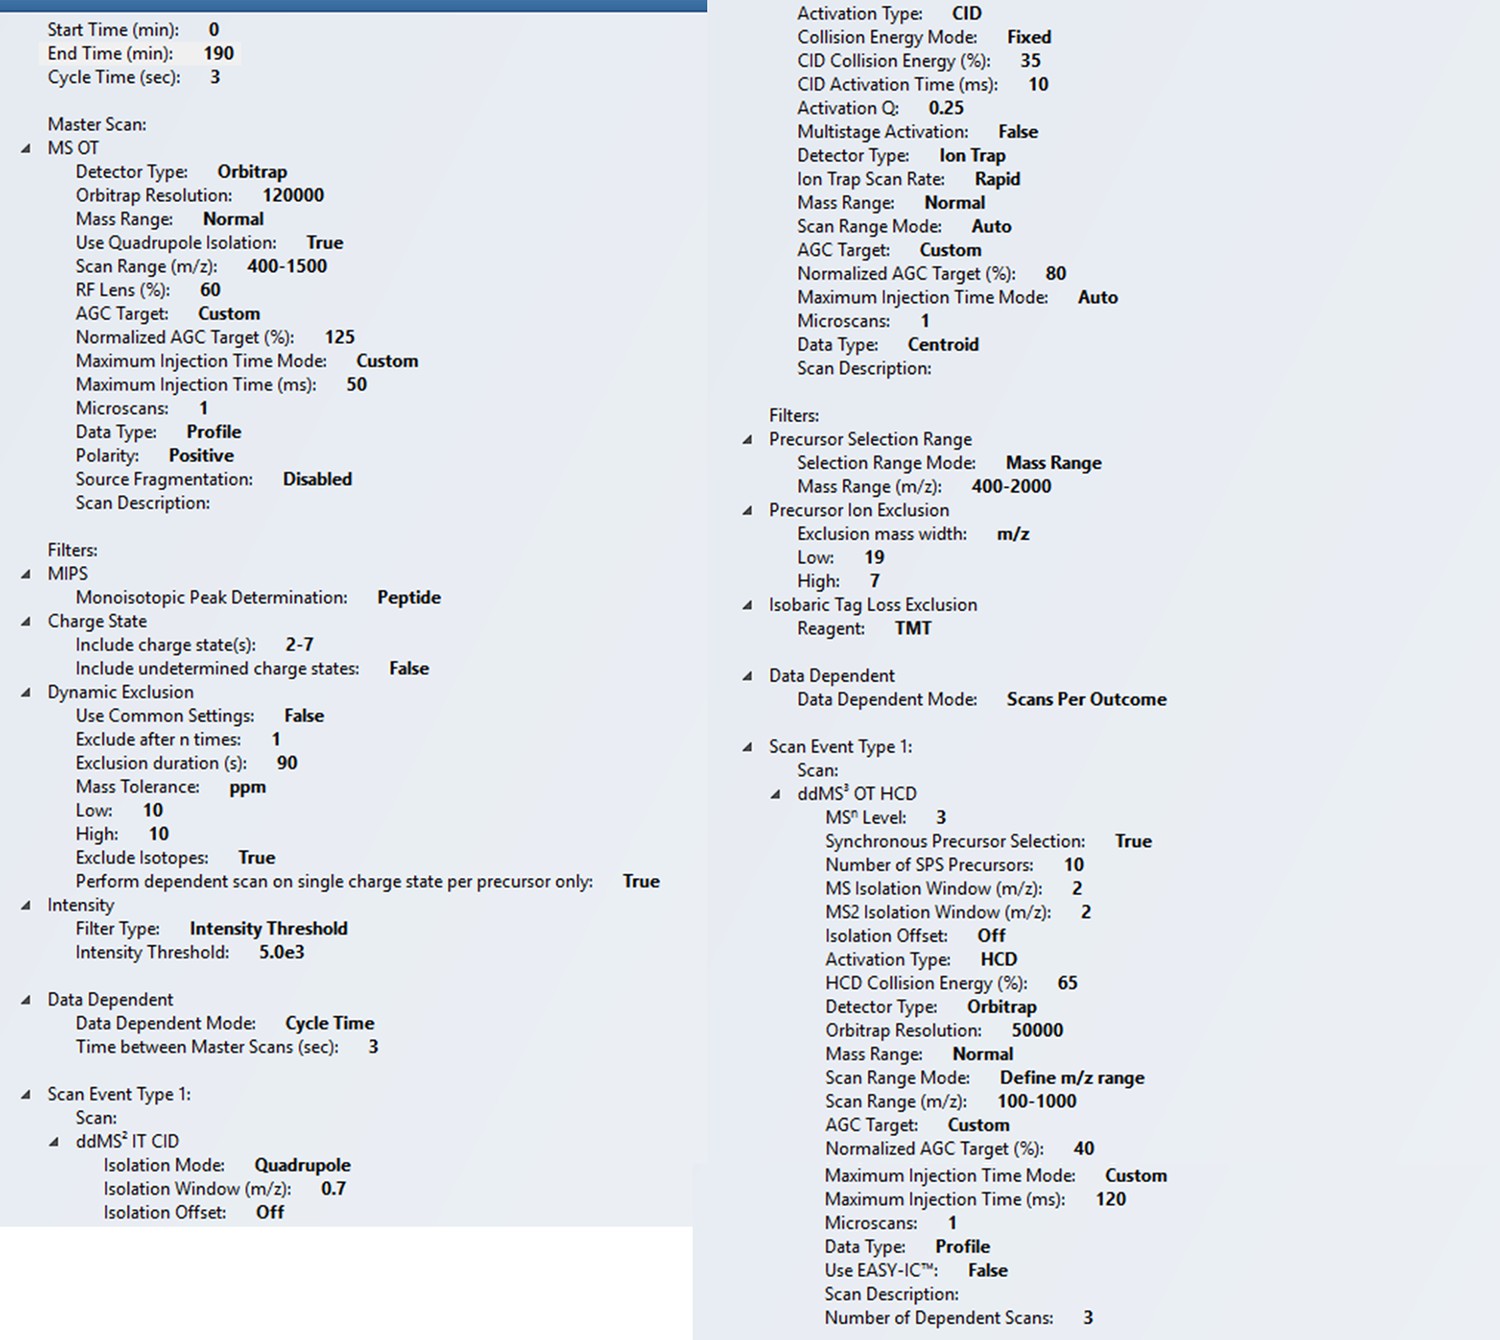
MS method parameters.
Figure 1—figure supplement 3
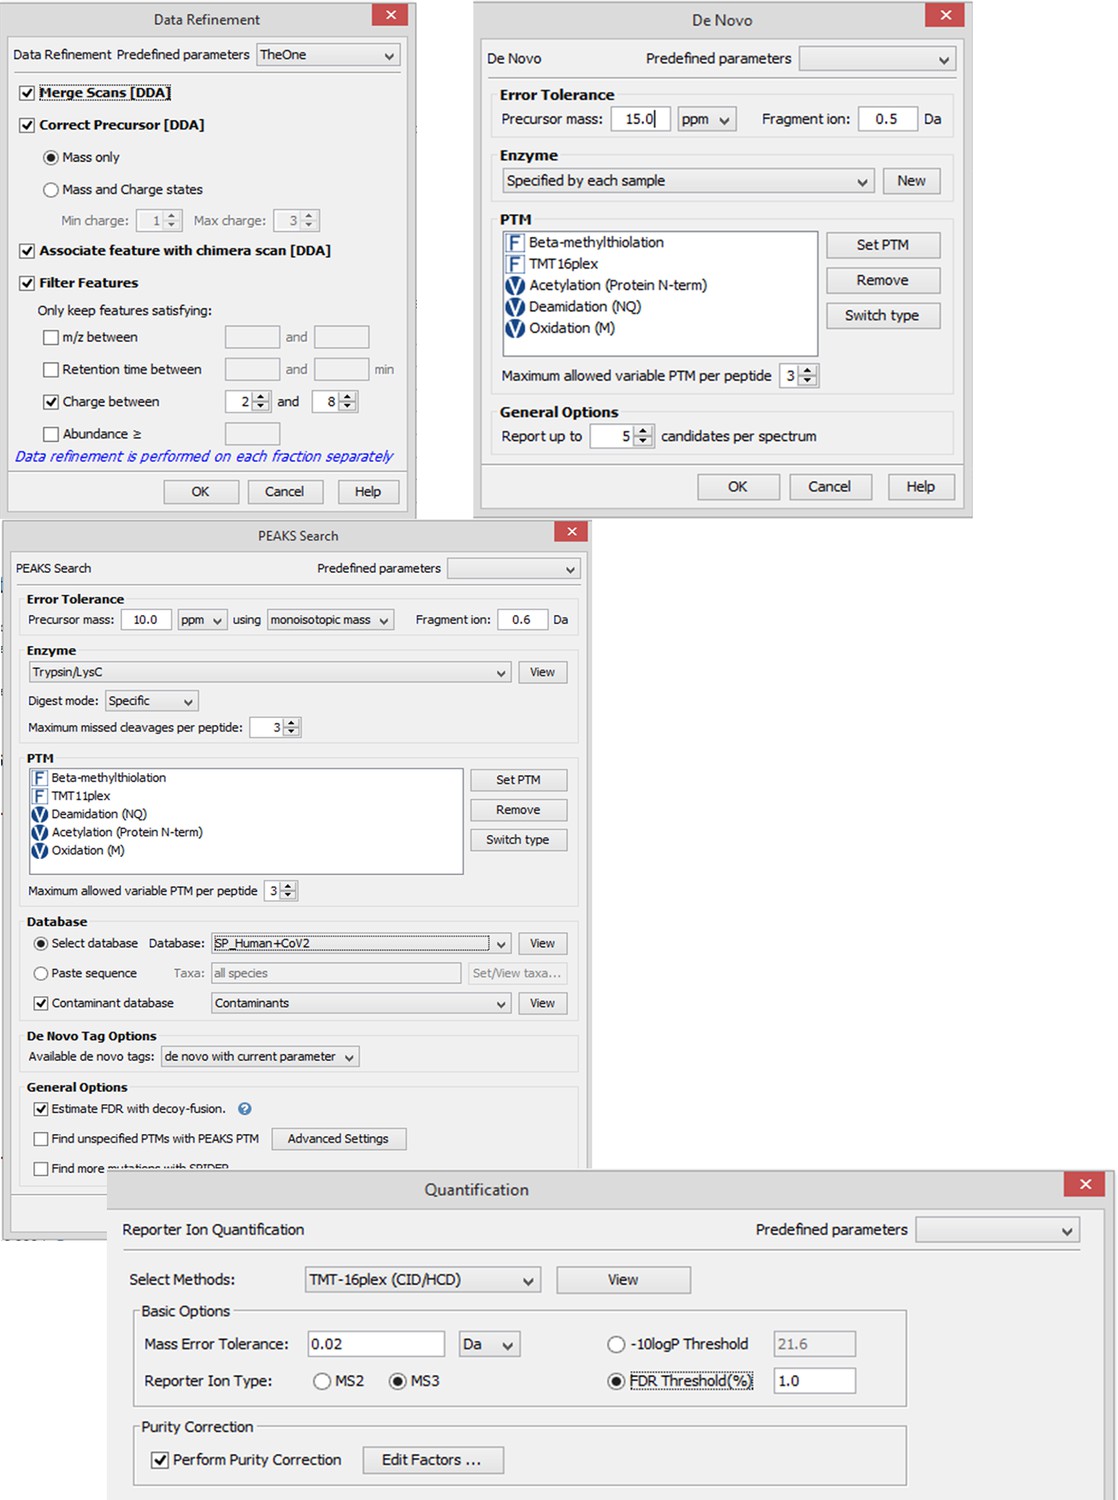
Search parameters for MS data processing.
Figure 2 with 1 supplement

SARS-CoV-2 manipulates multiple classes of plasma membrane proteins.
Enriched gene ontology and pathway annotations of proteins downregulated in temporal cluster 1 were condensed to groups of related terms, bar chart shows the enrichment score of these groups. Examples of annotation terms falling within each group are shown underlined with Bejamani-Hochberg adjusted p-values in parentheses, alongside four examples of proteins for each annotation.
Figure 2—figure supplement 1
NK ligands detected in the PMP dataset.
Temporal profiles of NK-cell ligands detected in the PMP dataset, y-axis shows fold change compared to 0 hr timepoint.
Figure 3 with 2 supplements
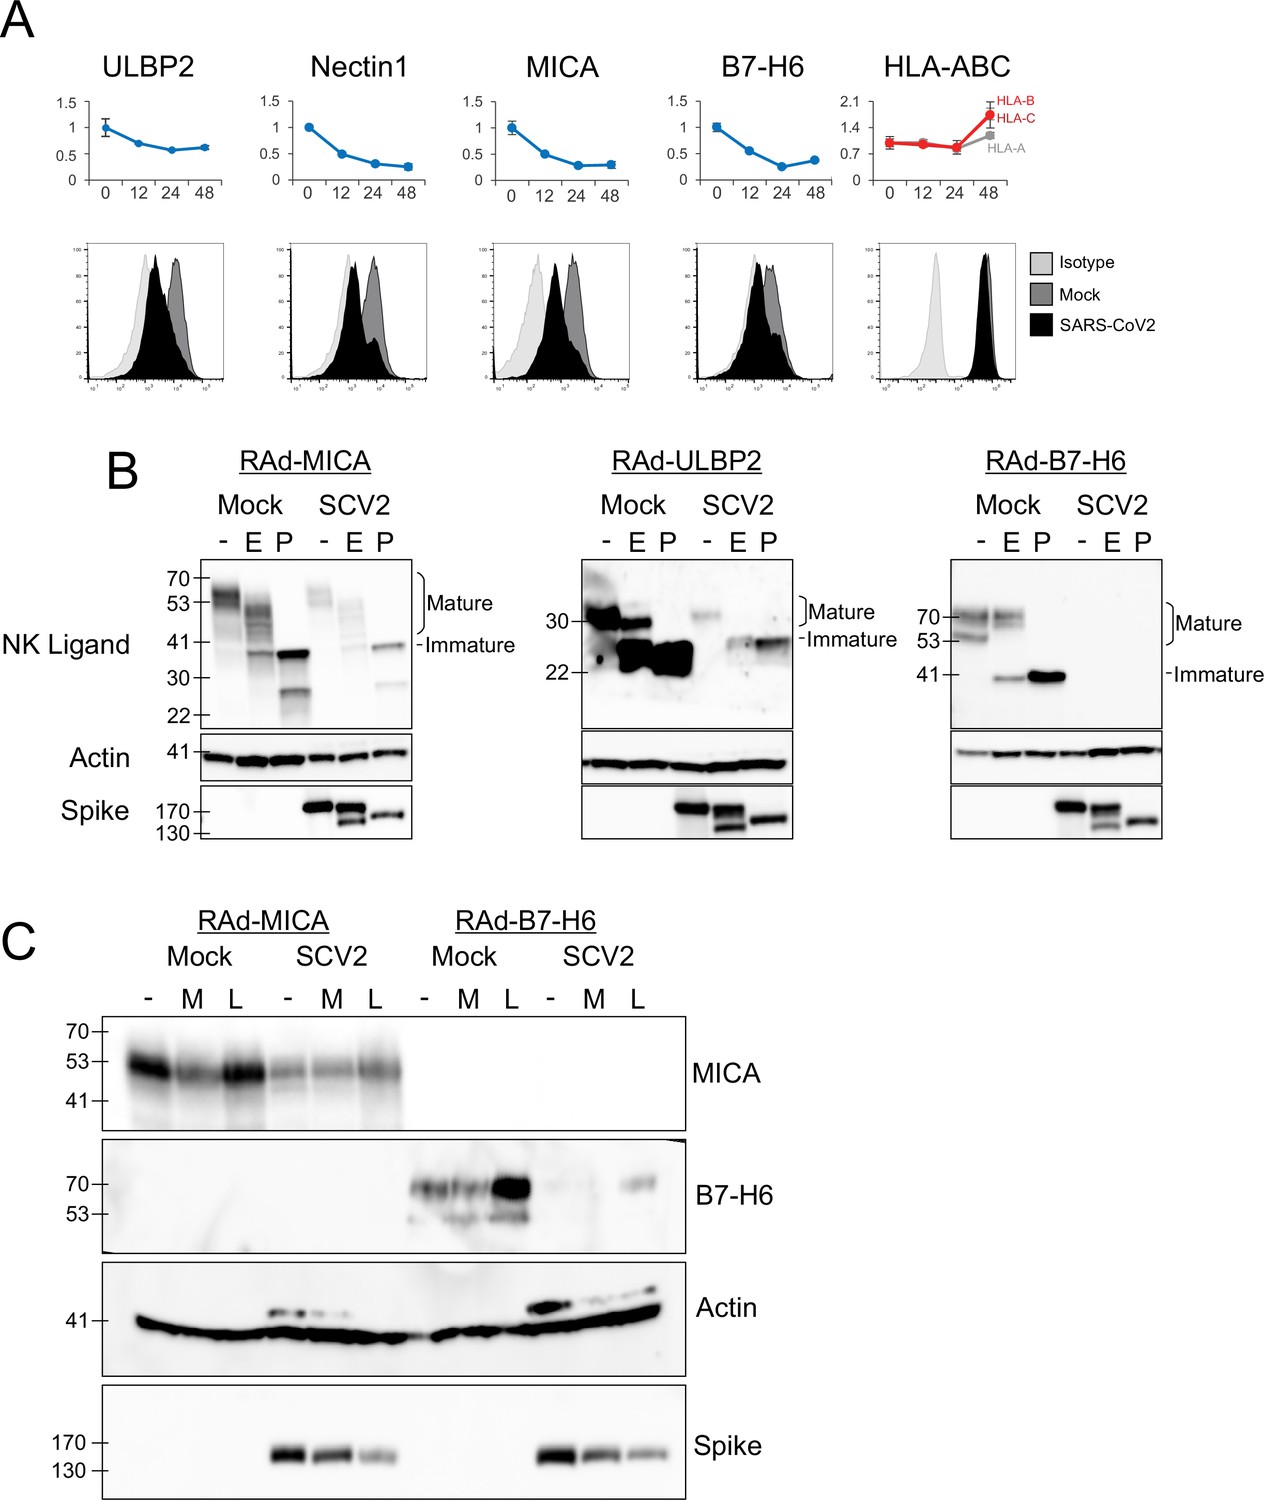
SARS-CoV-2 infection inhibits the expression of multiple NK ligands.
(A) AAT cells were either mock infected, or infected with SARS-CoV-2 for 24 hr (MOI = 5), detached using TrypLE, then stained for the indicated NK cell receptors before being analysed by flow cytometry (bottom). Plots for the same proteins from PMP are included for reference (top) (B) AAT cells were infected with RAd-MICA, RAd-ULBP2, or RAd-B7-H6, then after 48 hr either mock infected, or infected with SARS-CoV-2 (SCV2) for a further 24 hr (MOI = 5). Lysates were either kept undigested, or digested with EndoH (E), or PNGaseF (P), then western blotted for the indicated proteins. Mature cell surface glycoproteins are resistant to EndoH, while immature (ER resident) forms are digested and therefore run with a smaller mass following EndoH digestion (C) AAT cells were infected with RAd-MICA or RAd-B7-H6, then after 24 hr either mock infected, or infected with SARS-CoV-2 (SCV2), and treated with MG132 (M) or Leupeptin (L).Twenty-four hour later lysates were made, and analysed by western blot for the indicated proteins. (Note: The additional band seen when staining for actin in the presence of SARS-CoV-2 may be non-specific).
Figure 3—figure supplement 1
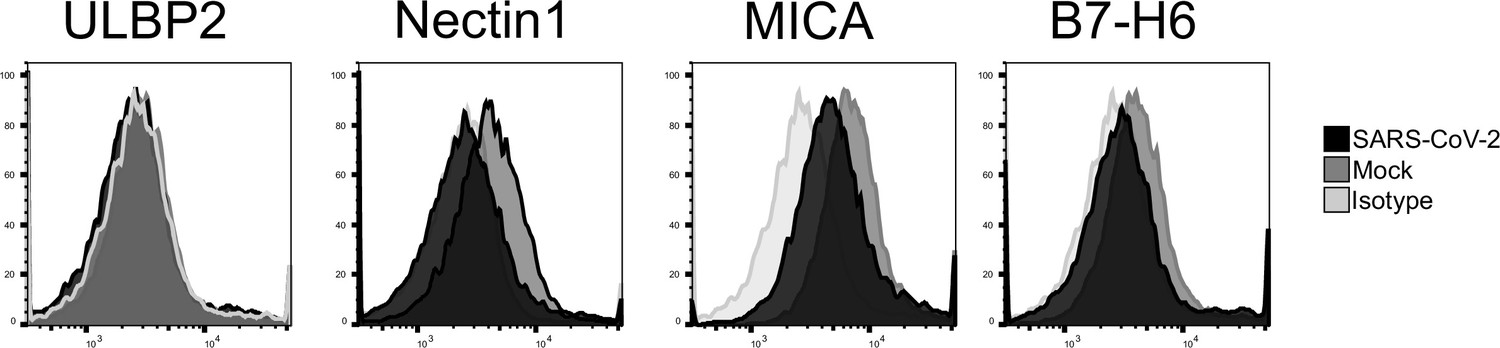
SARS-CoV-2 infection downregulates multiple NK ligands in CACO2 cells.
(A) CACO2 cells were either mock infected, or infected with SARS-CoV-2 for 24 hr (MOI = 5), detached using TrypLE, then stained for the indicated NK cell receptors before being analysed by flow cytometry.
Figure 3—figure supplement 2
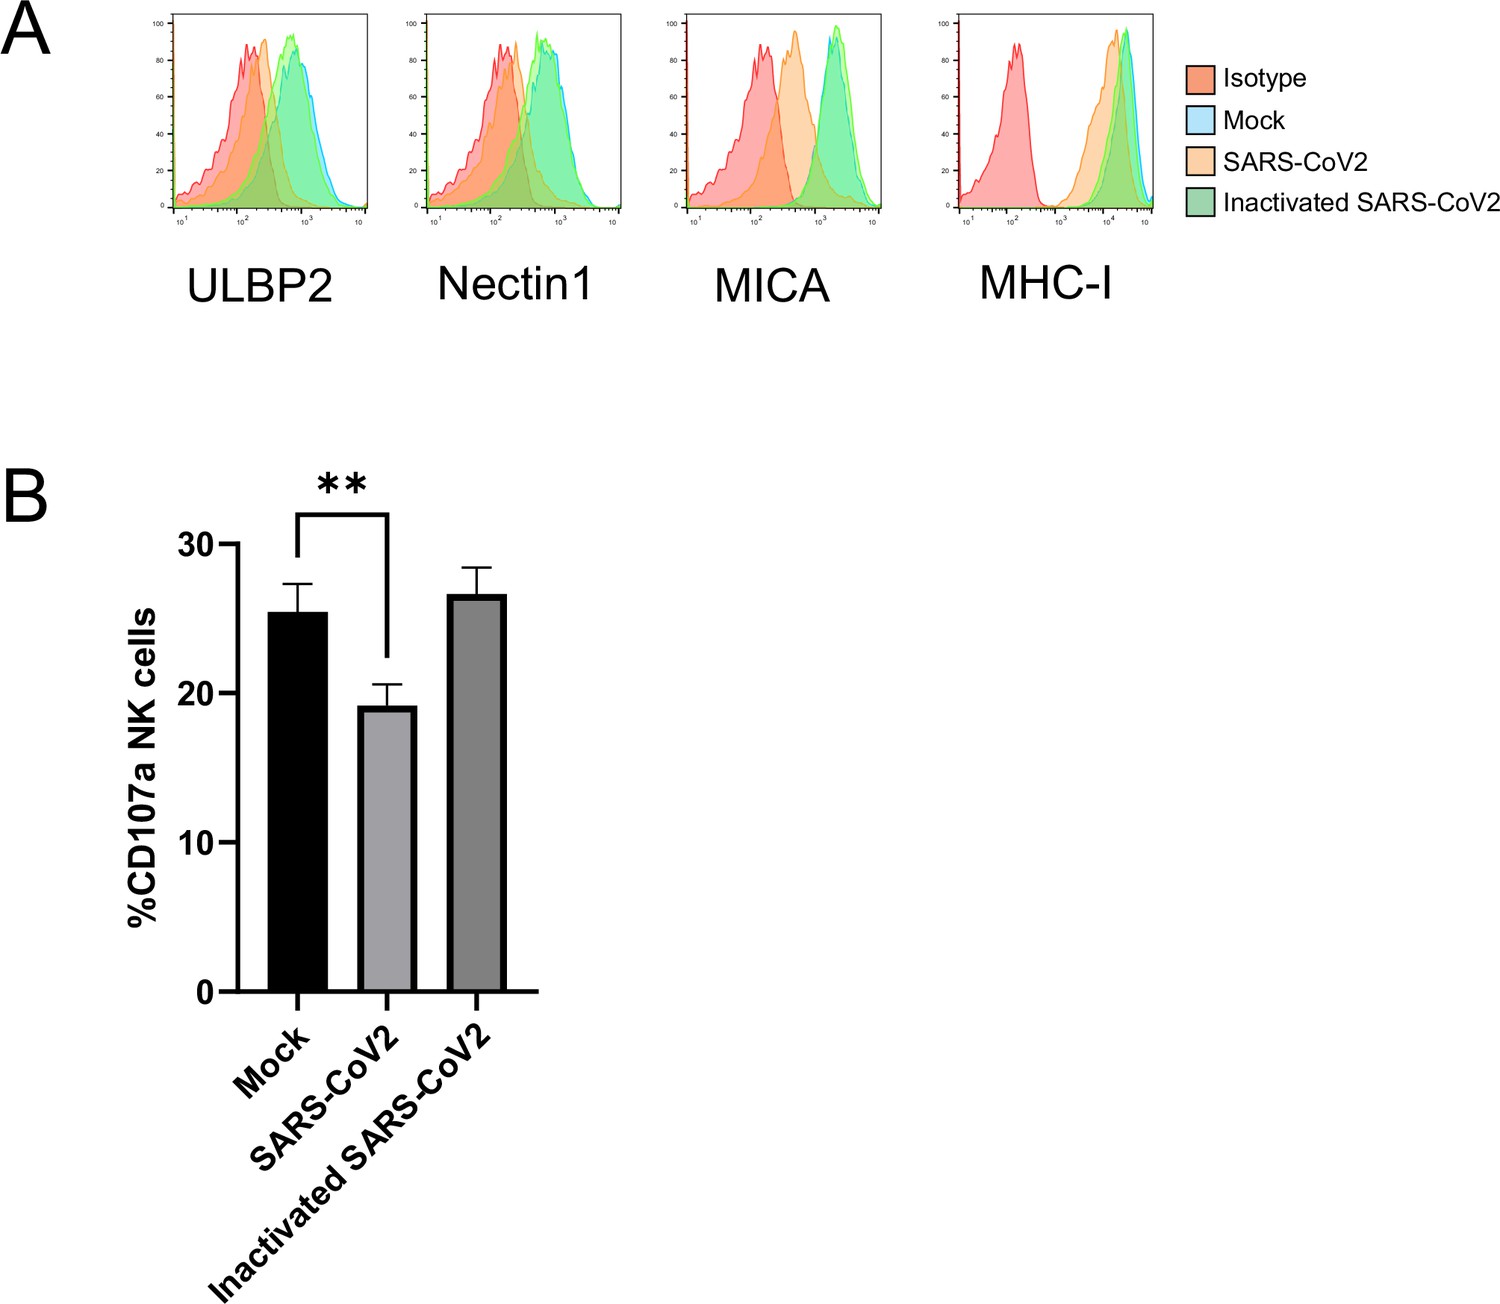
Modulation of NK activity is dependent on virus replication.
AAT cells were mock infected, or infected with SARS-CoV-2 (MOI = 5), or with heat inactivated SARS-CoV-2. After 24 hr, cells were dissociated with trypLE. (A) cells were stained with the indicated antibodies before being analysed by flow cytometry. (B) Cells were mixed with PBMC and incubated for 5 hr in the presence of golgistop and CD107a antibody, before staining for CD3, CD56, CD57 and Live/Dead Aqua. Cells were gated on live NK cells, and the percentage of cells positive for CD107a calculated. Assays were run in technical triplicate, and are representative of two biological repeats. One-way ANOVA **p<0.01.
Figure 4 with 1 supplement
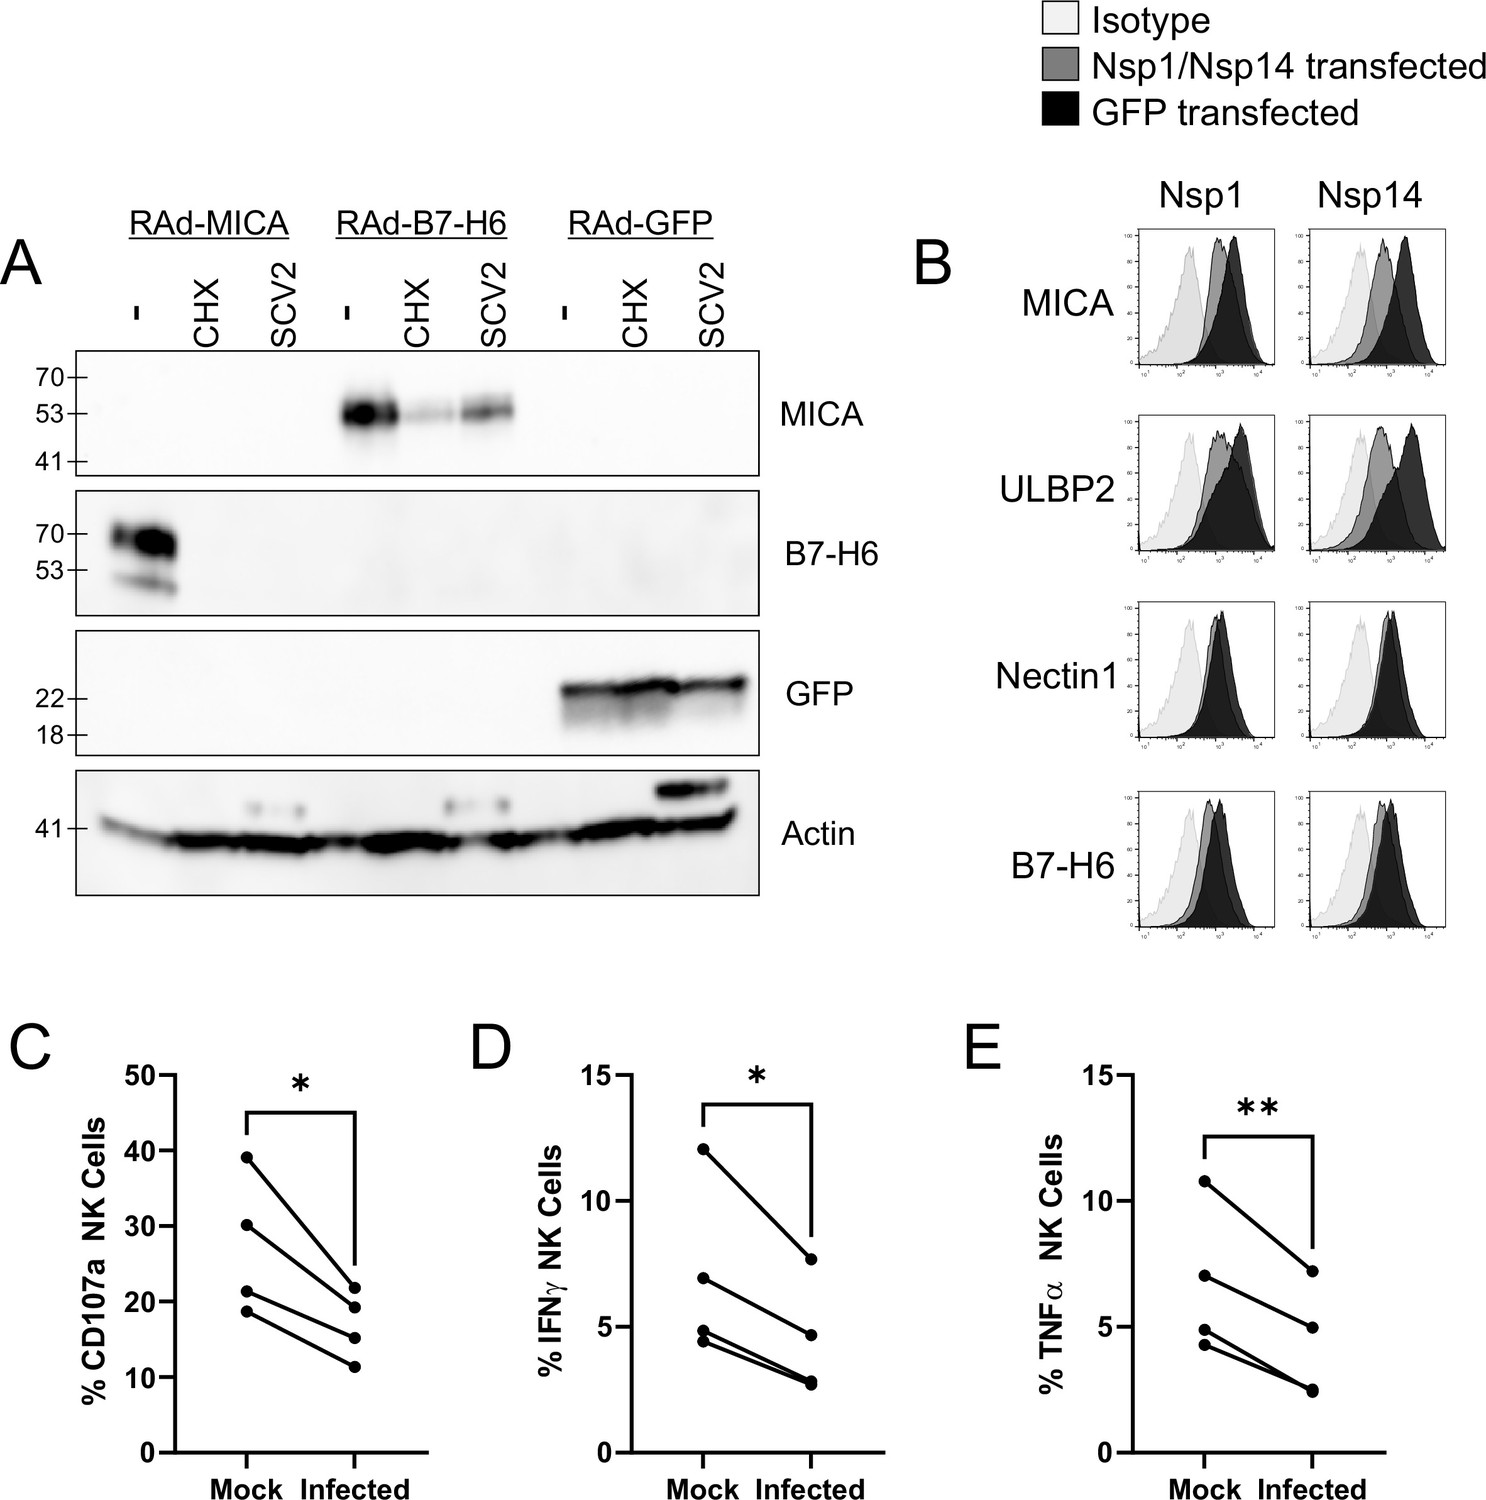
SARS-CoV-2 infection restricts the expression of multiple NK ligands, inhibiting NK activation.
(A) AAT cells were infected with RAd-MICA, RAd-B7-H6, or RAd-GFP, then after 24 hr either mock infected, infected with SARS-CoV-2 (SCV2), or treated with Cycloheximide (CHX). Twenty-four hr later, cells were lysed and analysed by western blot for the indicated proteins (Note: The additional band seen when staining for actin in the presence of SARS-CoV-2 may be non-specific). (B) 293T cells were transfected with expression plasmids for Nsp1 or Nsp14, or GFP as a control. Twenty-four hr later, cells were detached with HyQtase and stained for the indicated proteins. (C–E) AAT cells were either mock infected, or infected with SARS-CoV-2 for 24 h (MOI = 5), detached with TrypLE and mixed with interferon stimulated PBMC for 5 hr in the presence of golgistop, golgiplug, and CD107a antibody, before staining for CD3/CD56 and Live/Dead Aqua. Cells were then fixed, permeabilised, and stained for TNFα and IFNγ. Cells were gated on live NK cells, and the percentage of cells positive for CD107a, TNFα, and IFNγ calculated. Individual assays were run in technical triplicate, with data shown from four assays using different donors. Kruskal–Wallis, *p<0.05, **p<0.01.
Figure 4—figure supplement 1
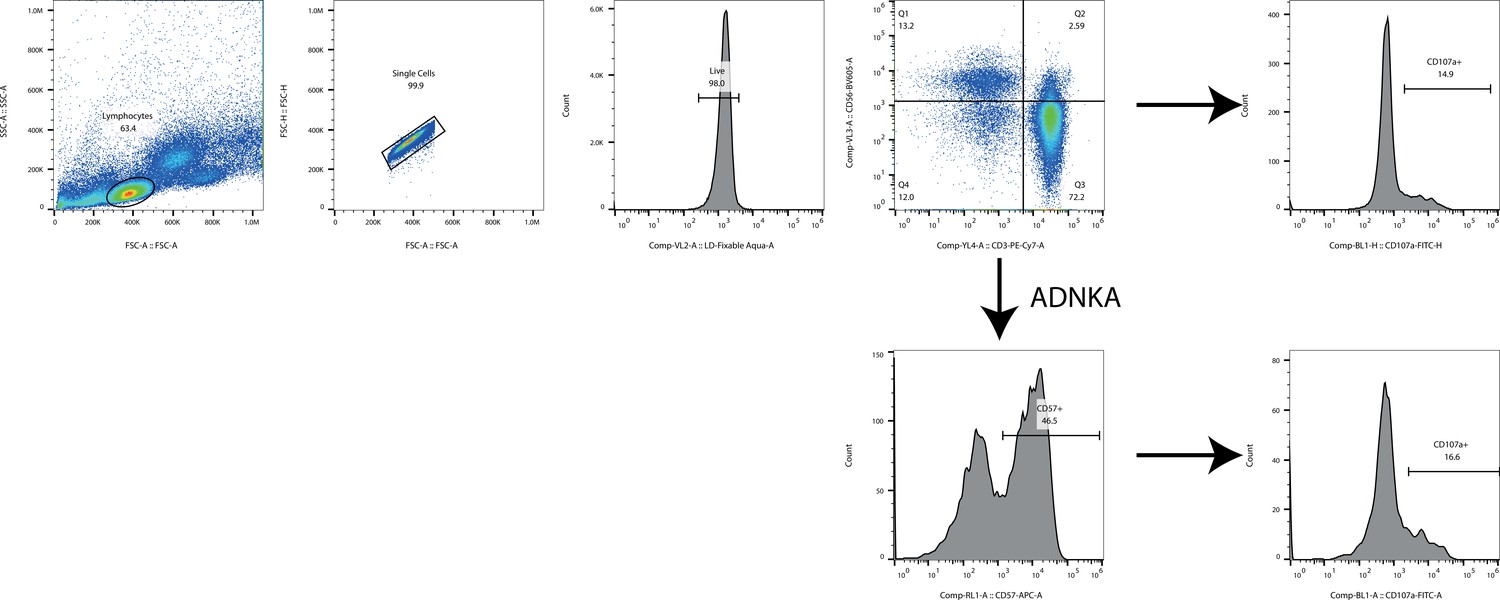
Example gating strategy for NK assays.
Lymphocytes were gated on FSC/SSC, doublets excluded using FSC-A/FSC-H, and live cells selected on the basis of Live/Dead Aqua staining. The percentage of CD107a + cells were determined in the CD56+/CD3- gate, or in the CD57 +gate of CD56+/CD3- cells.
Figure 5 with 1 supplement
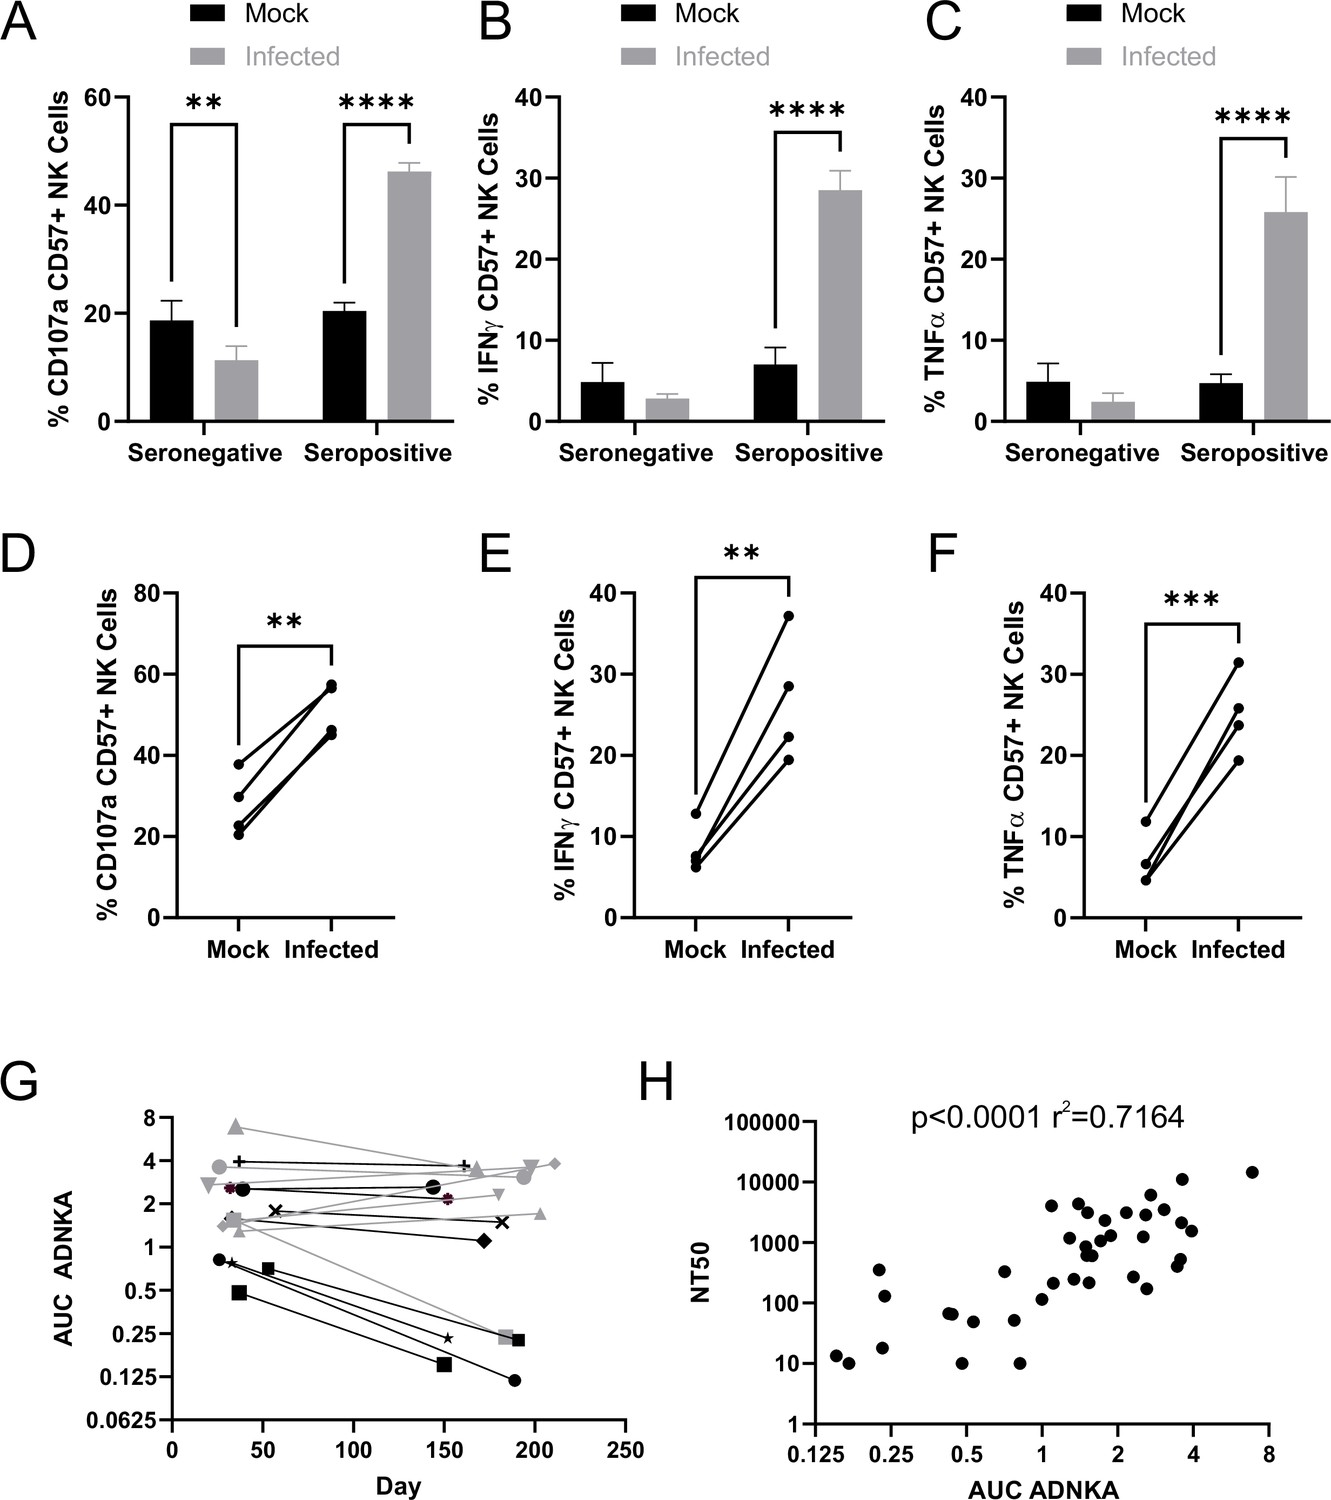
SARS-CoV-2 inhibition of NK activation can be overcome via ADNKA.
AAT cells were either mock infected, or infected with SARS-CoV-2 for 24 hr (MOI = 5), detached using TrypLE, then mixed with PBMC in the presence of golgistop, CD107a antibody, and serum from donors who were seronegative or seropositive for SARS-CoV-2. After 5 hr, cells were stained for CD3, CD56, CD57, and live/dead aqua, fixed, permeabilised and stained for IFNγ and TNFα, then analysed by flow cytometry. (A–F) assays were performed using 1% serum, and the percentage of CD57 +NK cells positive for CD107a (A, D), TNFα (B, E), and IFNγ (C, F) were calculated. Individual donors were performed in technical triplicate (A–C), two-way ANOVA **p<0.01, ****p<0.0001. Assays from multiple donors were also compared (D–F), Kruskal–Wallis **p<0.01, ***p<0.001. (G–H) assays were performed using a serial threefold dilution of serum, starting from 3.3%, then the area under the curve (AUC) calculated. (G) Longitudinal serums from donors who experienced mild (black) or severe (grey) were used. (H) In addition to AUC for ADNKA activity, serums were tested for their ability to neutralise SARS-CoV-2 infection of VeroE6 cells, and the NT50 calculated, then compared to the AUC for ADNKA; Spearman rank correlation analysis is shown.
Figure 5—figure supplement 1
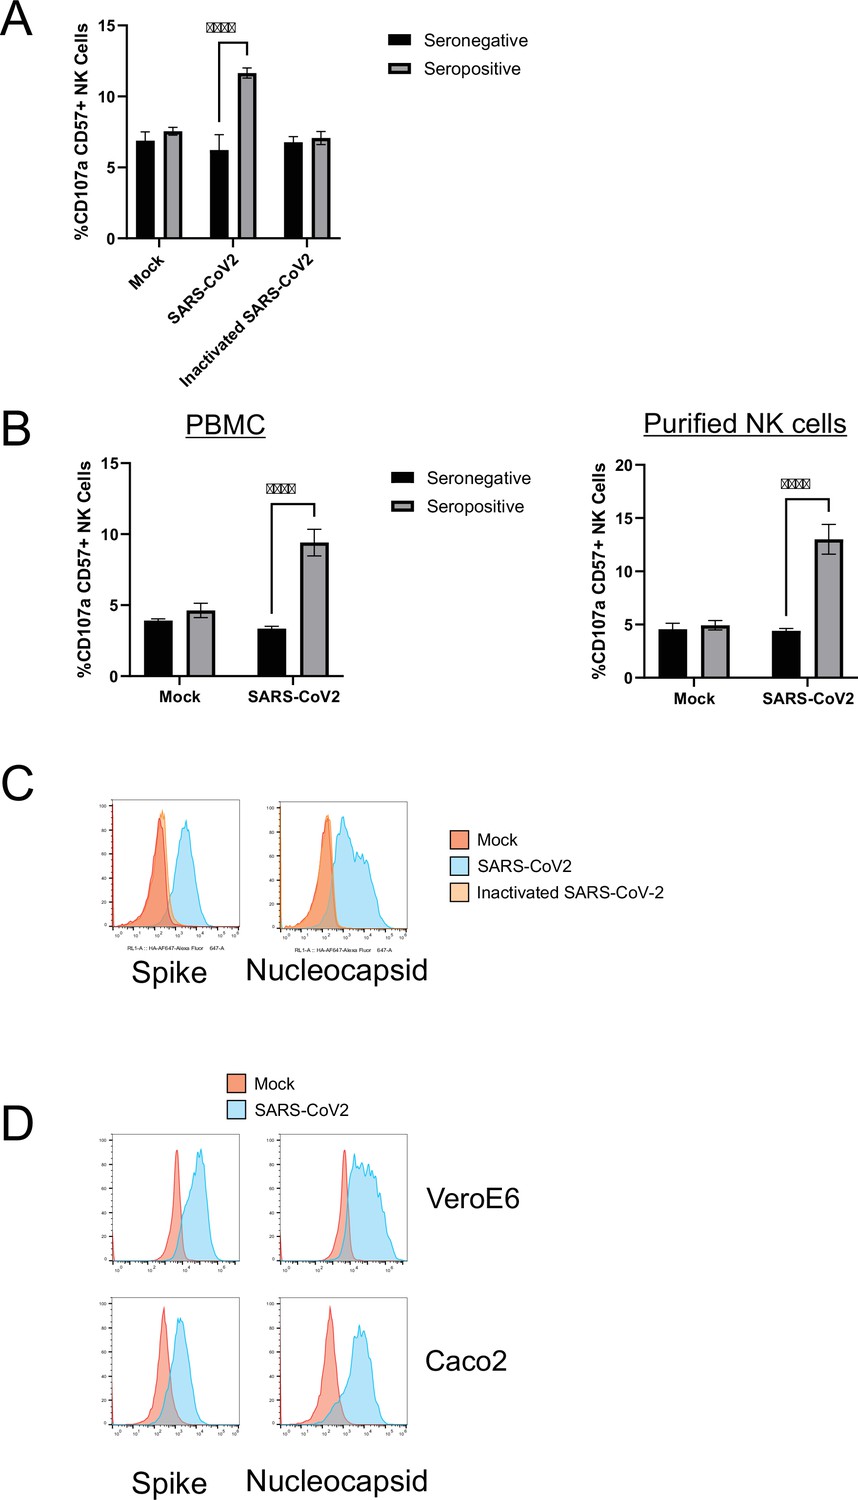
ADNKA is dependent on virus replication, and occurs through direct action on NK cells.
(A–C) AAT cells were mock infected, or infected with SARS-CoV-2, or with heat inactivated SARS-CoV-2 (MOI = 5). After 24 hr, cells were dissociated with trypLE. (A–B) Cells were mixed with PBMC (A) or purified NK cells (A–B) and 1% sera that was seropositive or seronegative for SARS-CoV-2. Cells were incubated for 5 hr in the presence of golgistop and CD107a antibody, before staining for CD3, CD56, CD57, and Live/Dead Aqua. Cells were gated on live CD57 +NK cells, and the percentage of cells positive for CD107a. Assays were run in technical triplicate. Two-way ANOVA ****p<0.0001. (C) Cells were stained for spike or nucleocapsid. (D) Vero or Caco2 cells were infected with SARS-CoV-2. After 24 hr, cells were dissociated with trypLE and stained for spike or nucleocapsid, before being analysed by flow cytometry.
Figure 6 with 1 supplement
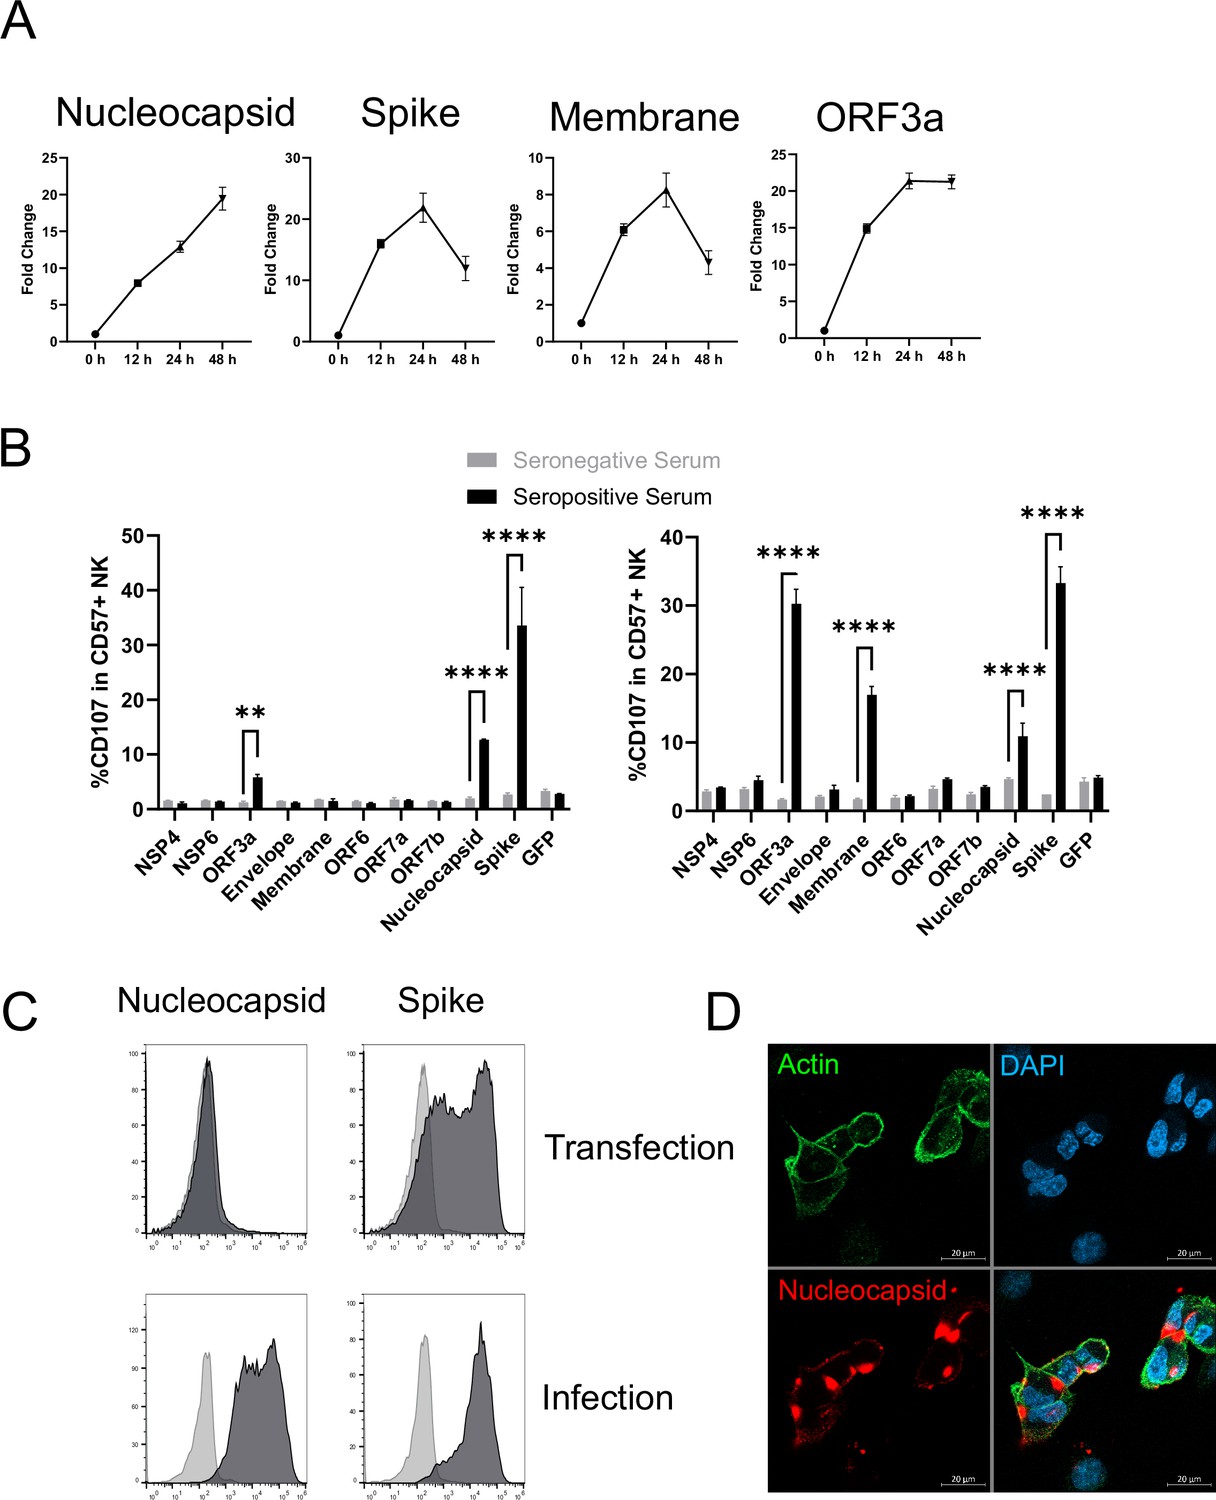
Multiple SARS-CoV-2 proteins mediate ADCC.
(A) Plots of viral proteins detected in the PMP analysis. (B) 293T cells were transfected with plasmids expressing the indicated SARS-CoV-2 proteins for 48 hr, then mixed with PBMC in the presence of golgistop, CD107a antibody, and 1% serum from donors who were seronegative or seropositive for SARS-CoV-2. After 5 hr, cells were stained for CD3, CD56, CD57, and live/dead aqua, then analysed by flow cytometry. Assays were performed in technical triplicate. Data is shown from two donor serums. **p<0.01, ****p<0.0001, two-way ANOVA. (C) 293T cells were transfected with plasmids expressing SARS-CoV-2 nucleocapsid or spike (or empty vector; light grey) for 48 hr, or AAT cells were infected with SARS-CoV-2 (MOI = 5) (or mock infected; light grey) for 24 hr, then cells were detached with TrypLE, stained for nucleocapsid or spike, and analysed by flow cytometry. (D) AAT cells were infected with SARS-CoV-2 (MOI = 5) for 24 hr, then cells were fixed in paraformaldehyde and stained for the indicated targets. Images are shown as maximum intensity projections of Z-stacks.
Figure 6—figure supplement 1
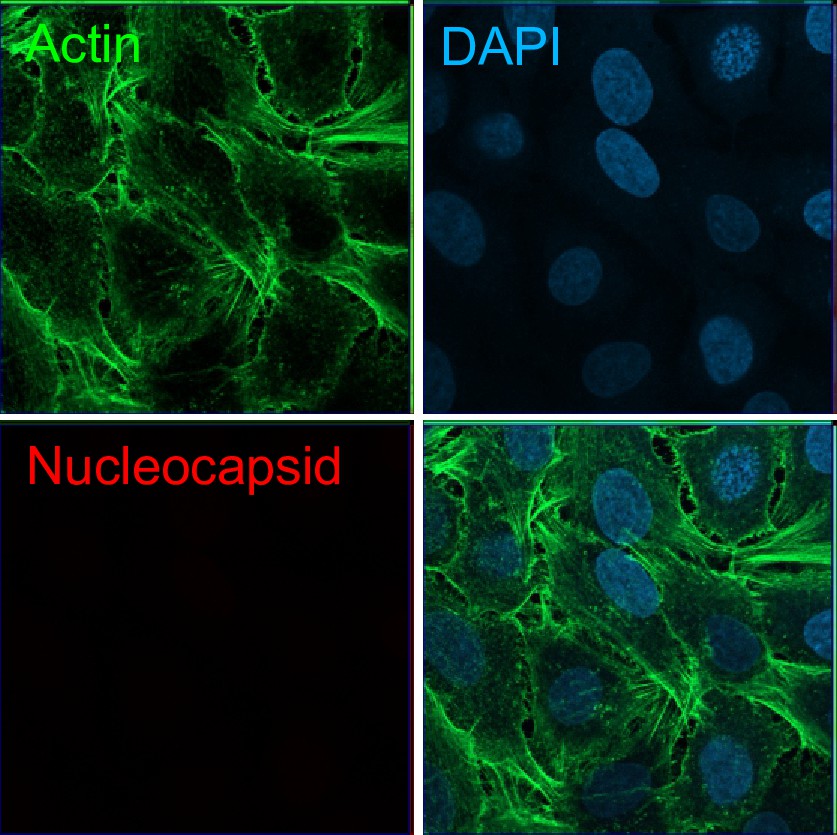
Immunofluorescence staining of negative control cells from Figure 6D.
Mock infected AAT cells were fixed in paraformaldehyde and stained for the indicated targets. Images are shown as maximum intensity projections of Z-stacks.
Figure 7 with 2 supplements
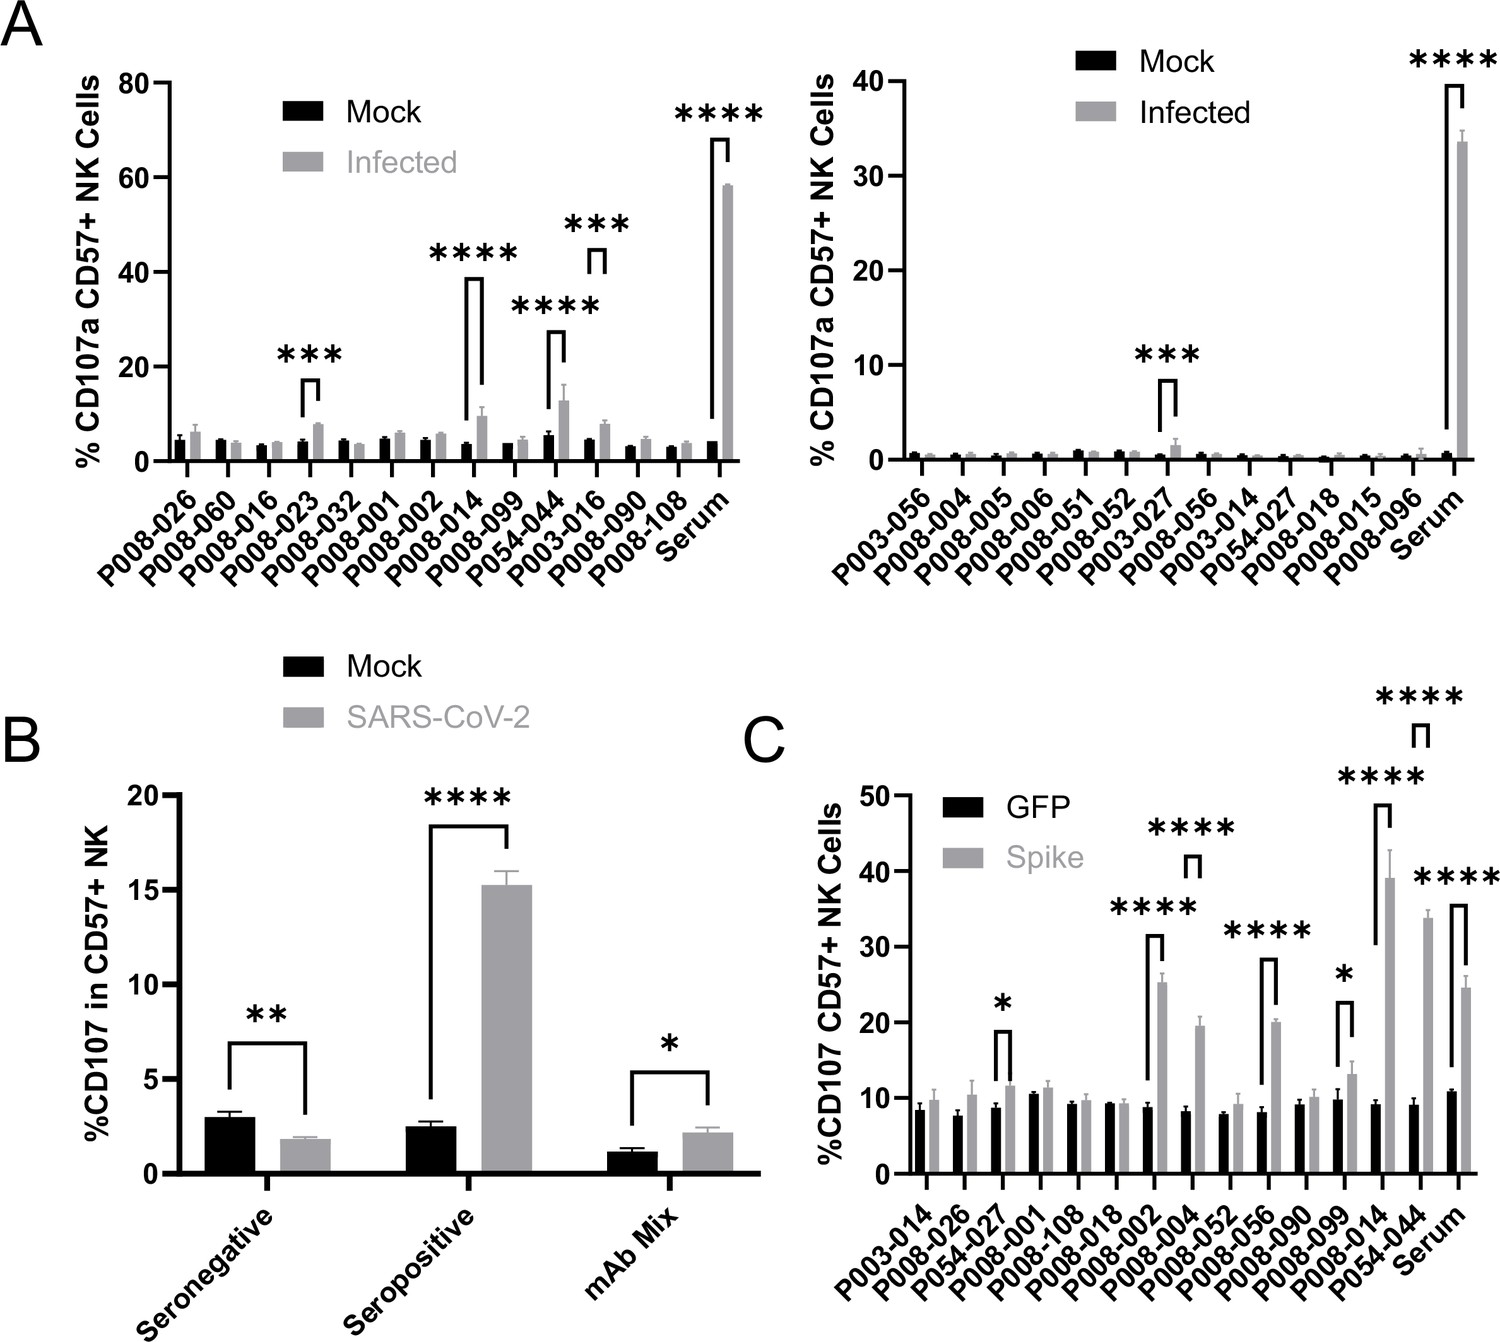
Monoclonal anti-spike antibodies bind infected cells strongly, but only weakly activate ADNKA.
(A–B) AAT cells were either mock infected, or infected with SARS-CoV-2 (MOI = 5), or (C) 293T cells were transfected with an expression plasmid for spike. After 24 hr (A–B) or 48 hr (C), cells were detached with TrypLE and mixed with PBMC and the indicated antibodies, or a serum from a moderate case of COVID-19. Cells were incubated for 5 hr in the presence of golgistop, golgiplug, and CD107a antibody, before staining for CD3, CD56, CD57, and Live/Dead Aqua. Cells were gated on live CD57 +NK cells, and the percentage of cells positive for CD107a calculated. Assays were run in technical triplicate. Two-way ANOVA ***p<0.001, ****p<0.0001.
Figure 7—figure supplement 1
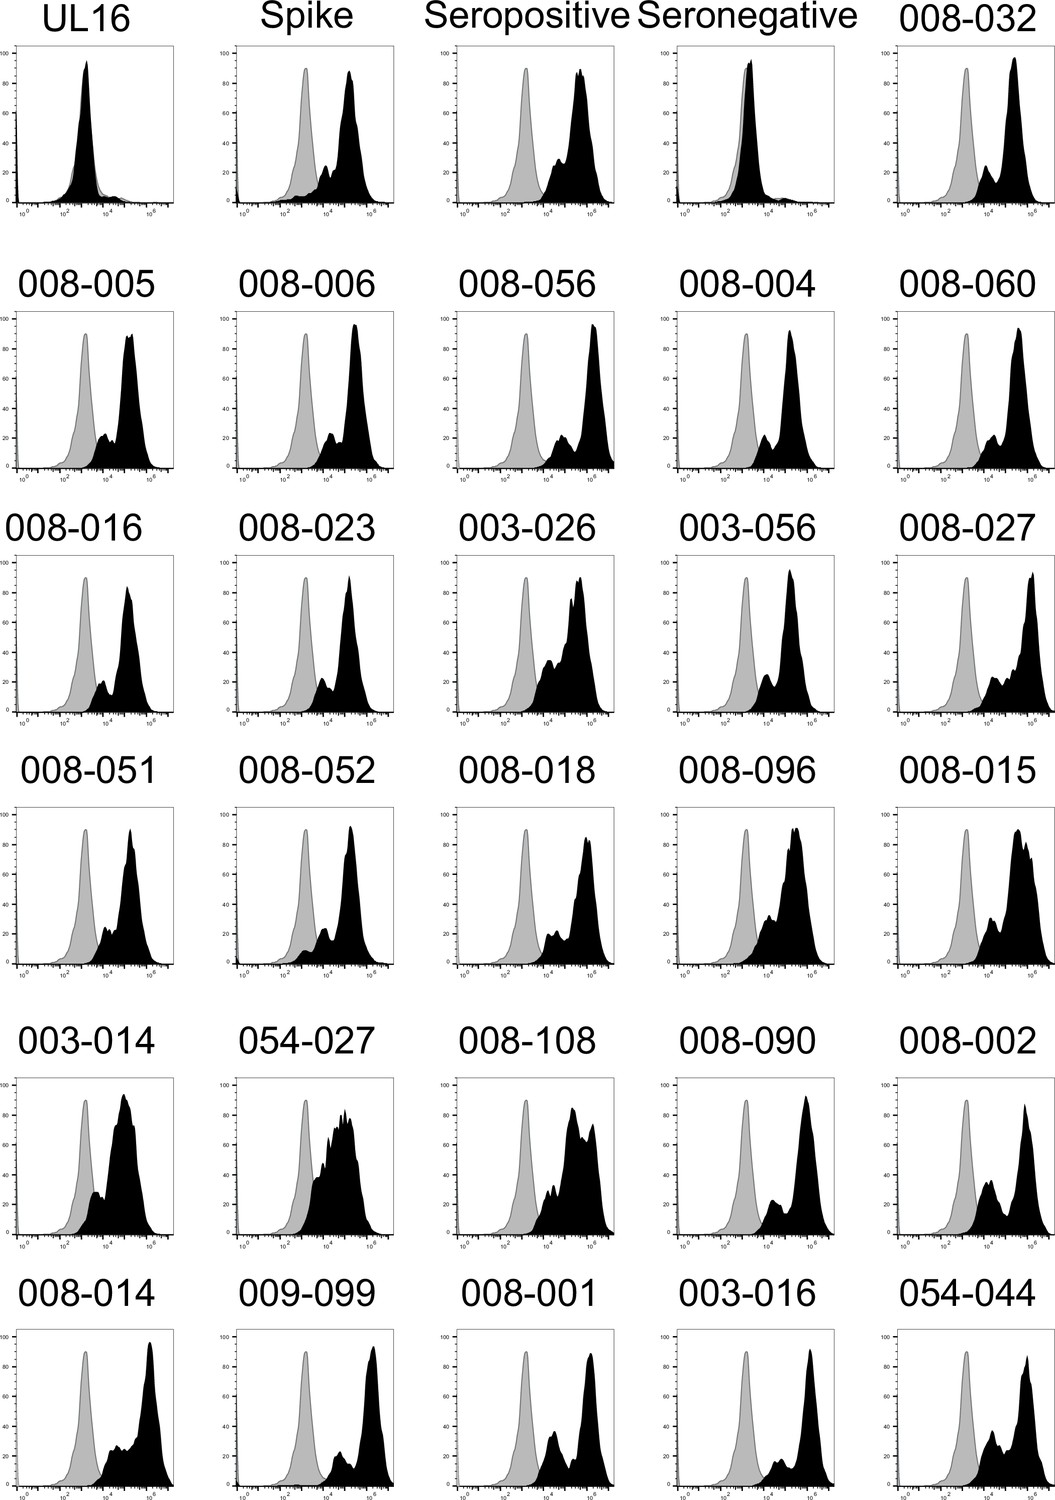
Anti-spike antibodies bind to SARS-CoV-2 infected cells.
AAT cells were mock infected (light grey), or infected with SARS-CoV-2 (black; MOI = 5) for 24 hr, then detached with TrypLE, stained with the indicated human anti-spike antibodies, then analysed by flow cytometry. UL16 represents a negative control antibody targeting a protein from a different virus (HCMV) (Vlahava et al., 2021).
Figure 7—figure supplement 2
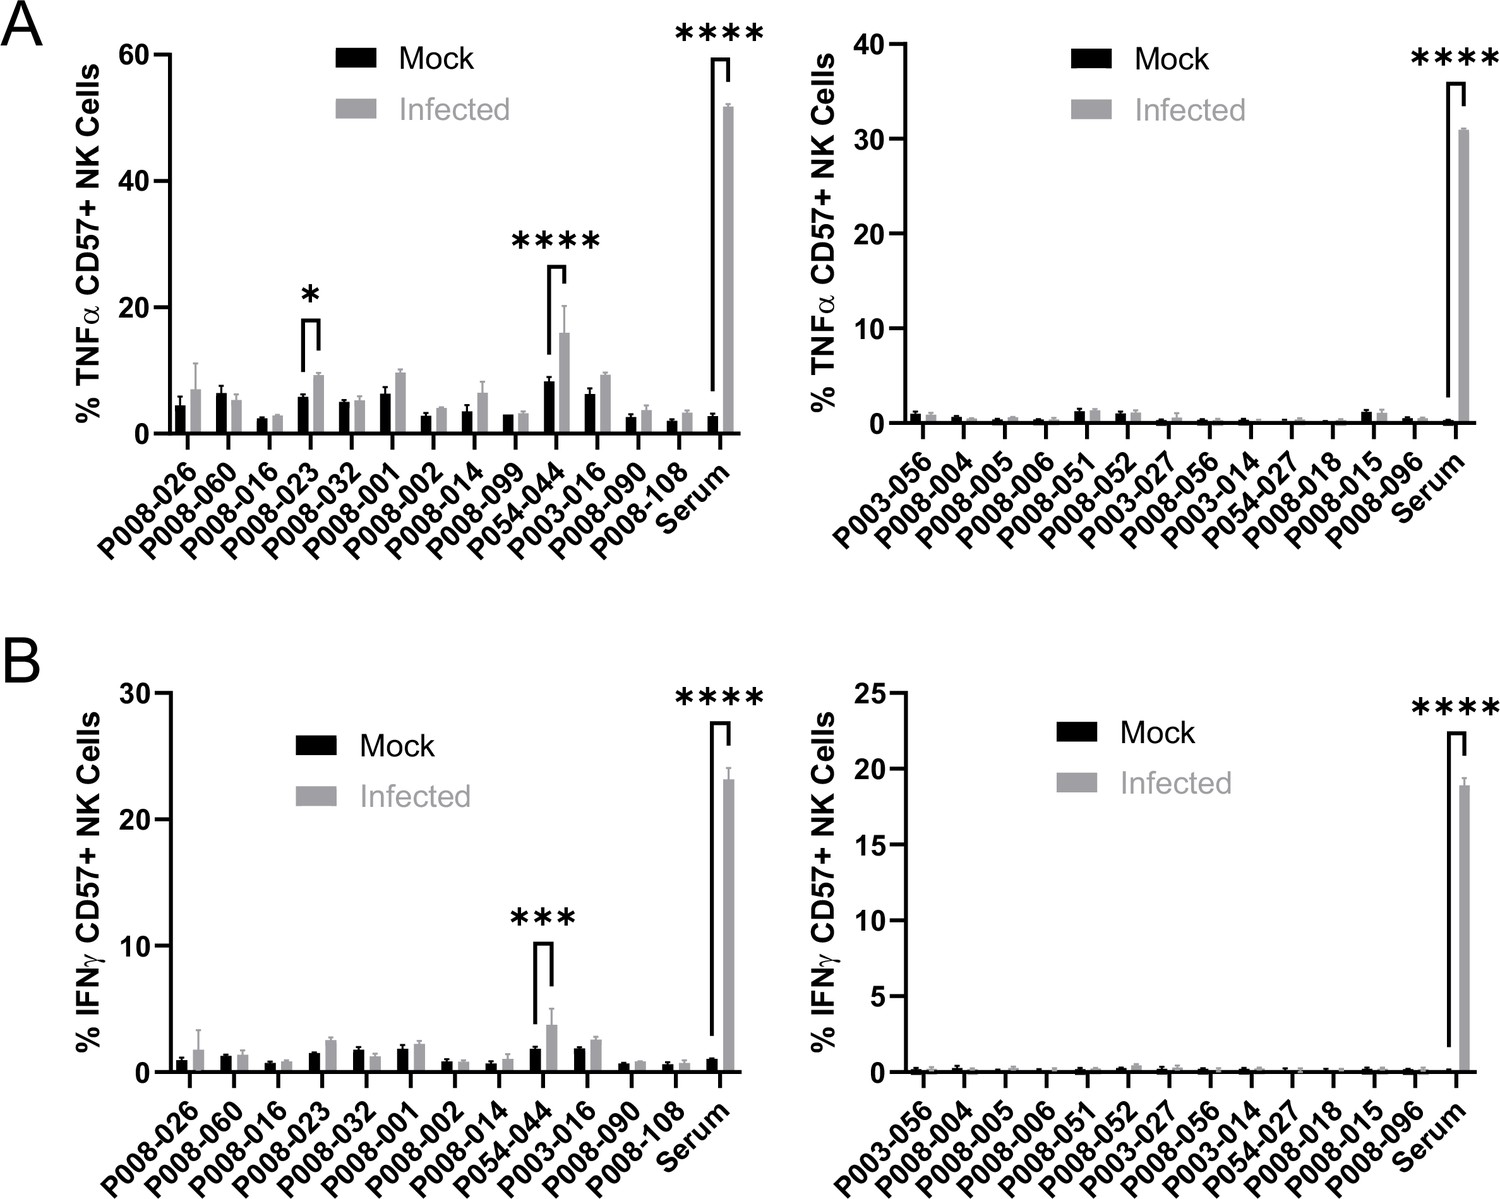
Monoclonal anti-spike antibodies only weakly activate ADNKA.
AAT cells were either mock infected, or infected with SARS-CoV-2 (MOI = 5) for 24 hr, detached with TrypLE and mixed with PBMC and the indicated antibodies, or a serum from a moderate case of COVID-19. Cells were incubated for 5 hr in the presence of golgistop, golgiplug, and CD107a antibody, before staining for CD3, CD56, CD57, and Live/Dead Aqua. Cells were then fixed, permeabilised, and stained for TNFα and IFNγ. Cells were gated on live CD57 +NK cells, and the percentage of cells positive for TNFα (A) and IFNγ (B) calculated. Assays were run in technical triplicate. Two-way ANOVA *p<0.05, ***p<0.001, ****p<0.0001.
Figure 8
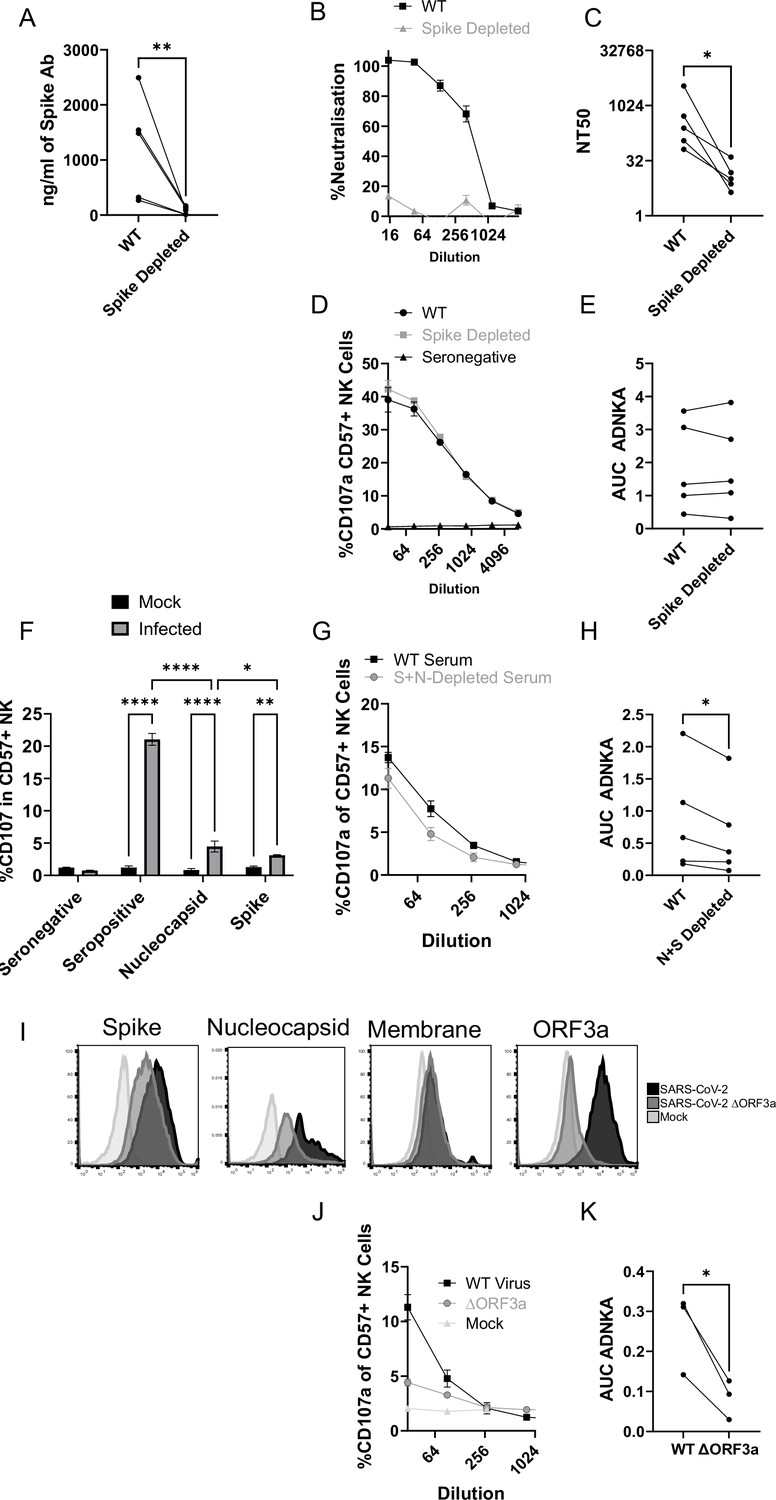
The ADNKA response is dominated by non-spike antibodies following natural infection.
Serums from individuals naturally infected with SARS-CoV-2 were depleted of anti-spike antibodies using spike trimer protein (A–E) or both spike trimer and nucleocapsid (G–H) conjugated to magnetic beads. (A) ELISA for spike trimer was used to measure levels of antibodies before and after depletion. (B, C) the ability of the original, or anti-spike depleted, serums to neutralise the ability of SARS-CoV-2 to infect VeroE6 cells was determined across a range of concentrations, then NT50 values calculated. Example plots (B) and NT50 values for multiple donors (C) are shown. (D–K) AAT cells were either mock infected, or infected with SARS-CoV-2 (D–H), or with SARS-CoV-2 from which ORF3 had been deleted (J, K) for 24 h (MOI = 5), detached using TrypLE, then mixed with PBMC in the presence of golgistop, CD107a antibody, and serial dilutions of serum, or monoclonal antibody. After 5 hr, cells were stained for CD3, CD56, CD57, and live/dead aqua, then analysed by flow cytometry for the percentage of CD107a-positive CD57 +NK cells. AUC values were then calculated. Example plots (D, G, J) and AUC values for multiple donors (E, H, K) are shown. Kruskal–Wallis *p<0.05, **p<0.01, ****p<0.0001. (I) Twenty-four hr after infection, cells were detached and stained for the indicated proteins after analysis by flow cytometry.
Figure 9
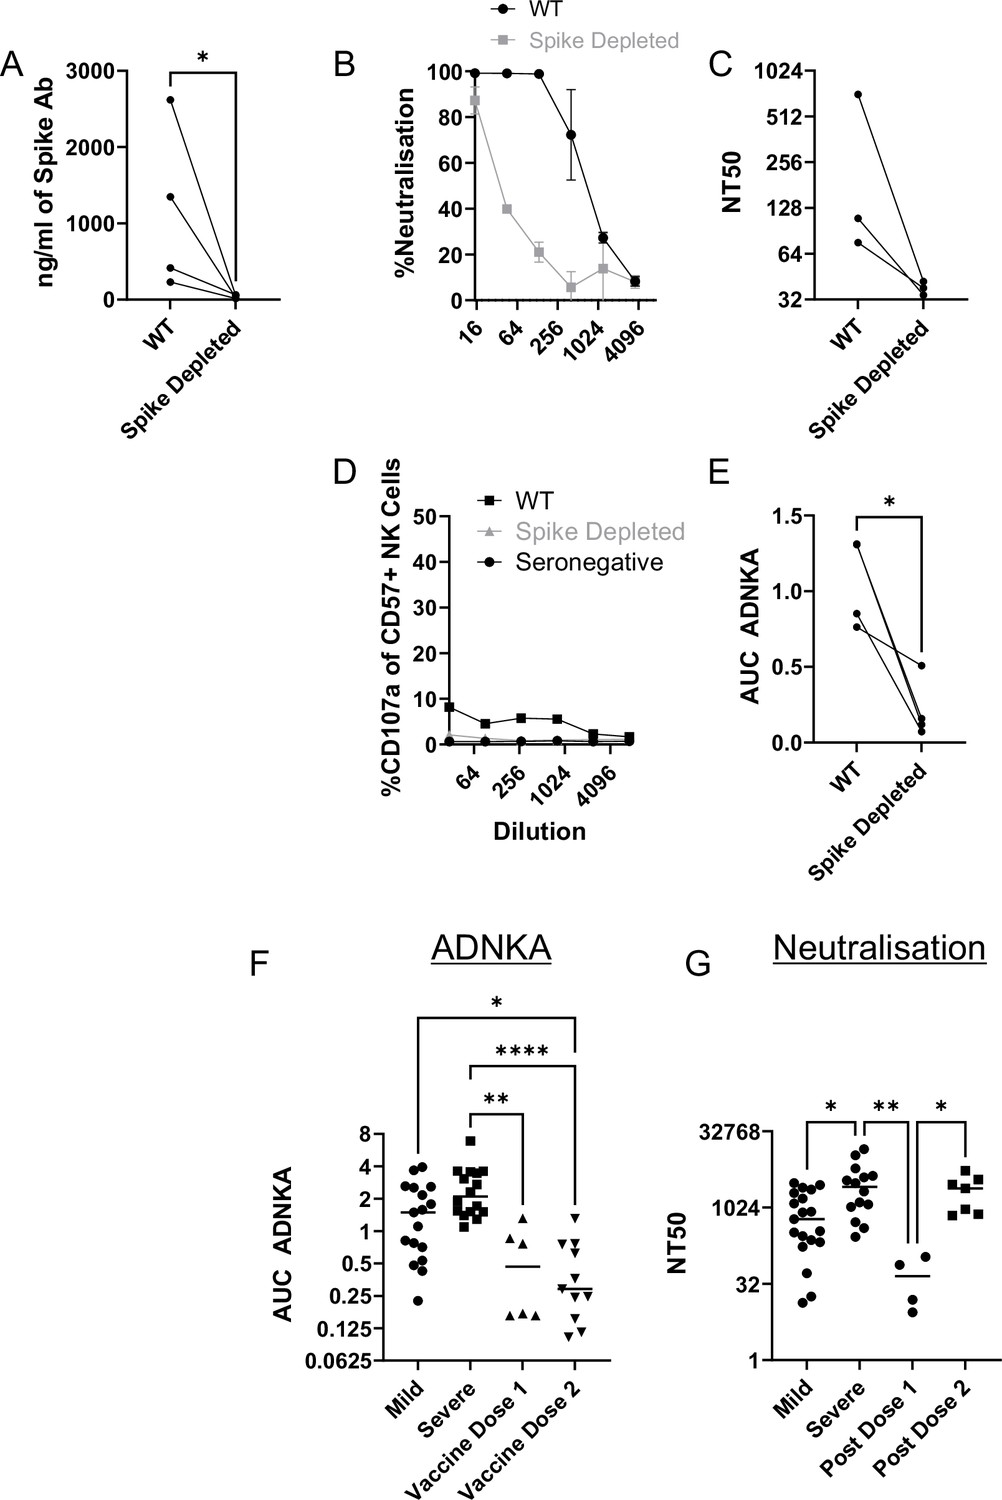
Vaccine responses focussed on spike are weak activators of ADNKA.
Serums from donors that had been vaccinated against SARS-CoV-2 but were seronegative prior to vaccination were depleted of anti-spike antibodies using spike trimer protein conjugated to magnetic beads. (A) ELISA for spike trimer was used to measure levels of antibodies before and after depletion. (B, C) The ability of the original, or anti-spike depleted, serums to neutralise the ability of SARS-CoV-2 to infect VeroE6 cells was determined across a range of concentrations, then NT50 values calculated. Example plots (B) and NT50 values for multiple donors (C) are shown. (D, E) AAT cells were either mock infected, or infected with SARS-CoV-2 for 24 h (MOI = 5), detached using TrypLE, then mixed with PBMC in the presence of golgistop, CD107a antibody, and serial dilutions of serum. After 5 hr, cells were stained for CD3, CD56, CD57, and live/dead aqua, then analysed by flow cytometry for the percentage of CD107a positive CD57 +NK cells. AUC values were then calculated. All serums were additionally tested against mock infected cells to ensure no non-specific NK activation occurred (not shown). Example plots (D) and AUC values for multiple donors (E) are shown. Note that (D) is plotted on the same scale as Figure 8D to enable easy comparisons. Neutralisation (F) and ADNKA (G) values are compared for samples categorised according to disease or vaccination status. Kruskal–Wallis *p<0.05, **p<0.001.
Tables
Key resources table
| Reagent type (species) or resource | Designation | Source or reference | Identifiers | Additional information |
|---|---|---|---|---|
| Strain, Strain Background (SARS-CoV-2) | England 2 | Public Health England | Genome identical to NC_045512 | |
| Cell Line (Human) | A549 | ATCC | CCL-185 | |
| Cell Line (African Green Monkey) | VeroE6 | ATCC | CCL-81 | |
| Antibody | Mouse Monoclonal anti-CD107a-FITC | Biolegend | Cat No. 328,606 | Flow cytometry (1:100) |
| Antibody | Mouse monoclonal anti-CD56-BV605 | Biolegend | Cat No. 362,538 | Flow cytometry (1:100) |
| Antibody | Mouse monoclonal anti-CD3-PC7 | Biolegend | Cat No. 300,420 | Flow cytometry (1:100) |
| Antibody | Mouse monoclonal anti-CD57-APC | Biolegend | Cat No. 359,610 | Flow cytometry (1:100) |
| Antibody | Mouse monoclonal anti-B7-H6 | Biotechne | Cat No. MAB7144 | Flow cytometry (1:50) |
| Antibody | Mouse monoclonal anti-Nectin-1 | Biolegend | Cat No. 340,402 | Flow cytometry (1:200) |
| Antibody | Mouse monoclonal anti-MICA | BAMOMAB | Cat No. AMO1-100 | Flow cytometry (1:200) |
| Antibody | Mouse monoclonal anti-ULBP2 | BAMOMAB | Cat No. BUMO1 | Flow cytometry (1:200) |
| Antibody | Mouse monoclonal anti-Spike | Insight | Cat No. GTX632604 | Flow cytometry (1:500) |
| Antibody | Mouse monoclonal anti-Nucleocapsid | Stratech | Cat No. BSM-41411M | Flow Cytometry (1:300) |
| Antibody | Goat polyclonal anti-mouse IgG-AF647 | Thermo Fisher | Cat No. A-21235 | Flow Cytometry (1:500) |
| Antibody | Mouse monoclonal CD3-BV711 | Biolegend | Cat No. 344,837 | Flow cytometry (1:100) |
| Antibody | Mouse monoclonal CD57-PECy7 | Biolegend | Cat No. 359,623 | Flow cytometry (1:100) |
| Antibody | Mouse monoclonal TNFα–BV421 | Biolegend | Cat No. 502,931 | Flow cytometry (1:100) |
| Antibody | Mouse monoclonal IFNγ–APC | Biolegend | Cat No. 502,511 | Flow cytometry (1:100) |
| Antibody | Goat polyclonal Anti-mouse AF594 | Thermofisher | Cat No. A48288 | IFA (1:500) |
| Antibody | Human monoclonal anti-nucleocapsid | Acro | Cat No. NUN-S41 | Flow cytometry (10 μg/ml) |
| Other | Phalloidin-AF488 | Thermofisher | Cat No. A12379 | IFA (1:100) |
| Commercial assay, kit | Anti-spike | Acro | RAS-T025 | |
| Commercial assay, kit | Anti-Spike Magnetic beads | Acro | MBS-K015 | |
| Commercial assay, kit | Anti-nucleocapsid Magnetic Beads | Acro | MBS-K017 |
Additional files
-
Supplementary file 1
Processed Plasma Membrane Proteomics dataset.
- https://cdn.elifesciences.org/articles/74489/elife-74489-supp1-v3.xlsx
-
Supplementary file 2
List of interferon inducible genes identified in the filtered PM dataset.
- https://cdn.elifesciences.org/articles/74489/elife-74489-supp2-v3.docx
-
Supplementary file 3
Clinical characteristics of patients giving longitudinal serum samples.
- https://cdn.elifesciences.org/articles/74489/elife-74489-supp3-v3.docx
-
Supplementary file 4
Monoclonal Anti-spike Antibodies used, data taken from Seow et al., 2020.
- https://cdn.elifesciences.org/articles/74489/elife-74489-supp4-v3.docx
-
MDAR checklist
- https://cdn.elifesciences.org/articles/74489/elife-74489-mdarchecklist1-v3.docx
-
Source data 1
Western Blot Source Data Information.
Raw files for Figure 3B are provided as follows: Data 1 = MICA, Data 2 = Actin, Data 3 = Spike (all samples from RAd-MICA experiment). Data 4 = ULBP2, Data 5 = Actin, Data 6 = Spike (all samples from RAd-ULBP2 experiment). Data 7 = B7-H6, Data 8 = Actin, Data 9 = Spike (all samples from RAd-B7-H6 experiment). Raw files for Figure 3C are provided as follows: Data 1 = MICA, Data 2 = B7-H6, Data 3 = Actin, Data 4 = Spike Raw Files for Figure 4A are provided as follows: Data 1 = MICA, Data 2 = B7-H6, Data 3 = GFP, Data 4 = Actin
- https://cdn.elifesciences.org/articles/74489/elife-74489-data1-v3.zip
Download links
A two-part list of links to download the article, or parts of the article, in various formats.
Downloads (link to download the article as PDF)
Open citations (links to open the citations from this article in various online reference manager services)
Cite this article (links to download the citations from this article in formats compatible with various reference manager tools)
SARS-CoV-2 host-shutoff impacts innate NK cell functions, but antibody-dependent NK activity is strongly activated through non-spike antibodies
eLife 11:e74489.
https://doi.org/10.7554/eLife.74489


