The metabolome of Mexican cavefish shows a convergent signature highlighting sugar, antioxidant, and Ageing-Related metabolites
- Stowers Institute for Medical Research, United States
- Department of Molecular and Integrative Physiology, University of Kansas Medical Center, United States
Figures
Figure 1
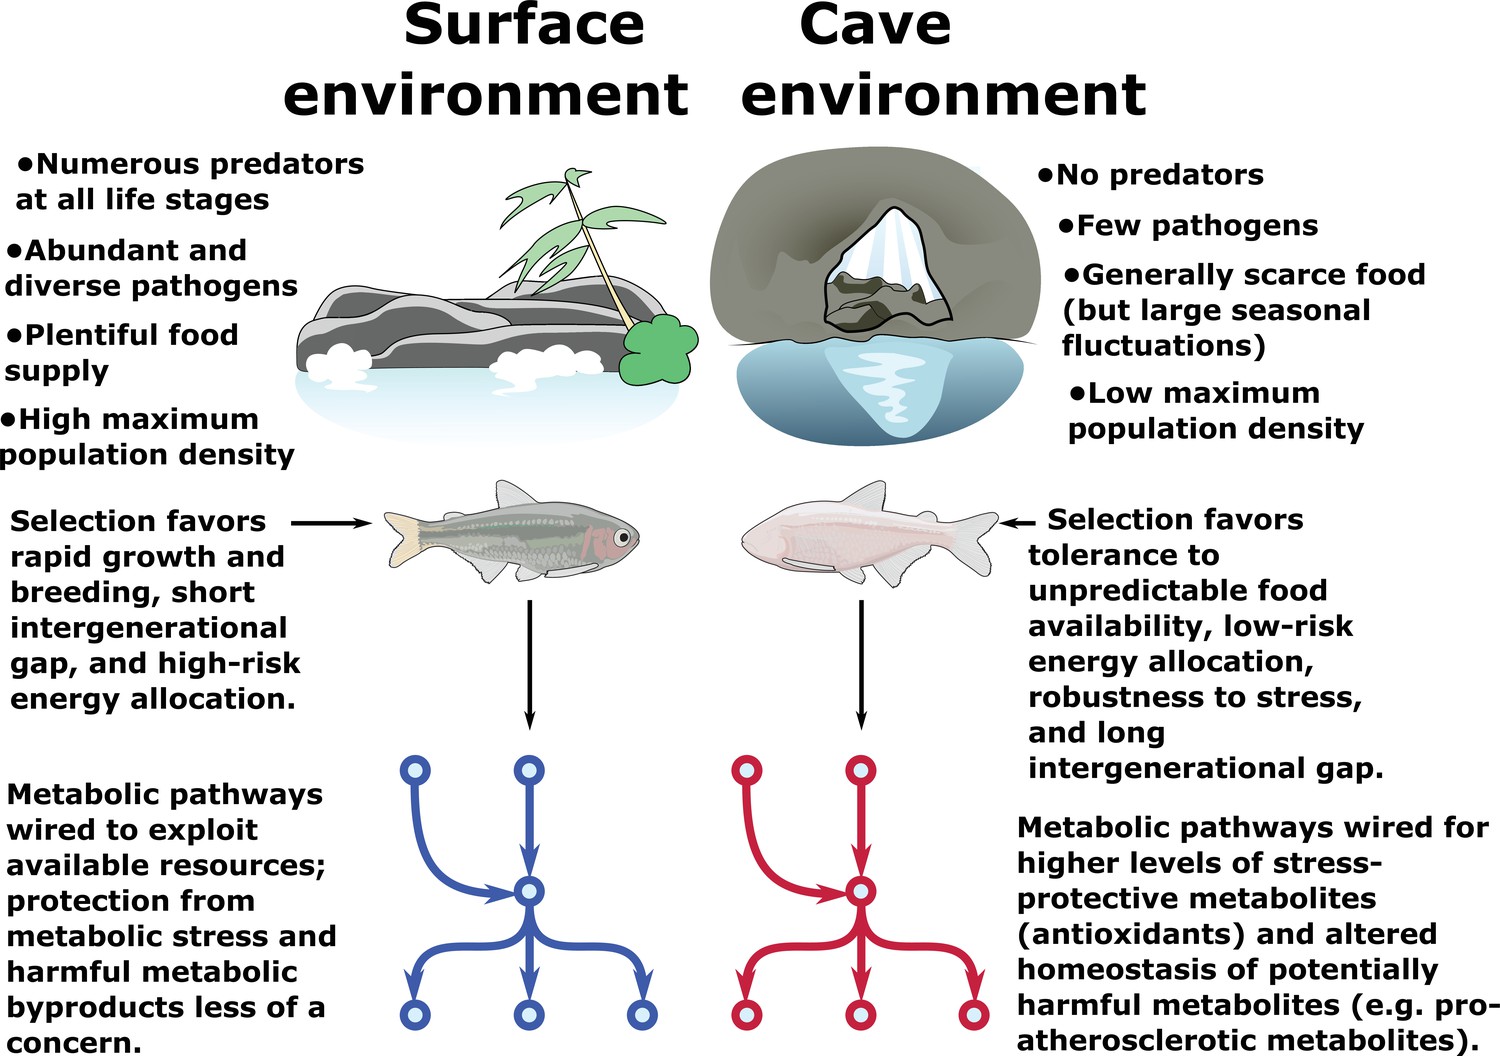
Metabolic resilience — survivability under a variety of extreme conditions.
Certain populations of cavefish have adaptations that cause increased appetite (Aspiras et al., 2015) and increased fat accumulation (Xiong et al., 2018) (in cases where nutrients are plentiful, such as in lab-raised populations). These same populations also exhibit robust health and longevity (Riddle et al., 2018; Xiong et al., 2018) and do not suffer ill-effects due to high levels of visceral fat and hyperglycemia, both of which are features of most cave populations. However, visceral fat accumulation in cave populations is highly dependent on nutrient availability and is not displayed in wild-caught specimens (Krishnan et al., 2020). Thus, cavefish paradoxically appear to tolerate both extremely low and extremely high levels of triglycerides, glucose, and other energy storage metabolites. We argue that these differences can be reconciled under a hypothesis whereby the cave environment selects not for resistance to nutrient deprivation per se, but rather resilience to a variety of nutrient availability states (such as seasonal floods). Survival under such challenging conditions ostensibly favors the ability to tolerate extreme metabolic states, including not only starvation but also high levels of potentially deleterious metabolites such as triglycerides and reactive oxygen species (ROS). We find evidence for elevated antioxidant levels and altered cholesterol / cholesteryl ester homeostasis in cavefish, suggesting that cavefish may use these mechanisms to offset potentially harmful metabolites and tolerate a broad range of metabolic conditions.
Figure 2
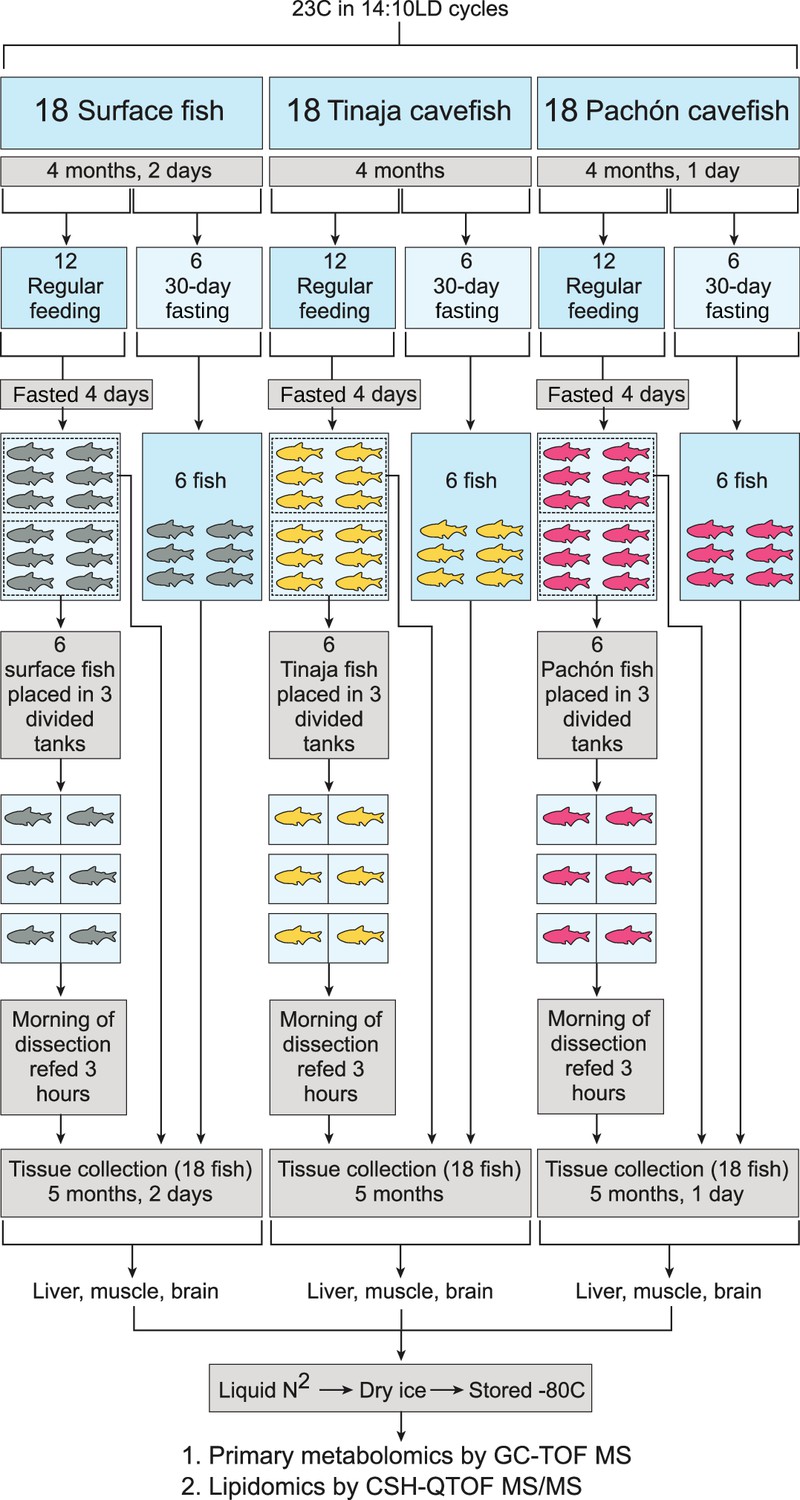
Experimental setup for each tissue and metabolite category.
Pachón, Tinaja, and surface A. mexicanus fry were raised for 4 months and then separated evenly into fasted (30–day) and non–fasted groups. At 4 days prior to collection, non–fasted fish were again divided into two groups (6 fish each) and either fasted for the remaining 4 days (first group) or fasted for 4 days and refed 3 hr prior to collection (second group). Thus, six fish were obtained for each of the following conditions: 30–day fasting, 4–day fasting, and 4–day fasting followed by re–feeding.
Figure 3
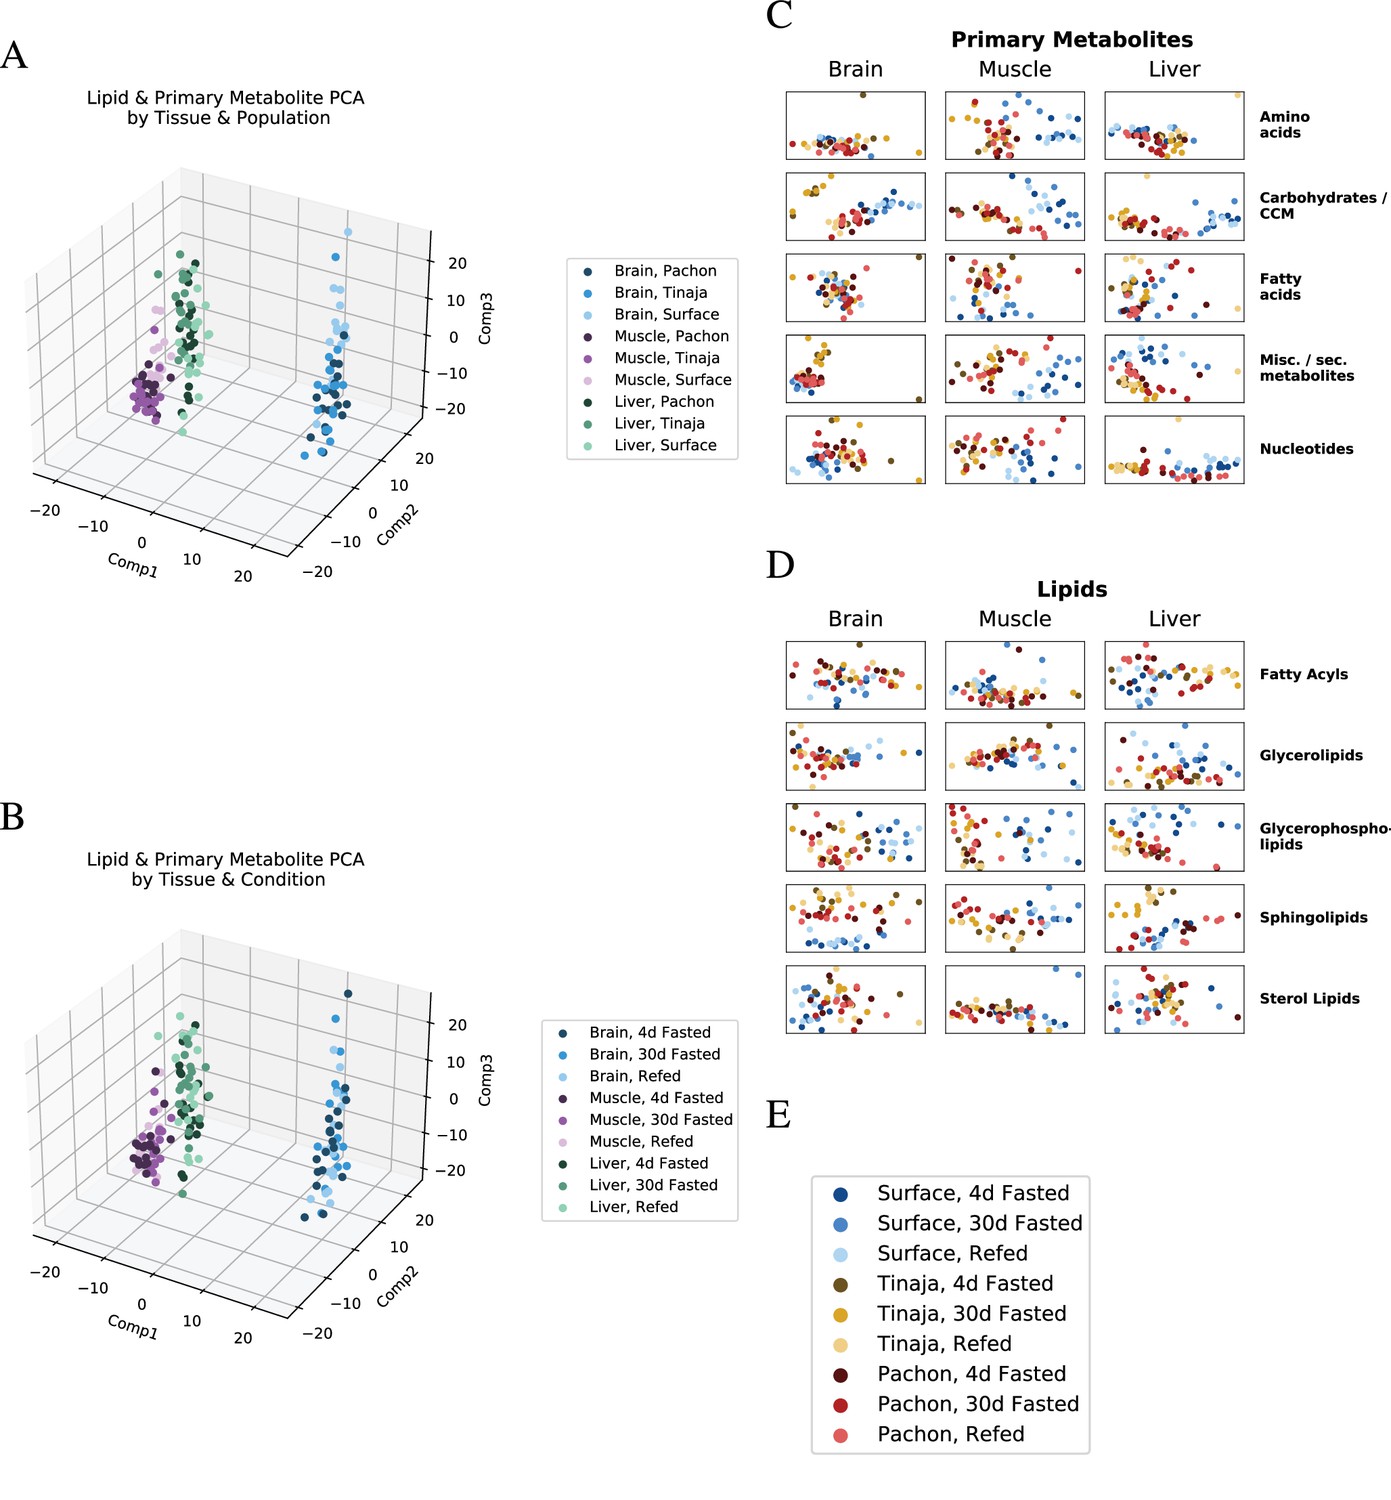
Global trends in lipid and primary metabolite data.
To visualize overall patterns in the metabolome of different experimental groups, we performed principal component analysis (PCA) first on all lipids and primary metabolites (A,B), then on individual categories thereof (C,D). Samples tend to cluster primarily by tissue of origin, in line with studies from mammals (Ma et al., 2015). Shading is by population (B) or feeding state (C). Categorical breakdown of primary metabolites (C) and lipids (D) reveals that cavefish tend to cluster closer to one another than to surface. (E) Legend for C and D.
Figure 4
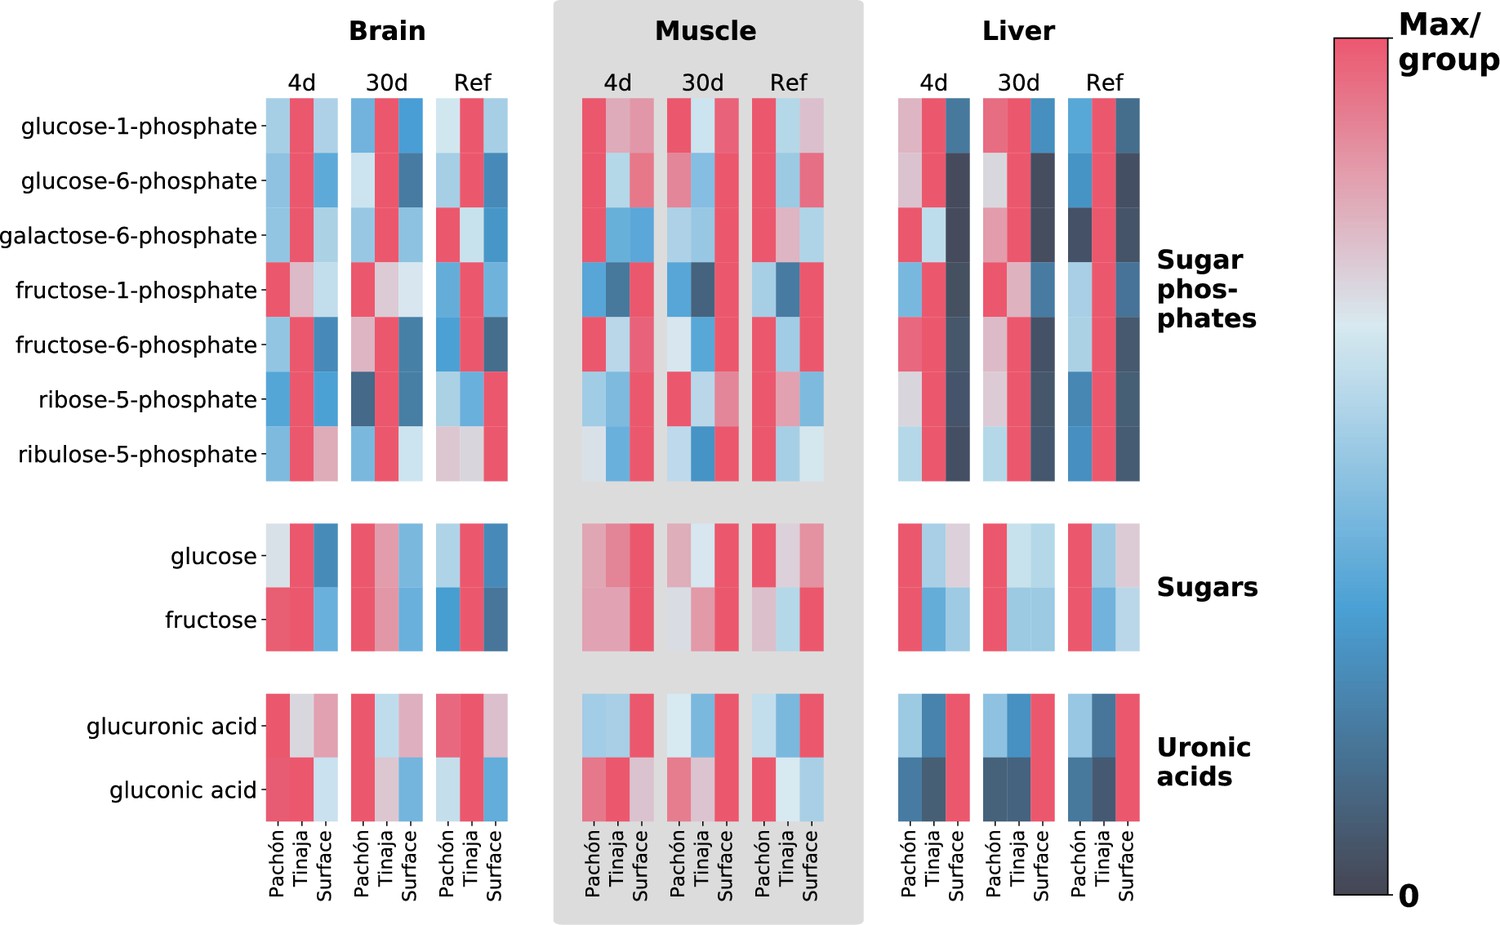
Extreme alterations to sugar metabolites in cave vs surface populations.
To show differences in cavefish sugar metabolism, we selected 5- and 6-carbon sugars, sugar phosphates, and uronic acids (oxidized forms of sugars that form building blocks of proteoglycans). The row axis shows metabolites within each of these classes, and the column axis shows different populations (short range, labels at bottom), feeding states (medium-range, labels at top) and tissues (long-range, labels at topmost point). Color indicates the mTIC-normalized peak intensity for the average of six biological replicates. Red indicates the maximum value for a given row (i.e. across all populations, tissues, and feeding states), whereas navy blue (the bottom of the color bar) corresponds to a peak intensity of zero, not to the minimum value. Thus, dark cells correspond to very little / zero intensity, as opposed to simply corresponding to the minimum intensity within the row. Given that mTIC intensities are ‘semi–quantitative’, red values thus correspond to the most abundant group for a given metabolite, and navy blue corresponds to lack of abundance.
Figure 5 with 2 supplements
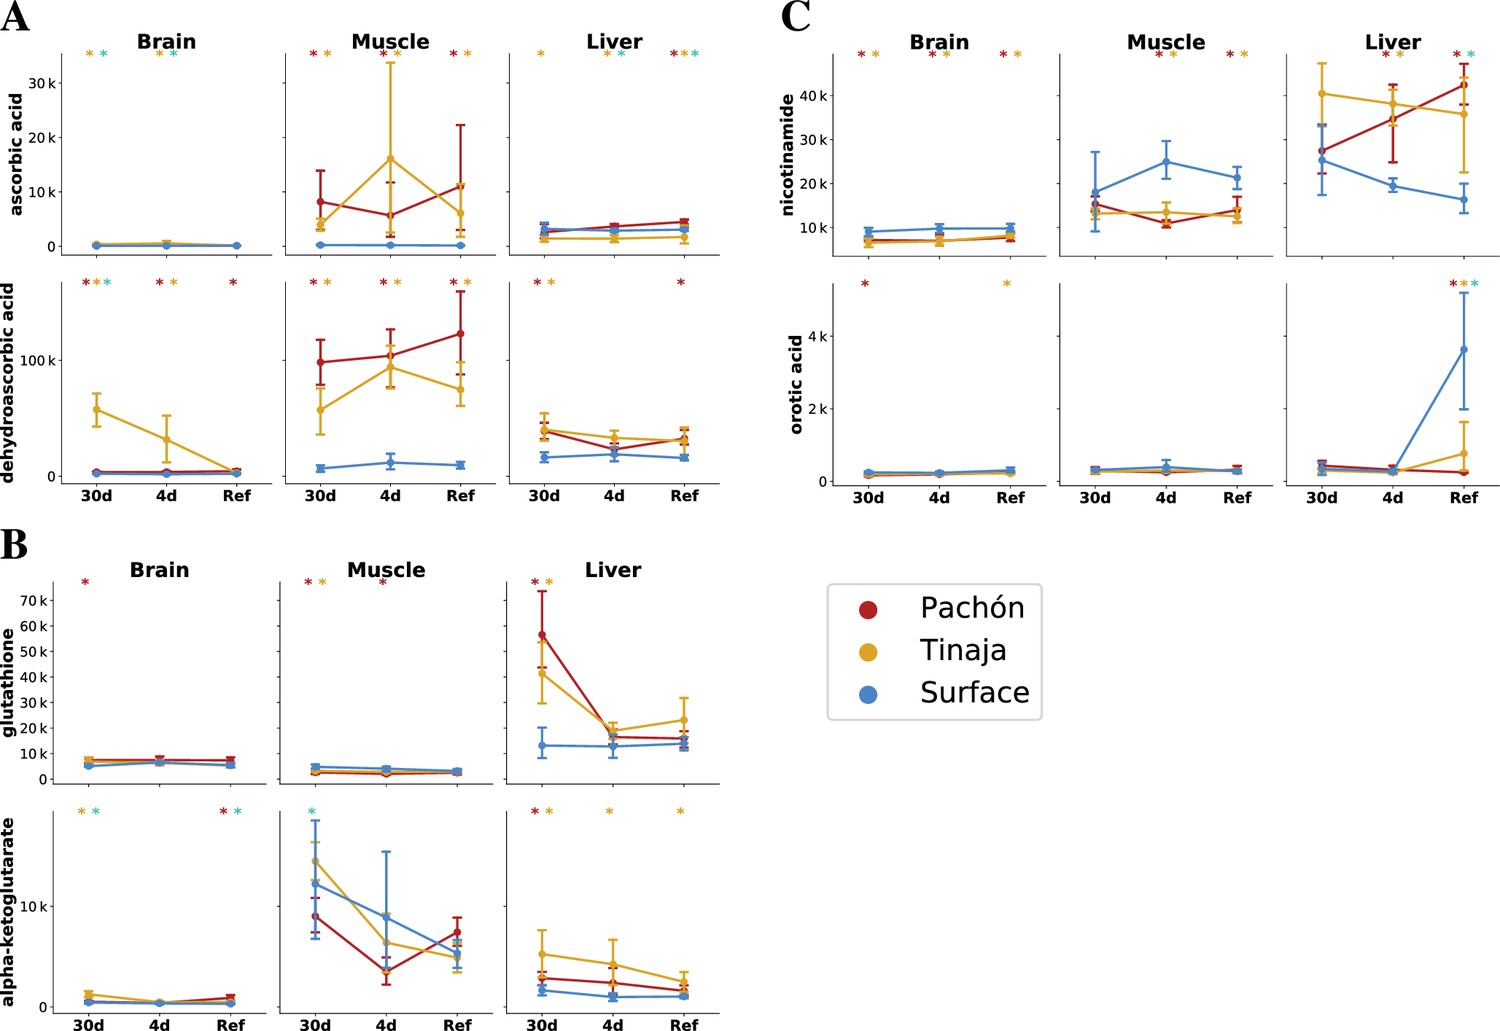
The cave and surface fish metabolome highlights differences in antioxidant availability and oxidative metabolism.
To analyze changes in redox metabolism in cave populations, we compared the abundance of potent antioxidants and redox-linked metabolites. Metabolites are plotted as mTIC-normalized peak intensities (A,B,C, error bars indicate 2.5/97.5 percentiles). Asterisks indicate significance at the 0.05 level according to an O-PLS / Bayesian logistic regression (Methods) for Pachón vs surface, Tinaja vs surface, and Pachón vs Tinaja. (A) Ascorbate (vitamin C) is a potent antioxidant and essential nutrient. Vitamin C exists as the reduced form ascorbic acid (AA) and oxidized form dehydroascorbic acid (DHAA), which can interconverted by cellular processes. (B) Glutathione, another antioxidant, is significantly increased in the liver and brain under 30-day fasting. Alpha-ketoglutarate is a tricarboxylic acid cycle (TCA) intermediate that has been linked to longevity in nematodes and mice (Chin et al., 2014; Asadi Shahmirzadi et al., 2020). (C) Nicotinamide is a precursor to NAD+ synthesis via a salvage pathway, and increased in the liver but decreased in other tissues in cavefish. Orotic acid is a metabolite that causes fatty liver disease in rats when added to a chow diet.
Figure 5—figure supplement 1
Metabolome analysis heatmaps.
Figure 5—figure supplement 2
Metabolome analysis heatmaps.
Figure 6 with 2 supplements
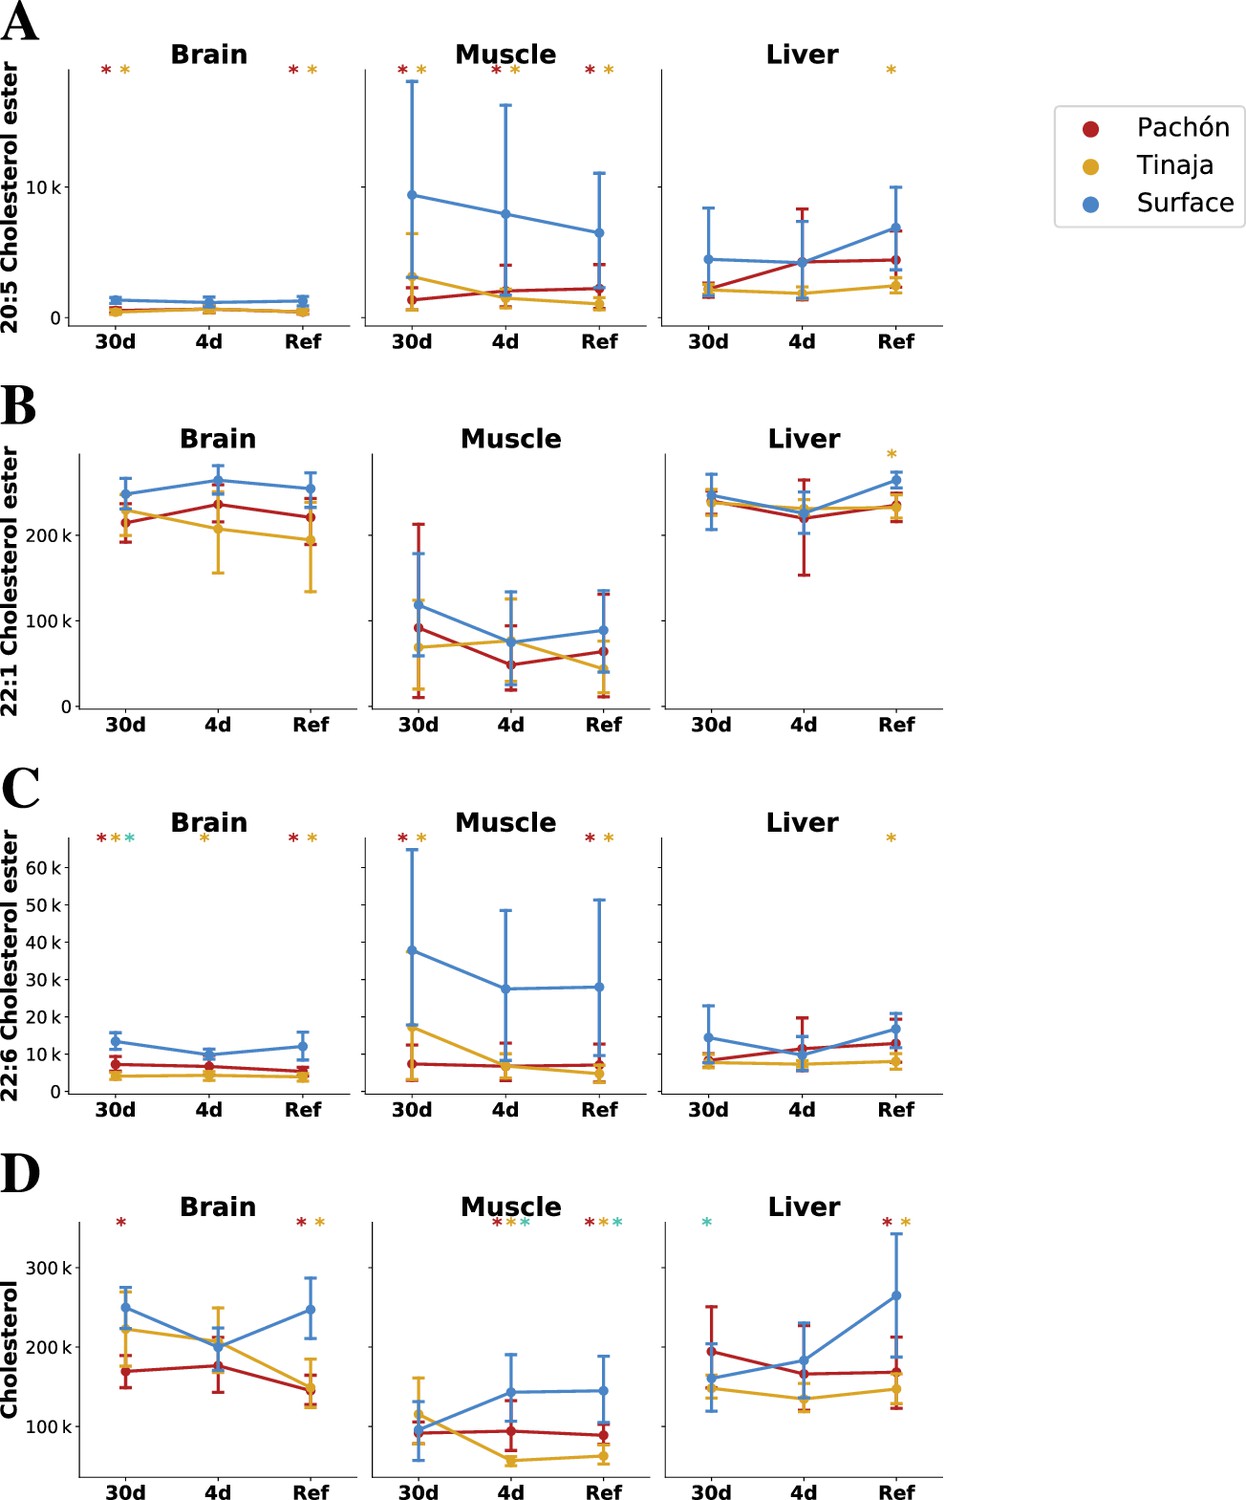
Parallel evolution in cavefish exhibits profound alteration of cholesterol / cholesteryl ester metabolism.
Cavefish possess a significant reduction in certain long-chain fatty acid cholesteryl esters (A–C) and cholesterol itself (D), particular in peripheral tissues (muscle). Values on the y–axis are mTIC-normalized peak intensities for each lipid species. Asterisks indicate significance at the 0.05 level according to an O-PLS / Bayesian logistic regression (Methods) for Pachón vs surface, Tinaja vs surface, and Pachón vs Tinaja.
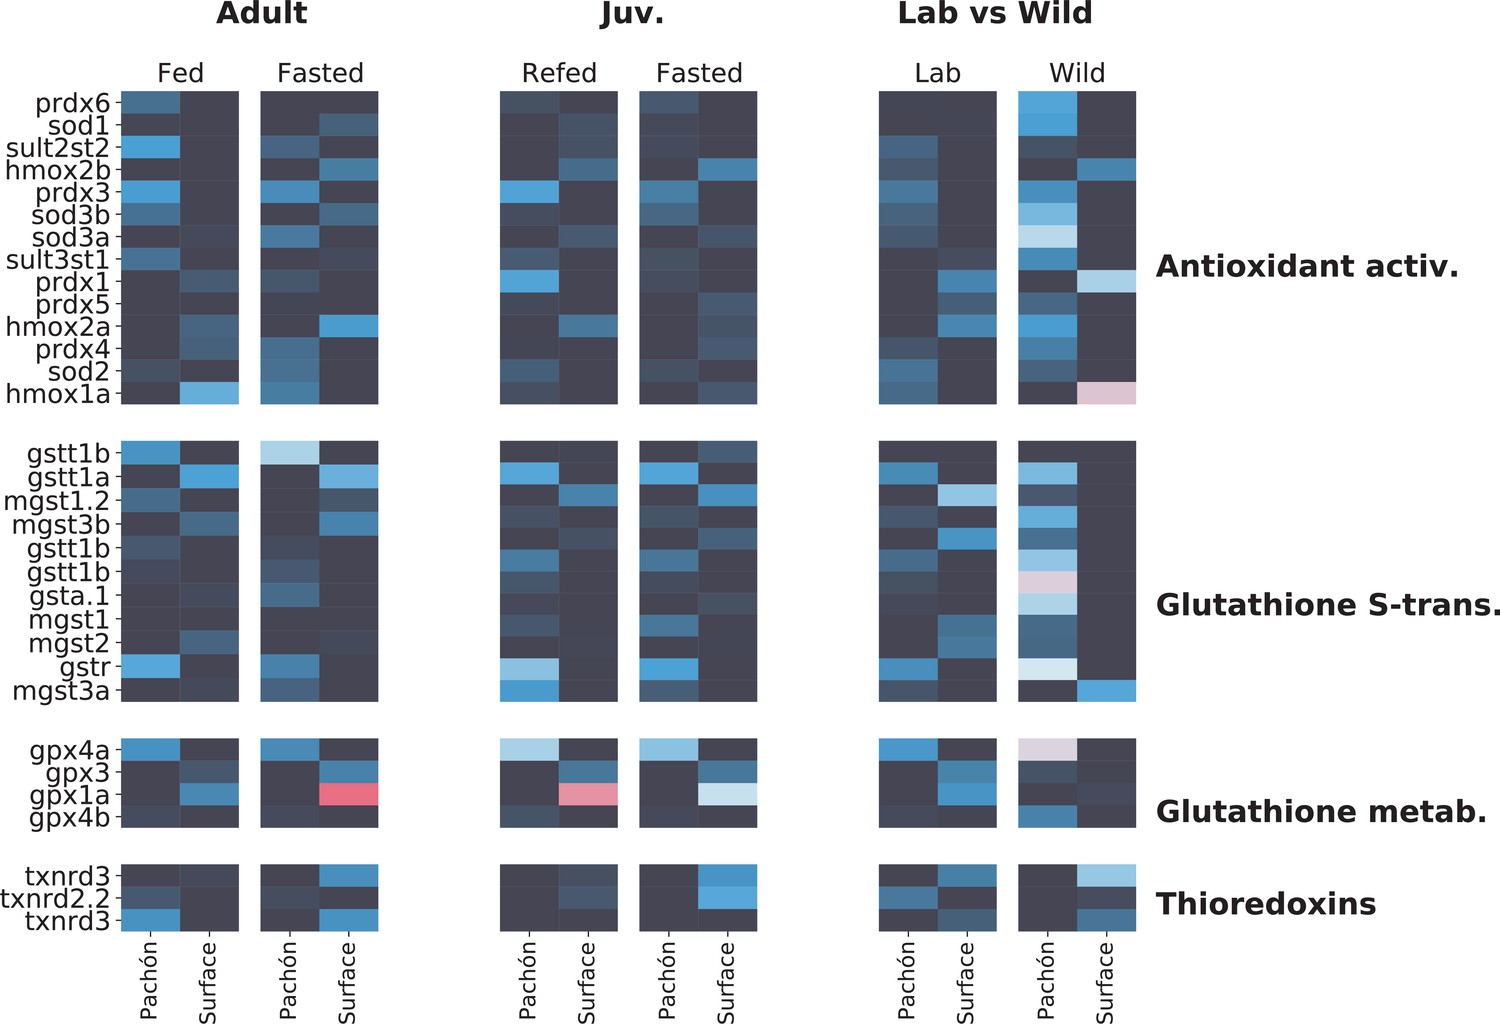
Figure 6—figure supplement 1
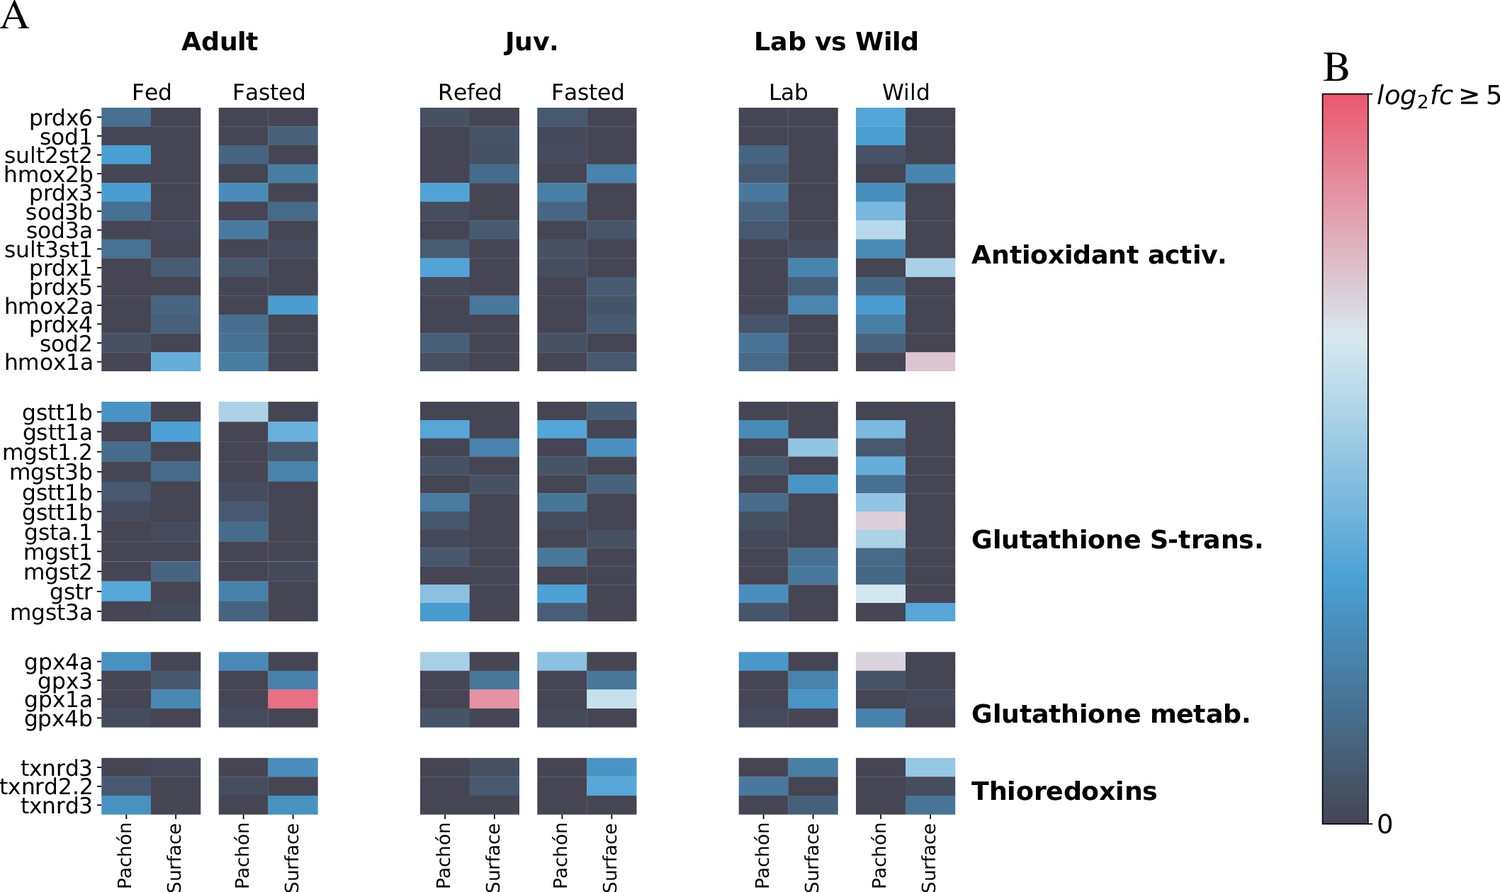
Metabolic themes of A. mexicanus cave adaptation revealed by three independent RNA-Seq experiments.
To determine whether transcriptomic signatures support the notion of altered antioxidant metabolism in A. mexicanus cave populations, we compare here liver transcriptomic profiles of genes related to antioxidant metabolism in three different studies: adult (unpublished), juvenile (age-matched for this study Xiong et al., 2018), and wild vs lab (Krishnan et al., 2020) populations. Data are shown as -fold change. While age-related differences do exist, important patterns emerge between surface and cave. Notably, glutathione S-transferase rho (gstr), a key mediator of glutathione antioxidant activity, is consistently upregulated in Pachòn cavefish. Other genes such as prdx3 (perodiredoxin 3) and gpx4a (glutathione peroxidase) are also elevated in cavefish, whereas gpx1a, another glutathione peroxidase is upregulated in surface (but this difference disappears in wild populations). The latter could indicate the presence of additional stress in the lab environment for surface fish.
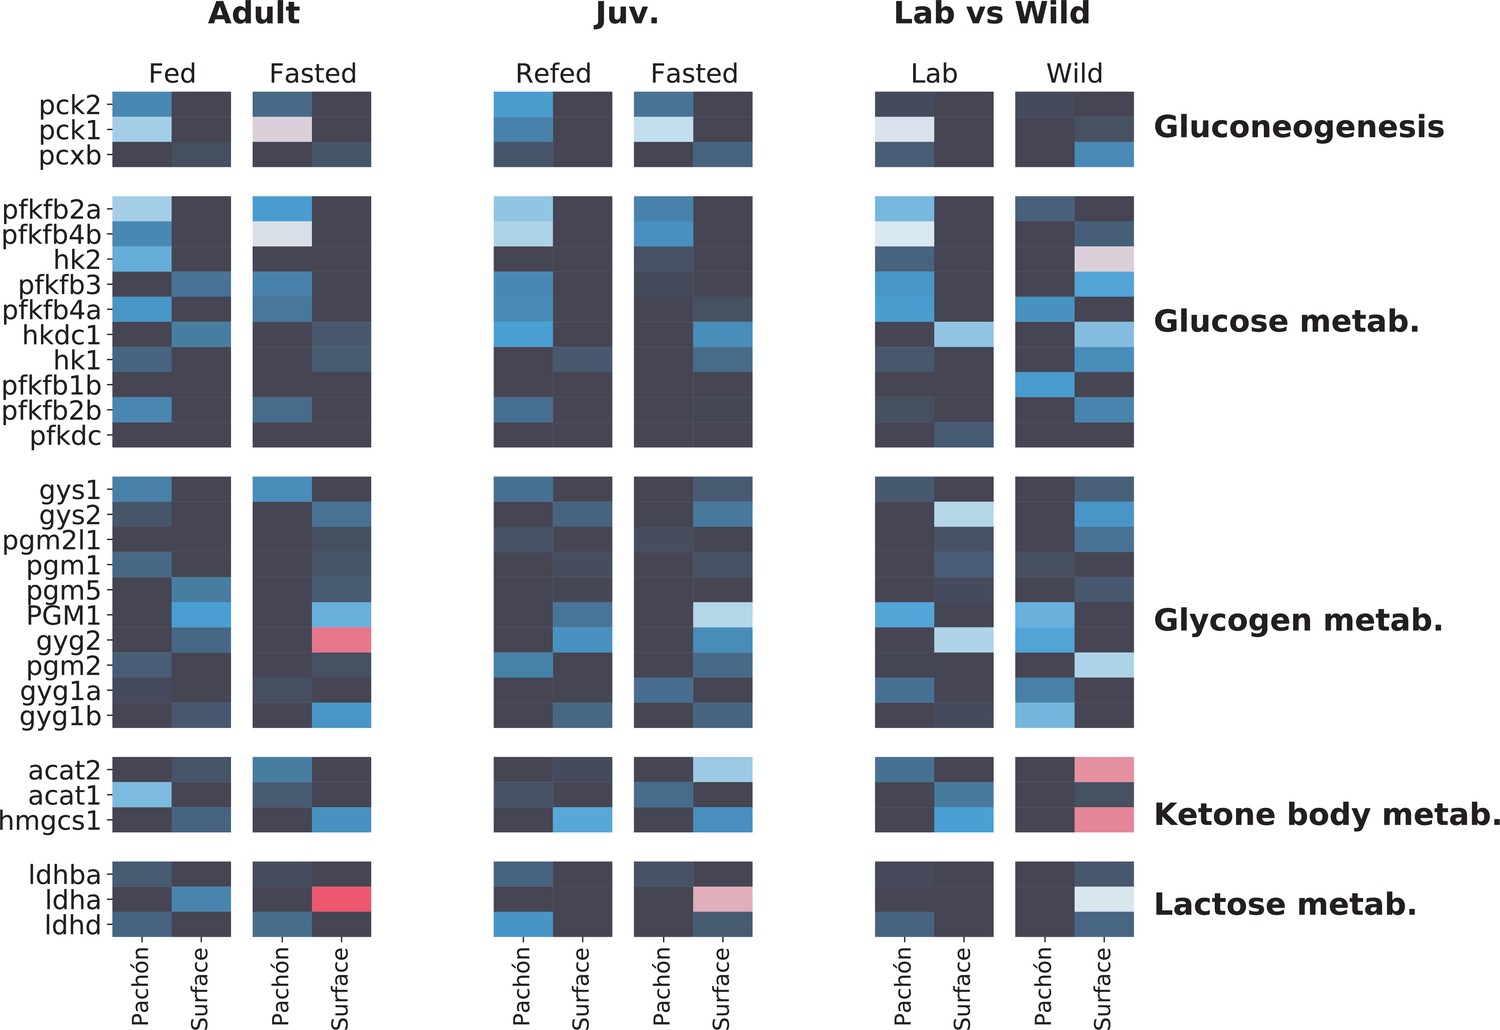
Figure 6—figure supplement 2
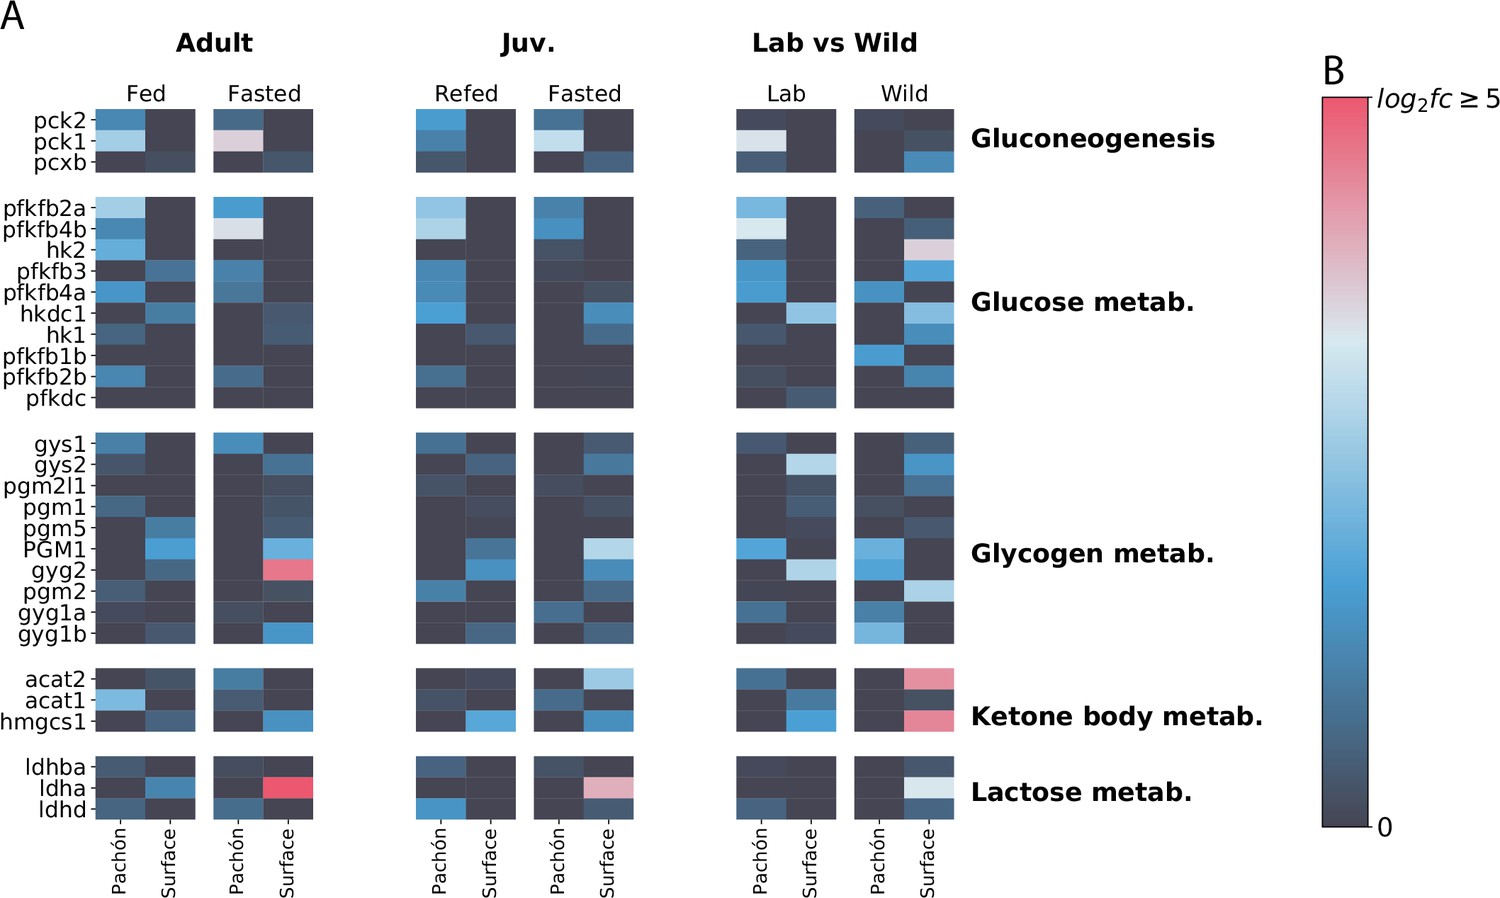
Profile of sugar / energy metabolism-related gene expression.
Focusing on sugar and energy metabolites reveals interesting although somewhat less concerted patterns of gene expression in surface and cave. Phosphoenolpyruvate carboxykinase (pck1/pck2), which catalyzes an irreversible step in gluconeogenesis, is generally upregulated in cavefish (although wild populations do not follow this pattern), whereas lactate dehydrogenase A (ldha) is upregulated in surface. However, Ldha is a bifunctional enzyme, and can be difficult to interpret as a proxy for gluconeogenesis activity. The signature of wild populations appears to deviate considerably from lab-raised populations.
Figure 7 with 5 supplements
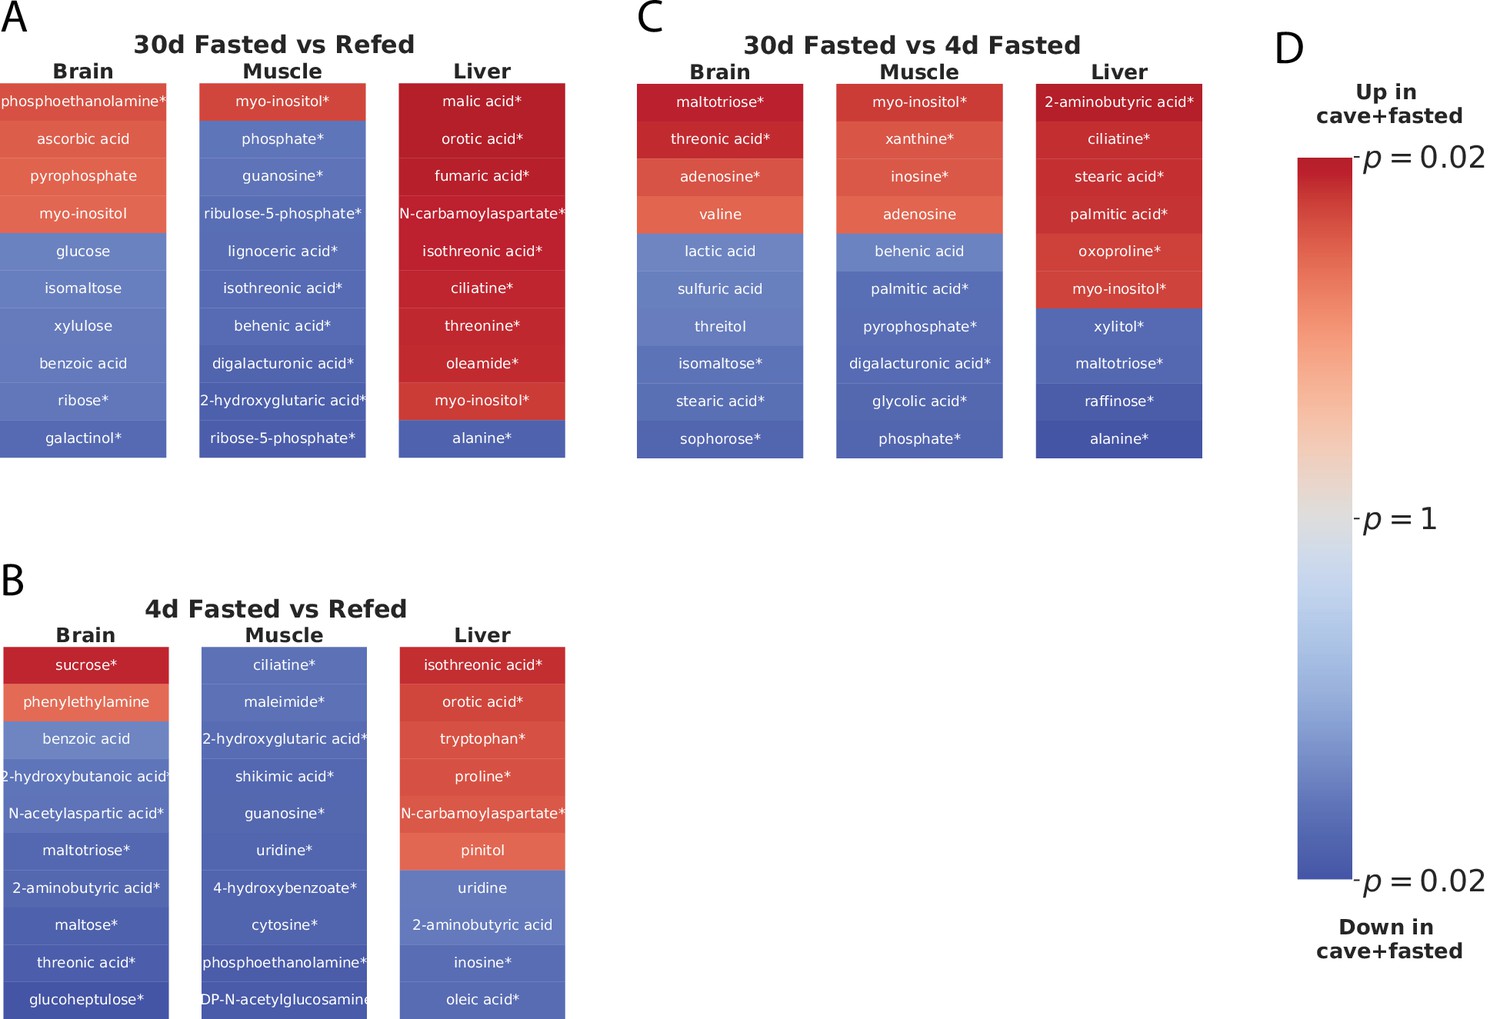
Parallel adaptive metabolic signature in response to food deprivation in cave populations.
To identify metabolites linked to adaptations promoting survival in a nutrient-limited environment shared between cave populations, we fit an O-PLS / GLM statistical model to the response to fasting, that is the difference between 30-day fasting and refeeding for Pachón, Tinaja, and surface populations. Specifically, we fitted a Bayesian GLM (see Methods) to the linear combination , with , , and referring to the normalized z-scores for each Pachón, Tinaja, and surface sample respectively. Coloring in the figure indicates metabolites increased (red) or decreased (blue) in both cave populations in 30-day fasting (i.e. ‘up’ refers to metabolites that are increased in Pachón and Tinaja in the 30-day fasted state with respect to surface), and color intensity corresponds to log10 p-value, with lighter colors indicating less significant p-values and darker colors indicating more significance. The most significant 20 differentially abundant metabolites (regardless of direction) in each tissue for both cave populations with respect to surface are displayed. An asterisk (*) indicates significance at the 0.05 level.
Figure 7—figure supplement 1
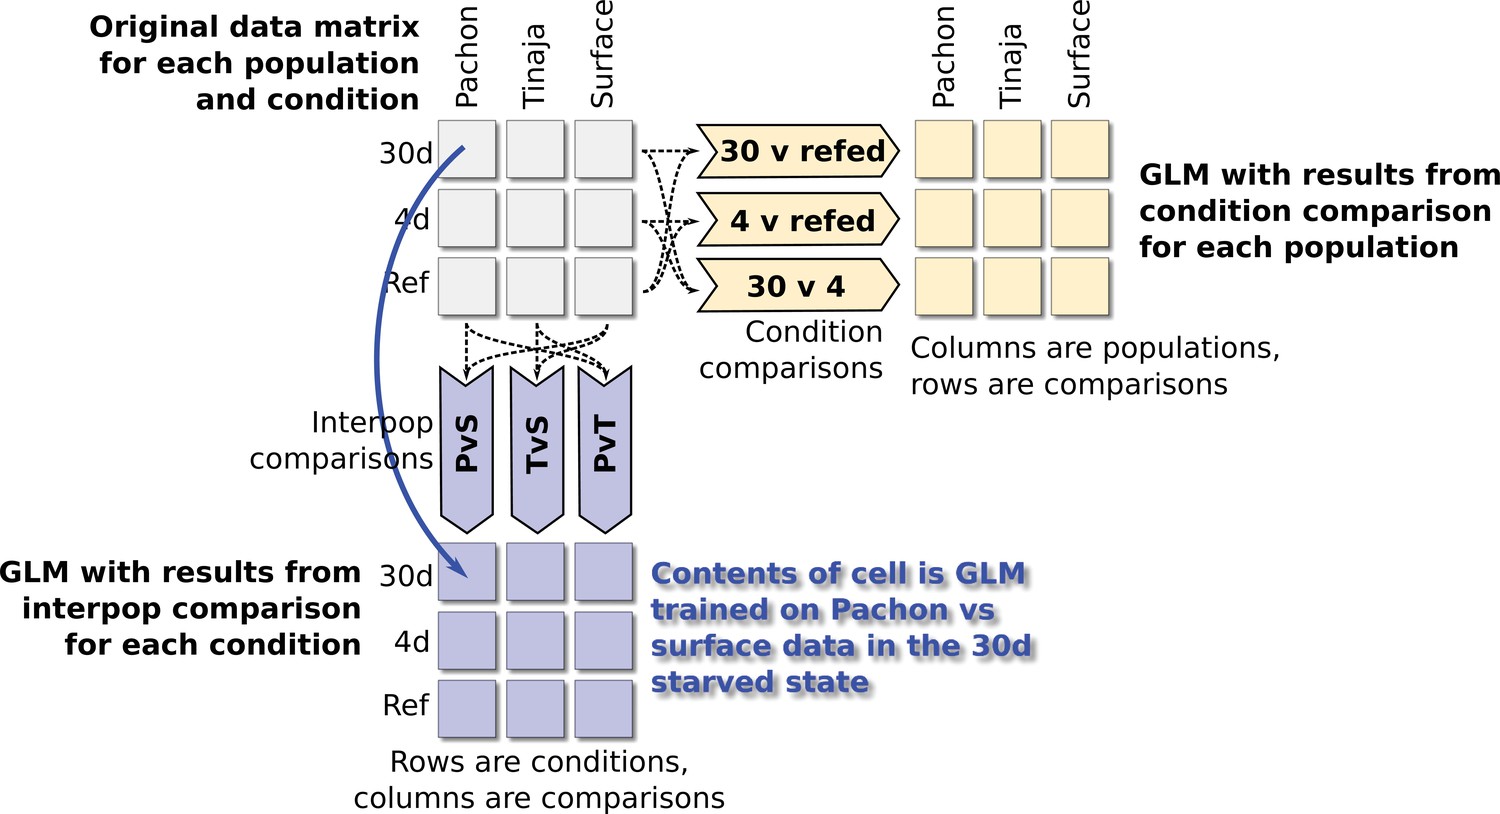
Schematic depiction of comparisons used for fitting GLM parameters.
A Bayesian logistic regression model was used to identify significant features (metabolites and categories) among different groups. To train the model, we first split the entire dataset (upper-left matrix) into two components of pairwise comparisons: a matrix containing category labels for every pairwise comparison of the three populations in our study (lower-left, for example the PvS comparison contains category labels for Pachón and surface and excludes data from Tinaja), and a separate matrix containing category labels for every pairwise comparison of feeding conditions. We then trained a Bayesian logistic regression model using the bayesglm R package using the appropriate category labels for each comparison. Predictors were either O–PLS–filtered metabolite peaks or metabolite classes (e.g. fatty acids, nucleotides, etc.).
Figure 7—figure supplement 2
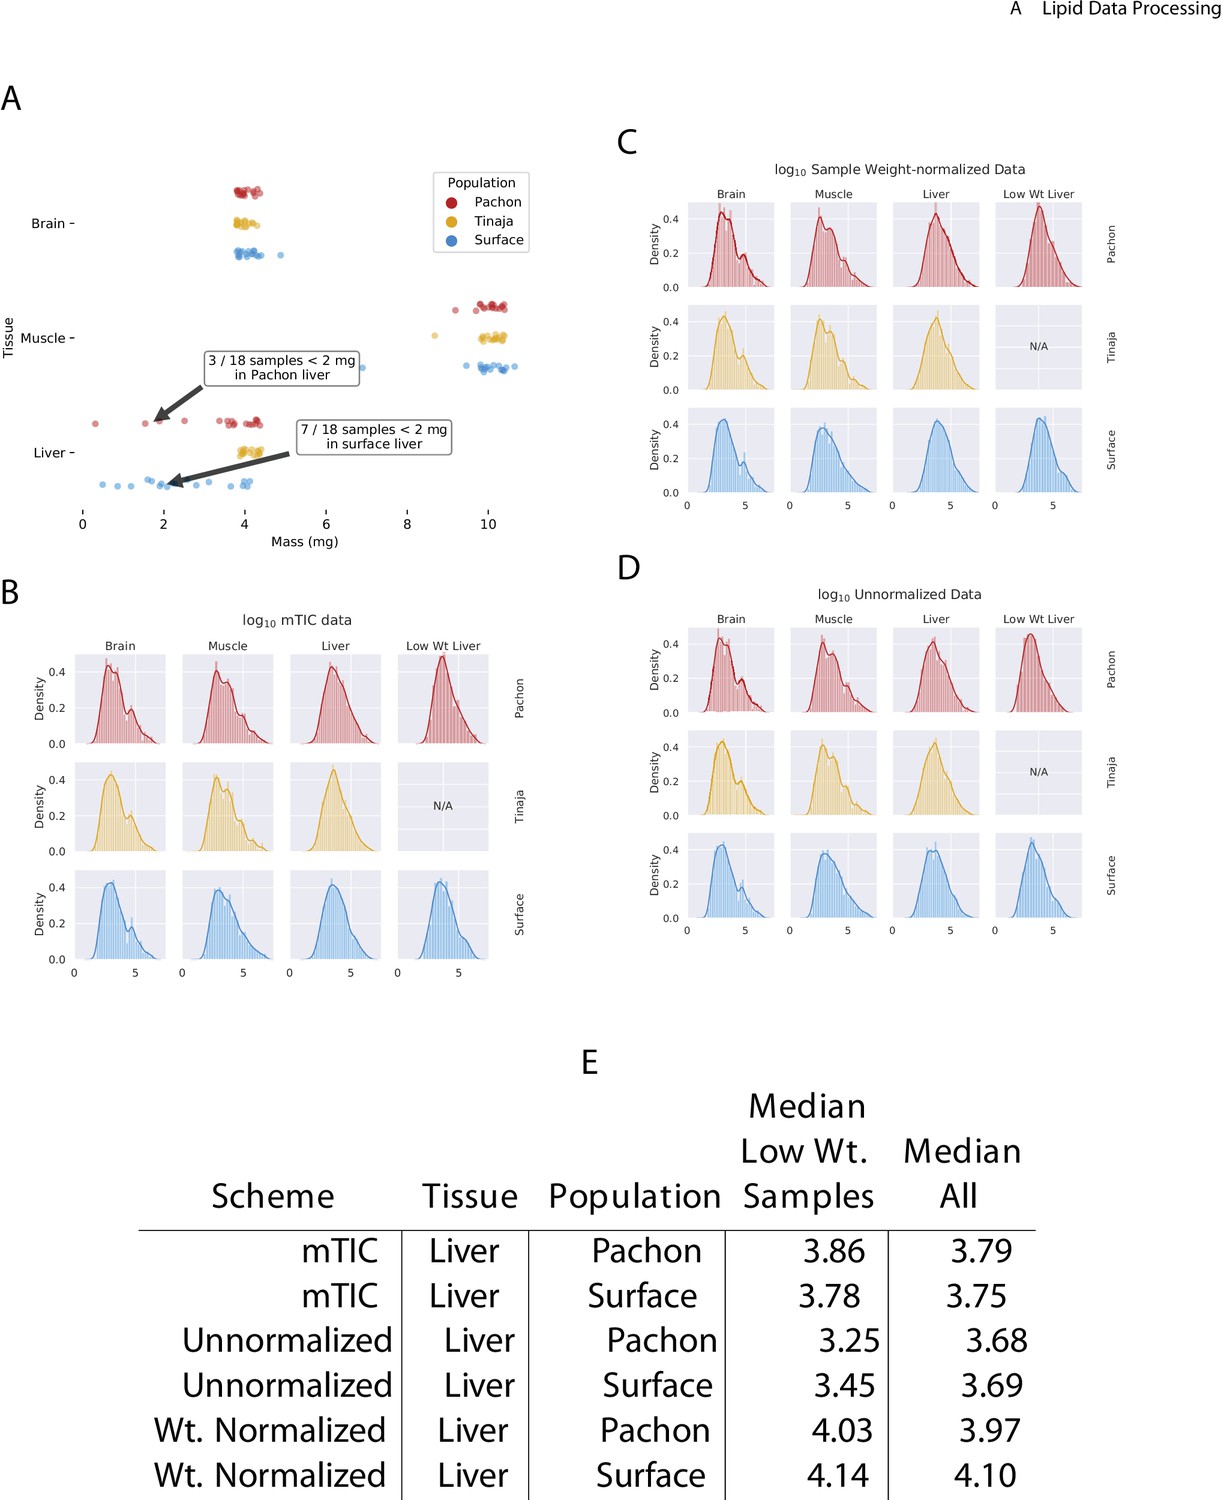
Effect of normalization scheme on peak intensity distribution.
In comparing the mass of the different tissue samples used in this study (A), we observed that liver samples exhibited more variability than muscle or brain. In particular, some liver samples of Pachón and surface fish had a mass of less than 2 mg. In order to adjust for this effect, we compared three different normalization schemes: mTIC normalization (B), wherein each peak is normalized to the sum total of all identified peaks in a given sample (see Materials and methods), (C) sample weight-based normalization, where each peak is normalized according to the physical weight of its sample, and (D) unnormalized peaks. By examining the change in median peak intensity for identified compounds in each method (E), we found that mTIC normalization exhibits slightly better correction for low-weight (<2 mg) median peak intensities compared to weight-based normalization and both are superior to unnormalized data. We therefore employed mTIC normalization for the remainder of the analysis.
Figure 7—figure supplement 3
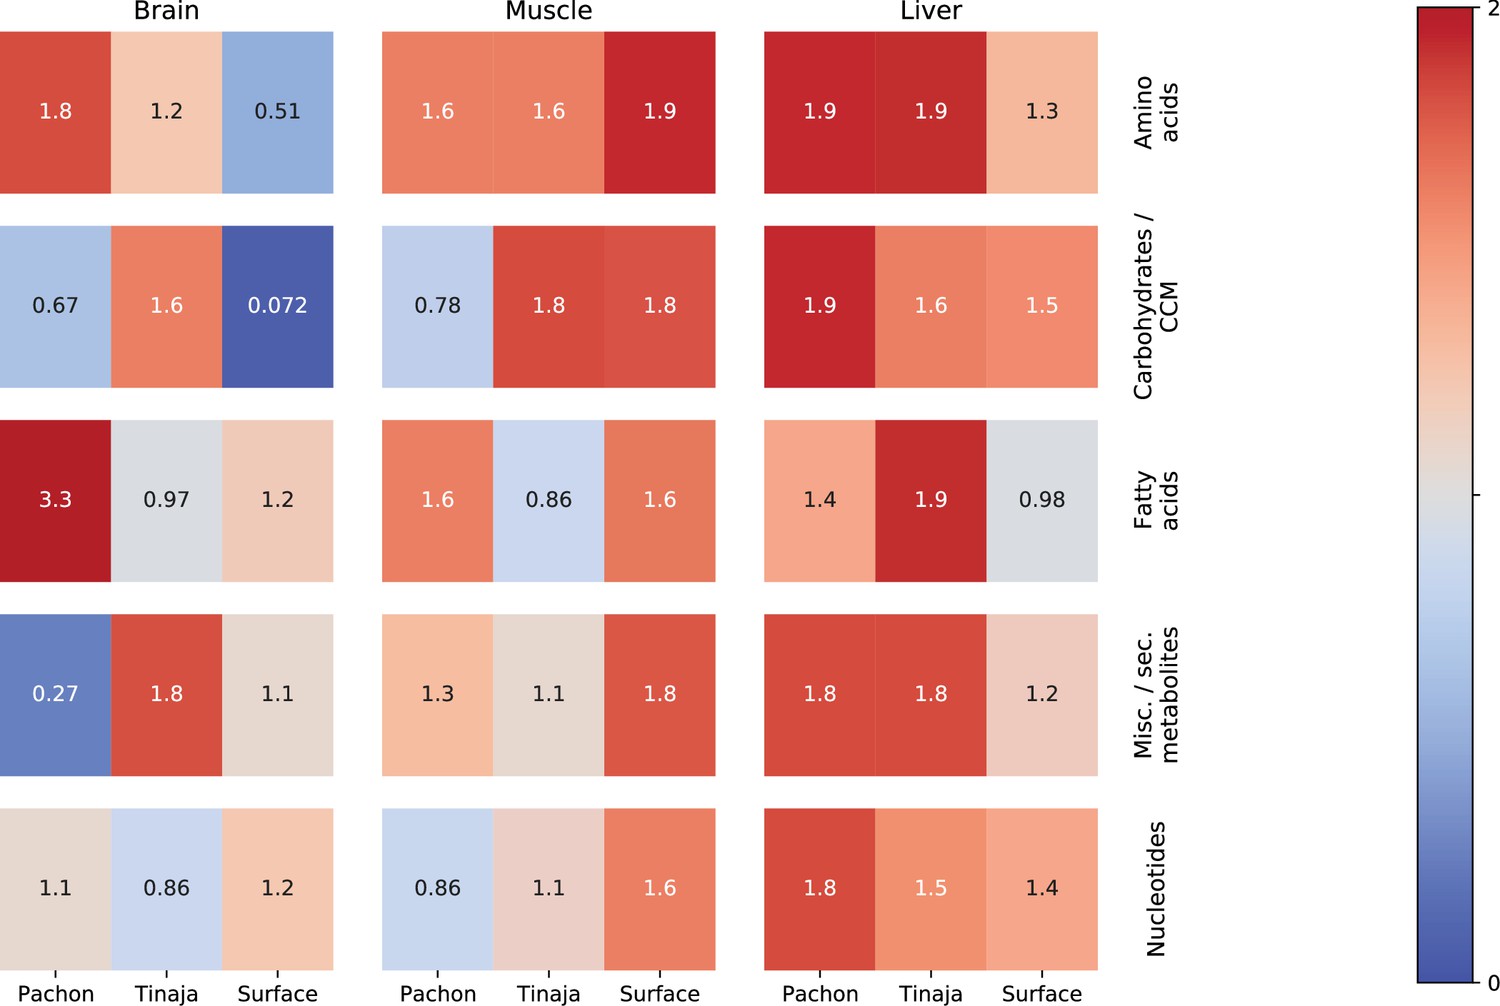
Classifier performance shows which categories of primary metabolites are most salient in the starvation response.
This figure shows values of an O-PLS / PLS classifier trained to discriminate 30-day fasted vs refed samples for different tissues, populations, and categories. O-PLS is used to produce de-noised data, which was then fitted to a single–component PLS model. The figure shows values for each classifier trained on different subsets of the data corresponding to different categories of primary metabolites. Red indicates the most robust classifiers and blue indicates the least robust. p-Values were obtained by randomly permuting the feeding state indices for 2000 iterations and computing the two-tailed survival function of a normal distribution fitted to the values of the resulting permuted samples. p-Values were adjusted for FDR using the BH method.
Figure 7—figure supplement 4
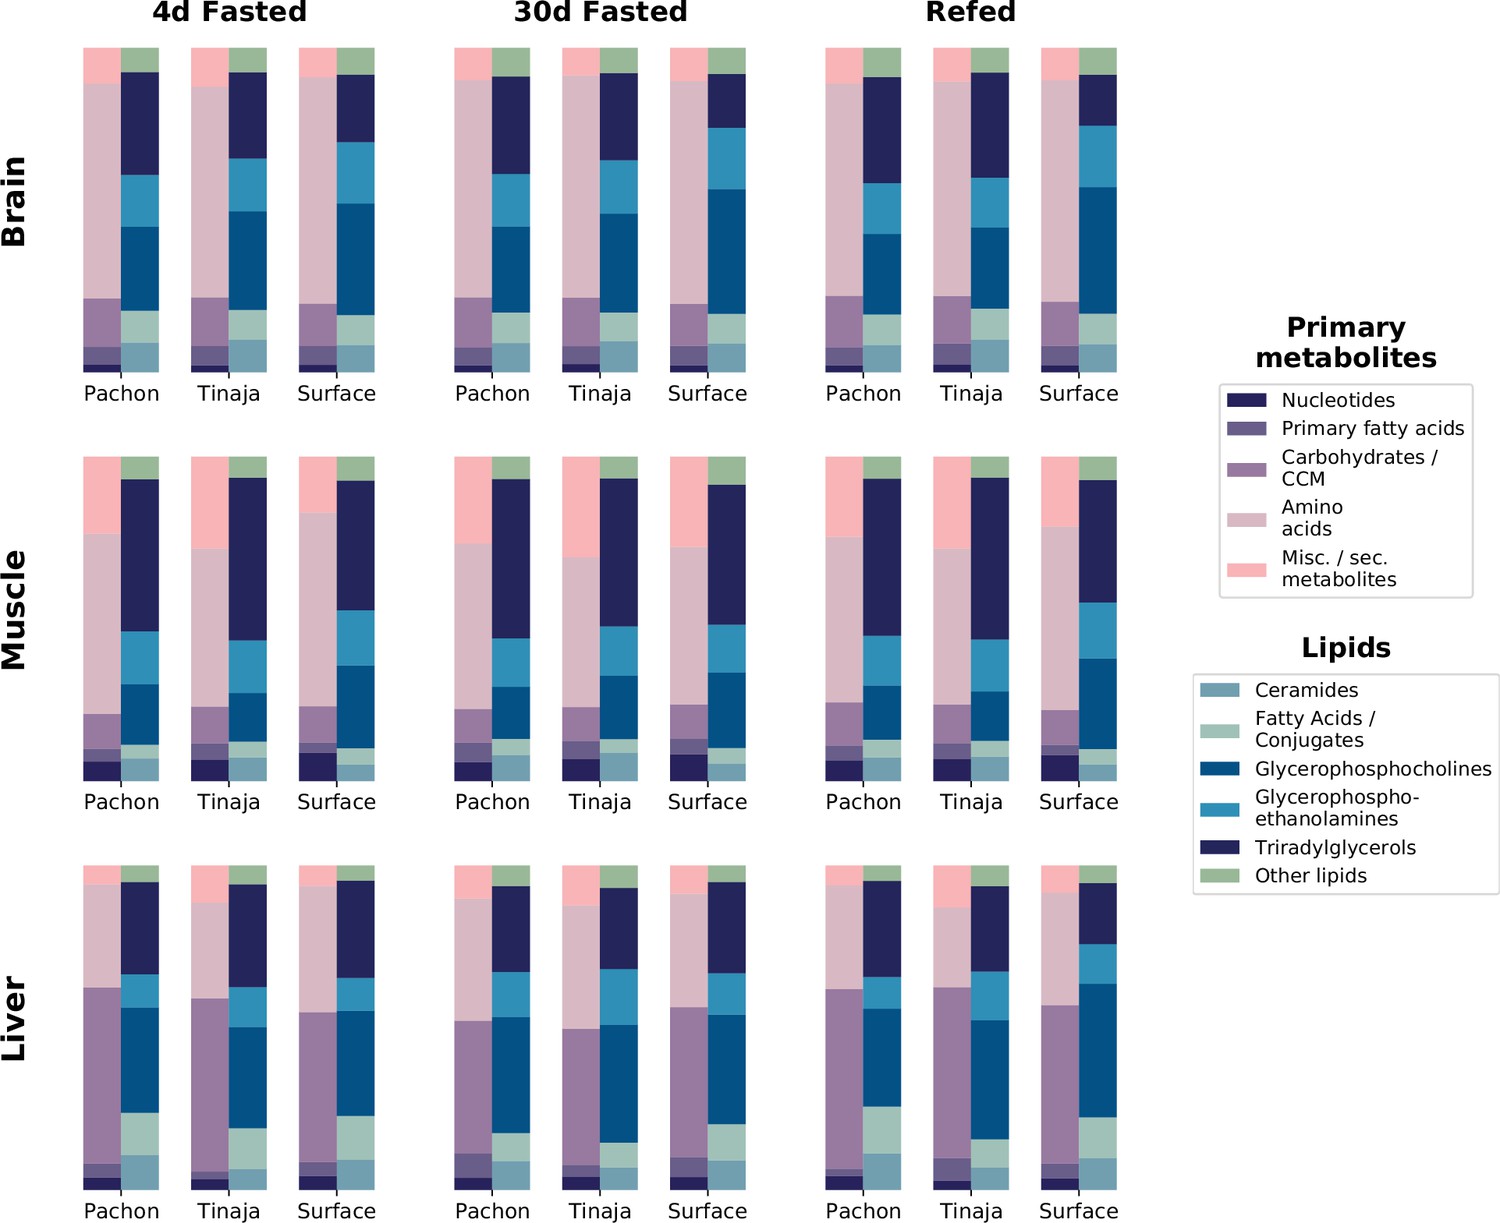
Relative composition for primary metabolites and lipid classes shows metabolome profile for different tissues, populations, and feeding states.
To determine overall composition of the metabolome for different experimental groups, category information for primary metabolites was computed based on five main categories (Materials and methods). Lipid data consists of the five most abundant lipid categories: ceramides, fatty acids and conjugates, glycerophosphocholines, and glycerophosphoethanolamines. Some metabolites, such as palmitate, were detected in both primary and lipid data. The peak intensities for all detected metabolites in these respective categories were summed across all replicates and across positive and negative modes to obtain total peak intensities for each population / condition combination. Total peak intensities were then plotted as a fraction of total peak intensity for all identified metabolites within a given experimental group.
Figure 7—figure supplement 5
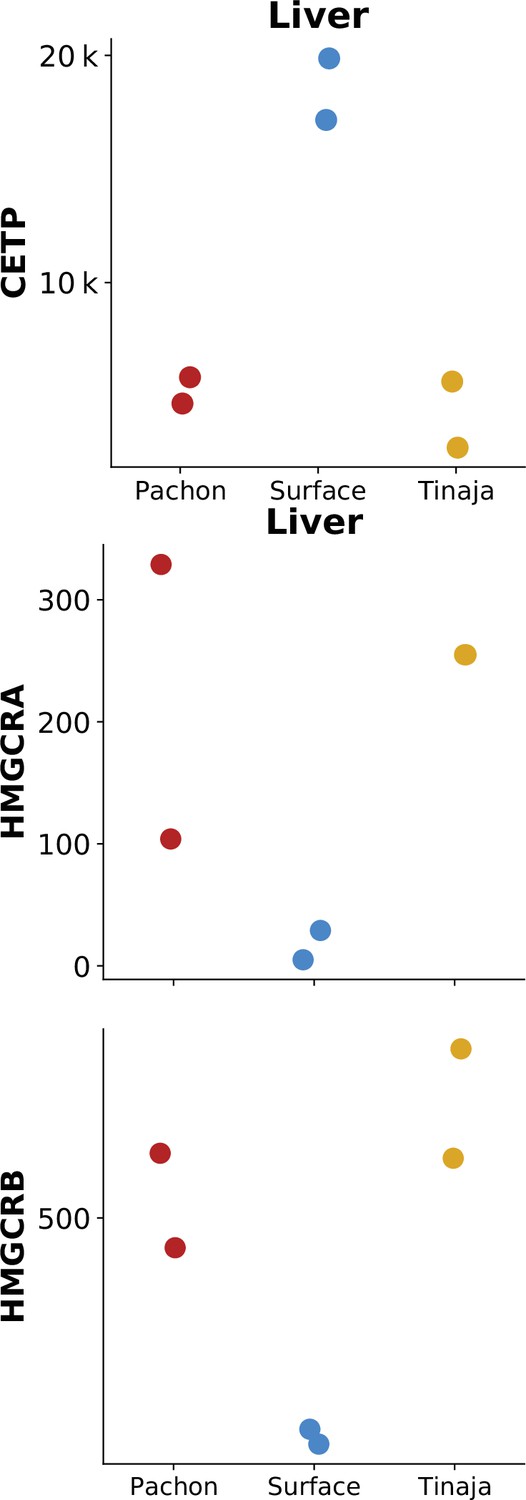
CETP, but not HMG-CoA reductase homologs, show identical or reduced expression in surface fish.
Previously published RNA-Seq data (Krishnan et al., 2022) of CETP (ENSAMXG00000003656) and HMGCRA/B (ENSAMXG00000007971 /ENSAMXG00000016175) in cave / surface A. mexicanus. Values on the y-axis are gene expression data in terms of counts measured in liver tissue under normal feeding conditions.
Figure 8

ROS levels in refed / fasted liver via DHE staining.
Pachón cavefish and surface fish were fasted for 30 days and livers were removed and stained with dihydroethidium (DHE), a blue-fluorescent dye that fluoresces red when oxidized and serves as an indicator of the presence of superoxide radicals. While we did not detect a significant difference in baseline staining in fish refed after 4 days of fasting, cytoplasmic ROS in Pachón was significantly (Kruskal-Wallis test) decreased in Pachón with respect to surface as measured by DHE staining (A). Nuclear differences were not detected among any groups (B). (C–F): Arbitrarily selected images of DHE (left) and DAPI (right) staining for Pachón with 4-day fasting followed by refeeding (C), surface with 4-day fasting followed by refeeding (D), Pachón with 30-day fasting (E), and surface with 30-day fasting (F). All images are available at https://www.stowers.org/research/publications/libpb-1699.
Additional files
-
Transparent reporting form
- https://cdn.elifesciences.org/articles/74539/elife-74539-transrepform1-v1.docx
-
Supplementary file 1
An Excel file containing the results of the O–PLS / GLM feature identification pipeline for primary metabolites divided into categories.
Columns represent different population and feeding condition combinations.
- https://cdn.elifesciences.org/articles/74539/elife-74539-supp1-v1.xlsx
-
Supplementary file 2
GO term enrichment for the three RNA-Seq datasets described in this manuscript.
- https://cdn.elifesciences.org/articles/74539/elife-74539-supp2-v1.csv
Download links
A two-part list of links to download the article, or parts of the article, in various formats.
Downloads (link to download the article as PDF)
Open citations (links to open the citations from this article in various online reference manager services)
Cite this article (links to download the citations from this article in formats compatible with various reference manager tools)
The metabolome of Mexican cavefish shows a convergent signature highlighting sugar, antioxidant, and Ageing-Related metabolites
eLife 11:e74539.
https://doi.org/10.7554/eLife.74539


