The transcriptional corepressor CTBP-1 acts with the SOX family transcription factor EGL-13 to maintain AIA interneuron cell identity in Caenorhabditis elegans
- Department of Biology, Massachusetts Institute of Technology, Howard Hughes Medical Institute, United States
Figures
Figure 1 with 2 supplements
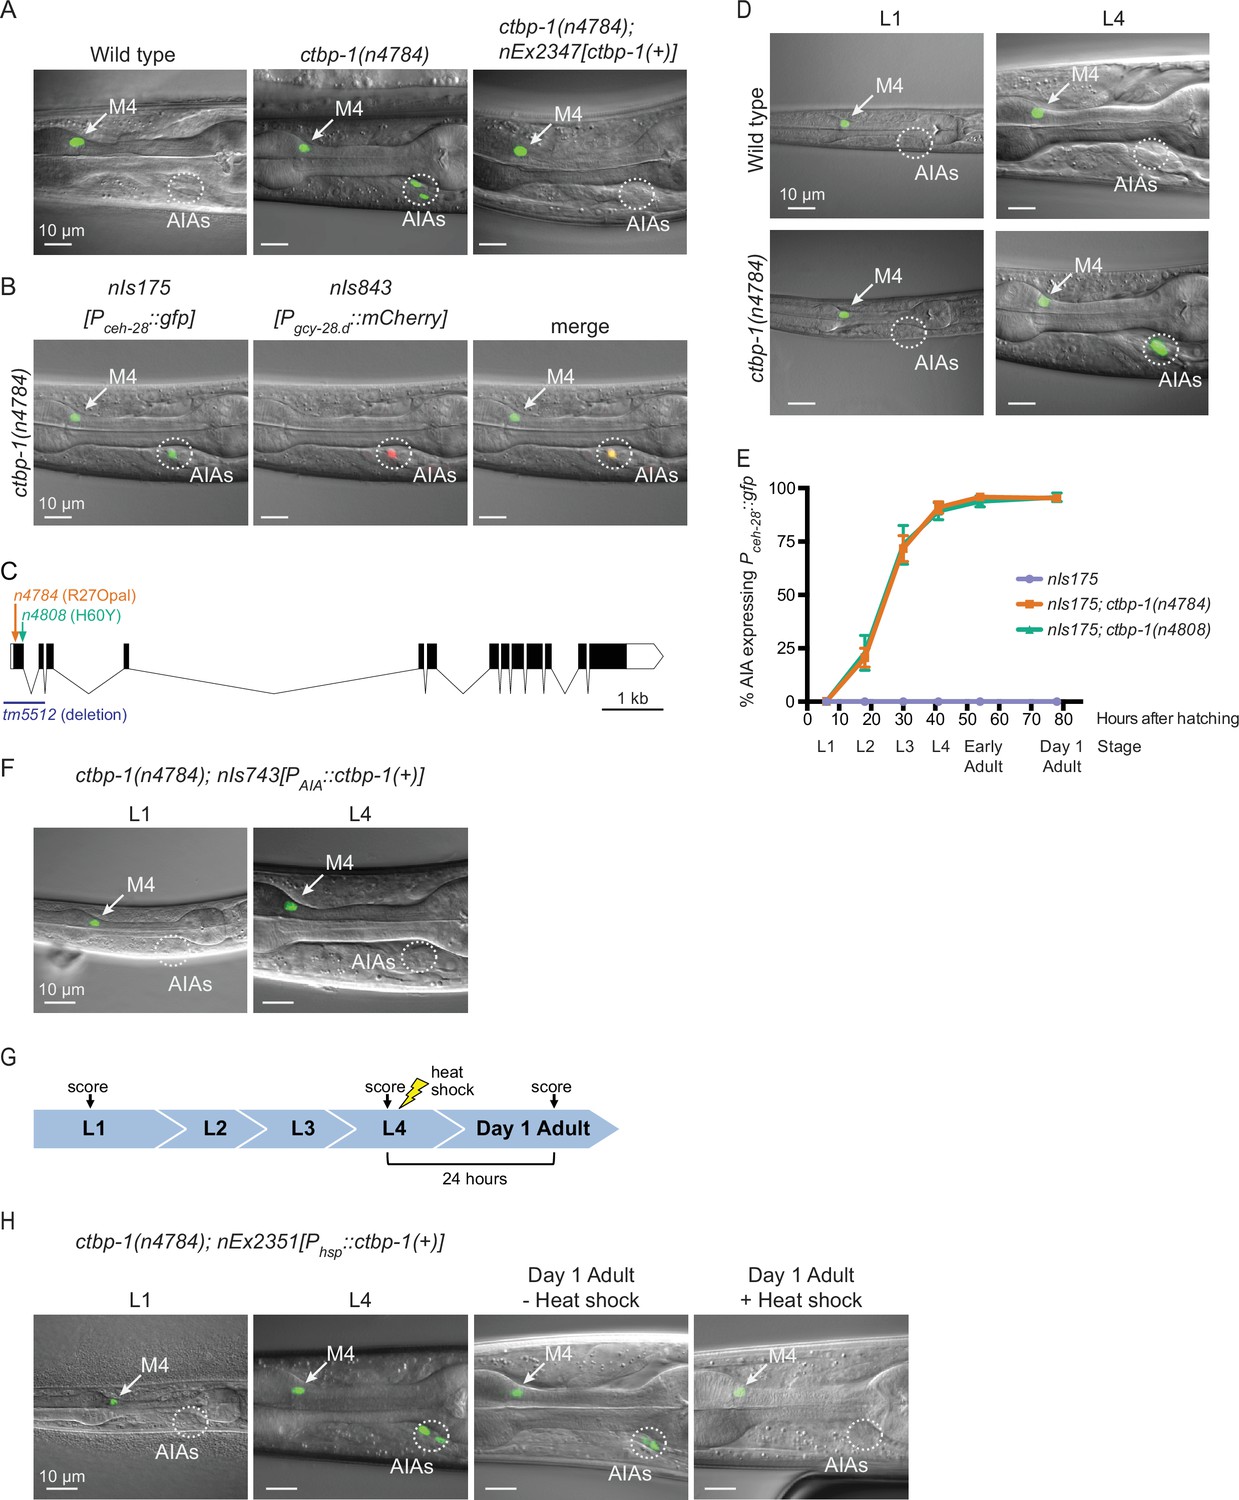
ctbp-1 mutants misexpress Pceh-28::gfp in the AIA neurons.
(A) Expression of the M4-specific marker nIs175[Pceh-28::gfp] in the wild type (left panel), a ctbp-1(n4784) mutant (middle panel), and a ctbp-1 mutant carrying an extrachromosomal array expressing wild-type ctbp-1 under its native promoter (nEx2347) (right panel). Arrow, M4 neuron. Circle, AIAs. Scale bar, 10 μm. (B) A ctbp-1(n4784) mutant expressing nIs175 (left panel) and the AIA marker nIs843[Pgcy-28.d::mCherry] (middle panel). Merge, right panel. Arrow, M4 neuron. Circle, AIAs. Scale bar, 10 μm. (C) Gene diagram of the ctbp-1a isoform. Arrows (above), point mutations. Line (below), deletion. Scale bar (bottom right), 1 kb. Additional ctbp-1 alleles are shown in Figure 1—figure supplement 1B. (D) nIs175 expression in wild-type (top) and ctbp-1(n4784) (bottom) worms at the L1 larval stage (left) and L4 larval stage (right). Arrow, M4 neuron. Circle, AIAs. Scale bar, 10 μm. (E) Percentage of wild-type, ctbp-1(n4784), and ctbp-1(n4808) worms expressing nIs175 in the AIA neurons over time. Time points correspond to the L1, L2, L3, and L4 larval stages, early adult, and day 1 adult worms (indicated below X axis). Mean ± SEM. n ≥ 60 worms scored per strain per stage, four biological replicates. (F) Expression of nIs175 in ctbp-1 mutants containing a transgene driving expression of wild-type ctbp-1 under an AIA-specific promoter (nIs743[Pgcy-28.d::ctbp-1(+)]) in L1 and L4 larval worms. Arrow, M4 neuron. Circle, AIAs. Scale bar, 10 μm. (G) Schematic for the heat-shock experiment shown in H. (H) nIs175 expression in ctbp-1(n4784) mutants carrying the heat-shock-inducible transgene nEx2351[Phsp-16.2::ctbp-1(+); Phsp-16.41::ctbp-1(+)]. Arrow, M4 neuron. Circle, AIAs. Scale bar, 10 μm. All strains shown contain the transgene nIs175[Pceh-28::gfp]. Images are oriented such that left corresponds to anterior, top to dorsal. Quantification of reporter expression from A, B, F in Figure 1—figure supplement 2. Quantification of reporter expression from H in Figure 1—figure supplement 2.
-
Figure 1—source data 1
Source data for Figure 1 and supplements.
- https://cdn.elifesciences.org/articles/74557/elife-74557-fig1-data1-v1.zip
Figure 1—figure supplement 1
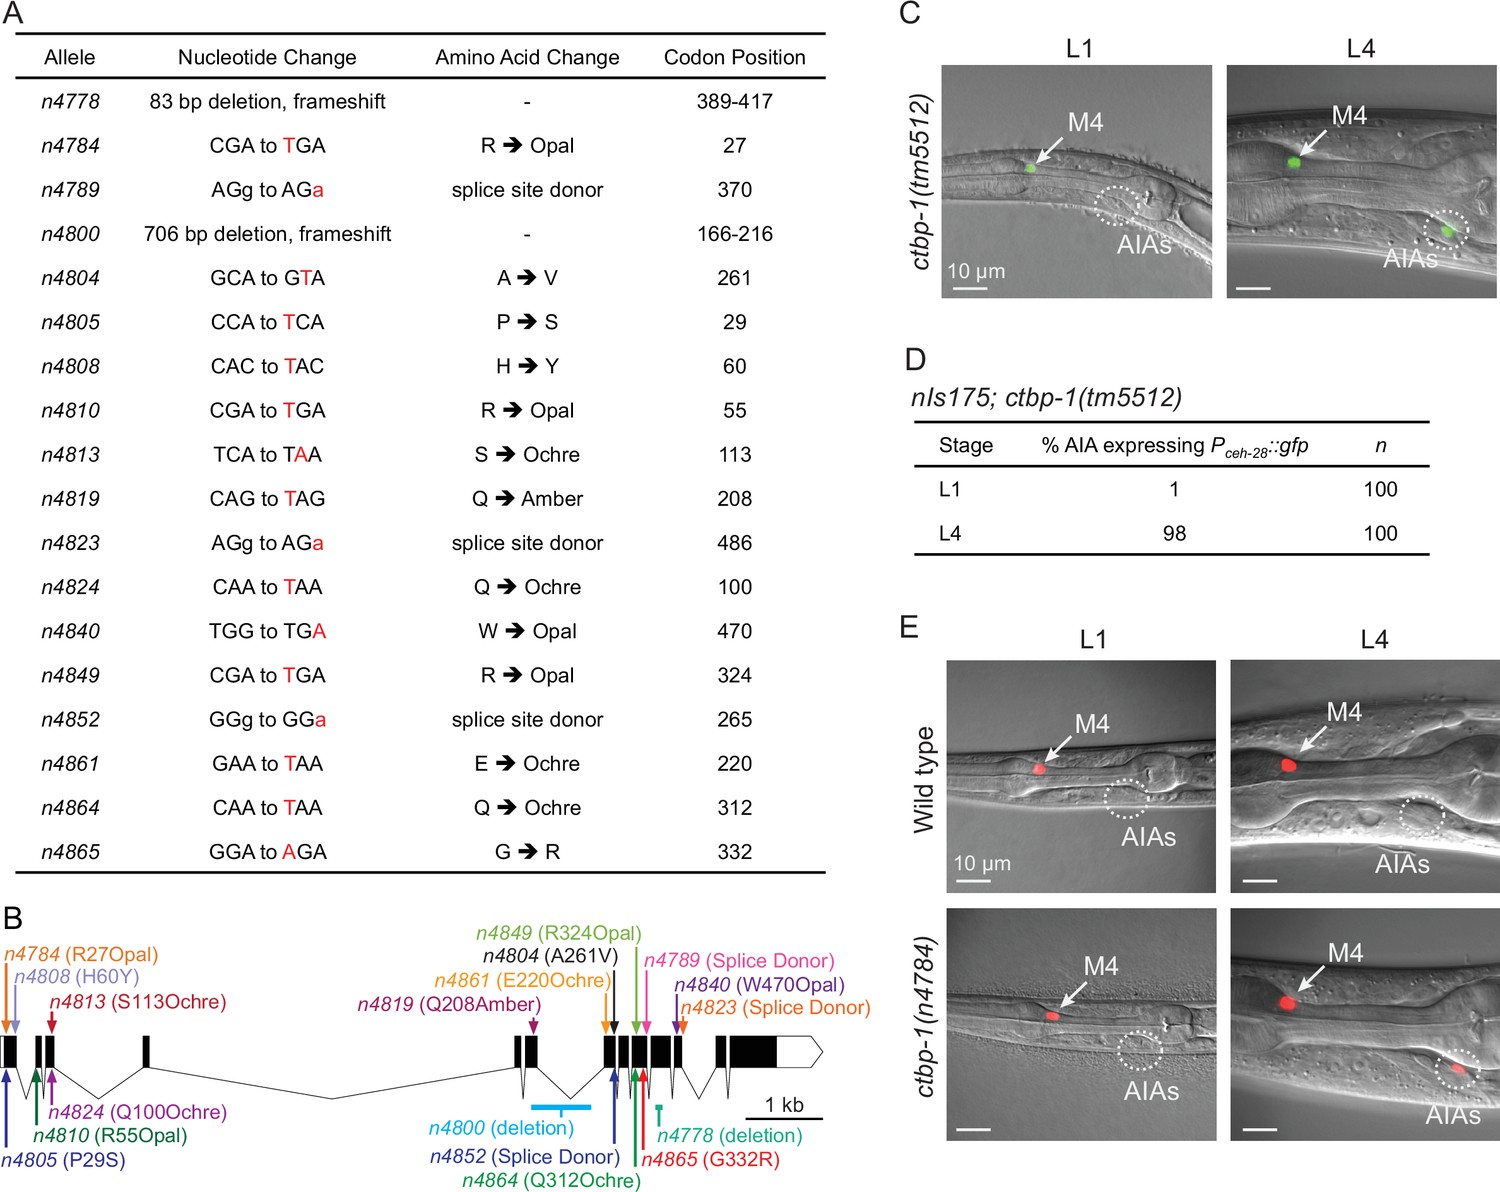
Additional ctbp-1 mutant alleles cause misexpression of Pceh-28::gfp in the AIA neurons.
(A) Table of ctbp-1 mutant alleles we showed to result in nIs175[Pceh-28::gfp] or nIs177[Pceh-28::gfp] misexpression in the AIA neurons. Specific nucleotide changes are denoted in red. Codon positions correspond to the ctbp-1a isoform. (B) Gene diagram of the ctbp-1a isoform showing all 18 ctbp-1 alleles isolated in this study. Arrows, point mutations. Lines, deletions. Scale bar (bottom right), 1 kb. (C) Expression of nIs175 in ctbp-1(tm5512) L1 and L4 mutant worms. Arrow, M4 neuron. Circle, AIAs. Scale bar, 10 μm. (D) Percentage of ctbp-1(tm5512) worms expressing nIs175 in the AIA neurons at the L1 and L4 larval stages. (E) nIs348[Pceh-28::mCherry] expression in wild-type (top) and ctbp-1(n4784) (bottom) worms at the L1 larval stage (left) and L4 larval stage (right). Arrow, M4 neuron. Circle, AIAs. Scale bar, 10 μm. All strains in A-C contain either nIs175[Pceh-28::gfp] or nIs177[Pceh-28::gfp]. Images are oriented such that left corresponds to anterior, top to dorsal.
Figure 1—figure supplement 2
Quantification of ctbp-1 strains misexpressing Pceh-28::gfp.
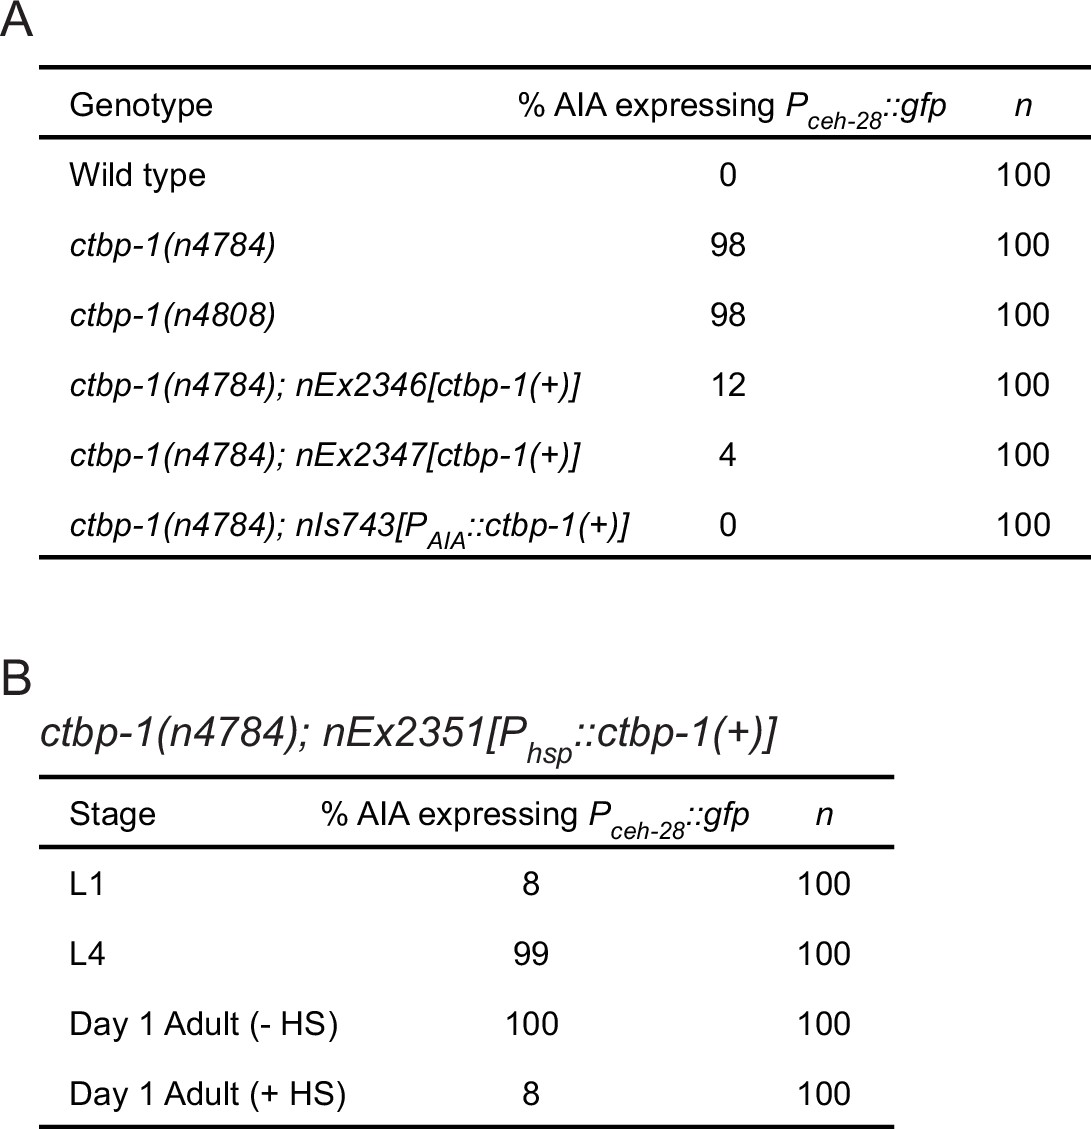
(A) Percentage of worms of indicated genotypes expressing nIs175[Pceh-28::gfp] in the AIA neurons at the L4 larval stage. (B) Percentage of ctbp-1(n4784); nEx2351[Phsp-16.2::ctbp-1(+); Phsp-16.41::ctbp-1(+)] worms expressing nIs175 at the L1, L4, and day 1 adult stages. Day 1 adults shown± heat shock (HS) at the L4 stage.
Figure 2 with 1 supplement
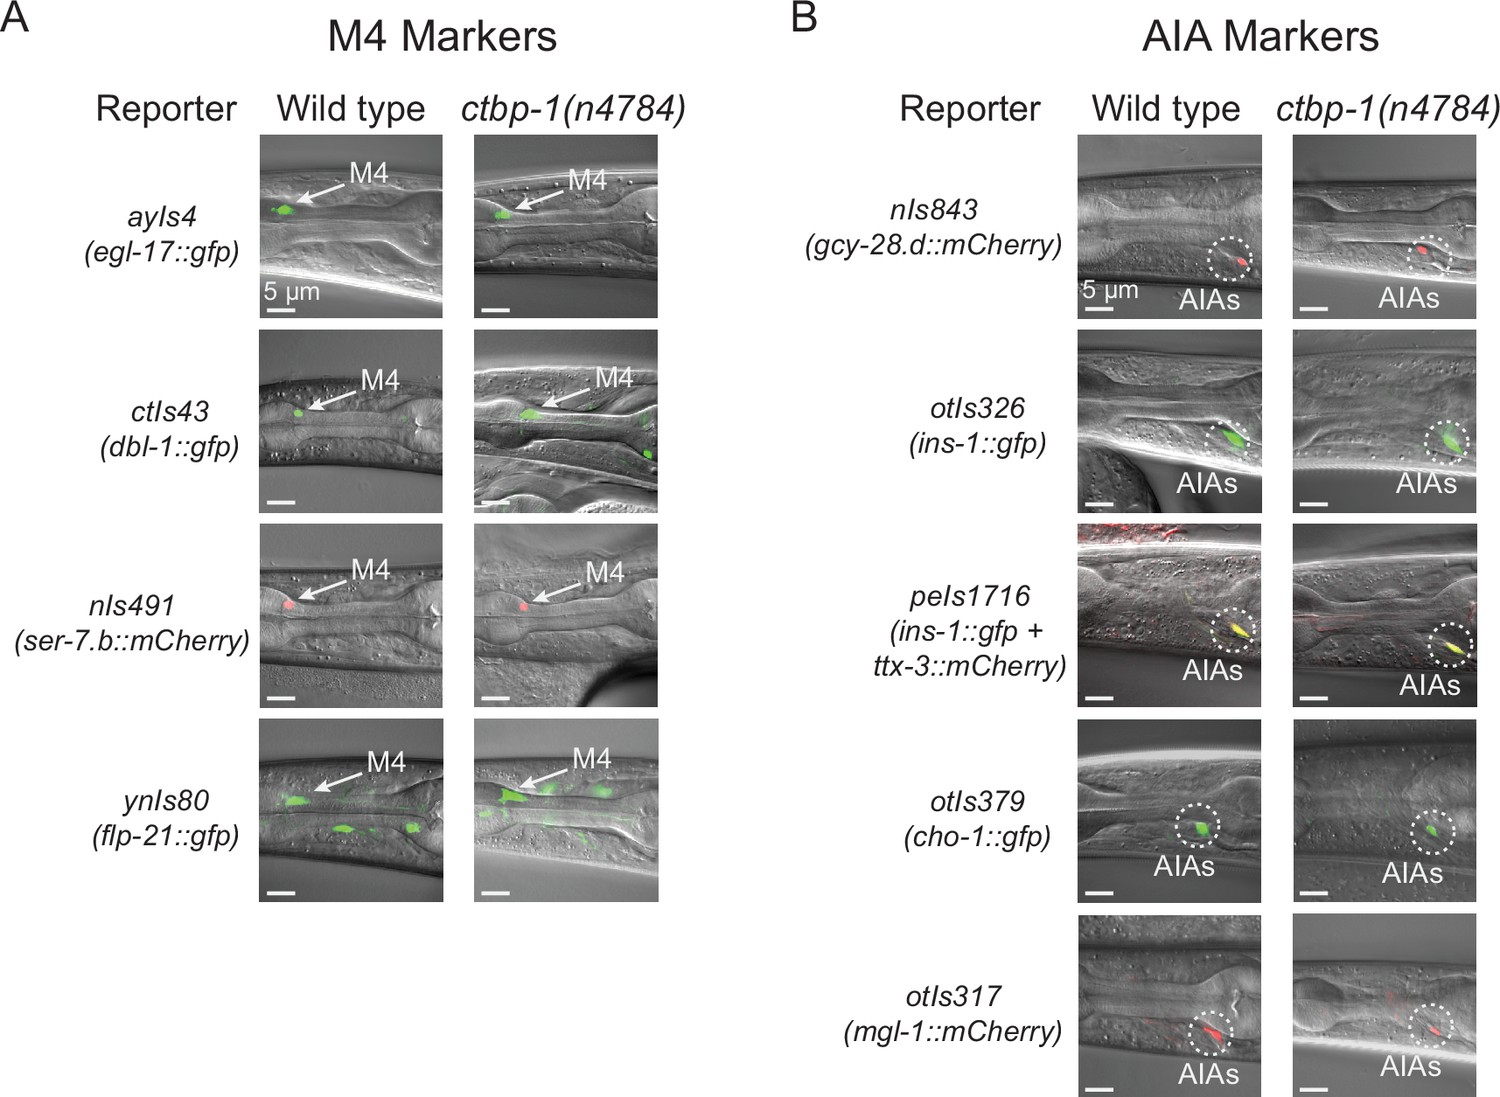
ctbp-1 mutant AIAs retain multiple aspects of their AIA gene expression profile.
(A–B) Expression of (A) M4 markers egl-17, dbl-1, ser-7.b, and flp-21 and (B) AIA markers gcy-28.d, ins-1, ttx-3, cho-1, and mgl-1 in wild-type (left image) and ctbp-1(n4784) (right image) L4 larval worms. Arrow, M4 neuron. Circles, AIAs. Scale bar, 5 μm. Images are oriented such that left corresponds to anterior, top to dorsal. Quantification of reporter expression in Figure 2—figure supplement 1A-B.
-
Figure 2—source data 1
Source data for Figure 2 and supplements.
- https://cdn.elifesciences.org/articles/74557/elife-74557-fig2-data1-v1.zip
Figure 2—figure supplement 1
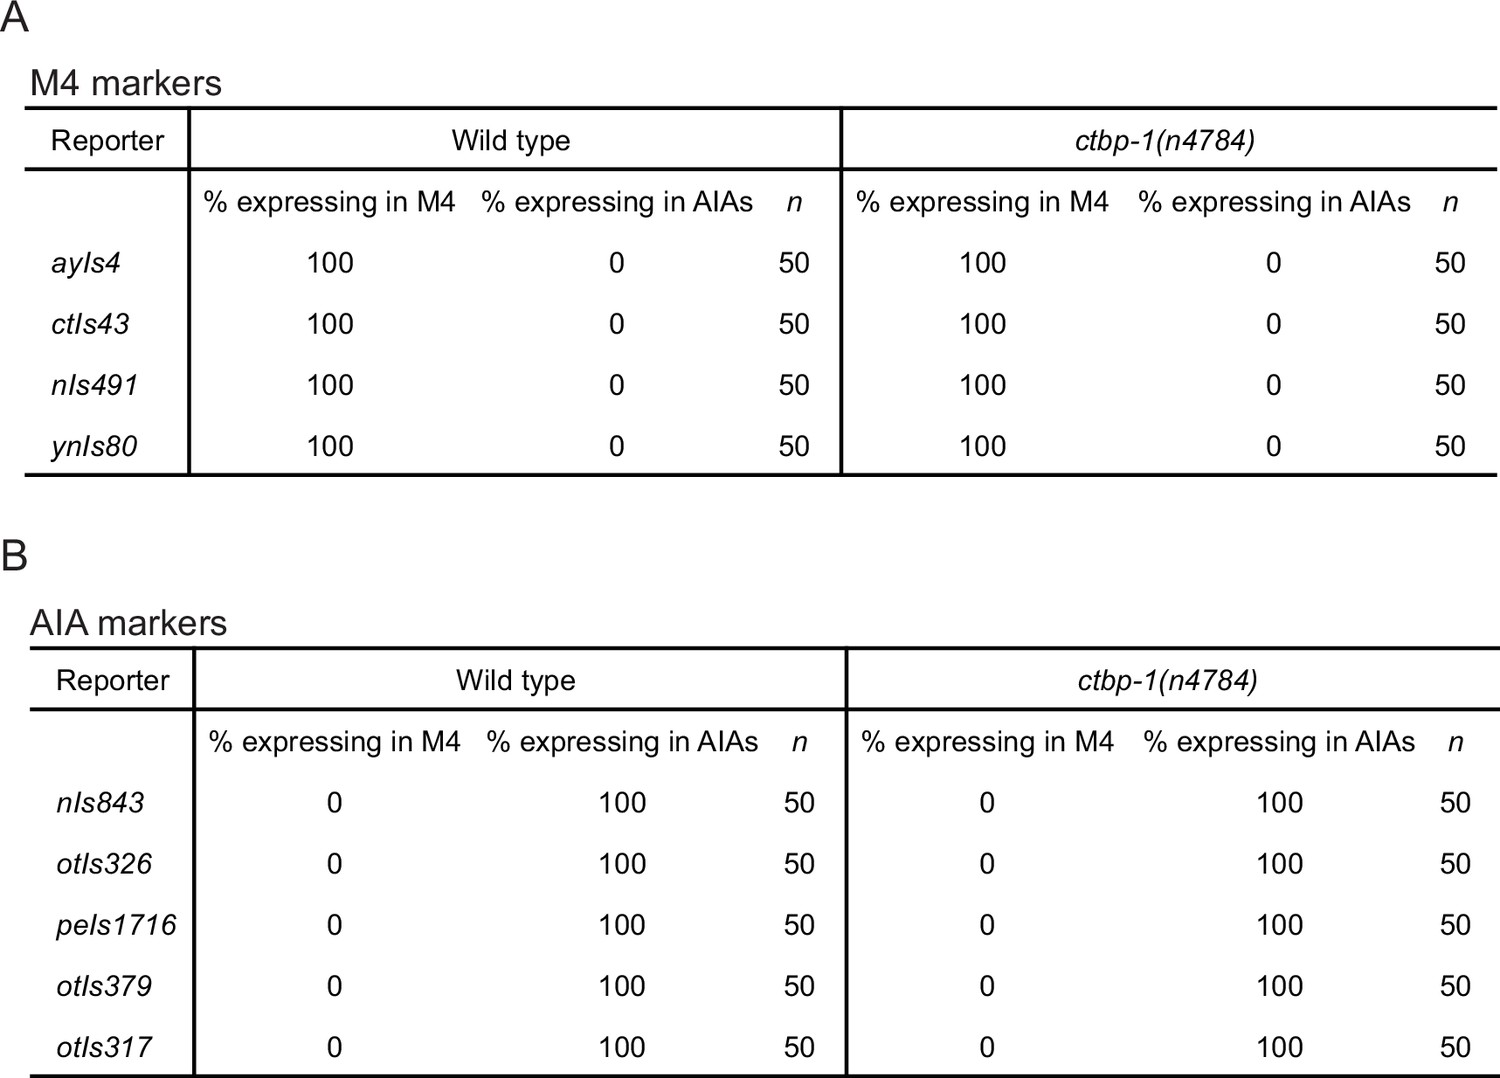
Quantification of M4 and AIA marker expression.
(A–B) Quantification of wild-type and ctbp-1(n4784) L4 worms expressing the indicated (A) M4 or (B) AIA markers from Figure 2A–B in the M4 and AIA neurons.
Figure 3 with 2 supplements

Loss of ctbp-1 results in a progressive decline in AIA morphology.
(A) Three representative images of an AIA neuron in wild-type (left) and ctbp-1(n4784) (right) worms at L1 (top), L4 (middle), and day 1 adult (bottom) stages. Arrows, examples of ectopic neurites protruding from the AIA cell body. Scale bar, 5 μm. (B–C) Percentage of AIAs in wild-type and ctbp-1 worms at the L1, L4, and day 1 adult stages with an ectopic neurite protruding from the (B) anterior or (C) posterior of the AIA cell body. Mean ± SEM. n = 60 AIAs scored per strain per stage, four biological replicates. ns, not significant (p = 0.356), **p < 0.01, ****p < 0.0001, unpaired t-test. (D) Quantification of AIA cell body length in wild-type and ctbp-1 worms at the L1, L4, and day 1 adult stages. Mean ± SEM. n = 30 AIAs scored per strain per stage. ns, not significant (p = 0.806), *p = 0.0133, ****p < 0.0001, unpaired t-test. (E) Three representative images of an AIA neuron in ctbp-1; nIs743[Pgcy-28.d::ctbp-1(+)] worms at L1 (top), L4 (middle), and day 1 adult (bottom) stages. Arrows, examples of ectopic neurites protruding from the AIA cell body. Scale bar, 5 μm. (F–G) Percentage of AIAs in wild-type, ctbp-1, and ctbp-1; nIs743 worms at the L1, L4, and day 1 adult stages with an ectopic neurite protruding from the (F) anterior or (G) posterior of the AIA cell body. Mean ± SEM. n = 30 AIAs scored per strain per stage, three biological replicates. ns, not significant, **p = 0.0065, ***p < 0.001, ****p < 0.0001, one-way ANOVA with Tukey’s correction. (H) Quantification of AIA cell body length in wild-type, ctbp-1 and ctbp-1; nIs743 worms at the L1, L4, and day 1 adult stages. Mean ± SEM. n ≥ 30 AIAs scored per strain per stage. ns, not significant, **p = 0.0015, ****p < 0.0001, one-way ANOVA with Tukey’s correction. (I) Three representative images of an AIA neuron in ctbp-1; nEx2351[Phsp-16.2::ctbp-1(+); Phsp-16.41::ctbp-1(+)] worms at L4 (top), day 1 adult with heat shock (+ HS) (middle) and day 1 adult without heat shock (- HS) (bottom). Arrows, examples of ectopic neurites protruding from the AIA cell body. Scale bar, 5 μm. (J–K) Percentage of AIAs in wild-type, ctbp-1 and ctbp-1; nEx2351 worms at L4 and day 1 adult (with or without heat shock) stages with an ectopic neurite protruding from the (J) anterior or (K) posterior of the AIA cell body. Mean ± SEM. n = 30 AIAs scored per strain per stage, three biological replicates. ns, not significant, *p < 0.05, **p = 0.0043, ***p < 0.001, ****p < 0.0001, one-way ANOVA with Tukey’s correction. (L) Quantification of AIA cell body length in wild-type, ctbp-1, and ctbp-1; nEx2351 worms at L4 and day 1 adult (with or without heat shock) stages. Mean ± SEM. n ≥ 30 AIAs scored per strain per stage. ns, not significant, *p < 0.05, ****p < 0.0001, one-way ANOVA with Tukey’s correction. The ctbp-1 allele used for all panels of this figure was n4784. All strains contain nIs840[Pgcy-28.d::gfp], and all strains other than ‘Wild type’ contain nIs348[Pceh-28::mCherry] (not shown in images). Images are oriented such that left corresponds to anterior, top to dorsal.
-
Figure 3—source data 1
Source data for Figure 3 and supplements.
- https://cdn.elifesciences.org/articles/74557/elife-74557-fig3-data1-v1.zip
Figure 3—figure supplement 1
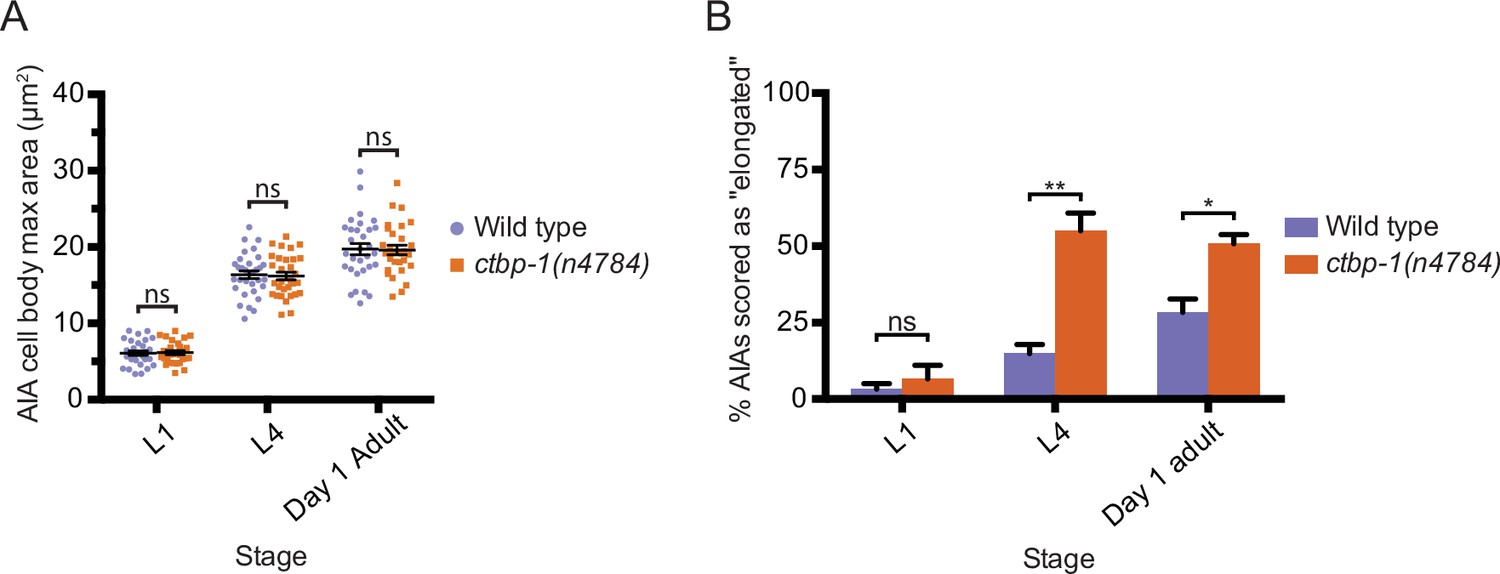
Loss of ctbp-1 results in a disruption of AIA morphology but not AIA size.
(A) Quantification of maximum AIA cell body area in wild-type and ctbp-1(n4784) worms at L1, L4, and day 1 adult stages. Both strains contain nIs840[Pgcy-28.d::gfp] and the ctbp-1 strain contains nIs348[Pceh-28::mCherry]. Mean ± SEM. n ≥ 30 AIAs scored per strain per stage. ns, not significant, unpaired t-test. (B) Scoring of wild-type and ctbp-1(n4784) AIA images at the L1, L4, and day 1 adult stages. A random subset of AIA images used for length measurements in Figure 3D, H and L were blinded and scored as having either ‘Normal’ or ‘Elongated’ AIA cell bodies. n ≥ 20 AIAs scored per strain per stage, three replicates. ns, not significant (p = 0.519), *p = 0.0135, **p = 0.0035, unpaired t-test.
Figure 3—figure supplement 2
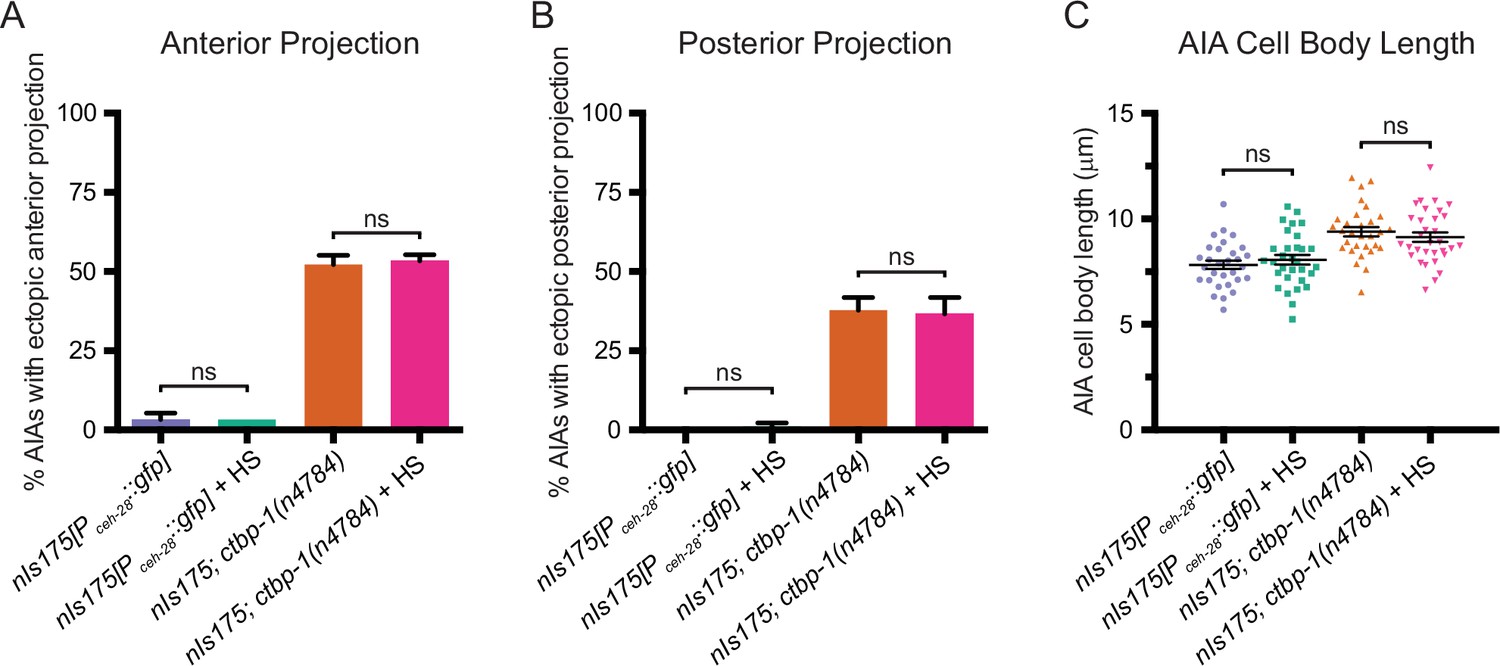
Heat shock does not affect AIA morphology.
(A–B) Percentage of AIAs in nIs175[Pceh-28::gfp] and nIs175; ctbp-1(n4784) worms at the day one adult stage with or without a brief heat shock (HS) 24 hours prior with an ectopic neurite protruding from the (A) anterior or (B) posterior of the AIA cell body. Mean ± SEM. n = 30 worms per strain per stage, three biological replicates. ns, not significant, unpaired t-test. (C) Quantification of AIA cell body length in nIs175[Pceh-28::gfp] and nIs175; ctbp-1(n4784) worms at the day 1 adult stage with or without a brief heat shock (HS) 24 hours prior. Mean ± SEM. n ≥ 30 AIAs scored per strain per stage. ns, not significant, unpaired t-test.
Figure 4 with 1 supplement

Loss of ctbp-1 results in a disruption of AIA function in L4-to-day 1 adult worms.
(A) Schematic of the butanone adaptation assay. L1 or L4 worms from synchronized populations were washed off plates with S Basal, washed with S Basal, split into naïve and conditioned populations, incubated in S Basal with or without 2-butanone for 1.5 hrs, washed again with S Basal, allowed to chemotax for 2 hrs on unseeded plates containing two 1 μl spots of 10% ethanol (blue dots) and 2-butanone diluted in 10% ethanol (orange dots), and then scored. (B–E) Chemotaxis indices of (B,D) naïve or (C,E) conditioned wild-type (N2 and nIs175), AIA-ablated (JN580), nIs175; ctbp-1(n4784), and nIs175; ctbp-1 mutants containing a transgene driving expression of wild-type ctbp-1 under an AIA-specific promoter (nIs743[Pgcy-28.d::ctbp-1(+)]) at the (B–C) L1 or (D–E) L4 larval stage. Mean ± SEM. n ≥ 6 assays per condition, ≥ 50 worms per assay. ns, not significant, **p < 0.01, ***p = 0.0005, ****p < 0.0001, one-way ANOVA with Tukey’s correction. (F–G) Chemotaxis indices of (F) naïve or (G) conditioned nIs175, nIs175; ctbp-1, and nIs175; ctbp-1 mutants carrying the heat-shock-inducible transgene nEx2351[Phsp-16.2::ctbp-1(+); Phsp-16.41::ctbp-1(+)] with or without heat shock (HS) at the day 1 adult stage. Mean ± SEM. n ≥ 5 assays per condition, ≥ 50 worms per assay. ns, not significant, **p < 0.01, ****p < 0.0001, one-way ANOVA with Tukey’s correction. The ctbp-1 allele used for all panels of this figure was n4784.
-
Figure 4—source data 1
Source data for Figure 4 and supplements.
- https://cdn.elifesciences.org/articles/74557/elife-74557-fig4-data1-v1.zip
Figure 4—figure supplement 1
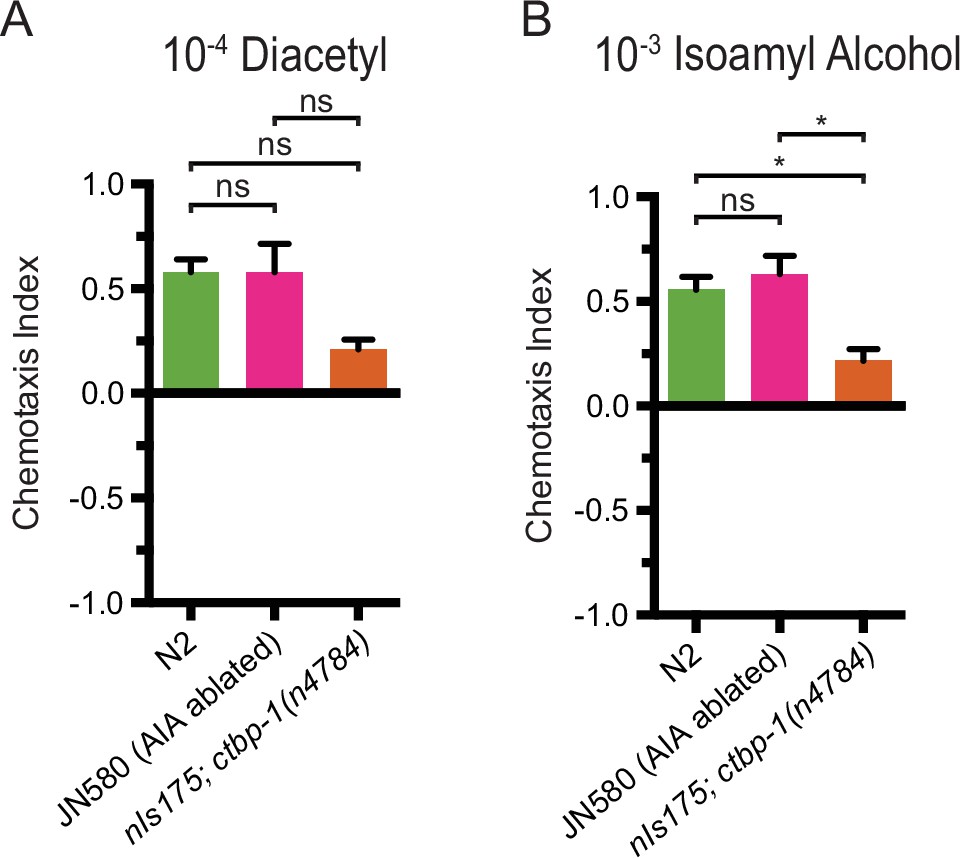
ctbp-1 mutants display a non-AIA-dependent chemotaxis defect.
(A–B) Chemotaxis indices of wild-type (N2), AIA-ablated (JN580) and nIs175; ctbp-1(n4784) mutants at the L4 larval stage to (A) diacetyl or (B) isoamyl alcohol diluted in pure ethanol. Mean ± SEM. n ≥ 3 assays per condition, ≥ 40 worms per assay. ns, not significant, *p < 0.05, one-way ANOVA with Tukey’s correction.
Figure 5 with 1 supplement

Loss of ctbp-1 results in a disruption to normal AIA gene expression.
(A,C,E) (A) nEx3081[Pacbp-6::gfp], (C) otIs123[Psra-11::gfp], or (E) ivEx138[Pglr-2::gfp] expression in wild-type (top) and ctbp-1(n4784) (bottom) worms at the L1 larval stage (left) and L4 larval stage (right). Wild-type strains contain nIs843[Pgcy-28.d::mCherry]. ctbp-1 mutant strains contain nIs348[Pceh-28::mCherry]. Arrow, M4 neuron. Circle, AIAs. Scale bar, 10 μm. (B,D,F) Percentage of wild-type and ctbp-1(n4784) expressing (B) Pacbp-6::gfp, (D) Psra-11::gfp, or (F) Pglr-2::gfp in the AIA neurons at L1 and L4 larval stages. Wild-type strains contain nIs843[Pgcy-28.d::mCherry]. ctbp-1 mutant strains contain nIs348[Pceh-28::mCherry]. Mean ± SEM. n ≥ 50 worms per strain per stage, three biological replicates. ns, not significant, ****p < 0.0001, unpaired t-test.
-
Figure 5—source data 1
Source data for Figure 5 and supplements.
- https://cdn.elifesciences.org/articles/74557/elife-74557-fig5-data1-v1.zip
Figure 5—figure supplement 1
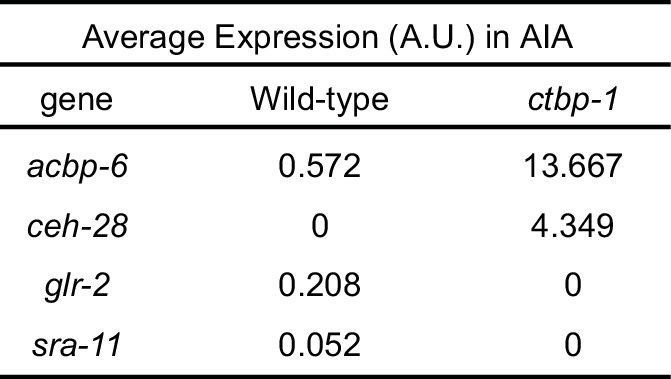
Gene expression in wild-type and ctbp-1 AIAs.
Average expression level of confirmed scRNA-Seq hits in the AIAs of L4 wild-type and ctbp-1 mutant animals. A.U., arbitrary expression units.
Figure 6 with 2 supplements
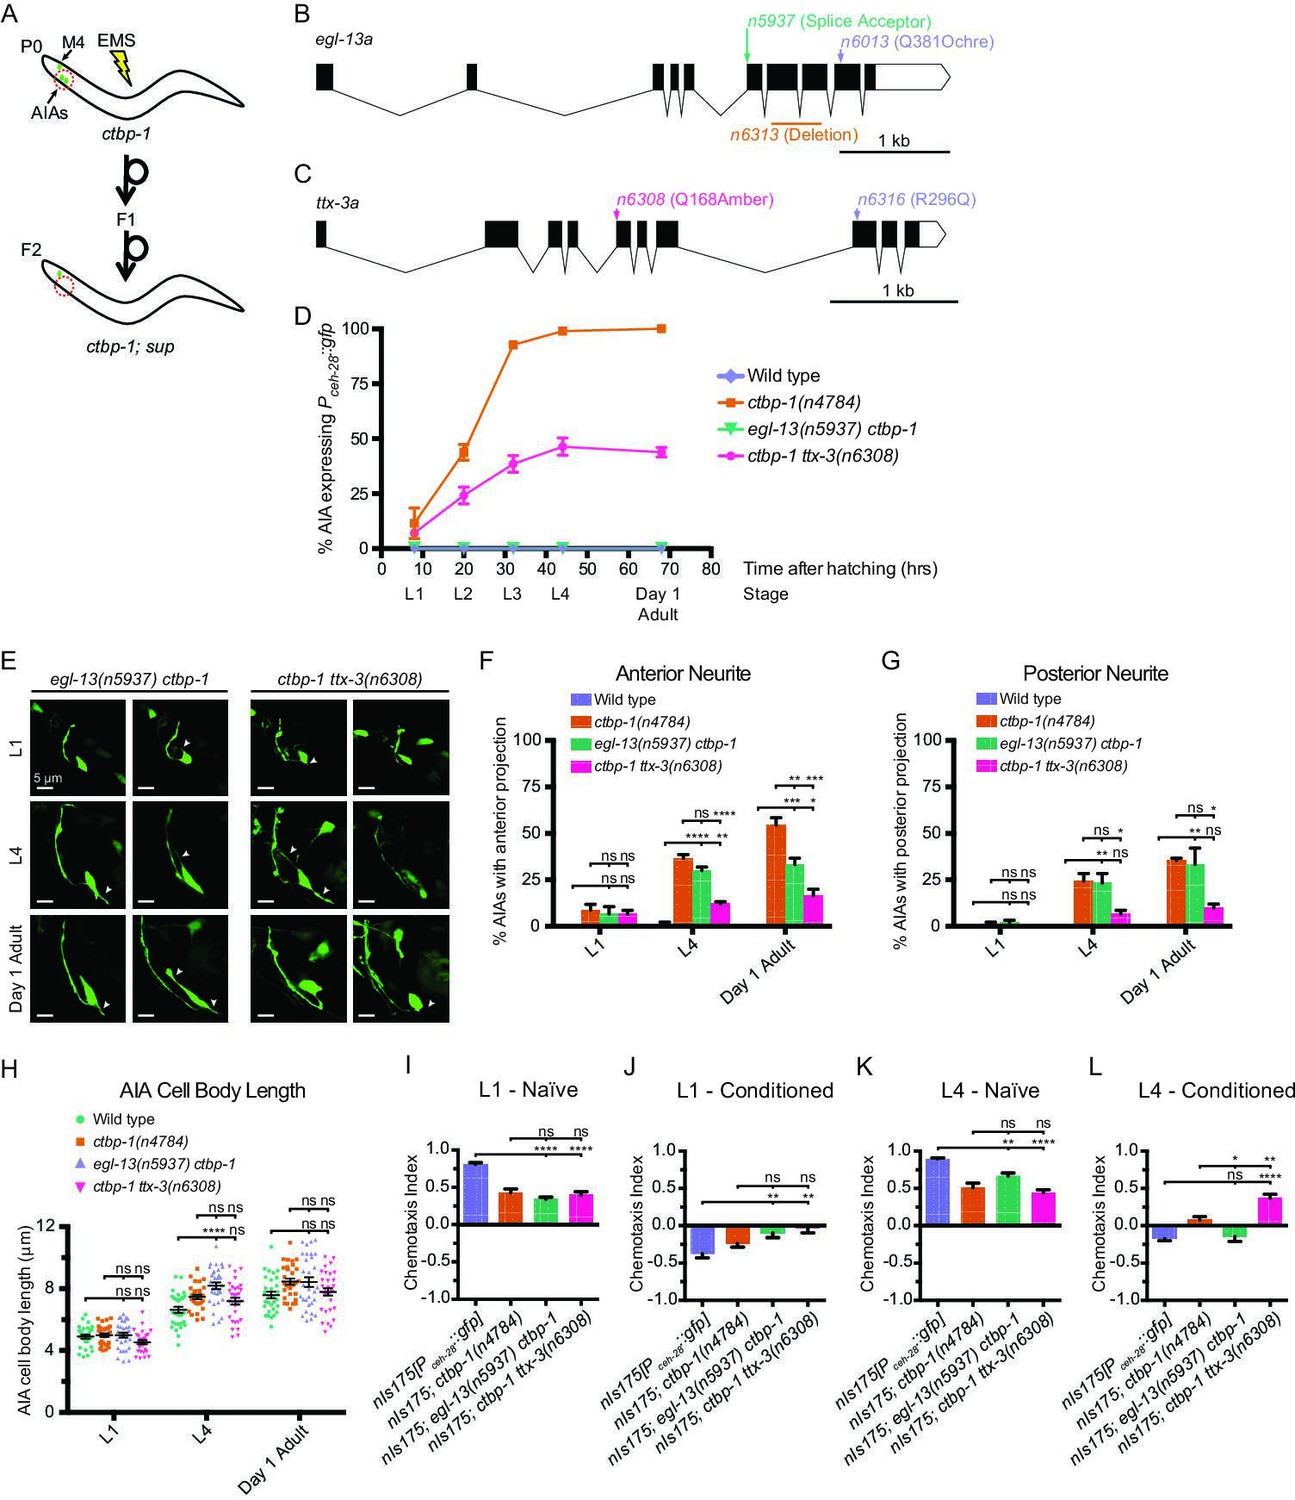
A suppressor screen reveals egl-13 and ttx-3 as ctbp-1 genetic interactors.
(A) Schematic of ctbp-1 suppressor screen design. ctbp-1 mutant worms carrying nIs175[Pceh-28::gfp] were mutagenized with ethyl methanesulfonate (EMS), and their F2 progeny were screened for continued nIs175 expression in M4 and loss of expression in the AIA neurons (red circle). (B) Gene diagram of the egl-13a isoform. Arrows (above), point mutations. Line (below), deletion. Scale bar (bottom right), 1 kb. (C) Gene diagram of the ttx-3a isoform. Arrows (above), point mutations. Scale bar, 1 kb. (D) Percentage of wild-type, ctbp-1, egl-13(n5937) ctbp-1, and ctbp-1 ttx-3(n6308) worms expressing nIs175 in the AIA neurons over time. Time points correspond to the L1, L2, L3, L4 larval stages, and day 1 adult worms (indicated below X axis). All strains contain nIs175[Pceh-28::gfp]. Mean ± SEM. n ≥ 100 worms per strain per stage, three biological replicates. (E) Two representative images of an AIA neuron in egl-13 ctbp-1 or ctbp-1 ttx-3 worms at L1 (top), L4 (middle), and day 1 adult (bottom) stages. Arrows, examples of ectopic neurites protruding from the AIA cell body. Image oriented such that left corresponds to anterior, top to dorsal. Scale bar, 5 μm. (F–G) Percentage of AIAs in wild-type, ctbp-1, egl-13 ctbp-1 and ctbp-1 ttx-3 worms at the L1, L4, and day 1 adult stages with an ectopic neurite protruding from the (F) anterior or (G) posterior of the AIA cell body. Mean ± SEM. n = 30 AIAs scored per strain per stage, three biological replicates. ns, not significant, *p < 0.05, **p < 0.01, ***p < 0.001, ****p < 0.0001, one-way ANOVA with Tukey’s correction. (H) Quantification of AIA cell body length in wild-type, ctbp-1, egl-13 ctbp-1, and ctbp-1 ttx-3 worms at the L1, L4, and day 1 adult stages. Mean ± SEM. n ≥ 30 AIAs scored per strain per stage. ns, not significant, ****p < 0.0001, one-way ANOVA with Tukey’s correction. (I–L) Chemotaxis indices of (I,K) naïve or (J,L) conditioned wild-type, ctbp-1, egl-13 ctbp-1, and ctbp-1 ttx-3 worms at the (I–J) L1 or (K–L) L4 larval stage. Mean ± SEM. n ≥ 5 assays per condition, ≥ 50 worms per assay. ns, not significant, *p = 0.0214, **p < 0.01, ****p < 0.0001, one-way ANOVA with Tukey’s correction. The ctbp-1 allele used for all panels of this figure was n4784. The egl-13 allele used for all panels of this figure was n5937. The ttx-3 allele used for all panels of this figure was n6308. All strains in (E–H) contain nIs840[Pgcy-28.d::gfp] and all strains in (E–H) other than ‘Wild type’ contain nIs348[Pceh-28::mCherry] (not shown in images). All strains in (D, I–L) contain nIs175[Pceh-28::gfp].
-
Figure 6—source data 1
Source data for Figure 6 and supplements.
- https://cdn.elifesciences.org/articles/74557/elife-74557-fig6-data1-v1.zip
Figure 6—figure supplement 1
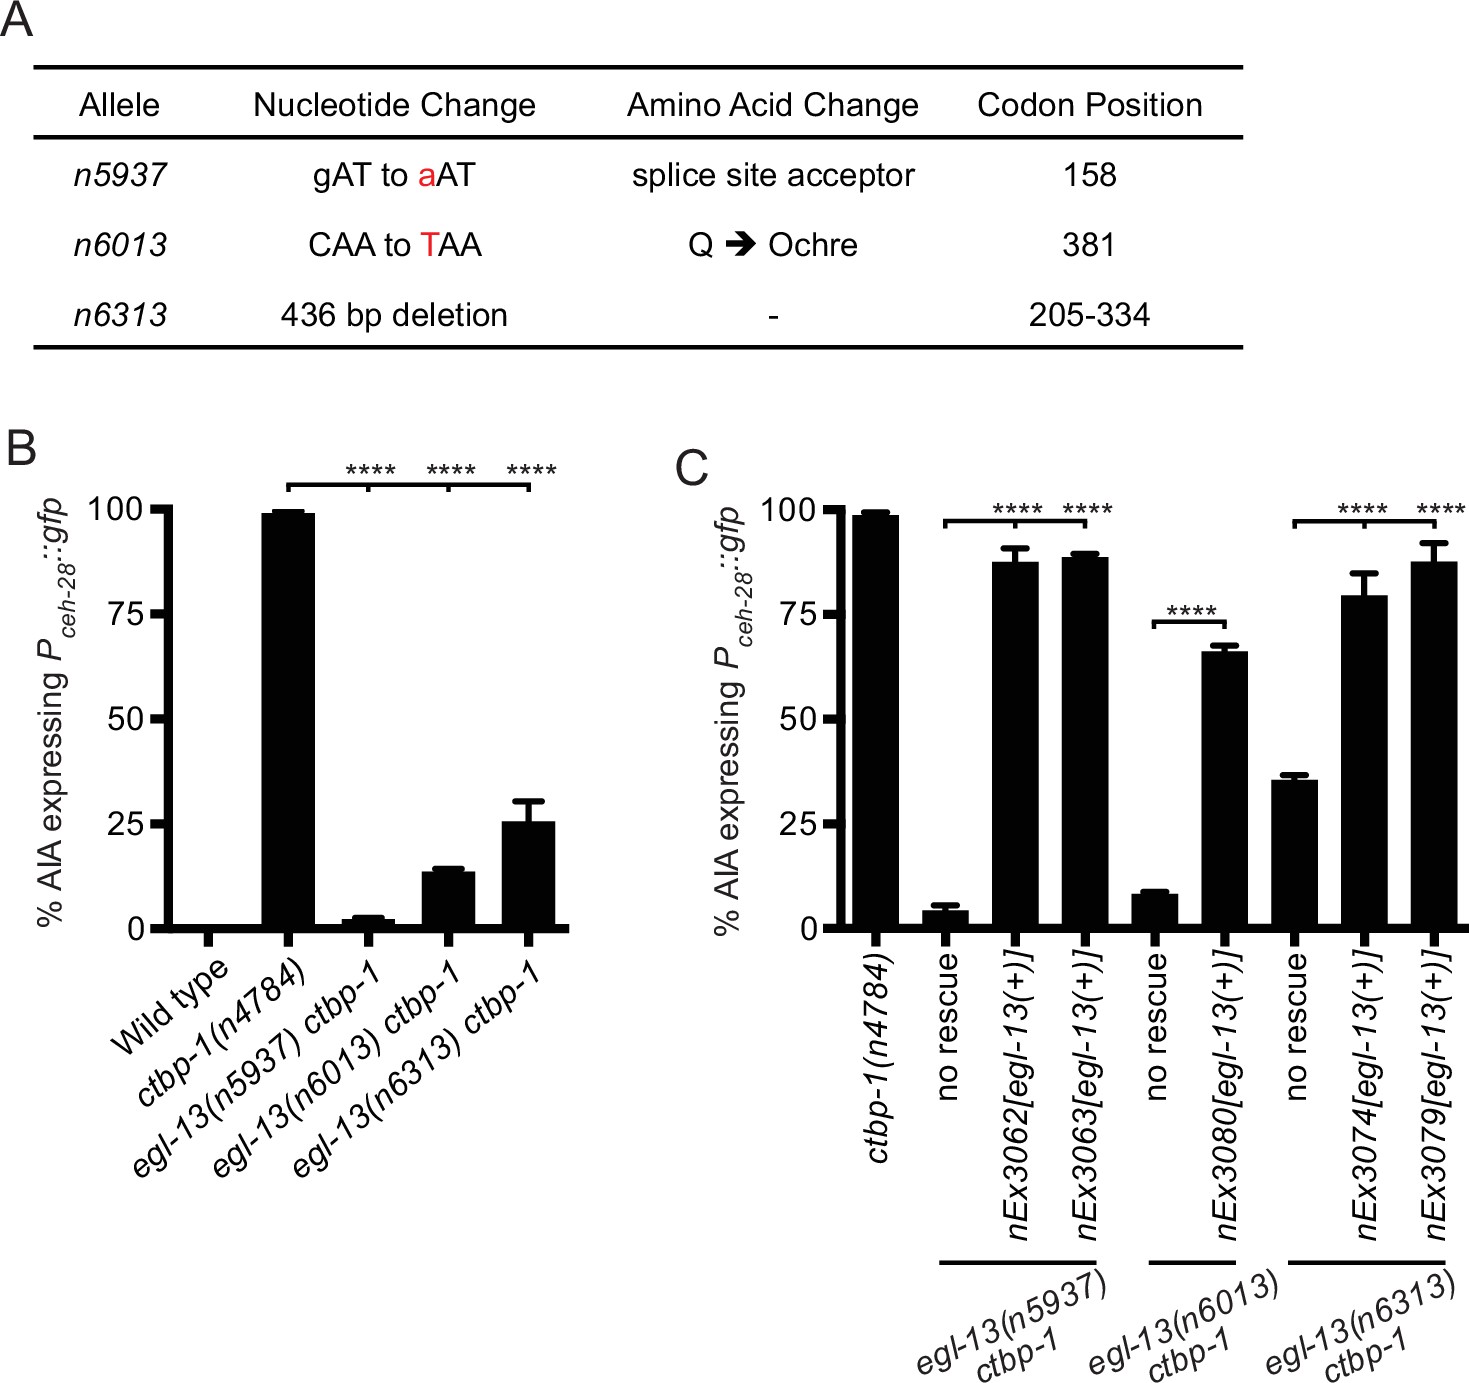
Characterization of egl-13 alleles isolated as ctbp-1 suppressors.
(A) Table of egl-13 mutant alleles isolated in this study as suppressors of ctbp-1-mediated nIs175[Pceh-28::gfp] misexpression in the AIA neurons. Specific nucleotide changes are denoted in red. Codon positions correspond to egl-13a isoform. (B) Percentage of wild-type, ctbp-1(n4784), and egl-13 ctbp-1 worms expressing nIs175 in the AIA neurons at the L4 larval stage. Mean ± SEM. n ≥ 100 worms scored per strain, three biological replicates. ****p < 0.0001, one-way ANOVA with Tukey’s correction. (C) Percentage of ctbp-1(n4784), egl-13 ctbp-1, and egl-13 ctbp-1 worms carrying transgenic constructs expressing wild-type egl-13 under its native promoter expressing nIs175 in the AIA neurons at the L4 larval stage. Mean ± SEM. n ≥ 50 worms scored per strain, three biological replicates. ****p < 0.0001, one-way ANOVA with Tukey’s correction. All strains in A-C contain nIs175[Pceh-28::gfp].
Figure 6—figure supplement 2
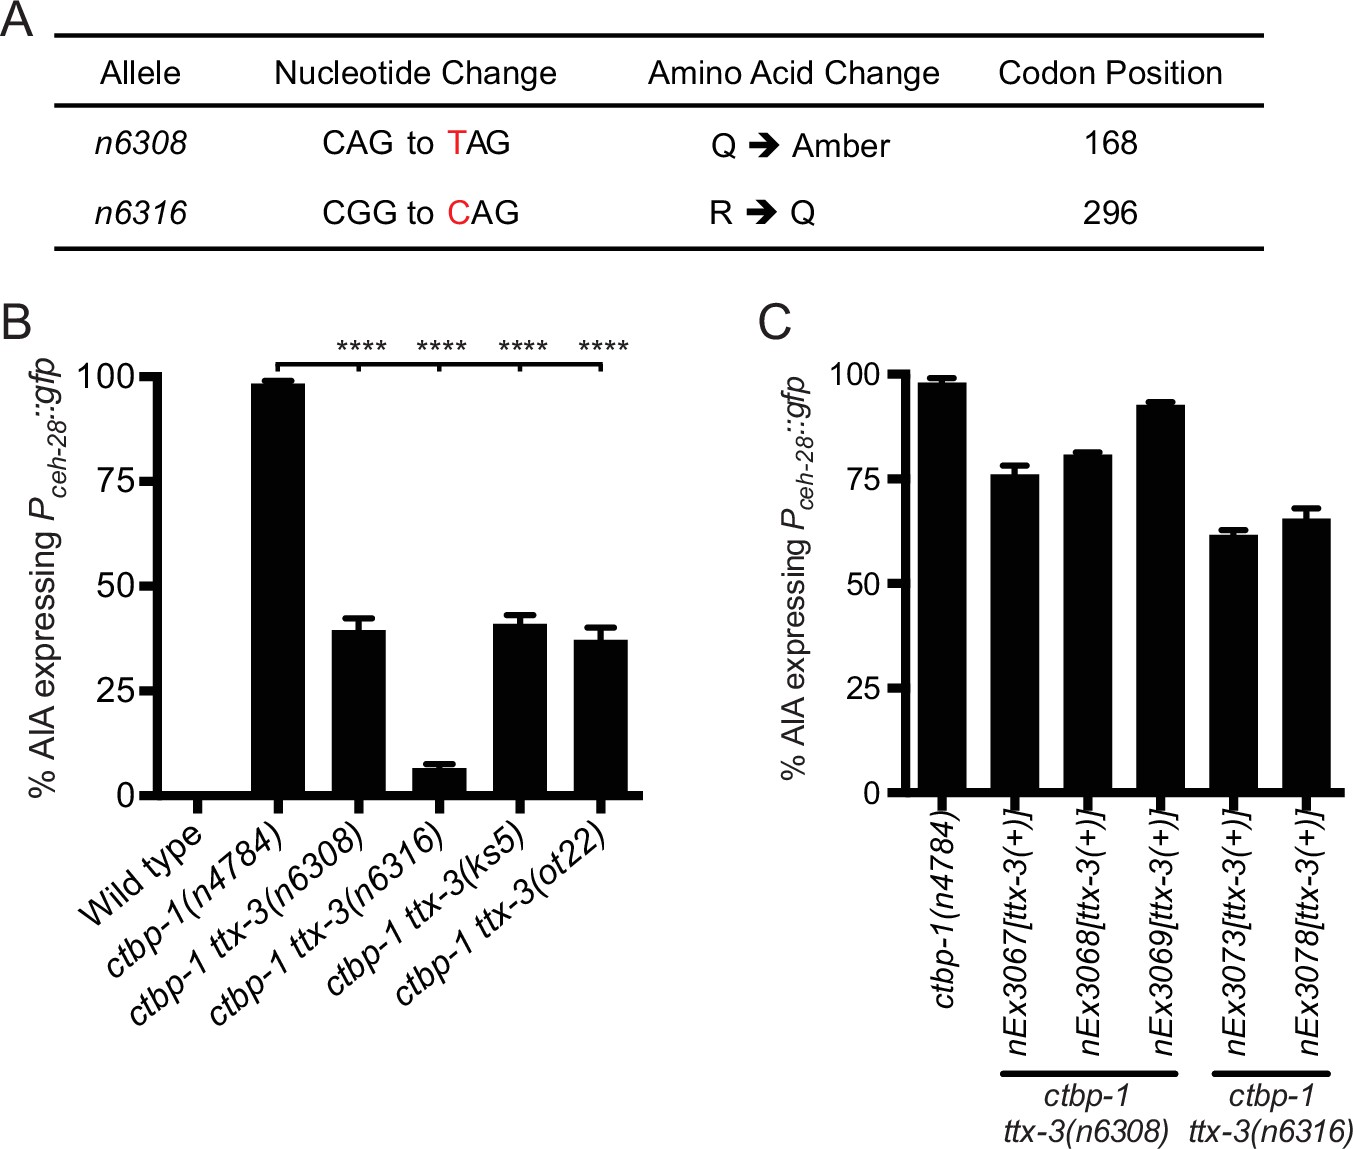
Characterization of ttx-3 alleles isolated as ctbp-1 suppressors.
(A) Table of ttx-3 mutant alleles isolated in this study as suppressors of ctbp-1-mediated nIs175[Pceh-28::gfp] misexpression in the AIA neurons. Specific nucleotide changes are denoted in red. Codon positions correspond to ttx-3a isoform. (B) Percentage of wild-type, ctbp-1(n4784), and ctbp-1 ttx-3 worms expressing nIs175 in the AIA neurons at the L4 larval stage. Mean ± SEM. n ≥ 100 worms scored per strain, three biological replicates. ****p < 0.0001, one-way ANOVA with Tukey’s correction. (C) Percentage of ctbp-1(n4784) and ctbp-1 ttx-3 worms carrying transgenic constructs expressing wild-type ttx-3 under its native promoter expressing nIs175 in the AIA neurons at the L4 larval stage. Mean ± SEM. n ≥ 50 worms scored per strain, three biological replicates. All strains in A-C contain nIs175[Pceh-28::gfp].
Figure 7 with 3 supplements
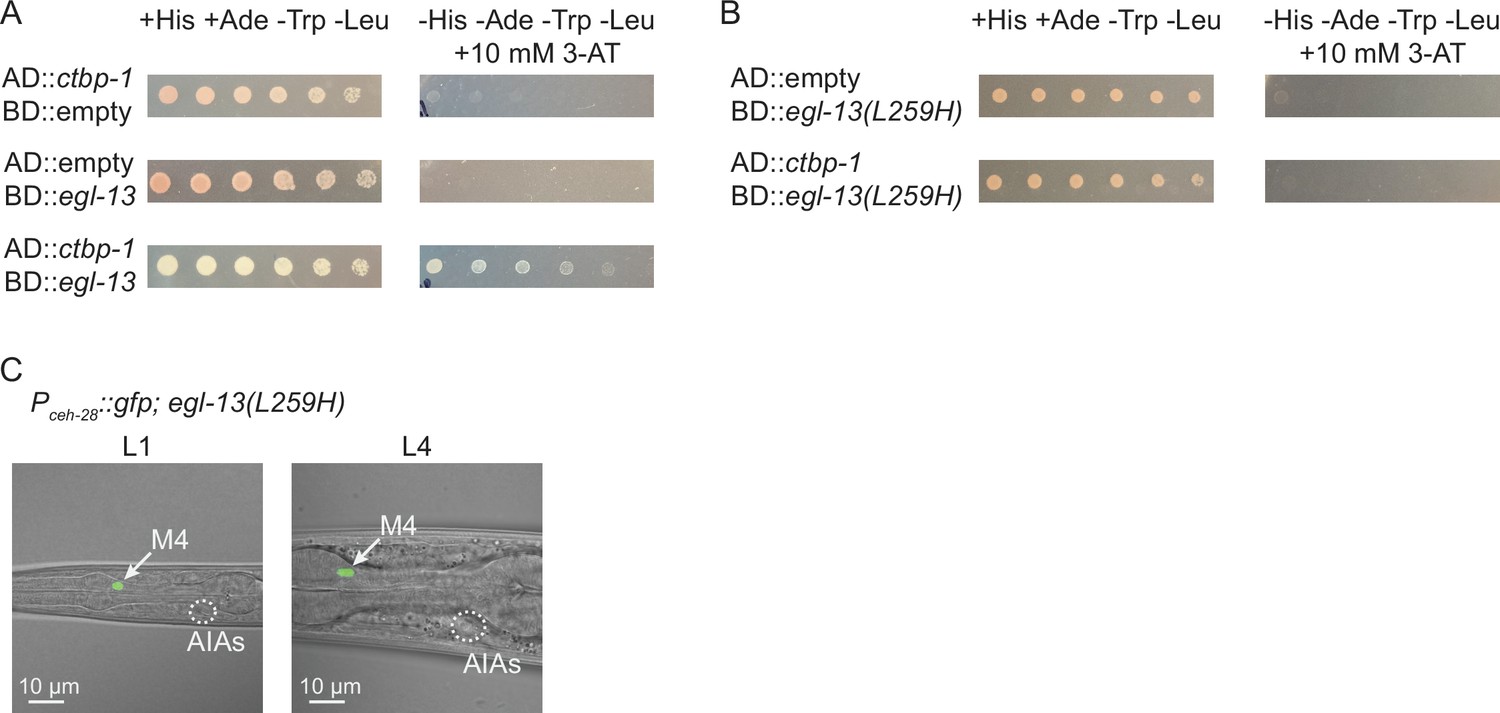
CTBP-1 can physically bind EGL-13 through EGL-13’s conserved PLNLS domain.
(A) Serial dilution of yeast colonies carrying plasmids containing the Gal4 Activating Domain (AD) and Gal4 DNA-Binding Domain (BD) fused to ctbp-1a cDNA, egl-13a cDNA, or neither (‘empty’). Strains carrying both domain-containing plasmids grow on+ His + Ade -Trp -Leu plates (left). Strains in which the proteins interact grow on -His -Ade -Trp -Leu + 10 mM 3-AT plates (right). (B) Serial dilution of yeast colonies carrying plasmids containing the Gal4 Activating Domain (AD) and Gal4 DNA-Binding Domain (BD) fused to ctbp-1a cDNA, egl-13a cDNA with amino acids 256–260 mutated from PLNLS to PLNHS (‘egl-13(L259H)’), or neither (‘empty’). (C) Representative images of (left) L1 and (right) L4 egl-13(n6675) mutants in which amino acid 259 was mutated from Leu to His (‘egl-13(L259H)’) displaying nIs175[Pceh-28::gfp] expression. Arrow, M4 neuron. Circle, AIAs. Scale bar, 10 μm. Images are oriented such that left corresponds to anterior, top to dorsal. Quantification of reporter expression in Figure 7—figure supplement 3.
-
Figure 7—source data 1
Source data for Figure 7 and supplements.
- https://cdn.elifesciences.org/articles/74557/elife-74557-fig7-data1-v1.zip
Figure 7—figure supplement 1
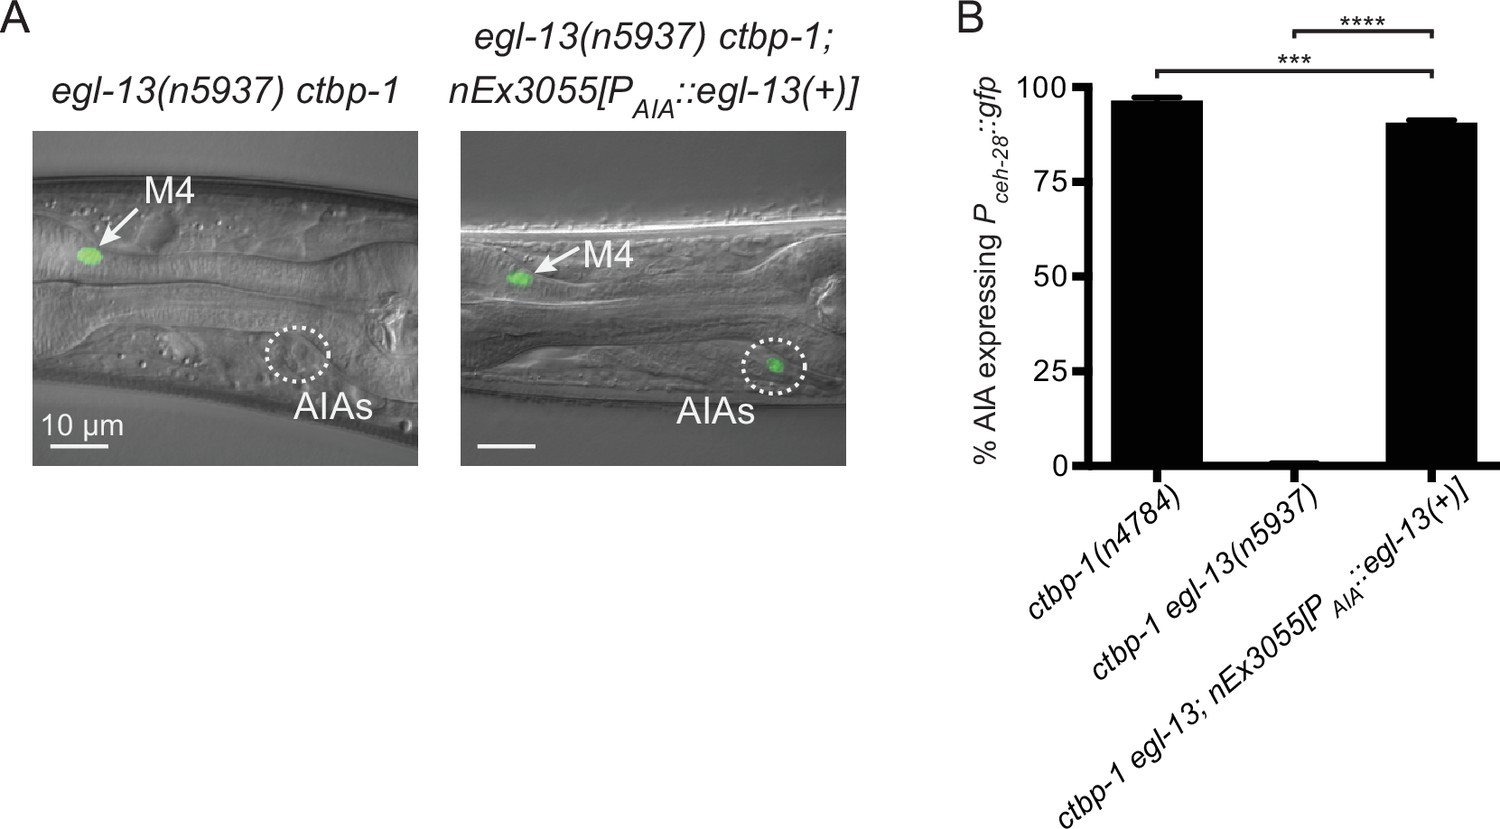
EGL-13 functions cell-autonomously to regulate AIA gene expression.
(A) Expression of nIs175[Pceh-28::gfp] in egl-13(n5937) ctbp-1(n4784) (left panel), and egl-13 ctbp-1 mutants carrying an extrachromosomal array expressing wild-type egl-13 under the AIA-specific promoter gcy-28.d (nEx3055, right panel) in L4 worms. Arrow, M4 neuron. Circle, AIAs. Scale bar, 10 μm. (B) Percentage of ctbp-1(n4784), egl-13(n5937) ctbp-1 and egl-13 ctbp-1; nEx3055 worms expressing nIs175 in the AIA neurons at the L4 larval stage. All strains contain nIs175[Pceh-28::gfp]. Mean ± SEM. n = 100 worms scored per strain, three biological replicates. ***p = 0.001, ****p < 0.0001, one-way ANOVA with Tukey’s correction. The alleles used for all panels of this figure were ctbp-1(n4784) and egl-13(n5937). All strains contain nIs175[Pceh-28::gfp]. Images are oriented such that left corresponds to anterior, top to dorsal.
Figure 7—figure supplement 2
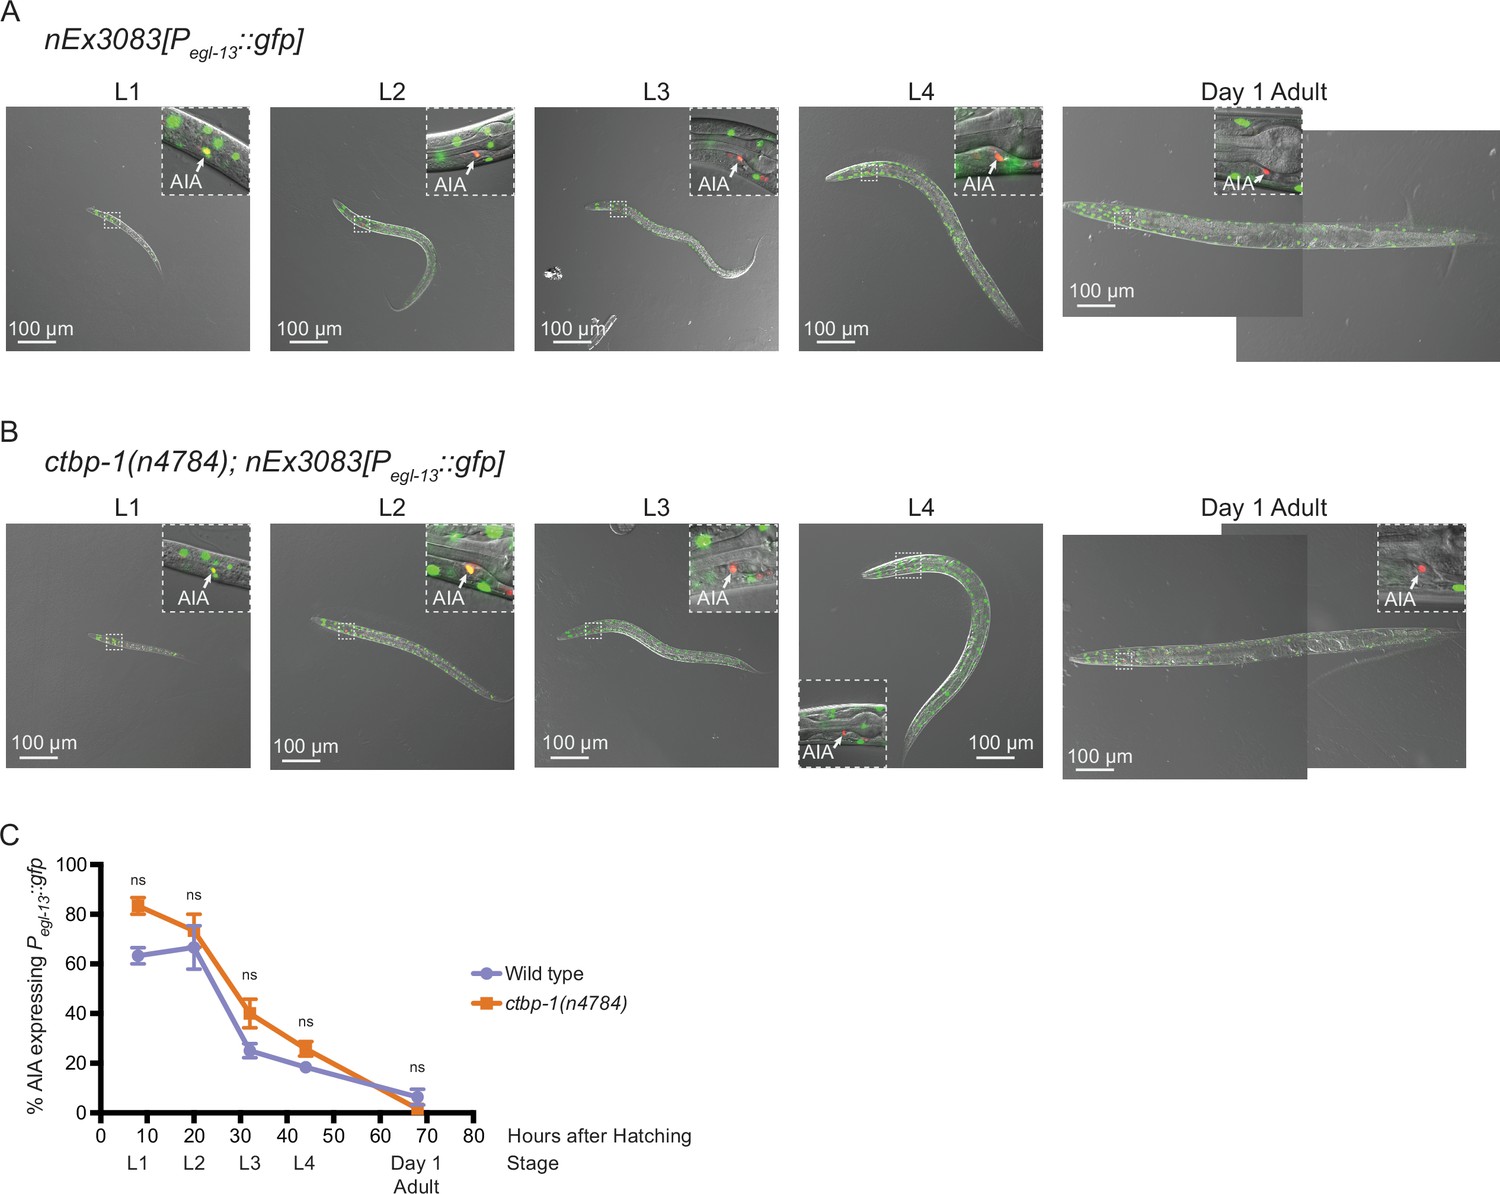
Pegl-13::gfp expression in wild-type and ctbp-1 mutant worms.
(A–B) nEx3083[Pegl-13::gfp] expression in (A) wild-type and (B) ctbp-1(n4784) worms at the L1, L2, L3, L4, and day 1 adult stages. Strains contain nIs843[Pgcy-28.d::mCherry] to mark AIA neurons. Inset, zoom-in on the AIA neurons. Scale bar, 100 μm. Images are oriented such that left corresponds to anterior, top to dorsal. (C) Percentage of AIAs expressing nEx3083 in wild-type and ctbp-1(n4784) worms over time. Time points correspond to the L1, L2, L3, L4 larval stages, and day 1 adult worms (indicated below X axis). All strains contain nIs843[Pgcy-28.d::mCherry]. Mean ± SEM. n ≥ 20 worms per strain per stage, three biological replicates. ns, not significant, one-way ANOVA with Tukey’s correction.
Figure 7—figure supplement 3
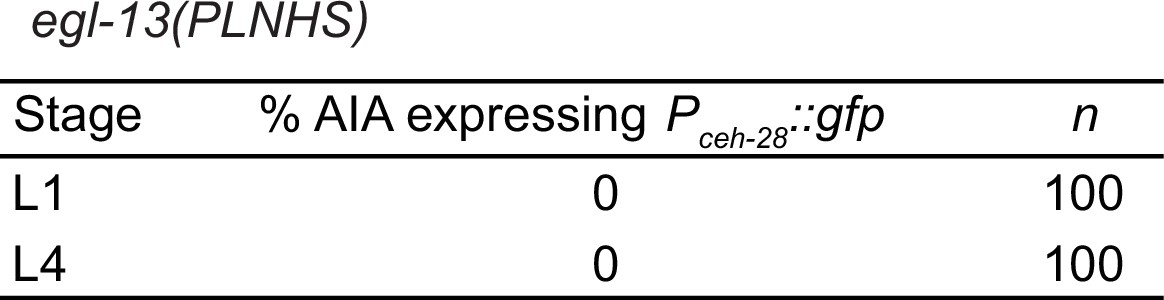
Quantification of Pceh-28::gfp expression in egl-13(n6675) mutants.
Expression of nIs175[Pceh-28::gfp] in egl-13(n6675) mutants carrying the targeted L259H mutation.
Figure 8
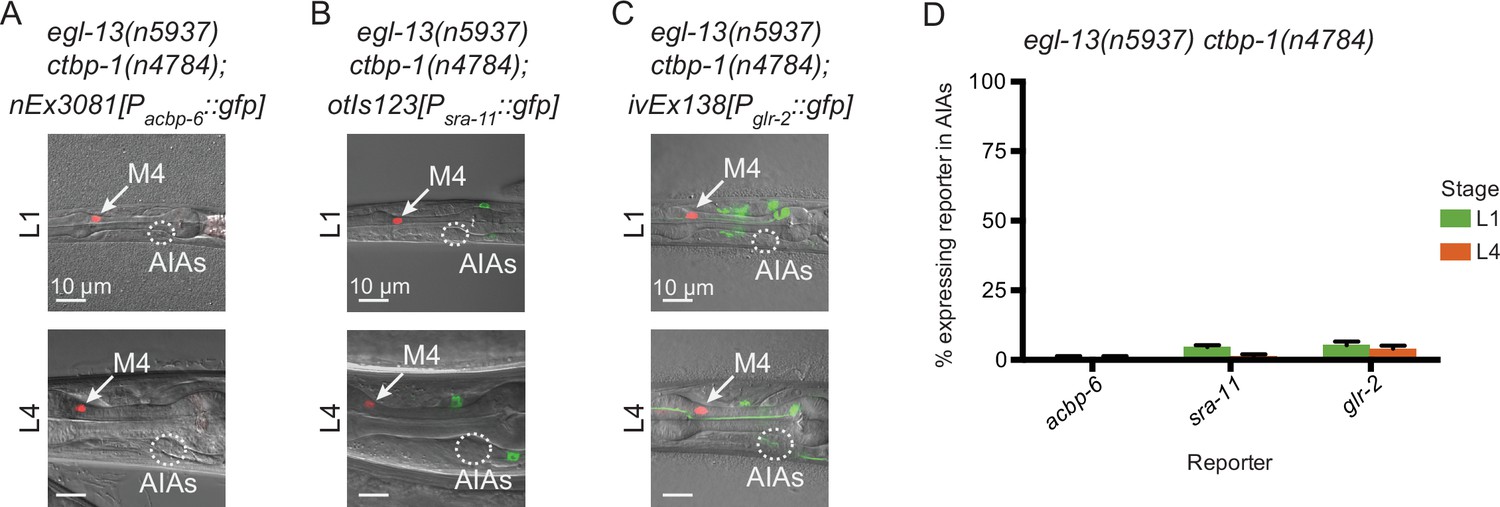
EGL-13 controls aspects of AIA gene expression.
(A–C) Expression of markers for AIA misexpressed genes (A) nEx3081[Pacbp-6::gfp], (B) otIs123[Psra-11::gfp], or (C) ivEx138[Pglr-2::gfp] in egl-13(n5937) ctbp-1(n4784) double mutants at the (top) L1 and (bottom) L4 larval stages. Arrow, M4 neuron. Circle, AIAs. Scale bar, 10 μm. (D) Percentage of egl-13(n5937) ctbp-1(n4784) double mutants expressing the indicated reporter in the AIA neurons at the L1 and L4 larval stages. Mean ± SEM. n ≥ 50 worms scored per strain, three biological replicates. The ctbp-1 allele used for all panels of this figure was n4784. All strains in A-D contain nIs348[Pceh-28::mCherry]. Images are oriented such that left corresponds to anterior, top to dorsal.
-
Figure 8—source data 1
Source data for Figure 8.
- https://cdn.elifesciences.org/articles/74557/elife-74557-fig8-data1-v1.zip
Figure 9
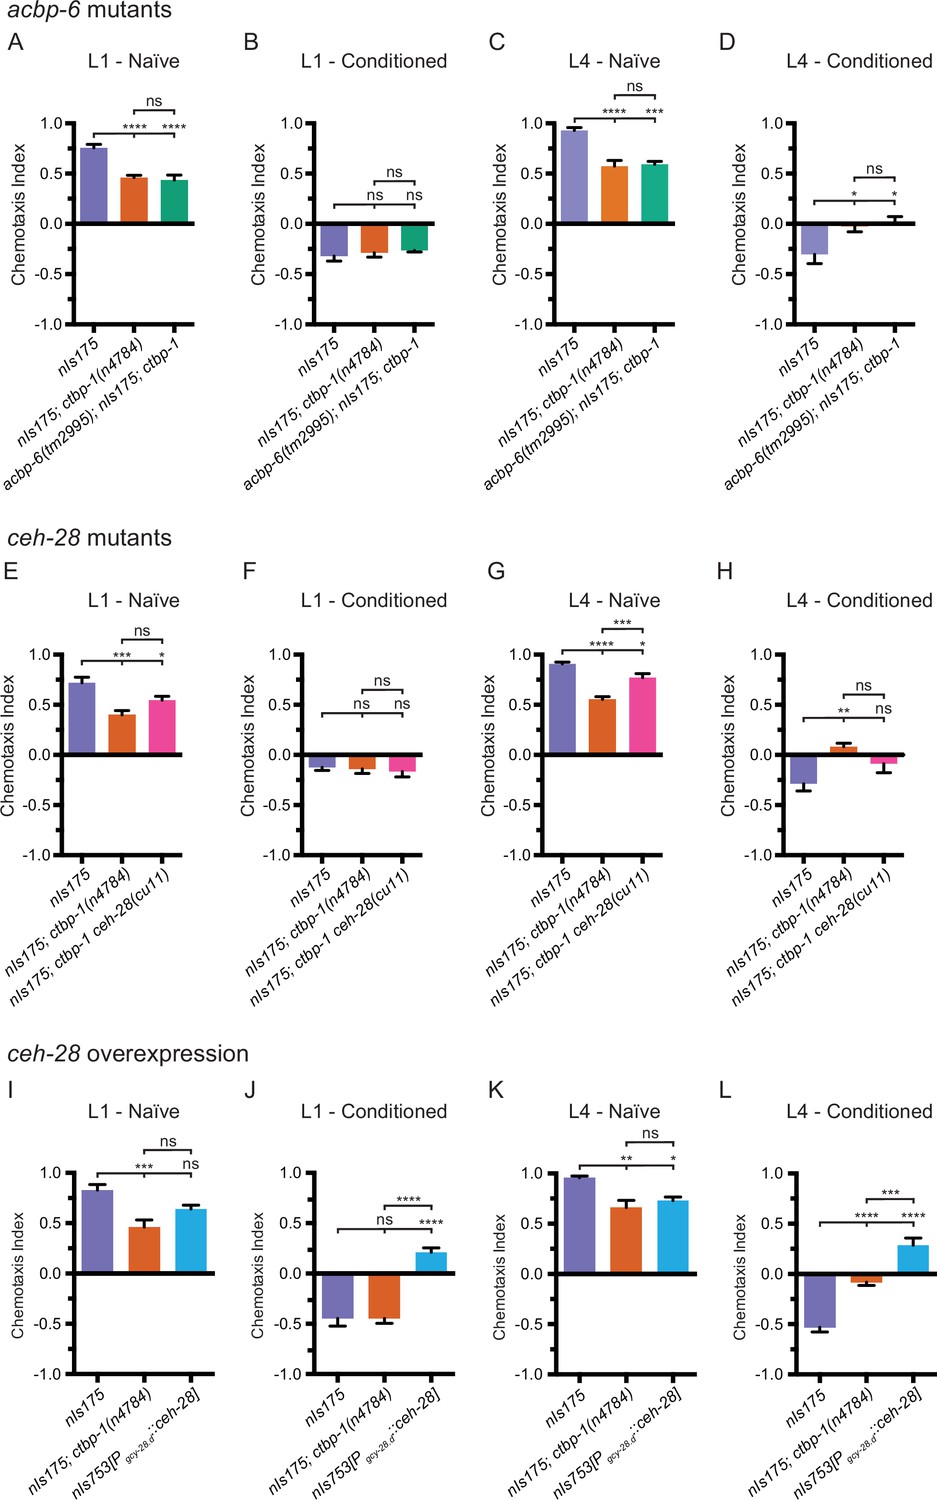
EGL-13 disrupts AIA function partially through driving misexpression of ceh-28 in ctbp-1 mutants.
(A–D) Chemotaxis indices of (A,C) naïve or (B,D) conditioned wild-type (nIs175), nIs175; ctbp-1(n4784), and acbp-6(tm2995); nIs175; ctbp-1 mutants at the (A–B) L1 or (C–D) L4 larval stage. Mean ± SEM. n ≥ 6 assays per condition, ≥ 50 worms per assay. ns, not significant, *p < 0.05, ***p = 0.0003, ****p < 0.0001, one-way ANOVA with Tukey’s correction. (E–H) Chemotaxis indices of (E,G) naïve or (F,H) conditioned wild-type (nIs175), nIs175; ctbp-1(n4784), and nIs175; ctbp-1 ceh-28(cu11) mutants at the (E–F) L1 or (G–H) L4 larval stage. Mean ± SEM. n ≥ 6 assays per condition, ≥ 50 worms per assay. ns, not significant, *p < 0.05, **p = 0.0031, ***p < 0.001, ****p < 0.0001 one-way ANOVA with Tukey’s correction. (I–L) Chemotaxis indices of (I,K) naïve or (J,L) conditioned wild-type (nIs175), nIs175; ctbp-1(n4784), and nIs753[Pgcy-28.d::ceh-28(+)] at the (I–J) L1 or (K–L) L4 larval stage. Mean ± SEM. n ≥ 6 assays per condition, ≥ 50 worms per assay. ns, not significant, *p = 0.0176, **p = 0.0018, ***p < 0.001, ****p < 0.0001, one-way ANOVA with Tukey’s correction. The ctbp-1 allele used for all panels of this figure was n4784.
-
Figure 9—source data 1
Source Data for Figure 9.
- https://cdn.elifesciences.org/articles/74557/elife-74557-fig9-data1-v1.zip
Figure 10

Model for the maintenance of the AIA cell identity by ctbp-1.
(A) The genetic pathway in which ctbp-1 promotes AIA morphology and glr-2 and sra-11 expression. ctbp-1 also inhibits egl-13, thereby repressing expression of ceh-28 and acbp-6 in the AIAs and promoting proper AIA function (B–D) Model for how CTBP-1 maintains the AIA cell identity. (B) We propose that CTBP-1 acts in the maintenance but not establishment of the AIA cell identity, and does so by targeting specific genetic loci for regulation through physical interaction with transcription factors such as EGL-13. TTX-3 is required for the establishment, but not the maintenance, of the AIA identity. (C) In the absence of CTBP-1, EGL-13 and other CTBP-1 targets drive expression at multiple genetic loci, resulting in changes to the gene expression, morphology and function (as assessed by butanone adaptation) of the AIAs. (D) When EGL-13 activity is also removed, gene expression and cellular function are no longer perturbed, while normal morphology is not restored, resulting in a ‘Partially Maintained AIA’.
Tables
Appendix 1—key resources table
| Reagent type (species) or resource | Designation | Source or reference | Identifiers | Additional information |
|---|---|---|---|---|
| Strain, strain background (C. elegans) | N2 (wild type) | Horvitz Lab collection | WBStrain00000001 | wild type |
| Strain, strain background (C. elegans) | MT15670 | Takashi Hirose/Bob Horvitz | n/a | nIs175[Pceh-28::gfp] |
| Strain, strain background (C. elegans) | MT15672 | Takashi Hirose/Bob Horvitz | n/a | nIs177[Pceh-28::gfp] |
| Strain, strain background (C. elegans) | MT15677 | This paper | n/a | nIs175; ctbp-1(n4778) Figure 1—figure supplement 1A–B |
| Strain, strain background (C. elegans) | MT16225 | This paper | n/a | nIs175; ctbp-1(n4784) Figure 1—figure supplement 1A–B |
| Strain, strain background (C. elegans) | MT15688 | This paper | n/a | nIs175; ctbp-1(n4789) Figure 1—figure supplement 1A–B |
| Strain, strain background (C. elegans) | MT15801 | This paper | n/a | nIs175; ctbp-1(n4800) Figure 1—figure supplement 1A–B |
| Strain, strain background (C. elegans) | MT15805 | This paper | n/a | nIs175; ctbp-1(n4804) Figure 1—figure supplement 1A–B |
| Strain, strain background (C. elegans) | MT15806 | This paper | n/a | nIs175; ctbp-1(n4805) Figure 1—figure supplement 1A–B |
| Strain, strain background (C. elegans) | MT15809 | This paper | n/a | nIs175; ctbp-1(n4808) Figure 1—figure supplement 1A–B |
| Strain, strain background (C. elegans) | MT15811 | This paper | n/a | nIs175; ctbp-1(n4810) Figure 1—figure supplement 1A–B |
| Strain, strain background (C. elegans) | MT15813 | This paper | n/a | nIs175; ctbp-1(n4813) Figure 1—figure supplement 1A–B |
| Strain, strain background (C. elegans) | MT15820 | This paper | n/a | nIs175; ctbp-1(n4819) Figure 1—figure supplement 1A–B |
| Strain, strain background (C. elegans) | MT15824 | This paper | n/a | nIs175; ctbp-1(n4823) Figure 1—figure supplement 1A–B |
| Strain, strain background (C. elegans) | MT15825 | This paper | n/a | nIs175; ctbp-1(n4824) Figure 1—figure supplement 1A–B |
| Strain, strain background (C. elegans) | MT15841 | This paper | n/a | nIs177; ctbp-1(n4840) Figure 1—figure supplement 1A–B |
| Strain, strain background (C. elegans) | MT15850 | This paper | n/a | nIs177; ctbp-1(n4849) Figure 1—figure supplement 1A–B |
| Strain, strain background (C. elegans) | MT15853 | This paper | n/a | nIs177; ctbp-1(n4852) Figure 1—figure supplement 1A–B |
| Strain, strain background (C. elegans) | MT15862 | This paper | n/a | nIs177; ctbp-1(n4861) Figure 1—figure supplement 1A–B |
| Strain, strain background (C. elegans) | MT15865 | This paper | n/a | nIs177; ctbp-1(n4864) Figure 1—figure supplement 1A–B |
| Strain, strain background (C. elegans) | MT15866 | This paper | n/a | nIs177; ctbp-1(n4865) Figure 1—figure supplement 1A–B |
| Strain, strain background (C. elegans) | MT26446 | This paper | n/a | nIs175; ctbp-1(tm5512) Figure 1—figure supplement 1C–D |
| Strain, strain background (C. elegans) | MT15918 | This paper | n/a | nIs175 introgressed into CB4856 “Hawaiian” backgroundUsed to map mutants Figure 1—figure supplement 1A |
| Strain, strain background (C. elegans) | MT16295 | This paper | n/a | nIs177 introgressed into CB4856 backgroundUsed to map mutants Figure 1—figure supplement 1A |
| Strain, strain background (C. elegans) | MT26522 | This paper | n/a | nIs175; ctbp-1(n4784) introgressed into CB4856 backgroundUsed to map mutants Figure 6A–C |
| Strain, strain background (C. elegans) | MT23360 | This paper | n/a | nIs175; ctbp-1(n4784); nEx2346[ctbp-1(+)] Figure 1—figure supplement 2A |
| Strain, strain background (C. elegans) | MT23361 | This paper | n/a | nIs175; ctbp-1(n4784); nEx2347[ctbp-1(+)] Figure 1A |
| Strain, strain background (C. elegans) | MT23714 | This paper | n/a | nIs175; ctbp-1(n4784); nIs743[Pgcy-28.d::ctbp-1(+)] Figure 1F |
| Strain, strain background (C. elegans) | MT25271 | This paper | n/a | nIs843[Pgcy-28.d::mCherry] Figure 1B |
| Strain, strain background (C. elegans) | MT26437 | This paper | n/a | nIs175; ctbp-1(n4784); nIs843 Figure 1B |
| Strain, strain background (C. elegans) | MT23365 | This paper | n/a | nIs175; ctbp-1(n4784); nEx2351[Phsp-16.2::ctbp-1(+);Phsp-16.41::ctbp-1(+)] Figure 1H |
| Strain, strain background (C. elegans) | MT18778 | Takashi Hirose/Bob Horvitz | n/a | nIs348[Pceh-28::mCherry]; lin-15AB(n765ts) |
| Strain, strain background (C. elegans) | MT20844 | This paper | n/a | nIs348[Pceh-28::mCherry]; ctbp-1(n4784) Figure 1—figure supplement 1E |
| Strain, strain background (C. elegans) | NH2466 | Caenorhabditis Genetics Center (CGC) | WBStrain00028771 | ayIs4[Pegl-17::gfp]; dpy-20(e1282ts) |
| Strain, strain background (C. elegans) | MT26417 | This paper | n/a | ayIs4; nIs348; ctbp-1(n4784) Figure 2A |
| Strain, strain background (C. elegans) | BW1946 | Caenorhabditis Genetics Center (CGC) | WBStrain00004003 | ctIs43[Pdbl-1::gfp] unc-42(e270) |
| Strain, strain background (C. elegans) | MT23726 | This paper | n/a | nIs348; ctIs43 unc-42(e270); ctbp-1(n4784) Figure 2A |
| Strain, strain background (C. elegans) | MT20852 | This paper | n/a | nIs491[Pser-7.b::mCherry] Figure 2A |
| Strain, strain background (C. elegans) | MT23427 | This paper | n/a | nIs491; ctbp-1(n4784) Figure 2A |
| Strain, strain background (C. elegans) | NY2080 | Caenorhabditis Genetics Center (CGC) | WBStrain00029170 | ynIs80[Pflp-21::gfp] |
| Strain, strain background (C. elegans) | MT23718 | This paper | n/a | nIs348; ctbp-1(n4784); ynIs80 Figure 2A |
| Strain, strain background (C. elegans) | OH10237 | Caenorhabditis Genetics Center (CGC) | WBStrain00029598 | otIs326[Pins-1::gfp] |
| Strain, strain background (C. elegans) | MT26422 | This paper | n/a | ctbp-1(n4784); otIs326Figure 2B |
| Strain, strain background (C. elegans) | JN1716 | Caenorhabditis Genetics Center (CGC) | n/a | peIs1716[Pins-1s::gfp;Pttx-3::mCherry] |
| Strain, strain background (C. elegans) | MT23717 | This paper | n/a | nIs348; ctbp-1(n4784); peIs1716 Figure 2B |
| Strain, strain background (C. elegans) | OH11030 | Caenorhabditis Genetics Center (CGC) | WBStrain00029645 | otIs317[Pmgl-1::mCherry]; otIs379[Pcho-1::gfp] |
| Strain, strain background (C. elegans) | MT26421 | This paper | n/a | nIs348; ctbp-1(n4784); otIs317; otIs379 Figure 2B |
| Strain, strain background (C. elegans) | MT26420 | This paper | n/a | ctbp-1(n4784); otIs317 Figure 2B |
| Strain, strain background (C. elegans) | MT25268 | This paper | n/a | nIs840[Pgcy-28.d::gfp]Figure 3A–D |
| Strain, strain background (C. elegans) | MT25270 | This paper | n/a | nIs842[Pgcy-28.d::gfp]Figure 3A–D |
| Strain, strain background (C. elegans) | MT26412 | This paper | n/a | nIs348; ctbp-1(n4784); nIs840Figure 3A–D |
| Strain, strain background (C. elegans) | MT26438 | This paper | n/a | nIs348; ctbp-1(n4784); nIs743; nIs840Figure 3E–H |
| Strain, strain background (C. elegans) | MT26439 | This paper | n/a | nIs348; ctbp-1(n4784); nIs840; nEx2351Figure 3I–L |
| Strain, strain background (C. elegans) | JN580 | Caenorhabditis Genetics Center (CGC) | n/a | peIs580[Pins-1s::casp1;Pins-1s::venus;Punc-122::gfp] |
| Strain, strain background (C. elegans) | MT23746 | This paper | n/a | nIs175; egl-13(n5937) ctbp-1(n4784) Figure 6B |
| Strain, strain background (C. elegans) | MT24129 | This paper | n/a | nIs175; egl-13(n6013) ctbp-1(n4784) Figure 6B |
| Strain, strain background (C. elegans) | MT25352 | This paper | n/a | nIs175; egl-13(n6313) ctbp-1(n4784) Figure 6B |
| Strain, strain background (C. elegans) | MT25347 | This paper | n/a | nIs175; ctbp-1(n4784) ttx-3(n6308) Figure 6C |
| Strain, strain background (C. elegans) | MT25355 | This paper | n/a | nIs175; ctbp-1(n4784) ttx-3(n6316) Figure 6C |
| Strain, strain background (C. elegans) | MT26486 | This paper | n/a | nIs175; egl-13(n5937) ctbp-1(n4784); nEx3062[egl-13(+)] Figure 6—figure supplement 1C |
| Strain, strain background (C. elegans) | MT26487 | This paper | n/a | nIs175; egl-13(n5937) ctbp-1(n4784); nEx3063[egl-13(+)]Figure 6—figure supplement 1C |
| Strain, strain background (C. elegans) | MT26549 | This paper | n/a | nIs175; egl-13(n6013) ctbp-1(n4784); nEx3080[egl-13(+)]Figure 6—figure supplement 1C |
| Strain, strain background (C. elegans) | MT26523 | This paper | n/a | nIs175; egl-13(n6313) ctbp-1(n4784); nEx3074[egl-13(+)]Figure 6—figure supplement 1C |
| Strain, strain background (C. elegans) | MT26548 | This paper | n/a | nIs175; egl-13(n6313) ctbp-1(n4784); nEx3079[egl-13(+)]Figure 6—figure supplement 1C |
| Strain, strain background (C. elegans) | MT26448 | This paper | n/a | nIs175; ctbp-1(n4784) ttx-3(ot22) Figure 6—figure supplement 2B |
| Strain, strain background (C. elegans) | MT26447 | This paper | n/a | nIs175; ctbp-1(n4784) ttx-3(ks5) Figure 6—figure supplement 2B |
| Strain, strain background (C. elegans) | MT26491 | This paper | n/a | nIs175; ctbp-1(n4784) ttx-3(n6308); nEx3067[ttx-3(+)]Figure 6—figure supplement 2C |
| Strain, strain background (C. elegans) | MT26492 | This paper | n/a | nIs175; ctbp-1(n4784) ttx-3(n6308); nEx3068[ttx-3(+)]Figure 6—figure supplement 2C |
| Strain, strain background (C. elegans) | MT26493 | This paper | n/a | nIs175; ctbp-1(n4784) ttx-3(n6308); nEx3069[ttx-3(+)]Figure 6—figure supplement 2C |
| Strain, strain background (C. elegans) | MT26521 | This paper | n/a | nIs175; ctbp-1(n4784) ttx-3(n6316); nEx3073[ttx-3(+)]Figure 6—figure supplement 2C |
| Strain, strain background (C. elegans) | MT26528 | This paper | n/a | nIs175; ctbp-1(n4784) ttx-3(n6316); nEx3078[ttx-3(+)]Figure 6—figure supplement 2C |
| Strain, strain background (C. elegans) | MT26481 | This paper | n/a | nIs175; egl-13(n5937) ctbp-1(n4784); nEx3055[Pgcy-28.d::egl-13(+)] Figure 7—figure supplement 1A–B |
| Strain, strain background (C. elegans) | MT26441 | This paper | n/a | nIs175; egl-13(n5937) ctbp-1(n4784); nIs840Figure 6E |
| Strain, strain background (C. elegans) | MT26442 | This paper | n/a | nIs175; ctbp-1(n4784) ttx-3(n6308); nIs840 Figure 6E |
| Strain, strain background (C. elegans) | MT26415 | This paper | n/a | evIs111[Prgef-1::gfp]; nIs843 Figure 5A–E |
| Strain, strain background (C. elegans) | MT26416 | This paper | n/a | ctbp-1(n4784); evIs111; nIs843 Figure 5A–E |
| Strain, strain background (C. elegans) | MT26444 | This paper | n/a | otIs123[Psra-11::gfp]; nIs843 Figure 5C |
| Strain, strain background (C. elegans) | MT26580 | This paper | n/a | nIs843; nEx3083[Pegl-13::gfp] Figure 5A |
| Strain, strain background (C. elegans) | MT26604 | This paper | n/a | ctbp-1(n4784); nIs843; nEx3083 Figure 5A |
| Strain, strain background (C. elegans) | MT26808 | This paper | n/a | nIs175; egl-13(n6675) Figure 7C |
| Strain, strain background (C. elegans) | MT26445 | This paper | n/a | nIs348; ctbp-1(n4784); otIs123 Figure 5C |
| Strain, strain background (C. elegans) | MT26524 | This paper | n/a | nIs348; egl-13(n5937) ctbp-1(n4784); otIs123 Figure 8B |
| Strain, strain background (C. elegans) | MT26504 | This paper | n/a | nIs843; ivEx138[Pglr-2::gfp] Figure 5E |
| Strain, strain background (C. elegans) | MT26505 | This paper | n/a | nIs348; ctbp-1(n4784); ivEx138 Figure 5E |
| Strain, strain background (C. elegans) | MT26550 | This paper | n/a | nIs348; egl-13(n5937) ctbp-1(n4784); ivEx138 Figure 8C |
| Strain, strain background (C. elegans) | MT26581 | This paper | n/a | nIs843; nEx3081[Pacbp-6::gfp] Figure 5A |
| Strain, strain background (C. elegans) | MT26551 | This paper | n/a | nIs348; ctbp-1(n4784); nEx3081 Figure 5A |
| Strain, strain background (C. elegans) | MT26582 | This paper | n/a | nIs348; egl-13(n5937) ctbp-1(n4784); nEx3081 Figure 8A |
| Strain, strain background (C. elegans) | MT26605 | This paper | n/a | acbp-6(tm2995); nIs175; ctbp-1(n4784) Figure 9A–D |
| Strain, strain background (C. elegans) | MT23725 | This paper | n/a | nIs175; ctbp-1(n4784) ceh-28(cu11) Figure 9E–H |
| Strain, strain background (C. elegans) | MT23736 | This paper | n/a | nIs753[Pgcy-28.d::ceh-28(+)] Figure 9I–L |
Additional files
Download links
A two-part list of links to download the article, or parts of the article, in various formats.
Downloads (link to download the article as PDF)
Open citations (links to open the citations from this article in various online reference manager services)
Cite this article (links to download the citations from this article in formats compatible with various reference manager tools)
The transcriptional corepressor CTBP-1 acts with the SOX family transcription factor EGL-13 to maintain AIA interneuron cell identity in Caenorhabditis elegans
eLife 11:e74557.
https://doi.org/10.7554/eLife.74557


