The transcriptional corepressor CTBP-1 acts with the SOX family transcription factor EGL-13 to maintain AIA interneuron cell identity in Caenorhabditis elegans
- Department of Biology, Massachusetts Institute of Technology, Howard Hughes Medical Institute, United States
Abstract
Cell identity is characterized by a distinct combination of gene expression, cell morphology, and cellular function established as progenitor cells divide and differentiate. Following establishment, cell identities can be unstable and require active and continuous maintenance throughout the remaining life of a cell. Mechanisms underlying the maintenance of cell identities are incompletely understood. Here, we show that the gene ctbp-1, which encodes the transcriptional corepressor C-terminal binding protein-1 (CTBP-1), is essential for the maintenance of the identities of the two AIA interneurons in the nematode Caenorhabditis elegans. ctbp-1 is not required for the establishment of the AIA cell fate but rather functions cell-autonomously and can act in later larval stage and adult worms to maintain proper AIA gene expression, morphology and function. From a screen for suppressors of the ctbp-1 mutant phenotype, we identified the gene egl-13, which encodes a SOX family transcription factor. We found that egl-13 regulates AIA function and aspects of AIA gene expression, but not AIA morphology. We conclude that the CTBP-1 protein maintains AIA cell identity in part by utilizing EGL-13 to repress transcriptional activity in the AIAs. More generally, we propose that transcriptional corepressors like CTBP-1 might be critical factors in the maintenance of cell identities, harnessing the DNA-binding specificity of transcription factors like EGL-13 to selectively regulate gene expression in a cell-specific manner.
Editor's evaluation
The paper presents an interesting addition to our understanding of cell fate maintenance, making incisive use of the power of C. elegans genetics.
https://doi.org/10.7554/eLife.74557.sa0Introduction
Over the course of animal development, complex networks of transcription factors act and interact to drive the division and differentiation of progenitor cells toward terminal cell identities (Davidson et al., 1998; Davidson et al., 2002; Levine and Davidson, 2005; Hobert, 2016a; Hsieh and Zhao, 2016; Homem et al., 2015; Altun-Gultekin et al., 2001; Zeng and Sanes, 2017). These networks of transcriptional activity often culminate in the activation of master transcriptional regulators that are responsible for directing the differentiation of a diverse range of cell and tissue types (Hobert, 2016a; Baker, 2001; Deneris and Hobert, 2014; Hobert et al., 2010; Masoudi et al., 2018). Examples of such master transcriptional regulators include the mammalian bHLH transcription factor MyoD, which specifies skeletal muscle cells (Weintraub et al., 1991; Lassar, 2017; Wardle, 2019); the Drosophila Pax-family transcription factor Eyeless, which drives differentiation of the fly eye (Halder et al., 1995; Gehring, 1996; Shen and Mardon, 1997; Treisman, 2013; Lima Cunha et al., 2019); and the C. elegans GATA transcription factor ELT-2, essential for development of the worm intestine (Fukushige et al., 1998; Fukushige et al., 1999; McGhee et al., 2009; Block and Shapira, 2015). Many such master transcriptional regulators are not only required to establish the identities of specific cell types but are subsequently continuously required to maintain those identities for the remaining life of the cell (Hobert, 2016a; McGhee et al., 2009; Matson et al., 2011; Mall et al., 2017; Simon et al., 2004; Vissers et al., 2018; Hsiao et al., 2013). Defects in the maintenance of cell identities can manifest as late-onset misregulated gene expression, altered morphology or disrupted cellular function, and often become progressively worse as the cell ages (Matson et al., 2011; Vissers et al., 2018; Riddle et al., 2013; O’Meara et al., 2010; Xu et al., 2017).
Previous studies of the nematode Caenorhabditis elegans have identified a class of master transcriptional regulators, termed terminal selectors (Hobert, 2016a; Masoudi et al., 2018; Hobert, 2008; Hobert, 2011; Hobert and Kratsios, 2019; Hobert, 2016b; Zhang et al., 2014). Terminal selectors drive the expression of whole batteries of gene activity that ultimately define the unique features of many different cell types (Deneris and Hobert, 2014; Hobert et al., 2010; Masoudi et al., 2018). Individual terminal selectors have been shown to contribute to the establishment and maintenance of multiple distinct C. elegans cell types and to drive the expression of many cell-type-specific genes (Altun-Gultekin et al., 2001; Zhang et al., 2014; Serrano-Saiz et al., 2013; Duggan et al., 1998; Kim et al., 2015; Alqadah et al., 2015). However, it has been unclear how individual terminal selectors can drive the expression of cell-type-specific genes in only the appropriate cell types rather than in all cells in which they act (Kerk et al., 2017; Zhou and Walthall, 1998; Winnier et al., 1999). Recent work has shown that terminal selectors appear to broadly activate the expression of many genes, including cell-type-specific genes, in all cells in which they function (Kerk et al., 2017; Yu et al., 2017). Piecemeal assemblies of transcription factors are then responsible for pruning this broad expression to restrict expression of cell-type-specific genes to the appropriate cell types (Kerk et al., 2017; Yu et al., 2017). This restriction of the activation of gene expression by terminal selectors appears to be an essential aspect of proper cell-identity maintenance (Vissers et al., 2018; Kerk et al., 2017; Yu et al., 2017; Wyler et al., 2016). However, it is not known how the myriad of transcription factors utilized to restrict terminal selector gene activation are coordinated and controlled.
Here we report the discovery that the C. elegans gene ctbp-1, which encodes the sole worm ortholog of the C-terminal Binding Protein (CtBP) family of transcriptional corepressors (Turner and Crossley, 2001; Chinnadurai, 2002; Chinnadurai, 2003; Shi et al., 2003; Stankiewicz et al., 2014; Nicholas et al., 2008; Reid et al., 2014; Reid et al., 2015; Sherry et al., 2020), functions to maintain the cell identity of the two AIA interneurons. We demonstrate that CTBP-1 functions with the SOX-family transcription factor EGL-13 (Gramstrup Petersen et al., 2013; Cinar et al., 2003) to maintain multiple aspects of the AIA cell identity and propose that CTBP-1 does so in part by utilizing EGL-13 to repress transcriptional activity in the AIAs.
Results
Mutations in ctbp-1 cause ceh-28 reporter misexpression in the AIA neurons
In previous studies, we screened for and characterized mutations that prevent the programmed cell death of the sister cell of the C. elegans M4 neuron (Hirose and Horvitz, 2013; Hirose et al., 2010). For these screens, we used the normally M4-specific GFP transcriptional reporter Pceh-28::gfp and identified isolates with an undead M4 sister cell, which expresses characteristics normally expressed by the M4 cell, on the basis of ectopic GFP expression. In addition to mutants with an undead M4 sister cell, we isolated 18 mutant strains that express Pceh-28::gfp in a manner uncharacteristic of M4 or its undead sister. These mutants express Pceh-28::gfp in a bilaterally symmetric pair of cells located near the posterior of the C. elegans head, far from both M4 and the single M4 sister cell (Figure 1A).
Figure 1 with 2 supplements see all
ctbp-1 mutants misexpress Pceh-28::gfp in the AIA neurons.
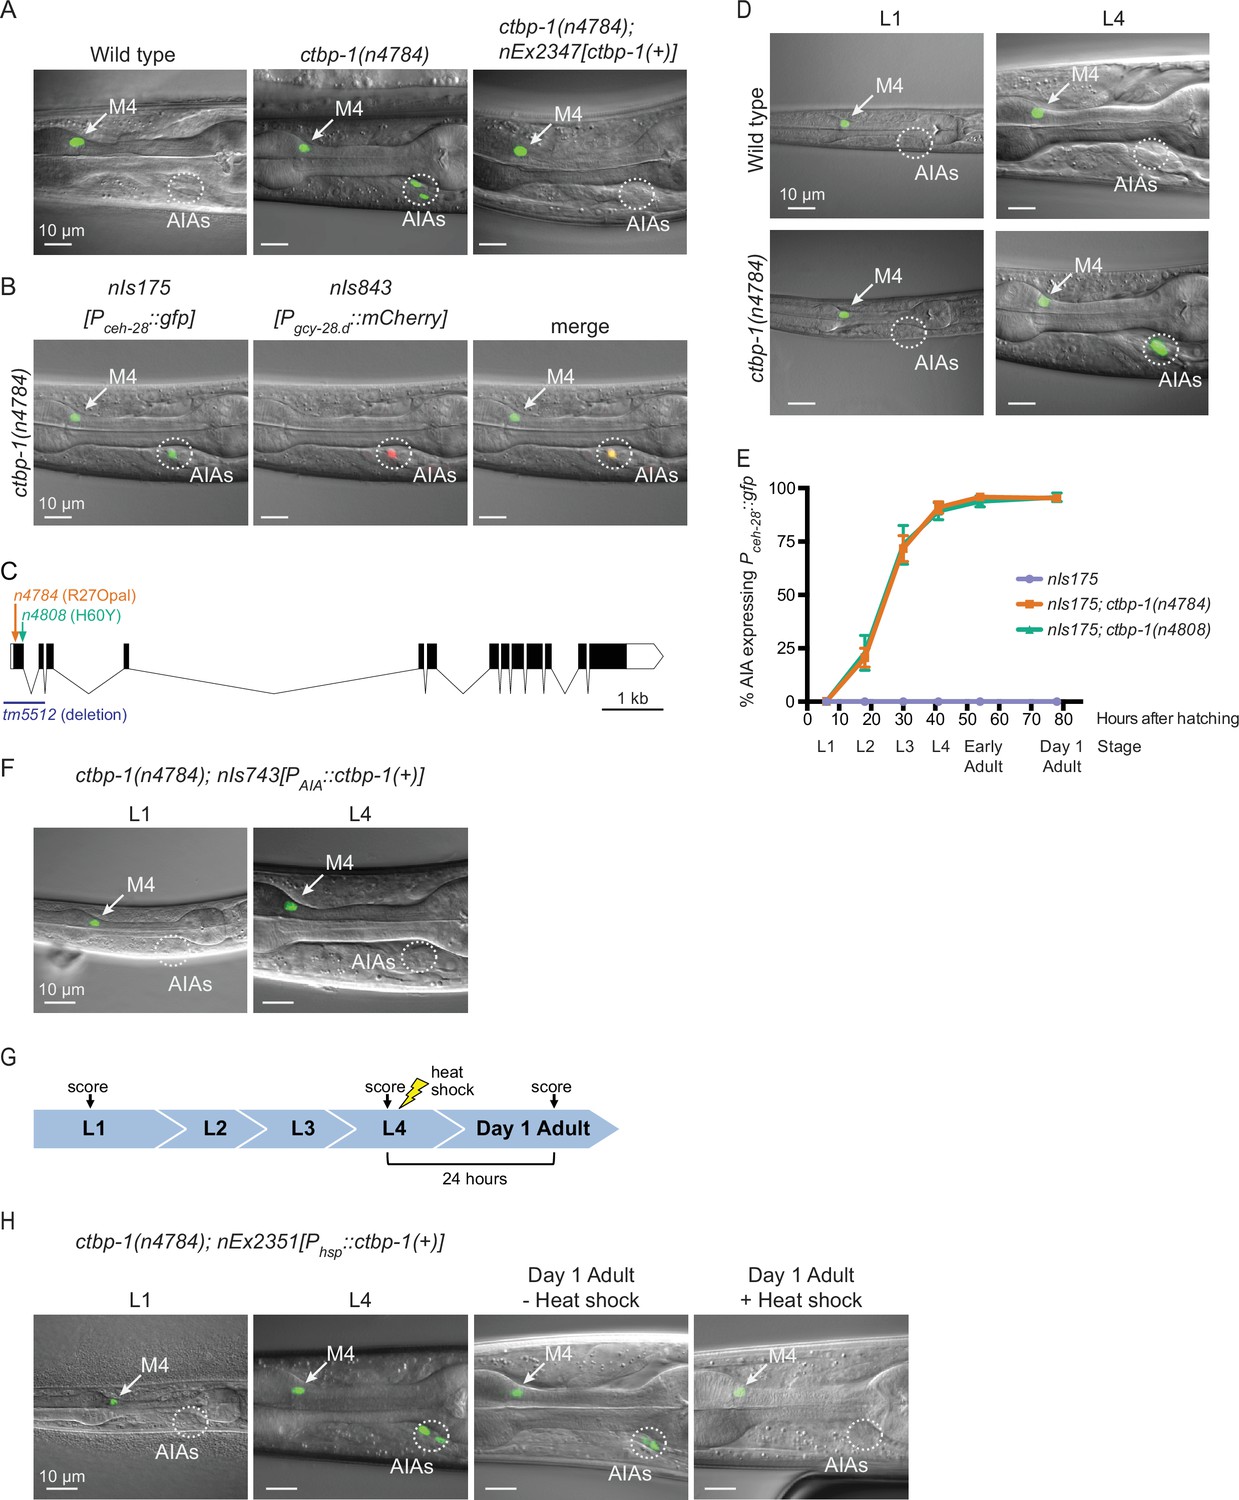
(A) Expression of the M4-specific marker nIs175[Pceh-28::gfp] in the wild type (left panel), a ctbp-1(n4784) mutant (middle panel), and a ctbp-1 mutant carrying an extrachromosomal array expressing wild-type ctbp-1 under its native promoter (nEx2347) (right panel). Arrow, M4 neuron. Circle, AIAs. Scale bar, 10 μm. (B) A ctbp-1(n4784) mutant expressing nIs175 (left panel) and the AIA marker nIs843[Pgcy-28.d::mCherry] (middle panel). Merge, right panel. Arrow, M4 neuron. Circle, AIAs. Scale bar, 10 μm. (C) Gene diagram of the ctbp-1a isoform. Arrows (above), point mutations. Line (below), deletion. Scale bar (bottom right), 1 kb. Additional ctbp-1 alleles are shown in Figure 1—figure supplement 1B. (D) nIs175 expression in wild-type (top) and ctbp-1(n4784) (bottom) worms at the L1 larval stage (left) and L4 larval stage (right). Arrow, M4 neuron. Circle, AIAs. Scale bar, 10 μm. (E) Percentage of wild-type, ctbp-1(n4784), and ctbp-1(n4808) worms expressing nIs175 in the AIA neurons over time. Time points correspond to the L1, L2, L3, and L4 larval stages, early adult, and day 1 adult worms (indicated below X axis). Mean ± SEM. n ≥ 60 worms scored per strain per stage, four biological replicates. (F) Expression of nIs175 in ctbp-1 mutants containing a transgene driving expression of wild-type ctbp-1 under an AIA-specific promoter (nIs743[Pgcy-28.d::ctbp-1(+)]) in L1 and L4 larval worms. Arrow, M4 neuron. Circle, AIAs. Scale bar, 10 μm. (G) Schematic for the heat-shock experiment shown in H. (H) nIs175 expression in ctbp-1(n4784) mutants carrying the heat-shock-inducible transgene nEx2351[Phsp-16.2::ctbp-1(+); Phsp-16.41::ctbp-1(+)]. Arrow, M4 neuron. Circle, AIAs. Scale bar, 10 μm. All strains shown contain the transgene nIs175[Pceh-28::gfp]. Images are oriented such that left corresponds to anterior, top to dorsal. Quantification of reporter expression from A, B, F in Figure 1—figure supplement 2. Quantification of reporter expression from H in Figure 1—figure supplement 2.
-
Figure 1—source data 1
Source data for Figure 1 and supplements.
- https://cdn.elifesciences.org/articles/74557/elife-74557-fig1-data1-v1.zip
These mutations define a single complementation group, and all 18 mutant strains have mutations in the transcriptional corepressor gene ctbp-1 (Figure 1C; Figure 1—figure supplement 1A-B; Figure 1—figure supplement 2A). These ctbp-1 alleles include three splice-site mutations and nine nonsense mutations (such as the mutation n4784, an early nonsense mutation and one of many presumptive null alleles of the gene). The mutant phenotype is recessive, and a transgenic construct carrying a wild-type copy of ctbp-1 expressed under its native promoter fully rescued the GFP misexpression caused by n4784 (Figure 1A; quantified in Figure 1—figure supplement 2A). tm5512, a 632 bp deletion spanning the transcription start site and first two exons of the ctbp-1a isoform and a presumptive null allele of this gene (C. elegans Deletion Mutant Consortium, 2012), likewise caused Pceh-28::gfp misexpression in two cells in the posterior region of the head (Figure 1—figure supplement 1C-D), similar to our ctbp-1 isolates. These findings demonstrate that loss of ctbp-1 function is responsible for Pceh-28::gfp misexpression.
To determine the identity of the cells misexpressing the normally M4-specific marker Pceh-28::gfp, we examined reporters for cells in the vicinity of the observed misexpression in ctbp-1 mutants. The AIA-neuron reporter nIs843[Pgcy-28.d::mCherry] showed complete overlap with misexpressed Pceh-28::gfp, indicating that the cells misexpressing the M4 reporter are the two bilaterally symmetric and embryonically-generated AIA interneurons (Figure 1B).
The penetrance of ceh-28 reporter misexpression in the AIA neurons increases with age
While characterizing ctbp-1 mutants, we noticed that fewer young worms misexpress Pceh-28::gfp in the AIAs than do older worms (Figure 1D). To investigate the temporal aspect of this phenotype, we scored ctbp-1 mutants for Pceh-28::gfp misexpression throughout the four worm larval stages (L1-L4) and into the first day of adulthood (‘early’ and ‘day 1’ adults). ctbp-1 mutants rarely misexpressed Pceh-28::gfp at early larval stages, but displayed an increasing penetrance, though invariant expressivity, of this defect as worms transitioned through larval development, such that by the last larval stage (L4) nearly all worms exhibited reporter misexpression specifically and solely in the AIAs (Figure 1E). A similar stage-dependent increase in reporter expression in ctbp-1 mutants occurred in mutants carrying a second independently generated ceh-28 reporter, nIs348[Pceh-28::mCherry] (Figure 1—figure supplement 1E). These results demonstrate that ctbp-1 function prevents an age-dependent misexpression of the M4-specific gene ceh-28 in the unrelated AIA neurons.
We next asked in what cells and at what stages ctbp-1 functions to suppress Pceh-28::gfp expression in the AIAs. We generated a transgenic construct that expresses wild-type ctbp-1 specifically in the AIAs, nIs743[Pgcy-28.d::ctbp-1(+)] (hereafter referred to as nIs743[PAIA::ctbp-1(+)]). We found that AIA-specific restoration of ctbp-1 was sufficient to suppress Pceh-28::gfp misexpression in an otherwise ctbp-1 mutant background (Figure 1F; quantified in Figure 1—figure supplement 2A), demonstrating that ctbp-1 is able to act cell-autonomously to regulate ceh-28 expression in the AIA neurons.
To determine if ctbp-1 can act in older animals to suppress AIA gene misexpression, we generated a transgenic construct that drives expression of wild-type ctbp-1 throughout the worm in response to a short heat shock, nEx2351[Phsp-16.2::ctbp-1(+); Phsp-16.41::ctbp-1(+)] (hereafter referred to as nEx2351[Phsp::ctbp-1(+)]). We found that heat shock during the L4 larval stage was sufficient to suppress Pceh-28::gfp misexpression in adult ctbp-1 mutant AIAs (Figure 1G–H; quantified in Figure 1—figure supplement 2B), demonstrating that ctbp-1 can act in L4-to-young adult stage worms to regulate AIA gene expression.
From these data we conclude that ctbp-1 is able to act cell-autonomously and in L4-to-young adult worms to prevent expression of at least one non-AIA gene in the AIA neurons.
ctbp-1 mutant AIAs are not transdifferentiating into an M4-like cell identity
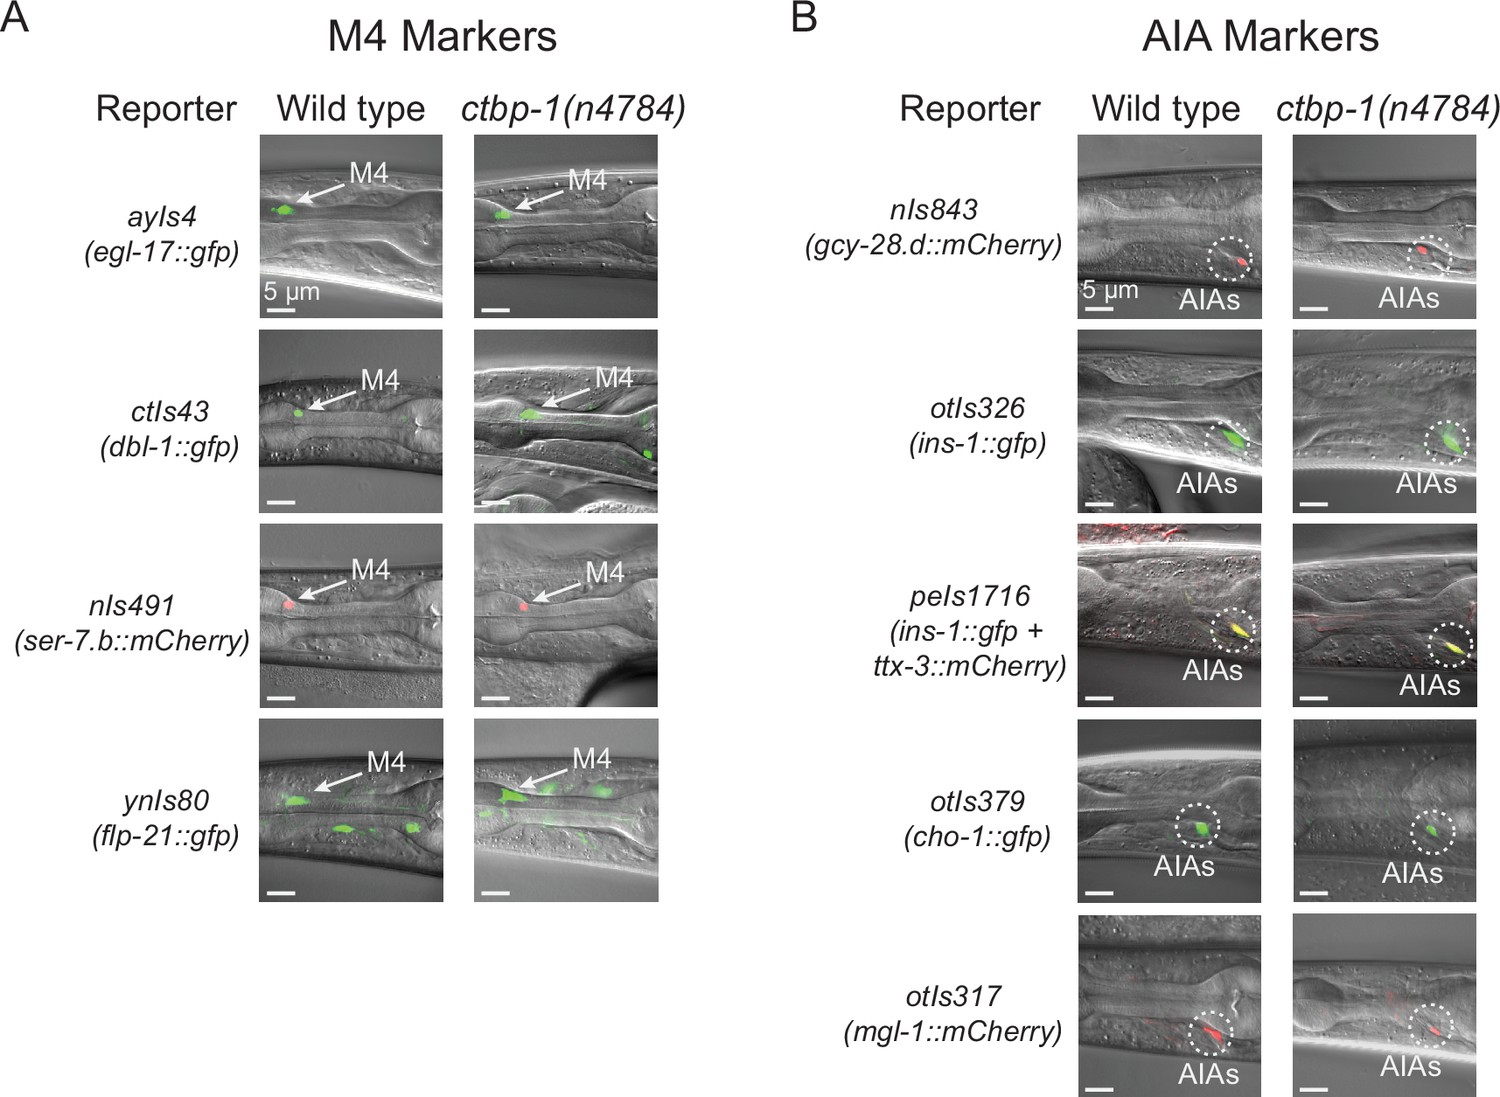
We asked if Pceh-28::gfp misexpression in the AIAs of ctbp-1 mutants might be a consequence of the AIAs transdifferentiating into an M4-like cell identity. We scored ctbp-1 mutants for cell-type markers expressed in, although not necessarily unique to, either M4 or the AIA neurons (Figure 2A–B; quantified in Figure 2—figure supplement 1A-B). We found that ctbp-1 mutant AIAs expressed all five of five AIA markers tested and did not express any of four other (non-ceh-28) M4 markers tested. Of particular note, ctbp-1 mutant AIAs did not misexpress either of the two tested M4 genes known to be directly regulated by ceh-28 (i.e. dbl-1 and egl-17), indicating that the ceh-28 misexpression in mutant AIAs does not activate the ceh-28 regulatory pathway (Ramakrishnan and Okkema, 2014; Ramakrishnan et al., 2014). We conclude that ctbp-1 mutant AIAs are not transdifferentiated into M4-like cells and instead seem to retain much of their AIA identity while gaining at least one M4 characteristic (i.e. ceh-28 expression) later in life.
Figure 2 with 1 supplement see all
ctbp-1 mutant AIAs retain multiple aspects of their AIA gene expression profile.
(A–B) Expression of (A) M4 markers egl-17, dbl-1, ser-7.b, and flp-21 and (B) AIA markers gcy-28.d, ins-1, ttx-3, cho-1, and mgl-1 in wild-type (left image) and ctbp-1(n4784) (right image) L4 larval worms. Arrow, M4 neuron. Circles, AIAs. Scale bar, 5 μm. Images are oriented such that left corresponds to anterior, top to dorsal. Quantification of reporter expression in Figure 2—figure supplement 1A-B.
-
Figure 2—source data 1
Source data for Figure 2 and supplements.
- https://cdn.elifesciences.org/articles/74557/elife-74557-fig2-data1-v1.zip
ctbp-1 mutants display an increasingly severe disruption of AIA morphology
Because of the time-dependency of the defect of ctbp-1 mutants in AIA cell identity, we hypothesized that ctbp-1 might act to maintain the AIA cell identity. To test this hypothesis, we examined morphological and functional aspects of AIA identity at both early (L1) and late (L4) larval stages. To assay AIA morphology, we generated a transgenic construct driving expression of GFP throughout the AIA cell (nIs840[Pgcy-28.d::gfp]). We crossed this construct into ctbp-1 mutant worms and visualized AIA morphology in L1 and L4 larvae as well as in day 1 adults (Figure 3A). We found that L1 ctbp-1 mutant AIAs appeared grossly wild-type in morphology (Figure 3A). However, L4 and adult ctbp-1 mutant AIAs had ectopic neurite branches that extended from both the anterior and posterior ends of the AIA cell body (Figure 3A). The penetrance of these ectopic branches increased progressively in later larval stage and adult mutants (Figure 3B–C). Older ctbp-1 mutant AIAs also appeared to have an elongated cell body compared to wild-type AIAs. Quantification of this defect revealed that L4 and adult mutant AIA cell bodies, but not those of L1s, were significantly longer than their wild-type counterparts (Figure 3D). To assess if this increase in AIA length was a consequence of an increase in AIA size, we measured the maximum area of the AIA cell body from cross-sections of these cells. We found that the maximum area of the AIA cell body did not significantly differ between wild-type and mutant AIAs at any stage (Figure 3—figure supplement 1A), indicating that mutant AIAs were misshapen but not enlarged. To confirm that we were not biased by an awareness of genotype while measuring AIA lengths, we blinded the wild-type and ctbp-1 AIA images used for length measurements and scored the blinded images as either ‘normal’ or ‘elongated’ (Figure 3—figure supplement 1B). Again, at the L1 larval stage, both wild-type and ctbp-1 mutant AIAs appeared overwhelmingly ‘normal’, whereas at both the L4 larval stage and in day 1 adults ctbp-1 mutant AIAs were scored as ‘elongated’ at a consistently higher rate than their wild-type counterparts. Collectively, these results demonstrate that ctbp-1 mutant AIAs display abnormal morphology and that the severity of the observed morphological defects in ctbp-1 mutants increases from L1 to L4 to adulthood. Furthermore, the relative lack of AIA morphological defects in L1 ctbp-1 mutants suggests that ctbp-1 is not required for the establishment of proper AIA morphology but instead acts to maintain AIA morphology over time.
Figure 3 with 2 supplements see all

Loss of ctbp-1 results in a progressive decline in AIA morphology.
(A) Three representative images of an AIA neuron in wild-type (left) and ctbp-1(n4784) (right) worms at L1 (top), L4 (middle), and day 1 adult (bottom) stages. Arrows, examples of ectopic neurites protruding from the AIA cell body. Scale bar, 5 μm. (B–C) Percentage of AIAs in wild-type and ctbp-1 worms at the L1, L4, and day 1 adult stages with an ectopic neurite protruding from the (B) anterior or (C) posterior of the AIA cell body. Mean ± SEM. n = 60 AIAs scored per strain per stage, four biological replicates. ns, not significant (p = 0.356), **p < 0.01, ****p < 0.0001, unpaired t-test. (D) Quantification of AIA cell body length in wild-type and ctbp-1 worms at the L1, L4, and day 1 adult stages. Mean ± SEM. n = 30 AIAs scored per strain per stage. ns, not significant (p = 0.806), *p = 0.0133, ****p < 0.0001, unpaired t-test. (E) Three representative images of an AIA neuron in ctbp-1; nIs743[Pgcy-28.d::ctbp-1(+)] worms at L1 (top), L4 (middle), and day 1 adult (bottom) stages. Arrows, examples of ectopic neurites protruding from the AIA cell body. Scale bar, 5 μm. (F–G) Percentage of AIAs in wild-type, ctbp-1, and ctbp-1; nIs743 worms at the L1, L4, and day 1 adult stages with an ectopic neurite protruding from the (F) anterior or (G) posterior of the AIA cell body. Mean ± SEM. n = 30 AIAs scored per strain per stage, three biological replicates. ns, not significant, **p = 0.0065, ***p < 0.001, ****p < 0.0001, one-way ANOVA with Tukey’s correction. (H) Quantification of AIA cell body length in wild-type, ctbp-1 and ctbp-1; nIs743 worms at the L1, L4, and day 1 adult stages. Mean ± SEM. n ≥ 30 AIAs scored per strain per stage. ns, not significant, **p = 0.0015, ****p < 0.0001, one-way ANOVA with Tukey’s correction. (I) Three representative images of an AIA neuron in ctbp-1; nEx2351[Phsp-16.2::ctbp-1(+); Phsp-16.41::ctbp-1(+)] worms at L4 (top), day 1 adult with heat shock (+ HS) (middle) and day 1 adult without heat shock (- HS) (bottom). Arrows, examples of ectopic neurites protruding from the AIA cell body. Scale bar, 5 μm. (J–K) Percentage of AIAs in wild-type, ctbp-1 and ctbp-1; nEx2351 worms at L4 and day 1 adult (with or without heat shock) stages with an ectopic neurite protruding from the (J) anterior or (K) posterior of the AIA cell body. Mean ± SEM. n = 30 AIAs scored per strain per stage, three biological replicates. ns, not significant, *p < 0.05, **p = 0.0043, ***p < 0.001, ****p < 0.0001, one-way ANOVA with Tukey’s correction. (L) Quantification of AIA cell body length in wild-type, ctbp-1, and ctbp-1; nEx2351 worms at L4 and day 1 adult (with or without heat shock) stages. Mean ± SEM. n ≥ 30 AIAs scored per strain per stage. ns, not significant, *p < 0.05, ****p < 0.0001, one-way ANOVA with Tukey’s correction. The ctbp-1 allele used for all panels of this figure was n4784. All strains contain nIs840[Pgcy-28.d::gfp], and all strains other than ‘Wild type’ contain nIs348[Pceh-28::mCherry] (not shown in images). Images are oriented such that left corresponds to anterior, top to dorsal.
-
Figure 3—source data 1
Source data for Figure 3 and supplements.
- https://cdn.elifesciences.org/articles/74557/elife-74557-fig3-data1-v1.zip
We next asked if ctbp-1 acts cell-autonomously and at later stages to regulate AIA morphology as it does for AIA gene expression. We visualized ctbp-1 mutant AIAs carrying the AIA-specific ctbp-1(+) rescue construct nIs743[PAIA::ctbp-1(+)] (Figure 3E). We found that AIA-specific restoration of ctbp-1 in mutant worms rescued all AIA morphological defects to near-wild-type levels at all stages tested, indicating that ctbp-1 can act cell-autonomously to regulate AIA morphology (Figure 3F–H). Next, we visualized ctbp-1 mutant worms carrying the heat shock-inducible ctbp-1(+) rescue construct nEx2351[Phsp::ctbp-1(+)]. We found that heat shock at the L4 stage did not restore ctbp-1 mutant AIA morphology in day 1 adults back to wild type. While heat-shocked adults did display a lower frequency of morphological defects than did their non-heat-shocked counterparts, these differences were not significant, suggesting that brief restoration of wild-type ctbp-1 activity is not able to restore mutant AIA morphology (Figure 3I–L). To ensure that the heat shock itself had not caused the slight difference in the frequency of AIA morphological defects, we compared heat-shocked and non-heat-shocked wild-type and ctbp-1 mutant worms for AIA morphology. We found no significant difference between heat-shocked and non-heat-shocked worms in the frequency of ectopic AIA projections or AIA length, indicating that brief heat shock does not appear to affect AIA morphology (Figure 3—figure supplement 2A-C). We speculate that the lack of restoration of morphology in late-stage worms might be a consequence of the defects being irreversible, and that ctbp-1 might be continuously required to prevent such defects from occurring. From these data, we conclude that ctbp-1 can act cell-autonomously, and possibly continuously, to maintain aspects of AIA morphology in a manner similar to AIA gene expression.
ctbp-1 mutants display a progressive decline of AIA function
The AIA interneurons integrate sensory information from a number of sensory neurons, resulting in modulation of the movement of the worm in response to environmental stimuli (Tomioka et al., 2006; Iino and Yoshida, 2009; Shinkai et al., 2011). The AIAs function in response to volatile odors and play an important role in learning associated with the sensation of volatile odors or salts (Tomioka et al., 2006; Cho et al., 2016). We asked if ctbp-1 mutants are abnormal in a behavior known to require the AIAs – adaptation to the volatile odor 2-butanone (Cho et al., 2016) – reasoning that if AIA function is disrupted in ctbp-1 mutants, there should be a reduction of adaptation (and thus greater attraction) to butanone in ctbp-1 worms relative to wild-type worms.
Consistent with previous studies (Cho et al., 2016), we found that worms that had been briefly starved with 90 minutes of food deprivation and had no prior experience with butanone (so-called ‘naïve’ worms) were generally attracted to the odor, while worms that were briefly starved in the presence of butanone (‘conditioned’ worms) adapted to the odor and exhibited mild repulsion to it (Figure 4A–E). We next compared wild-type and ctbp-1 mutant worms for their ability to adapt to butanone. We found that while L1 ctbp-1 worms showed an ability to adapt to butanone roughly similar to that of their wild-type counterparts, conditioned L4 ctbp-1 mutants displayed a significant decrease in repulsion from butanone relative to wild-type L4 animals, indicating a decrease in their ability to adapt to the odor (Figure 4B–E). As a control, we assayed a strain carrying a transgenic construct that genetically ablates the AIA neurons, JN580. As expected, JN580 worms displayed decreased butanone adaptation at both the L1 and L4 larval stages. Thus, ctbp-1 mutant worms displayed a defect in butanone adaptation similar to that of an AIA-ablated strain and did so only at a later larval stage, suggesting a potential loss of AIA function in L4 ctbp-1 mutants. However, while ctbp-1 mutant L4s exhibited weaker butanone adaptation than their wild-type counterparts, this defect was not as severe as that of JN580 L4s, indicating that ctbp-1 mutant AIAs might retain some function. Additionally, the lack of a butanone adaptation defect in L1 ctbp-1 mutants similar to that of L1 JN580 worms further suggests that loss of ctbp-1 does not disrupt early AIA function and shows that ctbp-1 is not required for the establishment of functional AIA neurons.
Figure 4 with 1 supplement see all

Loss of ctbp-1 results in a disruption of AIA function in L4-to-day 1 adult worms.
(A) Schematic of the butanone adaptation assay. L1 or L4 worms from synchronized populations were washed off plates with S Basal, washed with S Basal, split into naïve and conditioned populations, incubated in S Basal with or without 2-butanone for 1.5 hrs, washed again with S Basal, allowed to chemotax for 2 hrs on unseeded plates containing two 1 μl spots of 10% ethanol (blue dots) and 2-butanone diluted in 10% ethanol (orange dots), and then scored. (B–E) Chemotaxis indices of (B,D) naïve or (C,E) conditioned wild-type (N2 and nIs175), AIA-ablated (JN580), nIs175; ctbp-1(n4784), and nIs175; ctbp-1 mutants containing a transgene driving expression of wild-type ctbp-1 under an AIA-specific promoter (nIs743[Pgcy-28.d::ctbp-1(+)]) at the (B–C) L1 or (D–E) L4 larval stage. Mean ± SEM. n ≥ 6 assays per condition, ≥ 50 worms per assay. ns, not significant, **p < 0.01, ***p = 0.0005, ****p < 0.0001, one-way ANOVA with Tukey’s correction. (F–G) Chemotaxis indices of (F) naïve or (G) conditioned nIs175, nIs175; ctbp-1, and nIs175; ctbp-1 mutants carrying the heat-shock-inducible transgene nEx2351[Phsp-16.2::ctbp-1(+); Phsp-16.41::ctbp-1(+)] with or without heat shock (HS) at the day 1 adult stage. Mean ± SEM. n ≥ 5 assays per condition, ≥ 50 worms per assay. ns, not significant, **p < 0.01, ****p < 0.0001, one-way ANOVA with Tukey’s correction. The ctbp-1 allele used for all panels of this figure was n4784.
-
Figure 4—source data 1
Source data for Figure 4 and supplements.
- https://cdn.elifesciences.org/articles/74557/elife-74557-fig4-data1-v1.zip
We next asked if ctbp-1 can act cell-autonomously in the AIAs and in older worms to regulate butanone adaptation. We assayed ctbp-1 mutants carrying the AIA-specific rescue construct nIs743[PAIA::ctbp-1(+)] for butanone adaptation (Figure 4B–E) and found that AIA-specific restoration of ctbp-1 rescued butanone adaption of conditioned ctbp-1 mutant L4s to near wild-type levels (Figure 4E). We conclude that the butanone adaptation defect of ctbp-1 mutants is caused by a disruption of AIA function and that ctbp-1 can act cell-autonomously to regulate this AIA function. Next, we assayed ctbp-1 mutants carrying the heat shock-inducible ctbp-1(+) rescue construct nEx2351[Phsp::ctbp-1(+)] for butanone adaptation. We found that restoration of ctbp-1 by heat shock at the L4 larval stage rescued the butanone adaptation defect in day one adults, indicating that ctbp-1 can act in L4-to-day 1 adult worms to maintain proper AIA function after the initial establishment of the AIA cell identity (Figure 4F–G). Taken together, these data establish that loss of ctbp-1 disrupts the function of the AIA neurons and that ctbp-1 can act cell-autonomously and in L4-to-day 1 adult worms to maintain AIA function.
While conducting these assays, we observed that naïve ctbp-1 mutant worms displayed a mildly weaker attraction to butanone than did their wild-type counterparts at both the L1 and L4 larval stages (Figure 4B and D). AIA-specific rescue of ctbp-1 did not rescue this mild chemotaxis defect – naïve ctbp-1 mutants carrying the PAIA::ctbp-1(+) construct still displayed weaker butanone attraction than wild-type worms (Figure 4B and D). We suggest that this defect in attraction to butanone is not a consequence of dysfunction of the AIAs but rather of some other cell(s) involved in butanone chemotaxis. Consistent with this hypothesis, we found that ctbp-1 mutants were defective in chemotaxis to the volatile odor isoamyl alcohol but were not defective in the response to diacetyl (Figure 4—figure supplement 1A-B) while AIA-ablated strain JN580 animals were not defective in either response (Figure 4—figure supplement 1A-B). These observations indicate that ctbp-1 mutant worms have a broader defect in chemotaxis caused by the disruption of the function of cells other than the AIAs. Because our primary focus has been on how ctbp-1 functions to maintaining the AIA cell identity, we did not attempt to identify the other cells with functions perturbed by the loss of ctbp-1.
ctbp-1 mutant AIAs have additional defects in gene expression
To better characterize the genetic changes occurring in mutant AIAs, we performed a single, exploratory single-cell RNA-Sequencing (scRNA-Seq) experiment comparing wild-type and ctbp-1 mutant worms. We sequenced RNA from the neurons of wild-type and ctbp-1 L4 worms and processed the resulting data using the 10X CellRanger pipeline to identify presumptive AIA neurons based on the expression of several AIA markers (gcy-28, ins-1, cho-1) shown above to be expressed in both wild-type and ctbp-1 mutant AIAs (Figure 2B). Confirming that these data captured changes in the AIA transcriptional profiles, we found that ctbp-1 mutant AIAs showed high levels of expression of ceh-28, while wild-type AIAs showed no detectable ceh-28 expression (Figure 5—figure supplement 1).
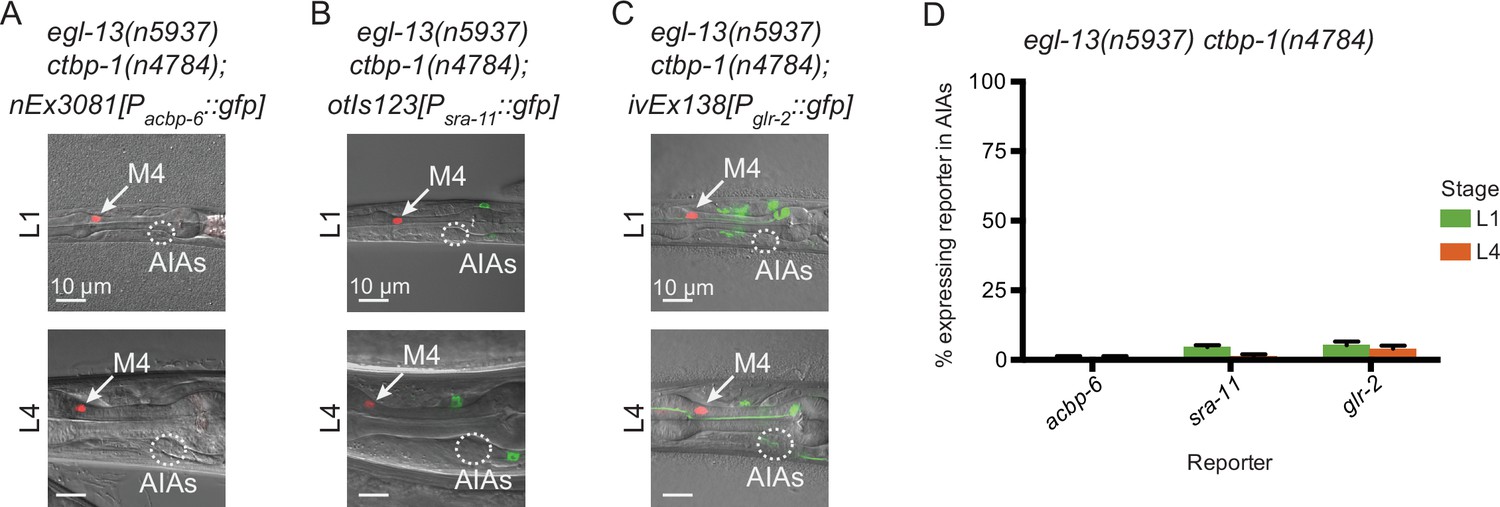
We analyzed AIA transcriptional profiles to identify genes that appeared to be either expressed in ctbp-1 mutant AIAs and not expressed in wild-type AIAs (similar to ceh-28) or expressed in wild-type AIAs but not expressed in ctbp-1 AIAs. To confirm candidate genes, we crossed existing reporters for those genes to ctbp-1 mutants or, in cases for which reporters were not readily available, generated our own transgenic constructs. We identified and confirmed one gene that, similar to ceh-28, was not expressed in wild-type AIAs but was misexpressed in ctbp-1 mutant AIAs: acbp-6, which is predicted to encode an acyl-Coenzyme A binding protein (Shaye and Greenwald, 2011; Figure 5A; Figure 5—figure supplement 1). We also identified and confirmed two genes expressed in wild-type AIAs but not expressed in ctbp-1 mutant AIAs: sra-11, which encodes a transmembrane serpentine receptor (Troemel et al., 1995); and glr-2, which encodes a glutamate receptor (Brockie et al., 2001; Figure 5C and E; Figure 5—figure supplement 1). We visualized the acbp-6 reporter nEx3081[Pacbp-6::gfp], the sra-11 reporter otIs123[Psra-11::gfp] and the glr-2 reporter ivEx138[Pglr-2::gfp] in wild-type and ctbp-1 L4 worms and confirmed that acbp-6 was absent in wild-type AIAs but misexpressed in ctbp-1 mutants (Figure 5A–B), while both sra-11 and glr-2 were consistently expressed in wild-type AIAs but not expressed in the AIAs of ctbp-1 mutants (Figure 5C–F). We also visualized these reporters in L1 wild-type and ctbp-1 worms and found that both Pacbp-6::gfp and Psra-11::gfp displayed a time-dependence to their expression similar to that of Pceh-28::gfp − Pacbp-6::gfp was rarely detectible in the AIAs of either wild-type or ctbp-1 AIAs at the L1 stage but was consistently expressed in ctbp-1 mutant L4 AIAs (Figure 5A–B), while Psra-11::gfp was rarely detectible in the AIAs of either wild-type or ctbp-1 mutant L1 worms but was expressed in the AIAs of most wild-type worms by the L4 stage while remaining off in the AIAs of most L4 ctbp-1 mutants (Figure 5C–D). These observations suggest that, like ceh-28 expression, acbp-6 and sra-11 expression is regulated by ctbp-1 primarily in the AIAs of late-stage larvae and adults. By contrast, glr-2 was expressed in wild-type but not ctbp-1 AIAs in both L1 and L4 larvae (Figure 5E–F).
Figure 5 with 1 supplement see all

Loss of ctbp-1 results in a disruption to normal AIA gene expression.
(A,C,E) (A) nEx3081[Pacbp-6::gfp], (C) otIs123[Psra-11::gfp], or (E) ivEx138[Pglr-2::gfp] expression in wild-type (top) and ctbp-1(n4784) (bottom) worms at the L1 larval stage (left) and L4 larval stage (right). Wild-type strains contain nIs843[Pgcy-28.d::mCherry]. ctbp-1 mutant strains contain nIs348[Pceh-28::mCherry]. Arrow, M4 neuron. Circle, AIAs. Scale bar, 10 μm. (B,D,F) Percentage of wild-type and ctbp-1(n4784) expressing (B) Pacbp-6::gfp, (D) Psra-11::gfp, or (F) Pglr-2::gfp in the AIA neurons at L1 and L4 larval stages. Wild-type strains contain nIs843[Pgcy-28.d::mCherry]. ctbp-1 mutant strains contain nIs348[Pceh-28::mCherry]. Mean ± SEM. n ≥ 50 worms per strain per stage, three biological replicates. ns, not significant, ****p < 0.0001, unpaired t-test.
-
Figure 5—source data 1
Source data for Figure 5 and supplements.
- https://cdn.elifesciences.org/articles/74557/elife-74557-fig5-data1-v1.zip
These data demonstrate that mutant AIAs fail to turn on and/or maintain the expression of genes characteristic of the adult AIA neuron (sra-11 and glr-2) while misexpressing at least two genes uncharacteristic of AIA (ceh-28 and acbp-6). That the majority of these abnormalities in AIA gene expression occurred long after the AIAs are generated during embryogenesis further supports the conclusion that ctbp-1 does not act to establish the AIA cell identity.
Collectively, our findings concerning AIA gene expression, morphology and function demonstrate that ctbp-1 acts to maintain the AIA cell identity, plays little to no role in the initial establishment of the AIA cell fate, and can act cell-autonomously and in older worms to maintain these aspects of the AIA identity.
Mutation of egl-13 or ttx-3 suppresses the ctbp-1 mutant phenotype
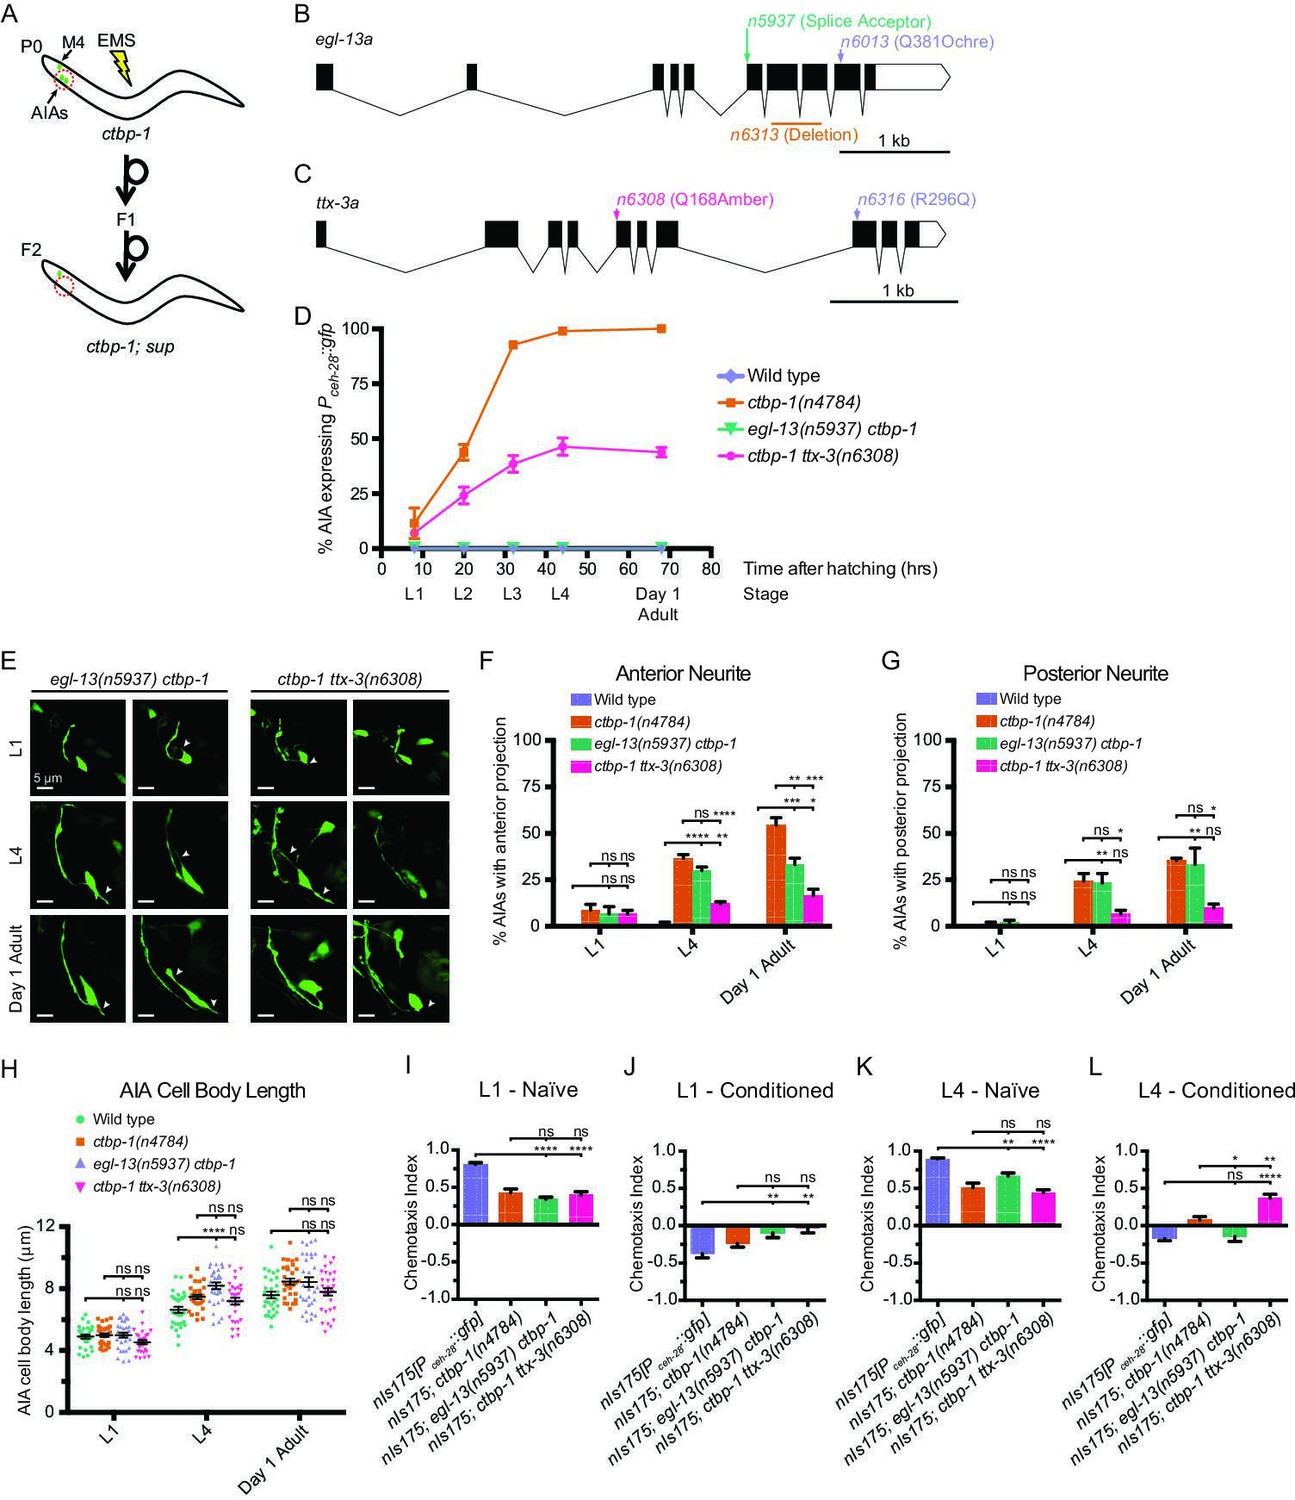
To investigate how ctbp-1 acts to maintain AIA cell identity, we performed a mutagenesis screen for suppression of Pceh-28::gfp misexpression in the AIAs of L4 ctbp-1 mutants (Figure 6A). Using a combination of Hawaiian SNP mapping (Davis et al., 2005) and whole-genome sequencing, we identified two genes as suppressors of the ctbp-1 mutant phenotype: egl-13, which encodes a SOX family transcription factor; and ttx-3, which encodes a LIM homeobox transcription factor. egl-13 has been shown to act in the establishment of the BAG and URX cell fates and in vulval development of C. elegans (Gramstrup Petersen et al., 2013; Feng et al., 2013), and its mammalian orthologs SOX5 and SOX6 act in neural fate determination (Ji and Kim, 2016; Saleem et al., 2020). We isolated three alleles of egl-13 as ctbp-1 suppressors: n5937, a mutation of the splice acceptor site at the beginning of the 6th exon of the egl-13a isoform resulting in a frameshift and early stop; n6013, a Q381ochre nonsense mutation toward the end of the egl-13 transcript; and n6313, a 436-nucleotide deletion spanning the 7th and 8th exons of the egl-13a isoform (Figure 6B; Figure 6—figure supplement 1A-B). We generated and introduced a transgenic construct carrying a wild-type copy of egl-13 under its native promoter into these mutant strains and found that this construct was capable of rescuing the suppression of Pceh-28::gfp misexpression by all three egl-13 alleles, demonstrating that loss of egl-13 function suppresses this aspect of the ctbp-1 mutant phenotype and suggesting that these alleles are likely loss-of-function alleles of egl-13 (Figure 6—figure supplement 1C).
Figure 6 with 2 supplements see all
A suppressor screen reveals egl-13 and ttx-3 as ctbp-1 genetic interactors.
(A) Schematic of ctbp-1 suppressor screen design. ctbp-1 mutant worms carrying nIs175[Pceh-28::gfp] were mutagenized with ethyl methanesulfonate (EMS), and their F2 progeny were screened for continued nIs175 expression in M4 and loss of expression in the AIA neurons (red circle). (B) Gene diagram of the egl-13a isoform. Arrows (above), point mutations. Line (below), deletion. Scale bar (bottom right), 1 kb. (C) Gene diagram of the ttx-3a isoform. Arrows (above), point mutations. Scale bar, 1 kb. (D) Percentage of wild-type, ctbp-1, egl-13(n5937) ctbp-1, and ctbp-1 ttx-3(n6308) worms expressing nIs175 in the AIA neurons over time. Time points correspond to the L1, L2, L3, L4 larval stages, and day 1 adult worms (indicated below X axis). All strains contain nIs175[Pceh-28::gfp]. Mean ± SEM. n ≥ 100 worms per strain per stage, three biological replicates. (E) Two representative images of an AIA neuron in egl-13 ctbp-1 or ctbp-1 ttx-3 worms at L1 (top), L4 (middle), and day 1 adult (bottom) stages. Arrows, examples of ectopic neurites protruding from the AIA cell body. Image oriented such that left corresponds to anterior, top to dorsal. Scale bar, 5 μm. (F–G) Percentage of AIAs in wild-type, ctbp-1, egl-13 ctbp-1 and ctbp-1 ttx-3 worms at the L1, L4, and day 1 adult stages with an ectopic neurite protruding from the (F) anterior or (G) posterior of the AIA cell body. Mean ± SEM. n = 30 AIAs scored per strain per stage, three biological replicates. ns, not significant, *p < 0.05, **p < 0.01, ***p < 0.001, ****p < 0.0001, one-way ANOVA with Tukey’s correction. (H) Quantification of AIA cell body length in wild-type, ctbp-1, egl-13 ctbp-1, and ctbp-1 ttx-3 worms at the L1, L4, and day 1 adult stages. Mean ± SEM. n ≥ 30 AIAs scored per strain per stage. ns, not significant, ****p < 0.0001, one-way ANOVA with Tukey’s correction. (I–L) Chemotaxis indices of (I,K) naïve or (J,L) conditioned wild-type, ctbp-1, egl-13 ctbp-1, and ctbp-1 ttx-3 worms at the (I–J) L1 or (K–L) L4 larval stage. Mean ± SEM. n ≥ 5 assays per condition, ≥ 50 worms per assay. ns, not significant, *p = 0.0214, **p < 0.01, ****p < 0.0001, one-way ANOVA with Tukey’s correction. The ctbp-1 allele used for all panels of this figure was n4784. The egl-13 allele used for all panels of this figure was n5937. The ttx-3 allele used for all panels of this figure was n6308. All strains in (E–H) contain nIs840[Pgcy-28.d::gfp] and all strains in (E–H) other than ‘Wild type’ contain nIs348[Pceh-28::mCherry] (not shown in images). All strains in (D, I–L) contain nIs175[Pceh-28::gfp].
-
Figure 6—source data 1
Source data for Figure 6 and supplements.
- https://cdn.elifesciences.org/articles/74557/elife-74557-fig6-data1-v1.zip
ttx-3 is a LIM homeobox transcription factor characterized for its roles in thermotaxis behavior and in cell-fate specification of the AIA and AIY interneurons (Altun-Gultekin et al., 2001; Zhang et al., 2014). The TTX-3 mammalian ortholog LHX9 is involved in retinal cell-fate establishment (Balasubramanian et al., 2014; Balasubramanian et al., 2018). We isolated two alleles of ttx-3: the nonsense allele n6308 and the missense allele n6316 (Figure 6C; Figure 6—figure supplement 2A-B). We tested two additional ttx-3 alleles, the splice acceptor allele ks5 and the Q303amber nonsense allele ot22. Both suppressed ctbp-1-driven nIs175 misexpression (Figure 6—figure supplement 2B). Suppression of ctbp-1 by either of our isolated alleles (n6308 or n6316) was rescued by introduction of a transgenic construct carrying a wild-type copy of ttx-3 expressed under the control of its native promoter (Figure 6—figure supplement 2C), indicating that these alleles are likely loss-of-function alleles that reduce or eliminate ttx-3 gene function.
We assayed the loss-of-function alleles egl-13(n5937) and ttx-3(n6308) for their ability to suppress Pceh-28::gfp misexpression over the course of larval development and into adulthood of ctbp-1 mutant worms (Figure 6D). egl-13(n5937) strongly suppressed ctbp-1 at all stages, resulting in little to no misexpression of Pceh-28::gfp in the AIAs of egl-13 ctbp-1 double mutants at any larval stage or in day 1 adults. Suppression by ttx-3(n6308) was incompletely penetrant, showing a progressive increase in AIA gene misexpression that peaked at adulthood with approximately 45% of ctbp-1 ttx-3 double-mutant animals displaying Pceh-28::gfp expression in the AIAs.
We next asked if egl-13(n5937) or ttx-3(n6308) could suppress the AIA morphological and functional defects of ctbp-1 mutants. To both test suppression of AIA morphological defects and confirm the presence of the AIA neurons in egl-13 ctbp-1 and ctbp-1 ttx-3 double mutants, we crossed the AIA morphology reporter nIs840[Pgcy-28.d::gfp] into these double mutants and scored AIA morphology in L1, L4 and day one adult worms (Figure 6E–H). egl-13 ctbp-1 double mutant AIAs displayed a mild (though significant) reduction in the penetrance of ectopic anterior neurites only in adult worms and no significant change in the frequency of posterior neurites or AIA cell body length at any stage. ctbp-1 ttx-3 double mutants displayed a significant decrease in the frequency of both ectopic anterior and posterior projections at the L4 and day one adult stages (though these double mutants still displayed a greater frequency of these defects than did their wild-type counterparts) and no significant difference in AIA cell body length at any stage tested. These data demonstrate that loss of egl-13 has little consistent effect on the AIA morphological defects caused by a loss of ctbp-1 activity, suggesting that ctbp-1 maintains AIA morphology primarily through egl-13-independent pathways. These data further indicate that the additional loss of ttx-3 results in less severe morphological abnormalities than occurs in ctbp-1 single mutants, suggesting that the manifestation of AIA morphological defects seen in ctbp-1 single mutants likely rely in part on proper ttx-3 activity.
We next assayed the ability of egl-13(n5937) and ttx-3(n6308) to suppress AIA functional defects. We tested egl-13 ctbp-1 and ctbp-1 ttx-3 double mutants for butanone adaptation and found that, at the L1 larval stage, these double mutant strains displayed a detectable response to butanone similar to ctbp-1 single mutants (Figure 6I–J). At the L4 larval stage, mutation of egl-13 strongly suppressed the ctbp-1 mutant defect in butanone adaptation, causing near wild-type levels of repulsion in conditioned worms (Figure 6K–L). By contrast, at the L4 stage mutation of ttx-3 failed to suppress AIA functional defects and instead showed an even greater defect in butanone adaption than did ctbp-1 single mutants (Figure 6K–L). These results indicate that loss of egl-13 activity suppressed AIA functional defects of ctbp-1 mutant worms and suggest that ctbp-1 maintains at least this aspect of AIA cellular function primarily through an egl-13-dependent pathway, while loss of ttx-3 exacerbates the AIA functional defect seen in ctbp-1 single mutants.
From these data, we conclude that ctbp-1 maintains AIA function and at least some aspects of AIA gene expression through egl-13 and that disruptions to AIA morphology appears to be controlled independently of egl-13 function. We further conclude that loss of ttx-3 similarly restores at least some aspects of AIA gene expression as well as partially suppresses AIA morphological defects seen in ctbp-1 single mutants, while AIA function seems to be further perturbed in the absence of ttx-3.
Mutation of ctbp-1 does not affect ttx-3 expression in the AIAs (Figure 2B), suggesting that the AIA identity defects that characterize ctbp-1 single mutants are not a consequence of a change in ttx-3 expression. Given ttx-3’s known requirement as an AIA terminal selector (Zhang et al., 2014), we speculate that mutation of ttx-3 appears to suppress AIA cell-identity maintenance defects caused by a loss of ctbp-1 by perturbing AIA cell-identity establishment. In other words, failure to properly establish the AIA cell identity, as likely occurs in ttx-3 mutants, masks defects caused by the loss of the maintenance of that cell identity, as occurs in ctbp-1 mutants. While these mutants might offer insights into the interplay between cell-identity establishment and maintenance, our primary focus was on the mechanisms of cell-identity maintenance and we focused our further efforts on characterizing the EGL-13 – CTBP-1 relationship and how these two proteins act to maintain the AIA cell identity.
EGL-13 can function cell-autonomously in the AIAs and likely physically interacts with CTBP-1
To determine if, like ctbp-1, egl-13 can act cell-autonomously in the AIAs, we generated a transgenic construct that drives expression of a wild-type copy of egl-13 in the AIAs (nEx3055[Pgcy-28.d::egl-13(+)]). Introduction of this construct to egl-13(n5937) ctbp-1 double mutants rescued the egl-13 suppression of Pceh-28::gfp misexpression in the AIAs, indicating that egl-13 can function cell-autonomously (Figure 7—figure supplement 1A-B). We further tested egl-13 expression using a GFP transcriptional reporter and found that egl-13 was expressed in a number of cells, including the AIAs, of wild-type worms (Figure 7—figure supplement 2A), although expression in the AIAs appeared to dissipate over the course of larval development (Figure 7—figure supplement 2C). We also tested the effect of mutation of ctbp-1 on egl-13 expression and found no significant difference between wild-type and ctbp-1 worms at any stage tested, indicating that ctbp-1 does not appear to regulate egl-13 expression in the AIAs (Figure 7—figure supplement 2B-C). These results suggest that, in the absence of ctbp-1 function, ectopic egl-13 activity in the AIAs drives ceh-28 misexpression, and thus that ctbp-1 likely normally acts to repress egl-13 activity in the AIAs. These findings further raise the possibility that EGL-13 and CTBP-1 might be interacting within the AIAs to coordinate maintenance of the AIA cell identity.
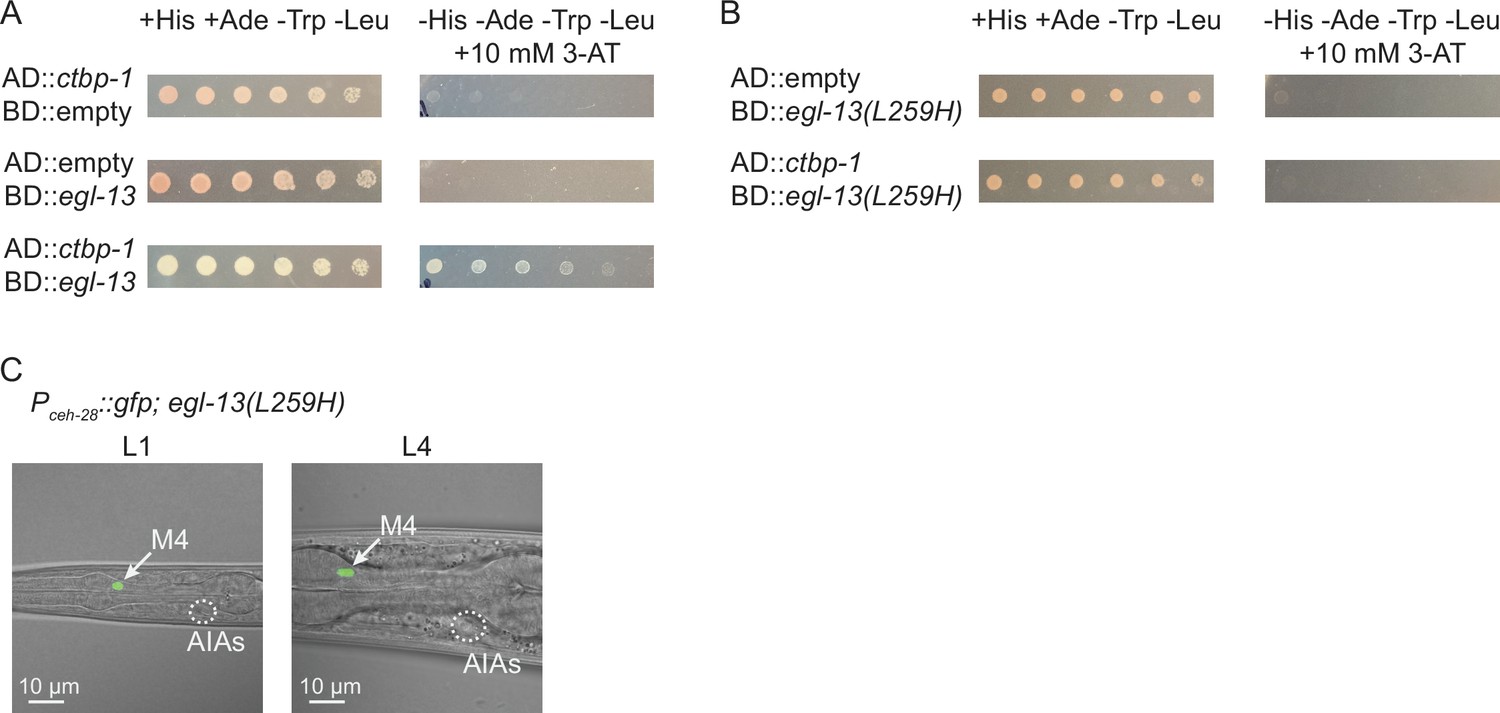
The mammalian CtBPs (CtBP1 and CtBP2) bind PXDLS-like motifs on a number of diverse transcription factors to target specific genetic loci for silencing (Chinnadurai, 2003; Shi et al., 2003; Stankiewicz et al., 2014). The mammalian ortholog of EGL-13 (SOX6) interacts with the mammalian ortholog of CTBP-1 (CtBP2) through a PLNLS motif located in SOX6 to repress Fgf-3 expression in the developing mouse auditory otic vesicle (Murakami et al., 2001). This motif is 100% conserved in C. elegans EGL-13 and, since both CTBP-1 and EGL-13 can function cell-autonomously in the AIAs, we hypothesized that CTBP-1 and EGL-13 might physically interact. We performed a yeast 2-hybrid assay to test this hypothesis and found that CTBP-1 and EGL-13 are indeed able to physically interact in this assay (Figure 7A). These previous studies have further shown that the SOX6 – CtBP2 interaction can be disrupted by a leucine-to-histidine mutation of the second leucine in the PLNLS motif (to PLNHS), resulting in a mutant SOX6 protein that is unable to interact with CtBP2 (Murakami et al., 2001). We generated a mutant EGL-13 variant bearing an L259H mutation, disrupting this motif, and found that this mutation disrupted its interaction with CTBP-1 in a yeast 2-hybrid assay (Figure 7B), suggesting that EGL-13’s PLNLS motif is critical for the EGL-13 – CTBP-1 interaction.
Figure 7 with 3 supplements see all
CTBP-1 can physically bind EGL-13 through EGL-13’s conserved PLNLS domain.
(A) Serial dilution of yeast colonies carrying plasmids containing the Gal4 Activating Domain (AD) and Gal4 DNA-Binding Domain (BD) fused to ctbp-1a cDNA, egl-13a cDNA, or neither (‘empty’). Strains carrying both domain-containing plasmids grow on+ His + Ade -Trp -Leu plates (left). Strains in which the proteins interact grow on -His -Ade -Trp -Leu + 10 mM 3-AT plates (right). (B) Serial dilution of yeast colonies carrying plasmids containing the Gal4 Activating Domain (AD) and Gal4 DNA-Binding Domain (BD) fused to ctbp-1a cDNA, egl-13a cDNA with amino acids 256–260 mutated from PLNLS to PLNHS (‘egl-13(L259H)’), or neither (‘empty’). (C) Representative images of (left) L1 and (right) L4 egl-13(n6675) mutants in which amino acid 259 was mutated from Leu to His (‘egl-13(L259H)’) displaying nIs175[Pceh-28::gfp] expression. Arrow, M4 neuron. Circle, AIAs. Scale bar, 10 μm. Images are oriented such that left corresponds to anterior, top to dorsal. Quantification of reporter expression in Figure 7—figure supplement 3.
-
Figure 7—source data 1
Source data for Figure 7 and supplements.
- https://cdn.elifesciences.org/articles/74557/elife-74557-fig7-data1-v1.zip
We hypothesized that disruption of this interaction in an otherwise wild-type worm might be sufficient to drive misexpression of Pceh-28::gfp in the AIAs. To test this hypothesis, we used CRISPR (Dickinson and Goldstein, 2016) to generate the L259H mutation of egl-13 in a wild-type background and assayed Pceh-28::gfp expression in the AIAs. We found that this mutation did not induce reporter misexpression at either the L1 or L4 larval stages in any of the worms scored (Figure 7C; quantified in Figure 7—figure supplement 3), indicating that disruption of the EGL-13 – CTBP-1 interaction alone in not sufficient to induce misexpression of ceh-28 in the AIAs.
egl-13 regulates some aspects of AIA gene expression
We next asked if mutation of egl-13 could suppress other ctbp-1 mutant AIA gene expression defects besides that of ceh-28. We crossed in acbp-6, sra-11 and glr-2 reporters to egl-13 ctbp-1 double mutants and visualized reporter expression at the L1 and L4 larval stages. We found that mutation of egl-13 suppressed Pacbp-6::gfp misexpression in the AIAs (Figure 8A and D, compare to Figure 5), just as egl-13 mutation suppressed Pceh-28::gfp misexpression. By contrast, mutation of egl-13 had no effect on the loss of Psra-11::gfp or Pglr-2::gfp expression in ctbp-1 mutants (Figure 8B–D). We speculated that EGL-13 might directly regulate expression of ceh-28 or acbp-6. To test this hypothesis, we examined the ceh-28 and acbp-6 promoter regions for possible EGL-13 binding sites. We failed to identify any promising candidates, suggesting that regulation of these genes by EGL-13 is likely indirect. These results demonstrate that some, though not all, of the AIA gene expression defects seen in ctbp-1 mutants are regulated through egl-13.
Figure 8
EGL-13 controls aspects of AIA gene expression.
(A–C) Expression of markers for AIA misexpressed genes (A) nEx3081[Pacbp-6::gfp], (B) otIs123[Psra-11::gfp], or (C) ivEx138[Pglr-2::gfp] in egl-13(n5937) ctbp-1(n4784) double mutants at the (top) L1 and (bottom) L4 larval stages. Arrow, M4 neuron. Circle, AIAs. Scale bar, 10 μm. (D) Percentage of egl-13(n5937) ctbp-1(n4784) double mutants expressing the indicated reporter in the AIA neurons at the L1 and L4 larval stages. Mean ± SEM. n ≥ 50 worms scored per strain, three biological replicates. The ctbp-1 allele used for all panels of this figure was n4784. All strains in A-D contain nIs348[Pceh-28::mCherry]. Images are oriented such that left corresponds to anterior, top to dorsal.
-
Figure 8—source data 1
Source data for Figure 8.
- https://cdn.elifesciences.org/articles/74557/elife-74557-fig8-data1-v1.zip
egl-13 regulates AIA function through control of ceh-28 expression
As egl-13 is required for misexpression of both ceh-28 and acbp-6 as well as for disruption of AIA function in ctbp-1 mutants, we hypothesized that misexpressed ceh-28 or acbp-6 might be contributing to the observed AIA functional defect in ctbp-1 mutants. If so, we expected that mutations that eliminated the functions of these ectopically expressed genes should restore AIA function in ctbp-1 mutants. To test this hypothesis, we crossed mutant alleles of ceh-28 (cu11) or acbp-6 (tm2995) (both deletion alleles spanning greater than half their respective genes) to ctbp-1(n4784) mutants and assayed the resulting double mutants for butanone adaptation in L1 and L4 worms. We found that acbp-6; ctbp-1 double mutants were nearly identical to both naïve and conditioned ctbp-1 single mutants at both the L1 and L4 larval stages (Figure 9A–D), indicating that misexpressed acbp-6 is likely not responsible for the observed AIA functional defect. Conditioned ctbp-1 ceh-28 double mutants appeared similar to both the wild type and ctbp-1 single mutants at the L1 stage (Figure 9E–F). These double mutants display a minor, although not statistically significant, difference in adaptation at the L4 larval stage when compared to either wild-type or ctbp-1 animals (Figure 9G–H).
Figure 9
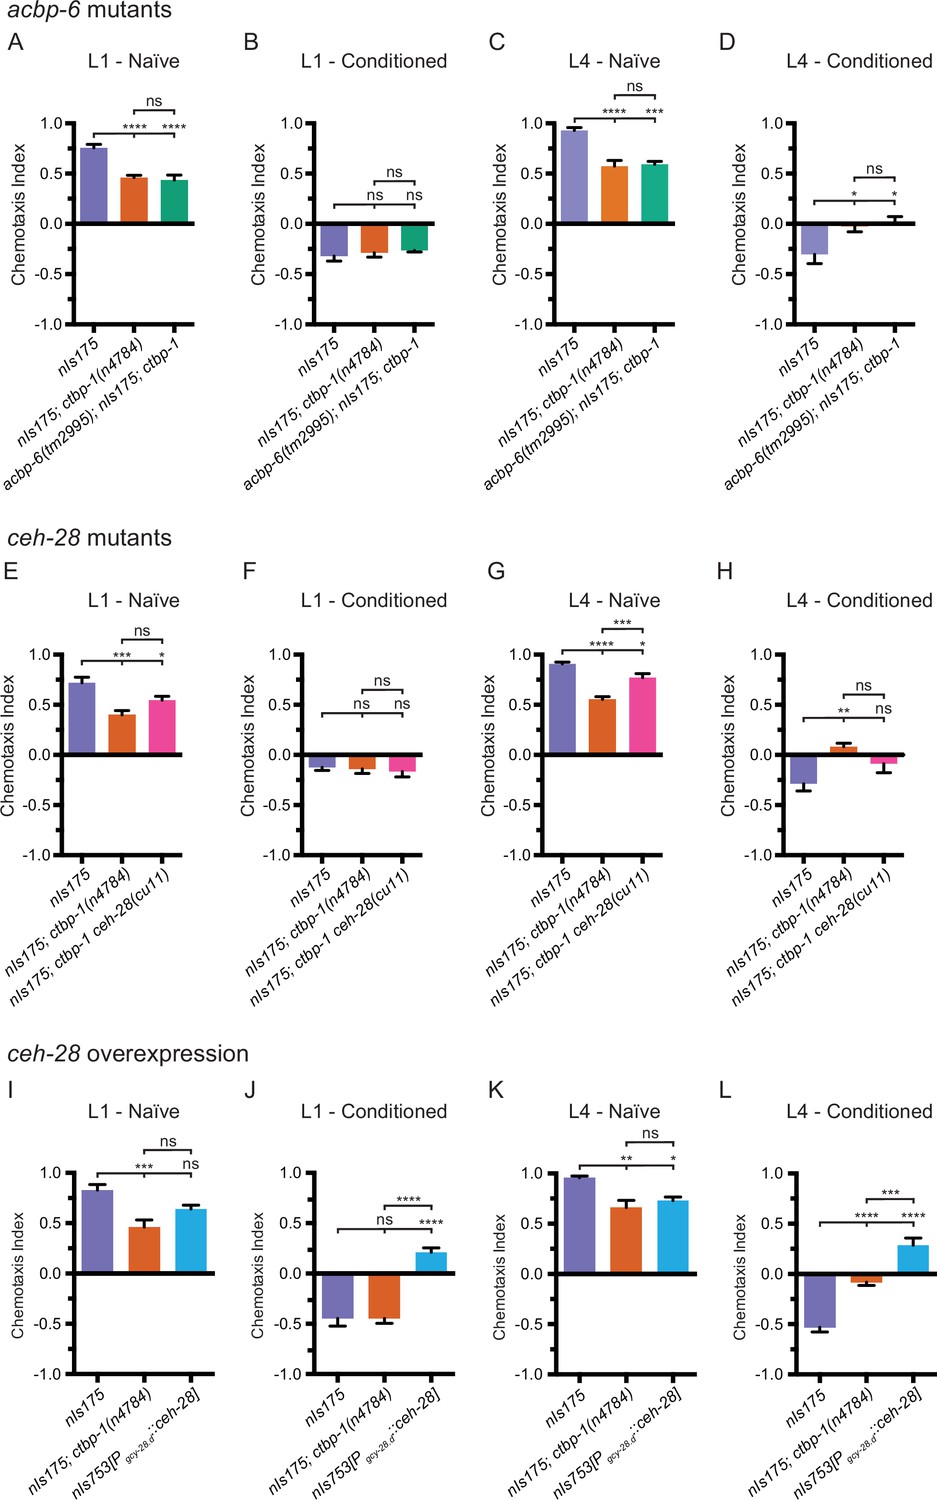
EGL-13 disrupts AIA function partially through driving misexpression of ceh-28 in ctbp-1 mutants.
(A–D) Chemotaxis indices of (A,C) naïve or (B,D) conditioned wild-type (nIs175), nIs175; ctbp-1(n4784), and acbp-6(tm2995); nIs175; ctbp-1 mutants at the (A–B) L1 or (C–D) L4 larval stage. Mean ± SEM. n ≥ 6 assays per condition, ≥ 50 worms per assay. ns, not significant, *p < 0.05, ***p = 0.0003, ****p < 0.0001, one-way ANOVA with Tukey’s correction. (E–H) Chemotaxis indices of (E,G) naïve or (F,H) conditioned wild-type (nIs175), nIs175; ctbp-1(n4784), and nIs175; ctbp-1 ceh-28(cu11) mutants at the (E–F) L1 or (G–H) L4 larval stage. Mean ± SEM. n ≥ 6 assays per condition, ≥ 50 worms per assay. ns, not significant, *p < 0.05, **p = 0.0031, ***p < 0.001, ****p < 0.0001 one-way ANOVA with Tukey’s correction. (I–L) Chemotaxis indices of (I,K) naïve or (J,L) conditioned wild-type (nIs175), nIs175; ctbp-1(n4784), and nIs753[Pgcy-28.d::ceh-28(+)] at the (I–J) L1 or (K–L) L4 larval stage. Mean ± SEM. n ≥ 6 assays per condition, ≥ 50 worms per assay. ns, not significant, *p = 0.0176, **p = 0.0018, ***p < 0.001, ****p < 0.0001, one-way ANOVA with Tukey’s correction. The ctbp-1 allele used for all panels of this figure was n4784.
-
Figure 9—source data 1
Source Data for Figure 9.
- https://cdn.elifesciences.org/articles/74557/elife-74557-fig9-data1-v1.zip
These data raise the possibility that ceh-28 overexpression in the AIAs can perturb AIA function. To test this hypothesis, we generated a transgenic strain (nIs753[Pgcy-28.d::ceh-28]) that overexpresses ceh-28 specifically in the AIA neurons and tested this strain for butanone adaptation. We found that overexpression of ceh-28 in the AIAs resulted in a minor decrease in butanone attraction in naïve worms at both the L1 and L4 stage, although in both cases not more severe than the defect seen in ctbp-1 mutants (Figure 9I and K). However, at both the L1 and L4 larval stages, AIA-specific ceh-28 overexpression resulted in a significant increase in attraction to butanone in conditioned worms (and thus a decrease in adaptation) (Figure 9J and L). These results demonstrate that ceh-28 overexpression in the AIAs is sufficient to perturb AIA function and suggest that misregulation of ceh-28 expression in the AIAs of ctbp-1 mutants might be partially responsible for the disruption of AIA function seen in these mutants. Additionally, the striking difference at the L1 stage between ctbp-1 mutants and worms that overexpress ceh-28 in the AIAs supports the idea that early larval stage AIAs are not dysfunctional in ctbp-1 mutants.
Collectively, these data suggest that overexpression of ceh-28, caused by a loss of ctbp-1 and likely driven by ectopic egl-13 activity, might partially account for the defect in butanone adaptation seen in L4 and day 1 adult ctbp-1 mutants and that removal of egl-13 in part restores AIA function by eliminating ceh-28 misexpression. We propose that ctbp-1 functions to maintain aspects of the AIA cell identity by preventing egl-13 from promoting ceh-28 expression and that ceh-28 misexpression can perturb proper AIA function. These results also indicate that ceh-28 misexpression alone is not solely responsible for the observed AIA functional defect, suggesting that the regulation of other, as-of-yet unidentified genes controlled by ctbp-1 (and potentially egl-13) also contribute to the maintenance of the AIA cell identity.
Discussion
We have shown that the ctbp-1 transcriptional corepressor gene is required to maintain AIA cell identity and that ctbp-1 negatively and selectively regulates the function of the egl-13 transcription factor gene. We suggest that the CTBP-1 protein functions as a transcriptional corepressor to selectively regulate the transcriptional output (either directly or indirectly) of the EGL-13 protein. ctbp-1 mutant AIAs undergo a progressive decline in their initially wild-type gene-expression pattern, morphology and function. ctbp-1 can act cell-autonomously and is able to act in older animals to maintain these aspects of the AIA identity. We conclude that CTBP-1 functions to maintain AIA cell identity and speculate that other transcriptional corepressors similarly function in the maintenance of specific cell identities and do so by silencing undesired gene expression through repression of transcriptional activators, such as EGL-13. Such a mechanism could explain how the breadth of transcriptional activation by terminal selectors can be fine-tuned in a coordinated fashion to fit the requirements of specific cell types, with selective transcriptional silencing providing a crucial aspect of proper cell-identity maintenance.
CTBP-1 physically interacts with EGL-13 to maintain the AIA cell identity
Our findings (Figure 10A) suggest that CTBP-1 interacts with EGL-13 to regulate EGL-13 activity as part of AIA cell-identity maintenance. We propose a model (Figure 10B–D) in which CTBP-1 physically interacts with EGL-13 to target specific genetic loci for silencing as an aspect of normal AIA cell-identity maintenance. Following the establishment of the AIA cell fate, for which CTBP-1 is not required, CTBP-1 binds EGL-13, recruiting CTBP-1 to EGL-13 DNA binding sites. CTBP-1 then silences surrounding genetic loci, resulting in the repression of specific target genes (Figure 10B). This repression is necessary for proper maintenance of the AIA cell identity, and when disrupted, as in ctbp-1 mutants, CTBP-1 binding partners, such as EGL-13, inappropriately act as transcriptional activators in the AIAs, resulting in disruption of AIA gene expression, morphology and function (Figure 10C). In the absence of such CTBP-1 interactors, as in egl-13 ctbp-1 double mutants, aberrant transcription is not activated and some of the defects in AIA maintenance are avoided (Figure 10D).
Figure 10

Model for the maintenance of the AIA cell identity by ctbp-1.
(A) The genetic pathway in which ctbp-1 promotes AIA morphology and glr-2 and sra-11 expression. ctbp-1 also inhibits egl-13, thereby repressing expression of ceh-28 and acbp-6 in the AIAs and promoting proper AIA function (B–D) Model for how CTBP-1 maintains the AIA cell identity. (B) We propose that CTBP-1 acts in the maintenance but not establishment of the AIA cell identity, and does so by targeting specific genetic loci for regulation through physical interaction with transcription factors such as EGL-13. TTX-3 is required for the establishment, but not the maintenance, of the AIA identity. (C) In the absence of CTBP-1, EGL-13 and other CTBP-1 targets drive expression at multiple genetic loci, resulting in changes to the gene expression, morphology and function (as assessed by butanone adaptation) of the AIAs. (D) When EGL-13 activity is also removed, gene expression and cellular function are no longer perturbed, while normal morphology is not restored, resulting in a ‘Partially Maintained AIA’.
TTX-3 helps establishing the AIA cell identity but does not maintain it with CTBP-1
We speculate that mutations in ttx-3 appear to suppress the ctbp-1 mutant phenotype of abnormal AIA cell-identity maintenance because ttx-3 mutations are epistatic to ctbp-1 mutations: in ttx-3 ctbp-1 double mutants the AIA cell fate is not established, resulting in a lack of Pceh-28::gfp marker misexpression as one would expect in ctbp-1 mutant AIAs. This lack of expression results in the superficially wild-type phenotype, thus appearing to suppress ctbp-1-dependent AIA gene repression. We speculate that loss of ttx-3 function results in the formation of a defective AIA that is still capable of expressing some genes (such as gcy-28.d) and that this improperly established AIA does not attempt to express genes such as ceh-28 that normally would be suppressed through the activity of maintenance factors like CTBP-1 (Figure 10B).
Perhaps unsurprisingly, we found that a cell that fails to properly establish its terminal identity does not appear to have the same needs for maintenance as does its wild-type counterpart. Further investigation of the dynamics between establishment and maintenance, and particularly characterization of mutants that help us to dissect the fine boundary between the two, will likely prove invaluable to expanding our understanding of development.
CTBP-1 likely utilizes additional transcription factors besides EGL-13 to maintain the AIA cell identity
Our understanding of how CTBP-1 acts to maintain the AIA cell identity is incomplete. While we have identified a few genes with expression that changes in the absence of ctbp-1 (e.g. ceh-28, acbp-6, sra-11, glr-2), none of these genes seems to individually account for the full range of AIA defects seen in older ctbp-1 mutants. We speculate that there are many more unidentified transcriptional changes occurring in ctbp-1 mutant AIAs that contribute to the observed AIA morphological and functional defects.
Our observations suggest that EGL-13 is not the sole transcription factor through which CTBP-1 functions to maintain AIA cell identity – neither AIA morphological defects nor some AIA gene-expression defects (i.e. sra-11 and glr-2 expression) in ctbp-1 mutants were suppressed in egl-13 ctbp-1 double mutants (Figure 6E–H; Figure 8B–D), and disruption of the EGL-13 – CTBP-1 interaction was alone not sufficient to induce AIA gene expression defects (Figure 7C). We propose that CTBP-1 maintains different aspects of AIA cell identity through interactions with multiple different transcription factors. Given CTBP-1’s known function as a transcriptional corepressor and EGL-13’s observed role in driving gene misexpression in the absence of ctbp-1, we speculate that CTBP-1 likely utilizes not just EGL-13 but also other transcription factors (possibly through interacting with PXDLS-like motifs located in those transcription factors) to target multiple specific DNA sequences for transcriptional silencing, effectively turning these transcription factors into transcriptional repressors. Furthermore, the decrease in egl-13 expression in AIAs over the course of larval development suggests that CTBP-1 might regulate different transcription factors at different stages during the maintenance of the AIA cell identity. When ctbp-1 is absent, these unregulated transcription factors can aberrantly function as transcriptional activators, resulting in either the direct or indirect expression of genes which can in turn lead to defects in other aspects of cell identity. Such a mechanism for the selective and continuous silencing of multiple genetic loci in cell-type-specific contexts by a transcriptional corepressor like CTBP-1 might explain how the broad activating activities of terminal selectors are restricted in the context of maintaining the identities of distinct cell types.
CTBP-1 likely maintains the identities of other cells besides that of the AIAs
Others have previously reported a near pan-neuronal expression pattern of ctbp-1 in C. elegans (Reid et al., 2014), suggesting that ctbp-1 might be acting in more cells than just the AIAs to maintain cell identities. Why then have we thus far only been able to identify defects in the maintenance of the AIA identity in ctbp-1 mutants? We speculate that, like the relatively subtle defects we have observed in AIA gene expression, morphology and function, ctbp-1 mutant defects in the maintenance of other cell identities might be similarly subtle and easily missed if not specifically sought. In addition, the AIAs might be particularly susceptible to perturbations of maintenance of their identity, with defects manifesting either earlier in the life of the cell or in more distinct ways (e.g. more gene misexpression).
Both our findings and the work of others (Reid et al., 2015; Sherry et al., 2020) provide further support for the hypothesis that ctbp-1 maintains other cell identities besides that of the AIAs. We observed that ctbp-1 mutants have an additional AIA-independent chemotaxis defect (Figure 4B–E; Figure 4—figure supplement 1A-B), suggesting that other cells, likely neurons that sense and/or execute responses to volatile odors, are also dysfunctional. Additionally, others have shown that in ctbp-1 mutants another pair of C. elegans neurons, the SMDDs, display late-onset morphological abnormalities coupled with a defect in C. elegans foraging behavior associated with these cells (Reid et al., 2015; Sherry et al., 2020), indicating that CTBP-1 might act to maintain SMDD cell identity as well. The broad expression of ctbp-1 throughout much of the C. elegans nervous system is also consistent with the hypothesis that ctbp-1 functions broadly to maintain multiple neuronal cell identities (Reid et al., 2014).
Transcriptional corepressors might function broadly in the maintenance of cell identities
The neuron-specific expression of ctbp-1 (Reid et al., 2014) suggests that CTBP-1 likely does not function in maintaining the identities of non-neuronal cells. How might non-neuronal cell identities be maintained? We speculate that transcriptional corepressors function in maintaining cell identities in both neuronal and non-neuronal cells. There are known tissue-specific activities of other corepressor complexes, such as those of NCoR1 in mediating the downstream effects of hormone sensation in the mammalian liver (Feng et al., 2001; Mottis et al., 2013) or of Transducin-Like Enhancer of Split (TLE) proteins in regulating gene expression and chromatin state in the developing mouse heart and kidney (Sharma et al., 2009; Kaltenbrun et al., 2013; Agarwal et al., 2015). We propose that, by analogy to CTBP-1, distinct transcriptional corepressors might specialize in the maintenance of a wide range of cell identities in distinct tissue types throughout metazoa.
Materials and methods
C. elegans strains and transgenes
Request a detailed protocolAll C. elegans strains were grown on Nematode Growth Medium (NGM) plates seeded with E. coli OP50 as described previously (Brenner, 1974). We used the N2 Bristol strain as wild type. Worms were grown at 20 °C unless otherwise indicated. Standard molecular biology and microinjection methods, as previously described (Mello et al., 1991), were used to generate transgenic worms.
Plasmid construction
Request a detailed protocolThe nIs175[Pceh-28::gfp], nIs177[Pceh-28::gfp] and nIs348[Pceh-28::mCherry] transgenes have been previously described (Hirose et al., 2010). nIs743[Pgcy-28.d::ctbp-1(+)] contains 3.0 kb of the 5’ promoter of gcy-28.d fused to the ctbp-1a coding region inserted into plasmid pPD49.26. nIs840[Pgcy-28.d::gfp] contains 3.0 kb of the 5’ promoter of gcy-28.d inserted into pPD95.77. nIs843[Pgcy-28.d::mCherry] contains 3.0 kb of the 5’ promoter of gcy-28.d inserted into pPD122.56 containing mCherry. nEx2351[Phsp-16.2::ctbp-1(+); Phsp-16.41::ctbp-1(+)] contains ctbp-1a cDNA, isolated by RT-PCR, inserted into pPD49.78 and pPD49.83. nEx3055[Pgcy-28.d::egl-13(+)] contains 3.0 kb of the 5’ promoter of gcy-28.d fused to the egl-13 coding region inserted into pPD49.26. nEx3081[Pacbp-6::gfp] contains 2.0 kb of the 5’ promoter of acbp-6 inserted into pPD122.56. nEx3083[Pegl-13::gfp] contains 3.0 kb of the 5’ promoter of egl-13 inserted into pPD122.56. nIs753[Pgcy-28.d::ceh-28(+)] contains 3.0 kb of the 5’ promoter of gcy-28.d fused to the ceh-28 cDNA inserted into plasmid pPD49.26. AD::ctbp-1 (used in the Y2H assay) contains the ctbp-1a cDNA fused 3’ of the GAL4 activation domain in the plasmid pGADT7. BD::egl-13 and BD::egl-13(PLNHS) contain either wild-type egl-13 cDNA (BD::egl-13) or egl-13a cDNA with residue 259 mutated to histidine (BD::egl-13(PLNHS)) fused 3’ of the GAL4 DNA binding domain in the plasmid pGBKT7. Plasmid construction was performed using Infusion cloning enzymes (Takara Bio, Mountain View, CA).
Mutagenesis screens
Request a detailed protocolctbp-1 mutants were isolated from genetic screens for mutations that cause the survival of the M4 sister cell as scored by extra GFP-positive cells carrying the M4-cell-specific markers nIs175[Pceh-28::gfp] or nIs177[Pceh-28::gfp] (Hirose and Horvitz, 2013; Hirose et al., 2010). egl-13 and ttx-3 mutants were isolated from genetic screens for mutations that suppress nIs175 misexpression in the AIAs of ctbp-1(n4784) mutants while retaining GFP expression in the M4 neuron. For both screens, mutagenesis was performed with ethyl methanesulfonate (EMS) as previously described (Brenner, 1974). Mutagenized P0 animals were allowed to propagate, and their F2 progeny were synchronized by hypochlorite treatment and screened at the L4 stage for extra GFP-positive cells (ctbp-1 screens) or fewer GFP-positive cells (suppressor screens) on a dissecting microscope equipped to examine fluorescence. From both screens, mutant alleles were grouped into functional groups by complementation testing when possible. Mutants were mapped using SNP mapping (Davis et al., 2005) by crossing mutants to strains containing nIs175, nIs177, or nIs175; ctbp-1(n4784) introgressed into the Hawaiian strain CB4856. Whole-genome sequencing was performed on mutants and a combination of functional groupings and mapping data suggested genes with mutations that were likely causal for the mutant phenotypes. Rescue of mutant phenotypes with wild-type ctbp-1(+), egl-13(+), and ttx-3(+) constructs as well as the mutant phenotype of a separately isolated allele of ctbp-1, tm5512, or ttx-3, ks5 and ot22, confirmed the identities of the causal mutations.
Microscopy
Request a detailed protocolAll images were obtained using an LSM 800 confocal microscope (Zeiss LSM 800 with Airyscan Microscope, RRID:SCR_015963) and ZEN software. Images were processed and prepared for publication using FIJI software (Fiji, RRID:SCR_002285) and Adobe Illustrator (Adobe Illustrator, RRID:SCR_010279).
Heat-shock assays
Request a detailed protocolRescue of AIA defects in day 1 adult worms was assayed using the nEx2351[Phsp-16.2::ctbp-1; Phsp-16.41::ctbp-1] transgene. Worms were synchronized and grown at 20 °C. Subsets of L1 and L4 worms carrying nEx2351 were removed from this population for scoring at the appropriate stages. At the L4 stage, half of the worms were heat-shocked at 34 °C for 30 min and returned to 20 °C for 24 hrs while the other half remained at 20 °C throughout. After 24 hrs, heat-shocked and non-heat-shocked worms carrying nEx2351 were scored.
Single-cell RNA-sequencing
Dissociation of animals into cell suspensions
Request a detailed protocolSingle-cell suspensions were generated as described (Kaletsky et al., 2016; Taylor et al., 2019; Zhang and Kuhn, 2013) with minor modifications. Briefly, synchronized populations of worms were grown on NGM plates seeded with OP50 to the L4 larval stage. Worms were harvested from these plates, washed three times with M9 buffer and treated with SDS-DTT (200 mM DTT, 0.25% SDS, 20 mM HEPES, 3% sucrose, pH 8.0) for 2–3 min. Worms were washed five times with 1 x PBS and treated with pronase (15 mg/mL) for 20–23 min. During the pronase treatment, worm suspensions were pipetted with a P200 pipette rapidly for four sets of 80 repetitions. The pronase treatment was stopped by the addition of L-15–10 media (90% L-15 media, 10% FBS). The suspension was then passed through a 35 μm nylon filter into a collection tube, washed once with 1 x PBS, and prepared for FACS.
FACS of fluorescently labeled neurons
Request a detailed protocolFACS was performed using a BD FACSAria III cell sorter running BD FACS Diva software (BD FACSARIA III cell sorter, RRID:SCR_016695). DAPI was added to samples at a final concentration of 1 μg/mL to label dead and dying cells. GFP-positive, DAPI-negative neurons were sorted from the single-cell suspension into 1 x PBS containing 1% FBS. Non-fluorescent and single-color controls were used to set gating parameters. Cells were then concentrated and processed for single-cell sequencing.
Single-cell sequencing
Request a detailed protocolSamples were processed for single-cell sequencing using the 10X Genomics Chromium 3’mRNA-sequencing platform. Libraries were prepared using the Chromium Next GEM Single Cell 3’ Kit v3.1 according to the manufacturer’s protocol. The libraries were sequenced using an Illumina NextSeq 500 with 75 bp paired end reads.
Single-cell RNA-sequencing data processing
Request a detailed protocolData processing was performed using 10X Genomics’ CellRanger software (v4.0.0) (Cell Ranger, RRID:SCR_017344). Reads were mapped to the C. elegans reference genome from Wormbase, version WBcel235. For visualization and analysis of data, we used 10X Genomics’ Loupe Browser (v4.2.0) (Loupe Browser, RRID:SCR_018555). AIAs were identified by expression of multiple AIA markers confirmed to be expressed in both wild-type and ctbp-1 mutant AIAs (i.e. gcy-28, ins-1, cho-1; Figure 2B). Candidate genes for misexpression (either ectopic or missing) in mutant AIAs were identified and tested as described in the text.
Morphology scoring
Request a detailed protocolWe assayed AIA morphology by visualizing and imaging AIAs expressing nIs840 using an LSM 800 confocal microscope (Zeiss LSM 800 with Airyscan Microscope, RRID:SCR_015963) and a 63 x objective. AIA cell body length and area were quantified using FIJI software (Fiji, RRID:SCR_002285).
Image blinding and scoring
Request a detailed protocolA subset of 60 wild-type and 60 ctbp-1 mutant images per stage (randomly chosen from the existing images taken to measure AIA cell body length) were selected and the genotype of each was blinded. Blinded images were then scored as either ‘Normal’ or ‘Elongated’ in appearance in batches of 40 images (20 each of wild-type and ctbp-1 mutant, randomly assorted), repeated three times per stage. Scored images were then matched back to their genotypes and percentage of AIAs scored as ‘Elongated’ per genotype was calculated and graphed.
Behavioral assays
Butanone adaptation
Request a detailed protocolAssay conditions were adapted from Cho et al., 2016. Staged worms were washed off non-crowded NGM plates seeded with E. coli OP50 with S basal. Worms were washed two times with S basal and split evenly into the ‘naïve’ and ‘conditioned’ populations. Naïve worms were incubated in 1 mL S basal for 90 min. Conditioned worms were incubated in 1 mL S basal with 2-butanone diluted to a final concentration of 120 μM for 90 min. During conditioning, unseeded NGM plates were spotted with two 1 μL drops of 10% ethanol (‘control’) and two 1 μL drops of 2-butanone diluted in 10% ethanol at 1:1000 (‘odor’) as well as four 1 μL drops of 1 M NaN3 at the same loci. After conditioning, both populations were washed three more times in S basal and placed at the center of the unseeded NGM plates. Worms were allowed to chemotax for 2 hrs. Plates were moved to 4 °C for 30–60 min to stop the assay and then scored. Worms that had left the origin were scored as chemotaxing to the odor spots (‘#odor’) or control spots (‘#control’), and a chemotaxis index was determined as (#odor - #control) / (#odor + #control). Assays were repeated on at least three separate days with one to three plates per strain ran in parallel on any given day based on the number of appropriately-staged worms available. Plates in which fewer than 50 worms left the origin were not scored.
Chemotaxis assays
Request a detailed protocolL4 worms were washed off non-crowded NGM plates seeded with E. coli OP50 with S basal. Worms were washed three times with S basal. Unseeded NGM plates were spotted with two 1 μL drops of 100% ethanol (‘control’) and two 1 μL drops of diacetyl diluted in 100% ethanol at 1:1000 or two 1 μL drops of isoamyl alcohol diluted in 100% ethanol at 1:100 (‘odor’) as well as four 1 μL drops of 1 M NaN3 at the same loci. Worms were placed at the center of the unseeded NGM plates. Worms were allowed to chemotax for two hrs. Plates were moved to 4 °C for 30–60 min to stop the assay and then scored. Worms that had left the origin were scored, and a chemotaxis index was determined as above. Assays were repeated on at least three separate days. Plates in which fewer than 40 worms left the origin were not scored.
Yeast 2-hybrid assays
Request a detailed protocolFresh ( < 1 week old) Y2HGold (Takara) S. cerevisiae competent cells were cultured in YPDA media at 30 °C to an OD600 between 0.4 and 0.6, harvested, washed, and resuspended in SORB buffer (110 mM TE buffer, 110 mM LiAc, 1 M Sorbital). 100 ng each of bait (pGBKT7) and prey (pGADT7) plasmids were mixed with 50 μg denatured salmon sperm carrier DNA and transformed into Y2HGold competent cells. Cells were plated on SD -Trp -Leu dropout plates and grown at 30 °C for 2–3 days until colonies were sufficiently large. Colonies from these plates were cultured in SD -Trp -Leu media at 30 °C overnight. These cultures were diluted to an OD600 of 0.1, grown until at an OD600 of approximately 0.5, then harvested and resuspended in 0.9% NaCl. This cell suspension was serial diluted at 1:3 with 0.9% NaCl and 3 μL of each dilution was spotted on SD -Trp -Leu and SD -His -Ade -Trp -Leu + 10 mM 3-AT dropout plates. The plates were incubated at 30 °C for 2 days and then imaged.
CRISPR
Request a detailed protocolCRISPR mutation of egl-13 was performed according to published protocols (Dickinson and Goldstein, 2016). Briefly, Cas9 protein, egl-13 guide RNA, and egl-13 repair template were injected into MT15670 (nIs175[Pceh-28::gfp]) worms alongside dpy-10 guide RNAs (used as a coCRISPR marker). Dumpy animals were selected from the F1 generation, sequenced to confirm presences of the desired mutation in egl-13, then backcrossed to MT15670 worms to remove background and dpy-10 mutations. Backcrossed strains were again genotyped to confirm the presence of the egl-13 mutation.
egl-13 guide RNA sequence: GTGTCTTTTGAAAGATTTAA.
egl-13 repair template sequence: GGAGATTGTGGAATAGCAGTTGGAGATGGGGTGTCTTTTGAATGATTTAAAGGTGTCTCCACTTTTTCGACTGTTTGCATGTTTCCAGCGGCTGCAAGTT.
Statistical analyses
Request a detailed protocolUnpaired t-tests were used for the comparisons of AIA gene expression and AIA morphological features. One-way ANOVA tests with Tukey’s correction were used for comparisons of AIA gene expression, morphological features and for behavioral assays. Statistical tests were performed using GraphPad Prism software (GraphPad Prism version 6.0 h, RRID:SCR_002798).
Appendix 1
All strains generated in this study are available upon request from the Horvitz Laboratory.
Appendix 1—key resources table
| Reagent type (species) or resource | Designation | Source or reference | Identifiers | Additional information |
|---|---|---|---|---|
| Strain, strain background (C. elegans) | N2 (wild type) | Horvitz Lab collection | WBStrain00000001 | wild type |
| Strain, strain background (C. elegans) | MT15670 | Takashi Hirose/Bob Horvitz | n/a | nIs175[Pceh-28::gfp] |
| Strain, strain background (C. elegans) | MT15672 | Takashi Hirose/Bob Horvitz | n/a | nIs177[Pceh-28::gfp] |
| Strain, strain background (C. elegans) | MT15677 | This paper | n/a | nIs175; ctbp-1(n4778) Figure 1—figure supplement 1A–B |
| Strain, strain background (C. elegans) | MT16225 | This paper | n/a | nIs175; ctbp-1(n4784) Figure 1—figure supplement 1A–B |
| Strain, strain background (C. elegans) | MT15688 | This paper | n/a | nIs175; ctbp-1(n4789) Figure 1—figure supplement 1A–B |
| Strain, strain background (C. elegans) | MT15801 | This paper | n/a | nIs175; ctbp-1(n4800) Figure 1—figure supplement 1A–B |
| Strain, strain background (C. elegans) | MT15805 | This paper | n/a | nIs175; ctbp-1(n4804) Figure 1—figure supplement 1A–B |
| Strain, strain background (C. elegans) | MT15806 | This paper | n/a | nIs175; ctbp-1(n4805) Figure 1—figure supplement 1A–B |
| Strain, strain background (C. elegans) | MT15809 | This paper | n/a | nIs175; ctbp-1(n4808) Figure 1—figure supplement 1A–B |
| Strain, strain background (C. elegans) | MT15811 | This paper | n/a | nIs175; ctbp-1(n4810) Figure 1—figure supplement 1A–B |
| Strain, strain background (C. elegans) | MT15813 | This paper | n/a | nIs175; ctbp-1(n4813) Figure 1—figure supplement 1A–B |
| Strain, strain background (C. elegans) | MT15820 | This paper | n/a | nIs175; ctbp-1(n4819) Figure 1—figure supplement 1A–B |
| Strain, strain background (C. elegans) | MT15824 | This paper | n/a | nIs175; ctbp-1(n4823) Figure 1—figure supplement 1A–B |
| Strain, strain background (C. elegans) | MT15825 | This paper | n/a | nIs175; ctbp-1(n4824) Figure 1—figure supplement 1A–B |
| Strain, strain background (C. elegans) | MT15841 | This paper | n/a | nIs177; ctbp-1(n4840) Figure 1—figure supplement 1A–B |
| Strain, strain background (C. elegans) | MT15850 | This paper | n/a | nIs177; ctbp-1(n4849) Figure 1—figure supplement 1A–B |
| Strain, strain background (C. elegans) | MT15853 | This paper | n/a | nIs177; ctbp-1(n4852) Figure 1—figure supplement 1A–B |
| Strain, strain background (C. elegans) | MT15862 | This paper | n/a | nIs177; ctbp-1(n4861) Figure 1—figure supplement 1A–B |
| Strain, strain background (C. elegans) | MT15865 | This paper | n/a | nIs177; ctbp-1(n4864) Figure 1—figure supplement 1A–B |
| Strain, strain background (C. elegans) | MT15866 | This paper | n/a | nIs177; ctbp-1(n4865) Figure 1—figure supplement 1A–B |
| Strain, strain background (C. elegans) | MT26446 | This paper | n/a | nIs175; ctbp-1(tm5512) Figure 1—figure supplement 1C–D |
| Strain, strain background (C. elegans) | MT15918 | This paper | n/a | nIs175 introgressed into CB4856 “Hawaiian” backgroundUsed to map mutants Figure 1—figure supplement 1A |
| Strain, strain background (C. elegans) | MT16295 | This paper | n/a | nIs177 introgressed into CB4856 backgroundUsed to map mutants Figure 1—figure supplement 1A |
| Strain, strain background (C. elegans) | MT26522 | This paper | n/a | nIs175; ctbp-1(n4784) introgressed into CB4856 backgroundUsed to map mutants Figure 6A–C |
| Strain, strain background (C. elegans) | MT23360 | This paper | n/a | nIs175; ctbp-1(n4784); nEx2346[ctbp-1(+)] Figure 1—figure supplement 2A |
| Strain, strain background (C. elegans) | MT23361 | This paper | n/a | nIs175; ctbp-1(n4784); nEx2347[ctbp-1(+)] Figure 1A |
| Strain, strain background (C. elegans) | MT23714 | This paper | n/a | nIs175; ctbp-1(n4784); nIs743[Pgcy-28.d::ctbp-1(+)] Figure 1F |
| Strain, strain background (C. elegans) | MT25271 | This paper | n/a | nIs843[Pgcy-28.d::mCherry] Figure 1B |
| Strain, strain background (C. elegans) | MT26437 | This paper | n/a | nIs175; ctbp-1(n4784); nIs843 Figure 1B |
| Strain, strain background (C. elegans) | MT23365 | This paper | n/a | nIs175; ctbp-1(n4784); nEx2351[Phsp-16.2::ctbp-1(+);Phsp-16.41::ctbp-1(+)] Figure 1H |
| Strain, strain background (C. elegans) | MT18778 | Takashi Hirose/Bob Horvitz | n/a | nIs348[Pceh-28::mCherry]; lin-15AB(n765ts) |
| Strain, strain background (C. elegans) | MT20844 | This paper | n/a | nIs348[Pceh-28::mCherry]; ctbp-1(n4784) Figure 1—figure supplement 1E |
| Strain, strain background (C. elegans) | NH2466 | Caenorhabditis Genetics Center (CGC) | WBStrain00028771 | ayIs4[Pegl-17::gfp]; dpy-20(e1282ts) |
| Strain, strain background (C. elegans) | MT26417 | This paper | n/a | ayIs4; nIs348; ctbp-1(n4784) Figure 2A |
| Strain, strain background (C. elegans) | BW1946 | Caenorhabditis Genetics Center (CGC) | WBStrain00004003 | ctIs43[Pdbl-1::gfp] unc-42(e270) |
| Strain, strain background (C. elegans) | MT23726 | This paper | n/a | nIs348; ctIs43 unc-42(e270); ctbp-1(n4784) Figure 2A |
| Strain, strain background (C. elegans) | MT20852 | This paper | n/a | nIs491[Pser-7.b::mCherry] Figure 2A |
| Strain, strain background (C. elegans) | MT23427 | This paper | n/a | nIs491; ctbp-1(n4784) Figure 2A |
| Strain, strain background (C. elegans) | NY2080 | Caenorhabditis Genetics Center (CGC) | WBStrain00029170 | ynIs80[Pflp-21::gfp] |
| Strain, strain background (C. elegans) | MT23718 | This paper | n/a | nIs348; ctbp-1(n4784); ynIs80 Figure 2A |
| Strain, strain background (C. elegans) | OH10237 | Caenorhabditis Genetics Center (CGC) | WBStrain00029598 | otIs326[Pins-1::gfp] |
| Strain, strain background (C. elegans) | MT26422 | This paper | n/a | ctbp-1(n4784); otIs326Figure 2B |
| Strain, strain background (C. elegans) | JN1716 | Caenorhabditis Genetics Center (CGC) | n/a | peIs1716[Pins-1s::gfp;Pttx-3::mCherry] |
| Strain, strain background (C. elegans) | MT23717 | This paper | n/a | nIs348; ctbp-1(n4784); peIs1716 Figure 2B |
| Strain, strain background (C. elegans) | OH11030 | Caenorhabditis Genetics Center (CGC) | WBStrain00029645 | otIs317[Pmgl-1::mCherry]; otIs379[Pcho-1::gfp] |
| Strain, strain background (C. elegans) | MT26421 | This paper | n/a | nIs348; ctbp-1(n4784); otIs317; otIs379 Figure 2B |
| Strain, strain background (C. elegans) | MT26420 | This paper | n/a | ctbp-1(n4784); otIs317 Figure 2B |
| Strain, strain background (C. elegans) | MT25268 | This paper | n/a | nIs840[Pgcy-28.d::gfp]Figure 3A–D |
| Strain, strain background (C. elegans) | MT25270 | This paper | n/a | nIs842[Pgcy-28.d::gfp]Figure 3A–D |
| Strain, strain background (C. elegans) | MT26412 | This paper | n/a | nIs348; ctbp-1(n4784); nIs840Figure 3A–D |
| Strain, strain background (C. elegans) | MT26438 | This paper | n/a | nIs348; ctbp-1(n4784); nIs743; nIs840Figure 3E–H |
| Strain, strain background (C. elegans) | MT26439 | This paper | n/a | nIs348; ctbp-1(n4784); nIs840; nEx2351Figure 3I–L |
| Strain, strain background (C. elegans) | JN580 | Caenorhabditis Genetics Center (CGC) | n/a | peIs580[Pins-1s::casp1;Pins-1s::venus;Punc-122::gfp] |
| Strain, strain background (C. elegans) | MT23746 | This paper | n/a | nIs175; egl-13(n5937) ctbp-1(n4784) Figure 6B |
| Strain, strain background (C. elegans) | MT24129 | This paper | n/a | nIs175; egl-13(n6013) ctbp-1(n4784) Figure 6B |
| Strain, strain background (C. elegans) | MT25352 | This paper | n/a | nIs175; egl-13(n6313) ctbp-1(n4784) Figure 6B |
| Strain, strain background (C. elegans) | MT25347 | This paper | n/a | nIs175; ctbp-1(n4784) ttx-3(n6308) Figure 6C |
| Strain, strain background (C. elegans) | MT25355 | This paper | n/a | nIs175; ctbp-1(n4784) ttx-3(n6316) Figure 6C |
| Strain, strain background (C. elegans) | MT26486 | This paper | n/a | nIs175; egl-13(n5937) ctbp-1(n4784); nEx3062[egl-13(+)] Figure 6—figure supplement 1C |
| Strain, strain background (C. elegans) | MT26487 | This paper | n/a | nIs175; egl-13(n5937) ctbp-1(n4784); nEx3063[egl-13(+)]Figure 6—figure supplement 1C |
| Strain, strain background (C. elegans) | MT26549 | This paper | n/a | nIs175; egl-13(n6013) ctbp-1(n4784); nEx3080[egl-13(+)]Figure 6—figure supplement 1C |
| Strain, strain background (C. elegans) | MT26523 | This paper | n/a | nIs175; egl-13(n6313) ctbp-1(n4784); nEx3074[egl-13(+)]Figure 6—figure supplement 1C |
| Strain, strain background (C. elegans) | MT26548 | This paper | n/a | nIs175; egl-13(n6313) ctbp-1(n4784); nEx3079[egl-13(+)]Figure 6—figure supplement 1C |
| Strain, strain background (C. elegans) | MT26448 | This paper | n/a | nIs175; ctbp-1(n4784) ttx-3(ot22) Figure 6—figure supplement 2B |
| Strain, strain background (C. elegans) | MT26447 | This paper | n/a | nIs175; ctbp-1(n4784) ttx-3(ks5) Figure 6—figure supplement 2B |
| Strain, strain background (C. elegans) | MT26491 | This paper | n/a | nIs175; ctbp-1(n4784) ttx-3(n6308); nEx3067[ttx-3(+)]Figure 6—figure supplement 2C |
| Strain, strain background (C. elegans) | MT26492 | This paper | n/a | nIs175; ctbp-1(n4784) ttx-3(n6308); nEx3068[ttx-3(+)]Figure 6—figure supplement 2C |
| Strain, strain background (C. elegans) | MT26493 | This paper | n/a | nIs175; ctbp-1(n4784) ttx-3(n6308); nEx3069[ttx-3(+)]Figure 6—figure supplement 2C |
| Strain, strain background (C. elegans) | MT26521 | This paper | n/a | nIs175; ctbp-1(n4784) ttx-3(n6316); nEx3073[ttx-3(+)]Figure 6—figure supplement 2C |
| Strain, strain background (C. elegans) | MT26528 | This paper | n/a | nIs175; ctbp-1(n4784) ttx-3(n6316); nEx3078[ttx-3(+)]Figure 6—figure supplement 2C |
| Strain, strain background (C. elegans) | MT26481 | This paper | n/a | nIs175; egl-13(n5937) ctbp-1(n4784); nEx3055[Pgcy-28.d::egl-13(+)] Figure 7—figure supplement 1A–B |
| Strain, strain background (C. elegans) | MT26441 | This paper | n/a | nIs175; egl-13(n5937) ctbp-1(n4784); nIs840Figure 6E |
| Strain, strain background (C. elegans) | MT26442 | This paper | n/a | nIs175; ctbp-1(n4784) ttx-3(n6308); nIs840 Figure 6E |
| Strain, strain background (C. elegans) | MT26415 | This paper | n/a | evIs111[Prgef-1::gfp]; nIs843 Figure 5A–E |
| Strain, strain background (C. elegans) | MT26416 | This paper | n/a | ctbp-1(n4784); evIs111; nIs843 Figure 5A–E |
| Strain, strain background (C. elegans) | MT26444 | This paper | n/a | otIs123[Psra-11::gfp]; nIs843 Figure 5C |
| Strain, strain background (C. elegans) | MT26580 | This paper | n/a | nIs843; nEx3083[Pegl-13::gfp] Figure 5A |
| Strain, strain background (C. elegans) | MT26604 | This paper | n/a | ctbp-1(n4784); nIs843; nEx3083 Figure 5A |
| Strain, strain background (C. elegans) | MT26808 | This paper | n/a | nIs175; egl-13(n6675) Figure 7C |
| Strain, strain background (C. elegans) | MT26445 | This paper | n/a | nIs348; ctbp-1(n4784); otIs123 Figure 5C |
| Strain, strain background (C. elegans) | MT26524 | This paper | n/a | nIs348; egl-13(n5937) ctbp-1(n4784); otIs123 Figure 8B |
| Strain, strain background (C. elegans) | MT26504 | This paper | n/a | nIs843; ivEx138[Pglr-2::gfp] Figure 5E |
| Strain, strain background (C. elegans) | MT26505 | This paper | n/a | nIs348; ctbp-1(n4784); ivEx138 Figure 5E |
| Strain, strain background (C. elegans) | MT26550 | This paper | n/a | nIs348; egl-13(n5937) ctbp-1(n4784); ivEx138 Figure 8C |
| Strain, strain background (C. elegans) | MT26581 | This paper | n/a | nIs843; nEx3081[Pacbp-6::gfp] Figure 5A |
| Strain, strain background (C. elegans) | MT26551 | This paper | n/a | nIs348; ctbp-1(n4784); nEx3081 Figure 5A |
| Strain, strain background (C. elegans) | MT26582 | This paper | n/a | nIs348; egl-13(n5937) ctbp-1(n4784); nEx3081 Figure 8A |
| Strain, strain background (C. elegans) | MT26605 | This paper | n/a | acbp-6(tm2995); nIs175; ctbp-1(n4784) Figure 9A–D |
| Strain, strain background (C. elegans) | MT23725 | This paper | n/a | nIs175; ctbp-1(n4784) ceh-28(cu11) Figure 9E–H |
| Strain, strain background (C. elegans) | MT23736 | This paper | n/a | nIs753[Pgcy-28.d::ceh-28(+)] Figure 9I–L |
Data availability
Sequencing data have been deposited in GEO under accession code GSE179484. All source data, images, numerical data and graphics have been uploaded to figshare.com and are available at https://doi.org/10.6084/m9.figshare.c.5771480.v1. All source numerical data and graphics for all figures and figure supplements have been provided.
-
NCBI Gene Expression OmnibusID GSE179484. The transcriptional corepressor CTBP-1 acts with the SOX family transcription factor EGL-13 to maintain AIA interneuron cell identity in C. elegans.
References
-
A regulatory cascade of three homeobox genes, ceh-10, ttx-3 and ceh-23, controls cell fate specification of a defined interneuron class in C. elegansDevelopment 128:1951–1969.
-
Lhx9 Is Required for the Development of Retinal Nitric Oxide-Synthesizing Amacrine Cell SubtypeMolecular Neurobiology 55:2922–2933.https://doi.org/10.1007/s12035-017-0554-y
-
Differential expression of glutamate receptor subunits in the nervous system of Caenorhabditis elegans and their regulation by the homeodomain protein UNC-42The Journal of Neuroscience 21:1510–1522.
-
large-scale screening for targeted knockouts in the Caenorhabditis elegans genomeG3: Genes, Genomes, Genetics 2:1415–1425.https://doi.org/10.1534/g3.112.003830
-
A genomic regulatory network for developmentScience 295:1669–1678.https://doi.org/10.1126/science.1069883
-
Maintenance of postmitotic neuronal cell identityNature Neuroscience 17:899–907.https://doi.org/10.1038/nn.3731
-
Regulation of touch receptor differentiation by the Caenorhabditis elegans mec-3 and unc-86 genesDevelopment 125:4107–4119.
-
Transgenic targeting of a dominant negative corepressor to liver blocks basal repression by thyroid hormone receptor and increases cell proliferationThe Journal of Biological Chemistry 276:15066–15072.https://doi.org/10.1074/jbc.m011027200
-
The molecular and gene regulatory signature of a neuronTrends in Neurosciences 33:435–445.https://doi.org/10.1016/j.tins.2010.05.006
-
Regulation of terminal differentiation programs in the nervous systemAnnual Review of Cell and Developmental Biology 27:681–696.https://doi.org/10.1146/annurev-cellbio-092910-154226
-
A map of terminal regulators of neuronal identity in Caenorhabditis elegansWiley Interdisciplinary Reviews. Developmental Biology 5:474–498.https://doi.org/10.1002/wdev.233
-
Terminal Selectors of Neuronal IdentityCurrent Topics in Developmental Biology 116:455–475.https://doi.org/10.1016/bs.ctdb.2015.12.007
-
Neuronal identity control by terminal selectors in worms, flies, and chordatesCurrent Opinion in Neurobiology 56:97–105.https://doi.org/10.1016/j.conb.2018.12.006
-
Proliferation control in neural stem and progenitor cellsNature Reviews. Neuroscience 16:647–659.https://doi.org/10.1038/nrn4021
-
Genetics and Epigenetics in Adult NeurogenesisCold Spring Harbor Perspectives in Biology 8:a018911.https://doi.org/10.1101/cshperspect.a018911
-
Parallel Use of Two Behavioral Mechanisms for Chemotaxis in Caenorhabditis elegansJournal of Neuroscience 29:5370–5380.https://doi.org/10.1523/JNEUROSCI.3633-08.2009
-
SoxD Transcription Factors: Multifaceted Players of Neural DevelopmentInternational Journal of Stem Cells 9:3–8.https://doi.org/10.15283/ijsc.2016.9.1.3
-
A Gro/TLE-NuRD corepressor complex facilitates Tbx20-dependent transcriptional repressionJournal of Proteome Research 12:5395–5409.https://doi.org/10.1021/pr400818c
-
Finding MyoD and lessons learned along the waySeminars in Cell & Developmental Biology 72:3–9.https://doi.org/10.1016/j.semcdb.2017.10.021
-
Efficient gene transfer in C.elegans: extrachromosomal maintenance and integration of transforming sequencesThe EMBO Journal 10:3959–3970.
-
Emerging roles of the corepressors NCoR1 and SMRT in homeostasisGenes & Development 27:819–835.https://doi.org/10.1101/gad.214023.113
-
SOX6 binds CtBP2 to repress transcription from the Fgf-3 promoterNucleic Acids Research 29:3347–3355.https://doi.org/10.1093/nar/29.16.3347
-
The Caenorhabditis elegans protein CTBP-1 defines a new group of THAP domain-containing CtBP corepressorsJournal of Molecular Biology 375:1–11.https://doi.org/10.1016/j.jmb.2007.10.041
-
CEH-28 activates dbl-1 expression and TGF-β signaling in the C. elegans M4 neuronDevelopmental Biology 390:149–159.https://doi.org/10.1016/j.ydbio.2014.03.015
-
Emerging roles of Sox6 in the renal and cardiovascular systemPhysiological Reports 8:e14604.https://doi.org/10.14814/phy2.14604
-
C-terminal binding proteins: central players in development and diseaseBiomolecular Concepts 5:489–511.https://doi.org/10.1515/bmc-2014-0027
-
Retinal differentiation in DrosophilaWiley Interdisciplinary Reviews. Developmental Biology 2:545–557.https://doi.org/10.1002/wdev.100
-
Master control: transcriptional regulation of mammalian MyodJournal of Muscle Research and Cell Motility 40:211–226.https://doi.org/10.1007/s10974-019-09538-6
-
Muscle-specific transcriptional activation by MyoDGenes & Development 5:1377–1386.https://doi.org/10.1101/gad.5.8.1377
-
Pet-1 Switches Transcriptional Targets Postnatally to Regulate Maturation of Serotonin Neuron ExcitabilityThe Journal of Neuroscience 36:1758–1774.https://doi.org/10.1523/JNEUROSCI.3798-15.2016
-
Neuronal cell-type classification: challenges, opportunities and the path forwardNature Reviews. Neuroscience 18:530–546.https://doi.org/10.1038/nrn.2017.85
-
UNC-55, an orphan nuclear hormone receptor, orchestrates synaptic specificity among two classes of motor neurons in Caenorhabditis elegansThe Journal of Neuroscience 18:10438–10444.
Article and author information
Author details
Funding
Howard Hughes Medical Institute
- Josh Saul
- Takashi Hirose
- H Robert Horvitz
National Institutes of Health (GM024663)
- Josh Saul
- Takashi Hirose
- H Robert Horvitz
National Institutes of Health (T32GM007287)
- Josh Saul
Friends of the McGovern Institute Fellowship (2733360)
- Josh Saul
The funders had no role in study design, data collection and interpretation, or the decision to submit the work for publication.
Acknowledgements
We thank N An, R Droste, S Mitani, and the Caenorhabditis Genetics Center (CGC), which is funded by NIH Office of Research Infrastructure Programs (P40 OD010440), for strains and reagents. We thank C Diehl, E Lee, C Pender, S Sando, V Dwivedi, K Burkhart, S Wong, C Fincher, C Cho, G Johnson, D Lee, D Ghosh, A Amon, P Reddien, and Horvitz laboratory members for discussion and advice.
Copyright
© 2022, Saul et al.
This article is distributed under the terms of the Creative Commons Attribution License, which permits unrestricted use and redistribution provided that the original author and source are credited.
Metrics
-
- 910
- views
-
- 111
- downloads
-
- 3
- citations
Views, downloads and citations are aggregated across all versions of this paper published by eLife.
Citations by DOI
-
- 3
- citations for umbrella DOI https://doi.org/10.7554/eLife.74557
Download links
A two-part list of links to download the article, or parts of the article, in various formats.
Downloads (link to download the article as PDF)
Open citations (links to open the citations from this article in various online reference manager services)
Cite this article (links to download the citations from this article in formats compatible with various reference manager tools)
The transcriptional corepressor CTBP-1 acts with the SOX family transcription factor EGL-13 to maintain AIA interneuron cell identity in Caenorhabditis elegans
eLife 11:e74557.
https://doi.org/10.7554/eLife.74557


