Hematopoietic stem and progenitor cells improve survival from sepsis by boosting immunomodulatory cells
- Graduate Program in Immunology, Baylor College of Medicine, United States
- Department of Pediatrics, Division of Infectious Diseases, Baylor College of Medicine, United States
- Graduate Program in Translational Biology and Molecular Medicine, Baylor College of Medicine, United States
- Division of Infectious Diseases, Department of Pediatrics, UTHSC/McGovern Medical School, United States
- The Scripps Research Institute, Department of Immunology and Microbiology, United States
Figures
Figure 1 with 1 supplement

Group A Streptococcus (GAS) infection promotes a rapid myeloid cell response.
(A) Experimental time frame of GAS infection and bone marrow (BM) analysis. (B) Serum levels of monocyte chemoattractant protein-1 (MCP-1) of naïve and GAS-infected mice. Absolute number of (C) monocytes, (D) granulocytes, (E) B cells, and (F) F cells in the BM of naïve and infected mice. Relative abundance of (G) monocytes, (H) granulocytes, (I) B cells, and (J) T cells in the blood. (B–J) Data is representative of three independent experiments; n = 3–5 mice/group; statistical comparison done using unpaired t-test; *p < 0.05, **p < 0.01, ****p < 0.0001. Outliers were identified using the ROUT method (Q = 5%).
-
Figure 1—source data 1
BM and PB populations of lineage cells and serum MCP-1 levels.
- https://cdn.elifesciences.org/articles/74561/elife-74561-fig1-data1-v1.xlsx
Figure 1—figure supplement 1
Group A Streptococcus (GAS) infection and superinfection promotes exit of myeloid cells from bone marrow (BM) into circulation.
(A) Experimental time frame of superinfection and BM analysis. (B) Serum levels of monocyte chemoattractant protein-1 (MCP-1) of naïve and mice infected with GAS, flu, or both pathogens. Absolute number of (C) monocytes, (E) B cells, (G) granulocytes, and (I) T cells in the BM of naïve and infected mice. Relative abundance of blood (D) monocytes, (F) B cells, (H) granulocytes, and (J) T cells. (B–J) Data is representative of three independent experiments; n = 3–5; statistical comparison done using unpaired t-test; *p < 0.05, **p < 0.01,***p < 0.001, ****p < 0.0001.
-
Figure 1—figure supplement 1—source data 1
BM counts of HSPC populations of naïve, infected, and superinfected mice.
- https://cdn.elifesciences.org/articles/74561/elife-74561-fig1-figsupp1-data1-v1.xlsx
Figure 2 with 1 supplement
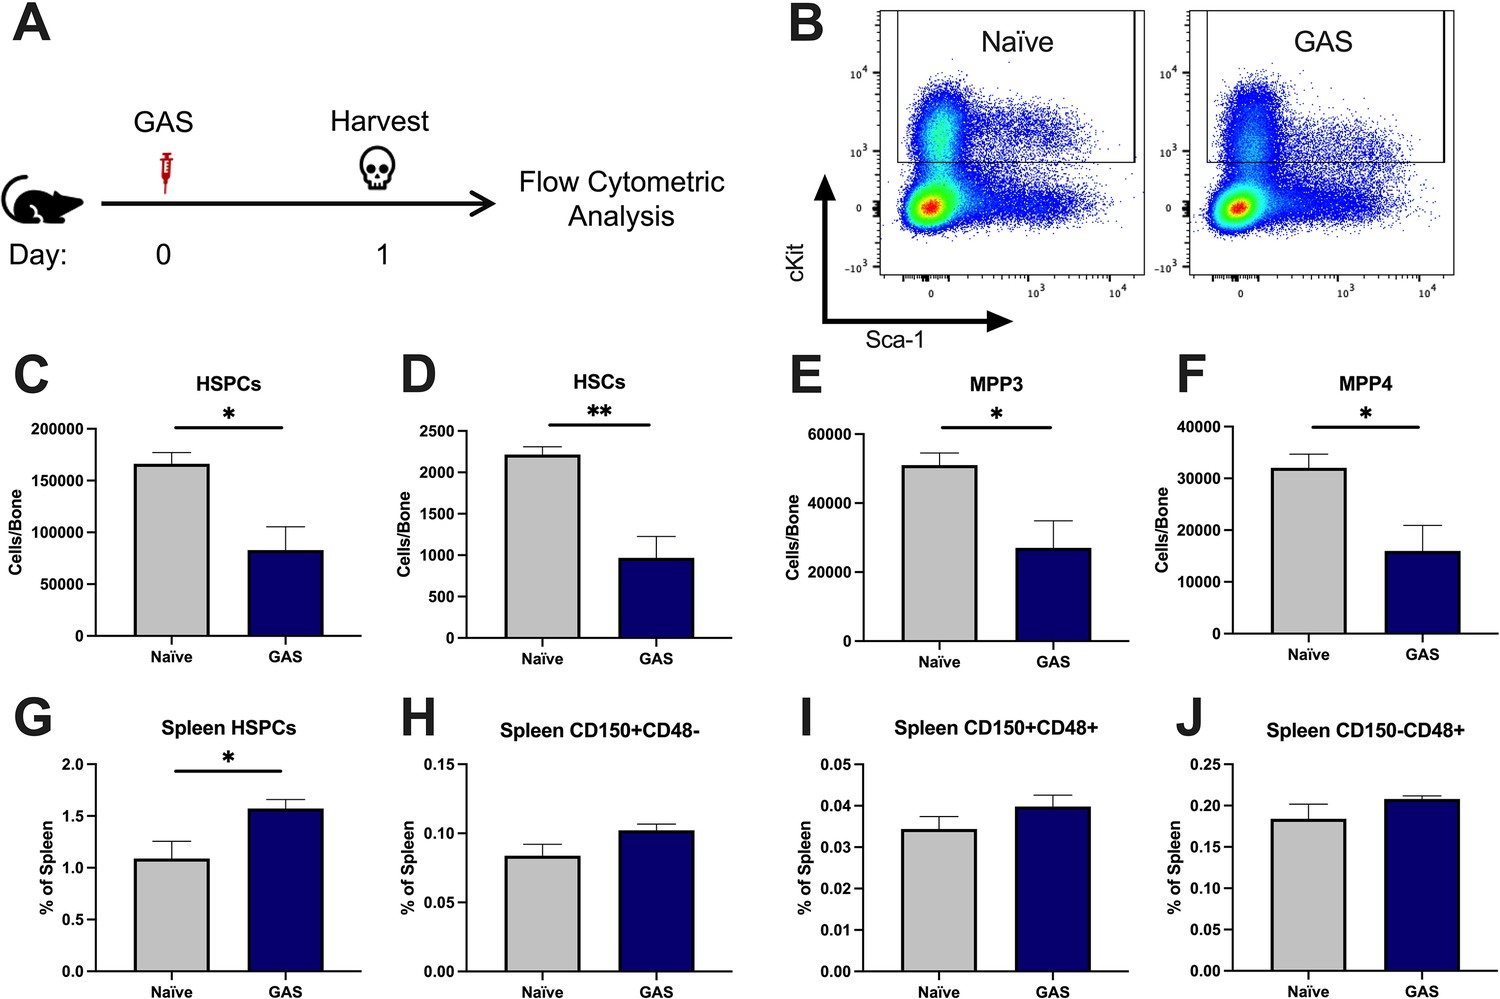
Group A Streptococcus (GAS) infection depletes bone marrow (BM) hematopoietic stem and progenitor cells (HSPCs) 24 hr post infection.
(A) Experimental time frame of GAS infection and BM analysis. (B) Flow plot of HSPC gating and representation of different surface expression of cKit and Sca-1 during infection. Plots are gated from lineage negative BM cells. (C–F) Absolute number of HSPCs, hematopoietic stem cells (HSCs), multipotent progenitors (MPP) 3, and MPP4 in the BM of naïve and GAS-infected mice. Spleen populations of (G) HSPCs, (H) HSC/MPP1, (I) MPP2, and (J) MMP3/4 identified by differential expression of CD150 and CD48. (C–J) Data is representative of three independent experiments; n = 4–5 mice/group; statistical comparison done using unpaired t-test; *p < 0.05, **p < 0.01. Outliers were identified using the ROUT method (Q = 5%).
-
Figure 2—source data 1
BM counts of HSPC populations of naïve and infected mice and spleen HSPC populations.
- https://cdn.elifesciences.org/articles/74561/elife-74561-fig2-data1-v1.xlsx
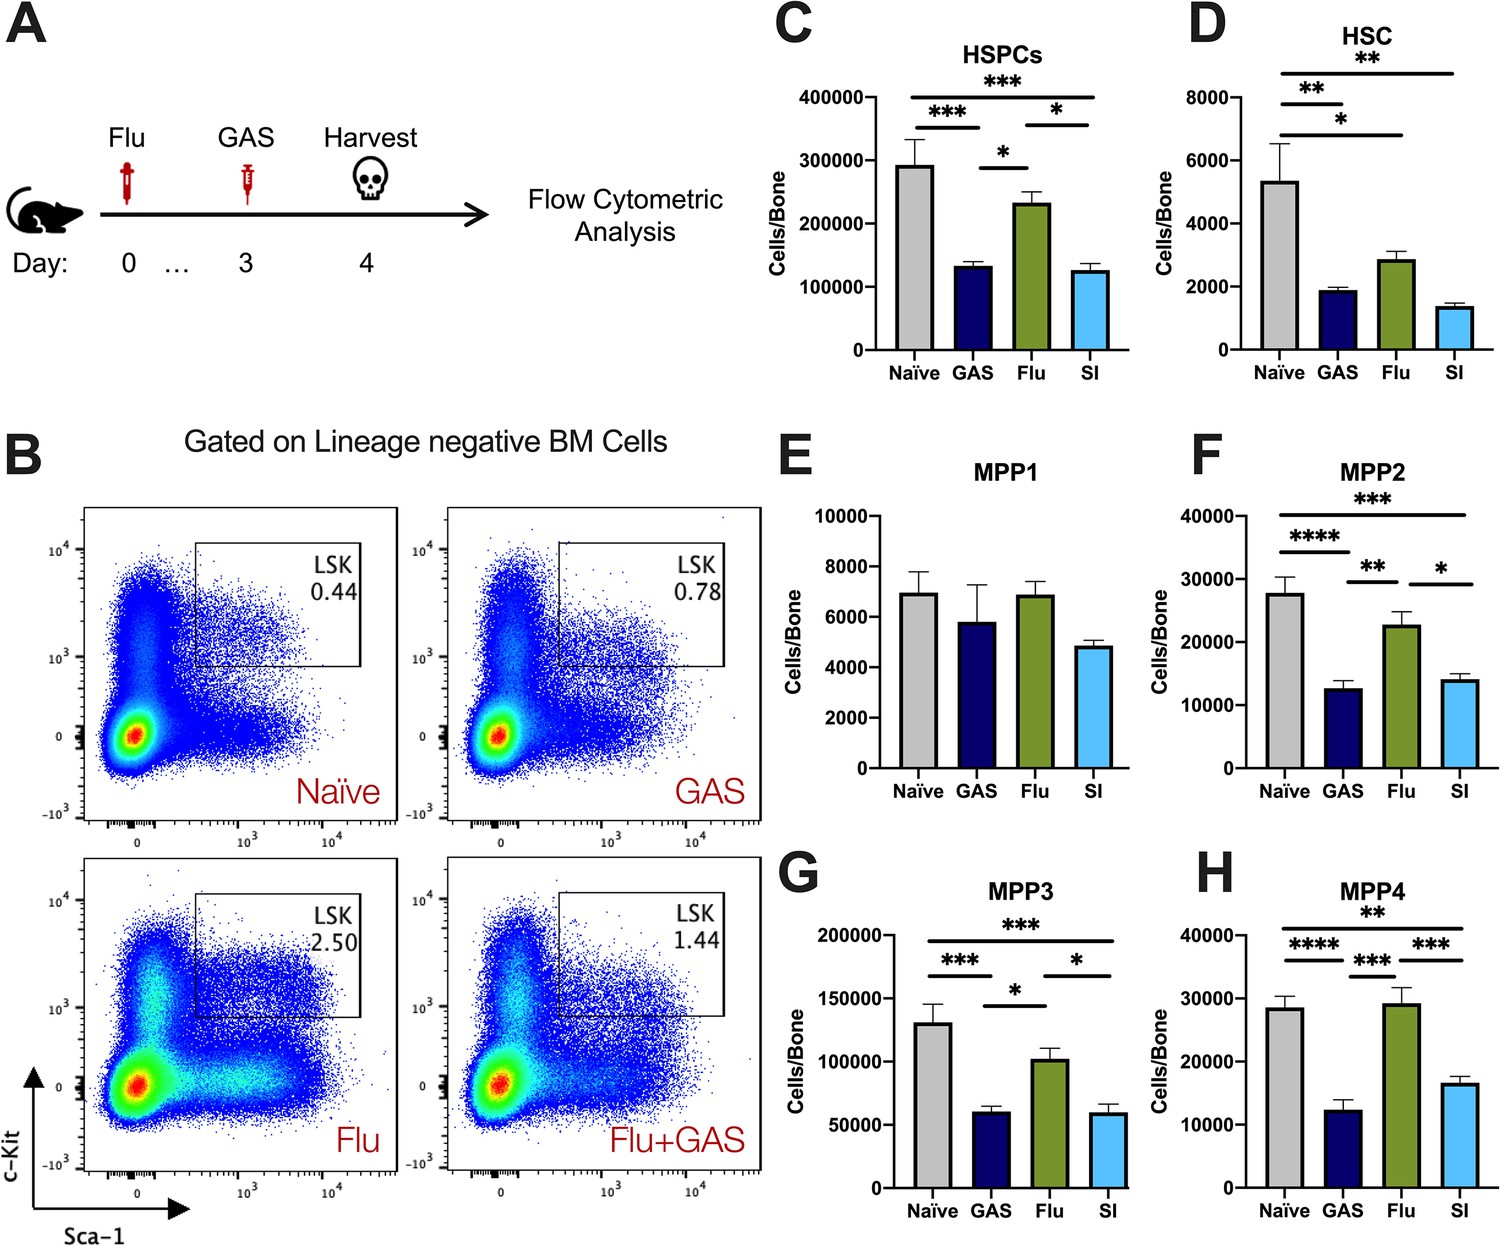
Figure 2—figure supplement 1

Superinfection further depletes hematopoietic stem and progenitor cells (HSPCs) and hematopoietic stem cells (HSCs) in the bone marrow (BM).
(A) Experimental design of superinfection. (B) Flow cytometry plots of HSPCs (LSK) and their phenotypic expression of surface c-Kit and Sca-1. (C–H) Absolute number of HSPC, HSCs, and multipotent progenitor (MPP) subpopulations in the BM of naïve, Group A Streptococcus (GAS)-infected, flu-infected, or superinfected mice. Data is representative of three independent experiments; n = 5 mice/group. Comparison was done using one-way ANOVA and Tukey’s correction for multiple comparisons; *p < 0.05, **p < 0.01, ***p < 0.001, ****p < 0.0001.
-
Figure 2—figure supplement 1—source data 1
BM and PB levels of immune cells and MCP-1 during infection.
- https://cdn.elifesciences.org/articles/74561/elife-74561-fig2-figsupp1-data1-v1.xlsx
Figure 3
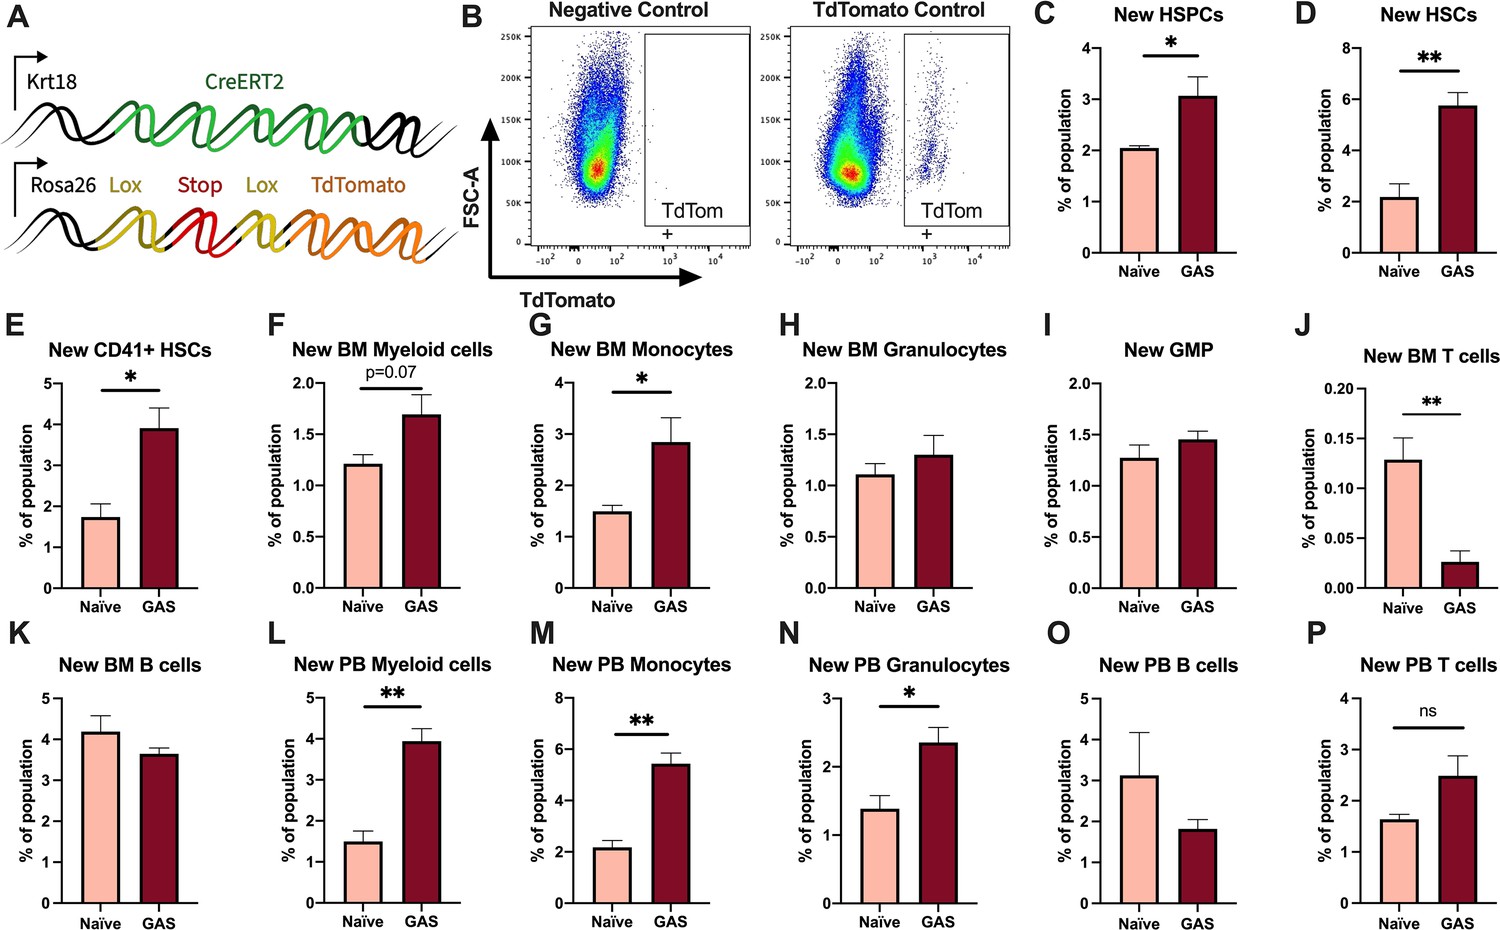
Krt18 lineage tracing of naïve and Group A Streptococcus (GAS)-infected hematopoietic stem cells (HSCs).
(A) Genetic model of KRT18-CreERT2:Rosa26-lox-STOP-lox-TdTomato mouse system. (B) Representative gating of TdTomato expression in negative control (left: Genotype: Krt18-CreERT2+) and tamoxifen-induced positive control (right: Genotype: KRT18-CreERT2+: Rosa26-lox-STOP-lox-TdTomato+/-). Percent of bone marrow (BM) (C) hematopoietic stem and progenitor cell (HSPC), (D) HSC, (E) CD41+ HSC, and (F) myeloid populations that are TdTomato+. Percent of BM (G) total monocytes, (H) granulocytes, (I) granulocyte/monocyte progenitor (GMP), (J) BM T cells, and (K) BM B cells that are TdTomato+. Percent of peripheral blood (PB) (L) total myeloid cells, (M) monocytes, (N) granulocytes, (O) T cells, and (P) B cells that are TdTomato+. Data representative of three independent experiments; (C–N) n = 5–7 mice/group. Statistical comparison done using unpaired t-tests; *p < 0.05, **p < 0.01.
-
Figure 3—source data 1
Levels of newly generated cells in response to GAS infection.
- https://cdn.elifesciences.org/articles/74561/elife-74561-fig3-data1-v1.xlsx
Figure 4
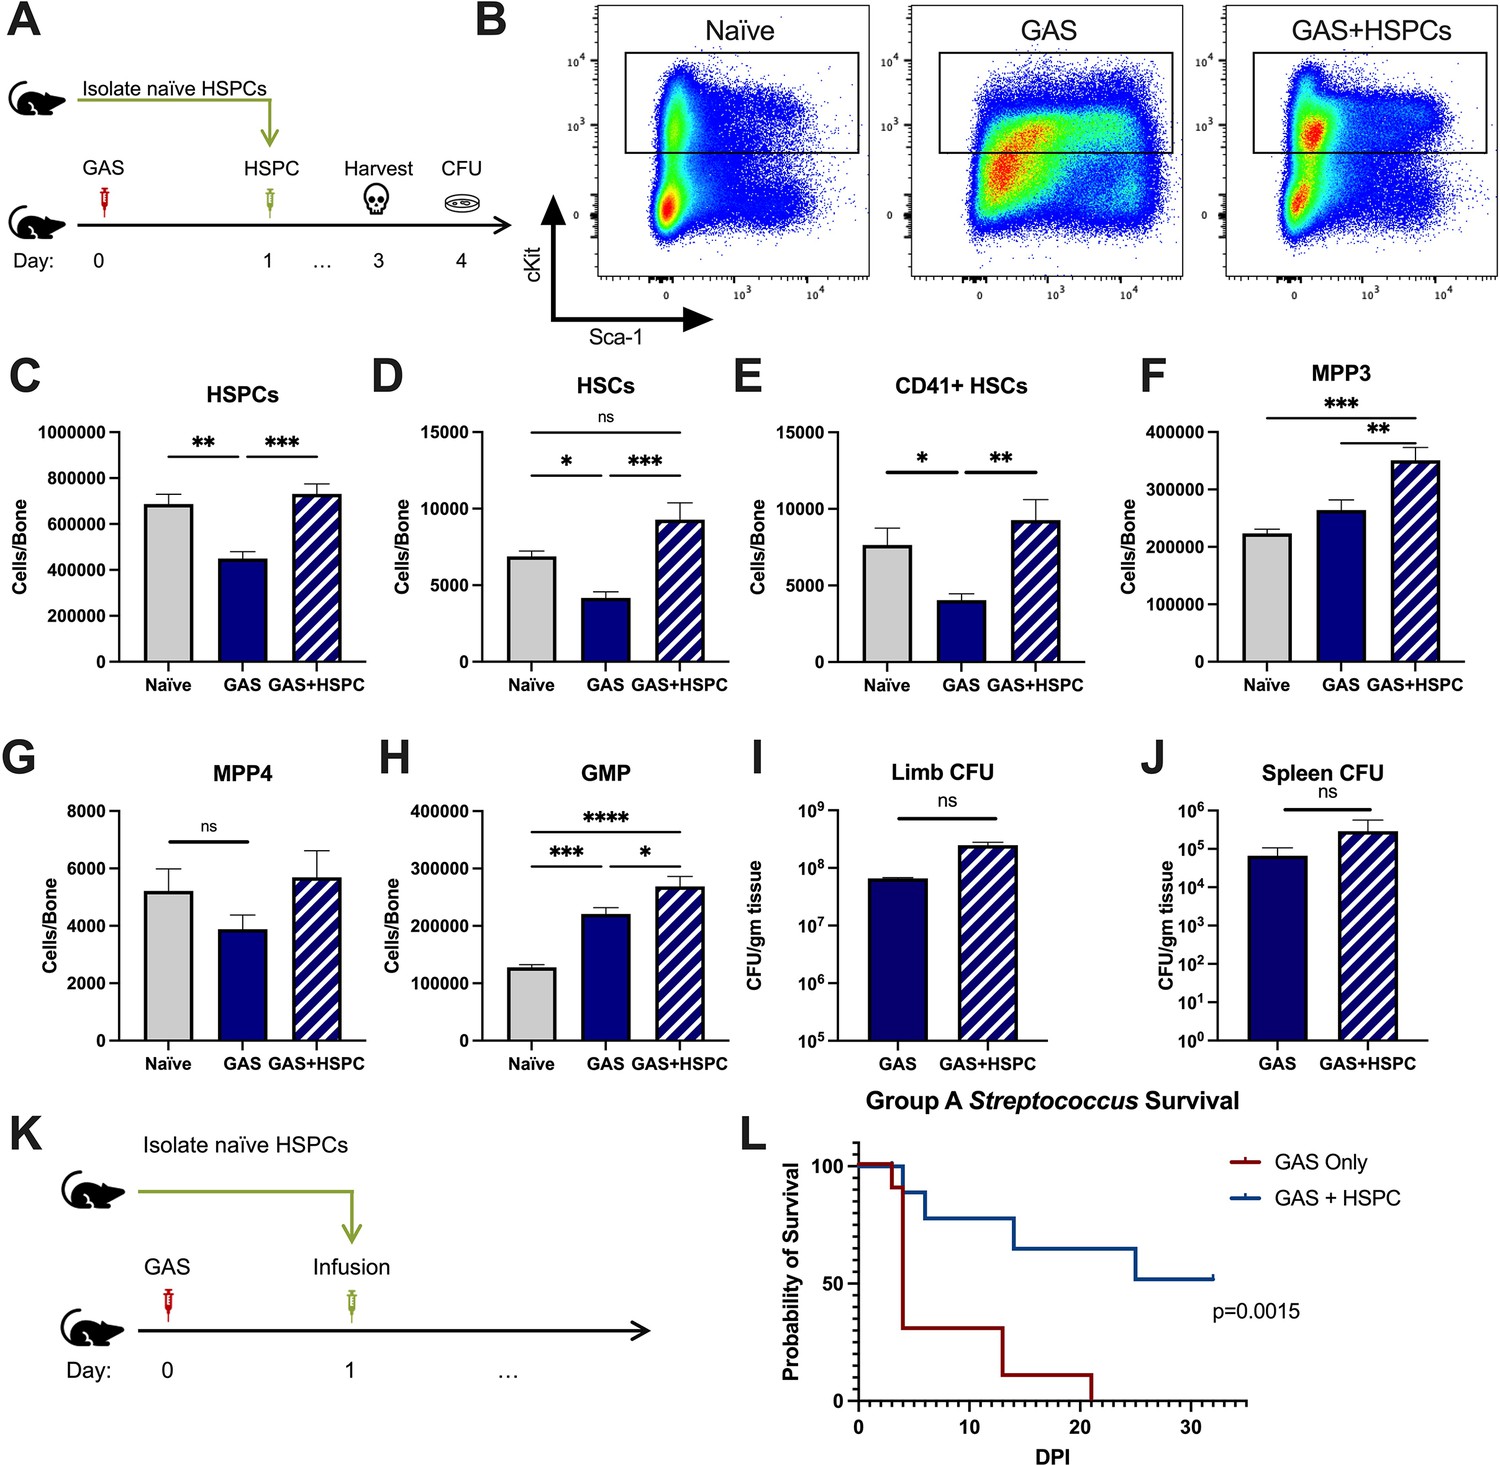
Hematopoietic stem and progenitor cell (HSPC) infusion in Group A Streptococcus (GAS)-infected mice promotes survival and increases progenitor populations in the bone marrow (BM).
(A) Experimental design of BM analysis and colony forming unit (CFU) count after HSPC infusion. (B) Flow plot of HSPC gating and representation of different surface expression of cKit and Sca-1 during infection. Plots are gated from lineage negative BM cells. (C–H) Absolute numbers of HSPCs, hematopoietic stem cells (HSCs), and downstream progenitors in the BM of naïve, GAS-infected mice, and GAS-infected mice rescued with HSPCs. Quantified bacterial load in the (I) limb and (J) spleen of infected mice. (K) Experimental design of the survival study. (J) Survival curve of GAS-infected mice with or without HSPC infusion. Data representative of three independent experiments; (C–H) n = 5–7 mice/group, (I and J) n = 8–10 mice/group, (L) n = 9–10 mice/group. Statistical comparison done using (C–H) one-way ANOVA with Tukey’s correction for multiple comparisons or (I and J) unpaired t-tests. ns = not significant, *p < 0.05, **p < 0.01, ***p < 0.001, *****p < 0.0001. Comparison of (L) survival was done using Log-rank (Mantel-Cox) test.
-
Figure 4—source data 1
HSPC levels after infusion and survival data.
- https://cdn.elifesciences.org/articles/74561/elife-74561-fig4-data1-v1.xlsx
Figure 5
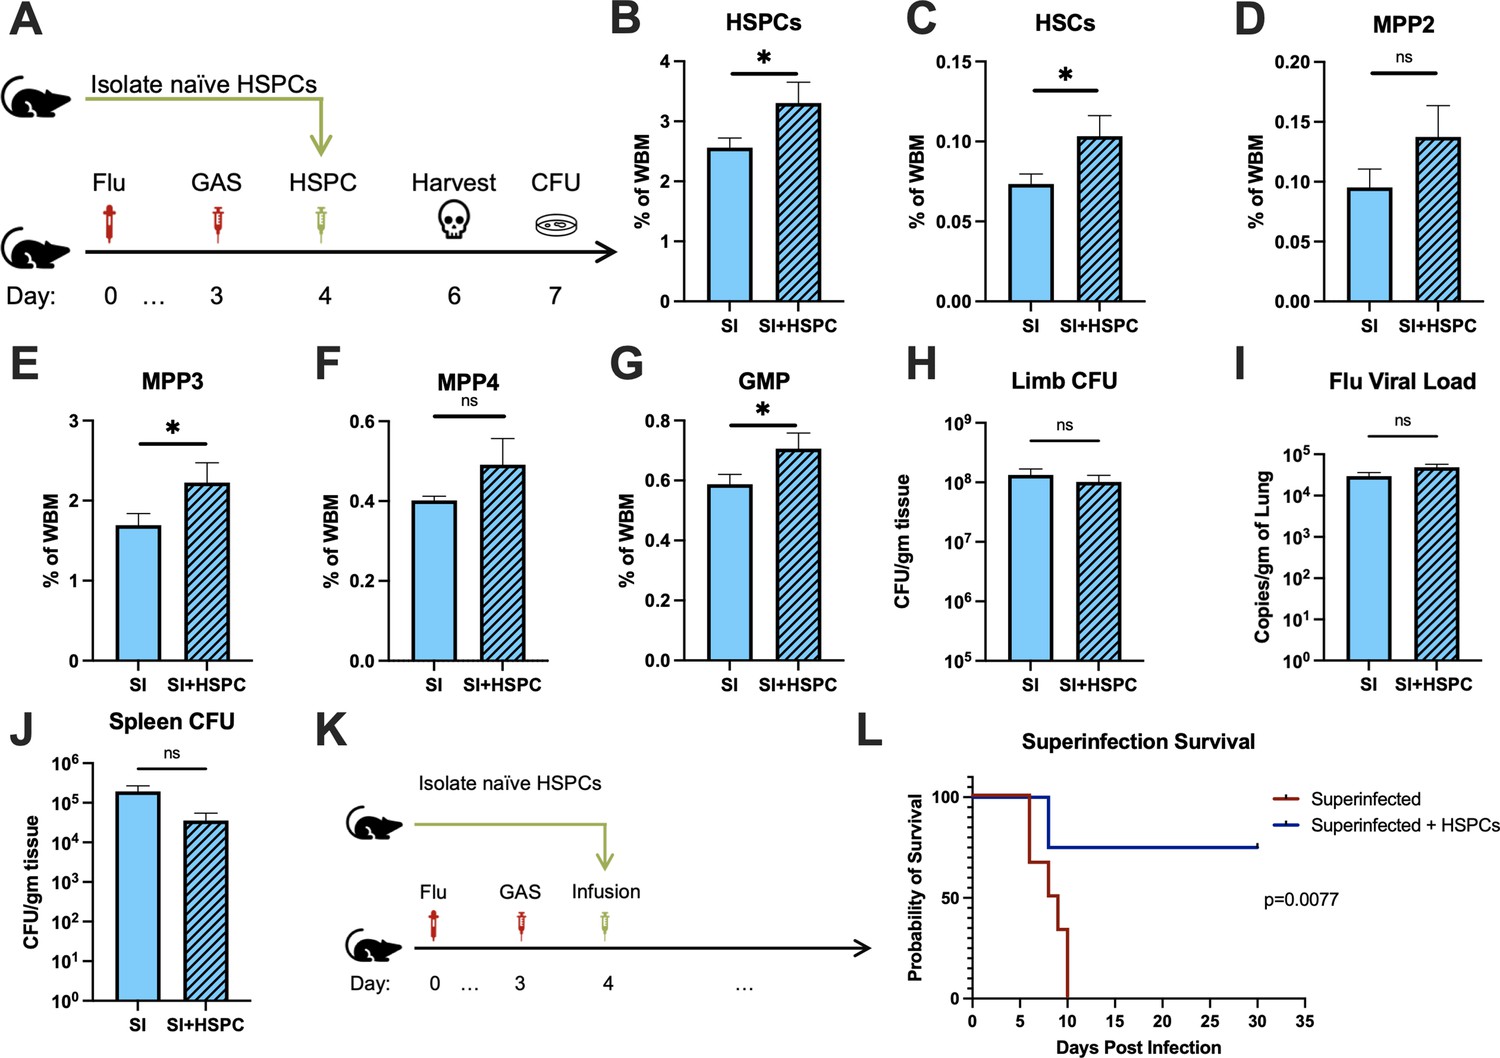
Hematopoietic stem and progenitor cell (HSPC) infusion in superinfected mice promotes survival without changing pathogen clearance.
(A) Experimental design of bone marrow (BM) analysis and colony forming unit (CFU) count post HSPC infusion in superinfected mice. (B–G) BM populations of HSPCs and downstream progenitors after HSPC infusion. Bacterial load in the (H) limb and (J) spleen of infected mice. (I) Viral load of mice with or without HSPC infusion. (K) Experimental design of the survival studies on superinfected mice. (L) Survival curve after HSPC infusion. Experiments are representative of three independent experiments. (B–J) Comparison done with unpaired t-test or Welch’s t-test. (B–G) n = 5, (H–J) n = 9–11, and (L) n = 9–10 mice per group. Comparison of (L) survival was done using Log-rank (Mantel-Cox) test. ns = not significant, *p < 0.05.
-
Figure 5—source data 1
HSPC levels in superinfected mice after infusion and survival data.
- https://cdn.elifesciences.org/articles/74561/elife-74561-fig5-data1-v1.xlsx
Figure 6 with 1 supplement
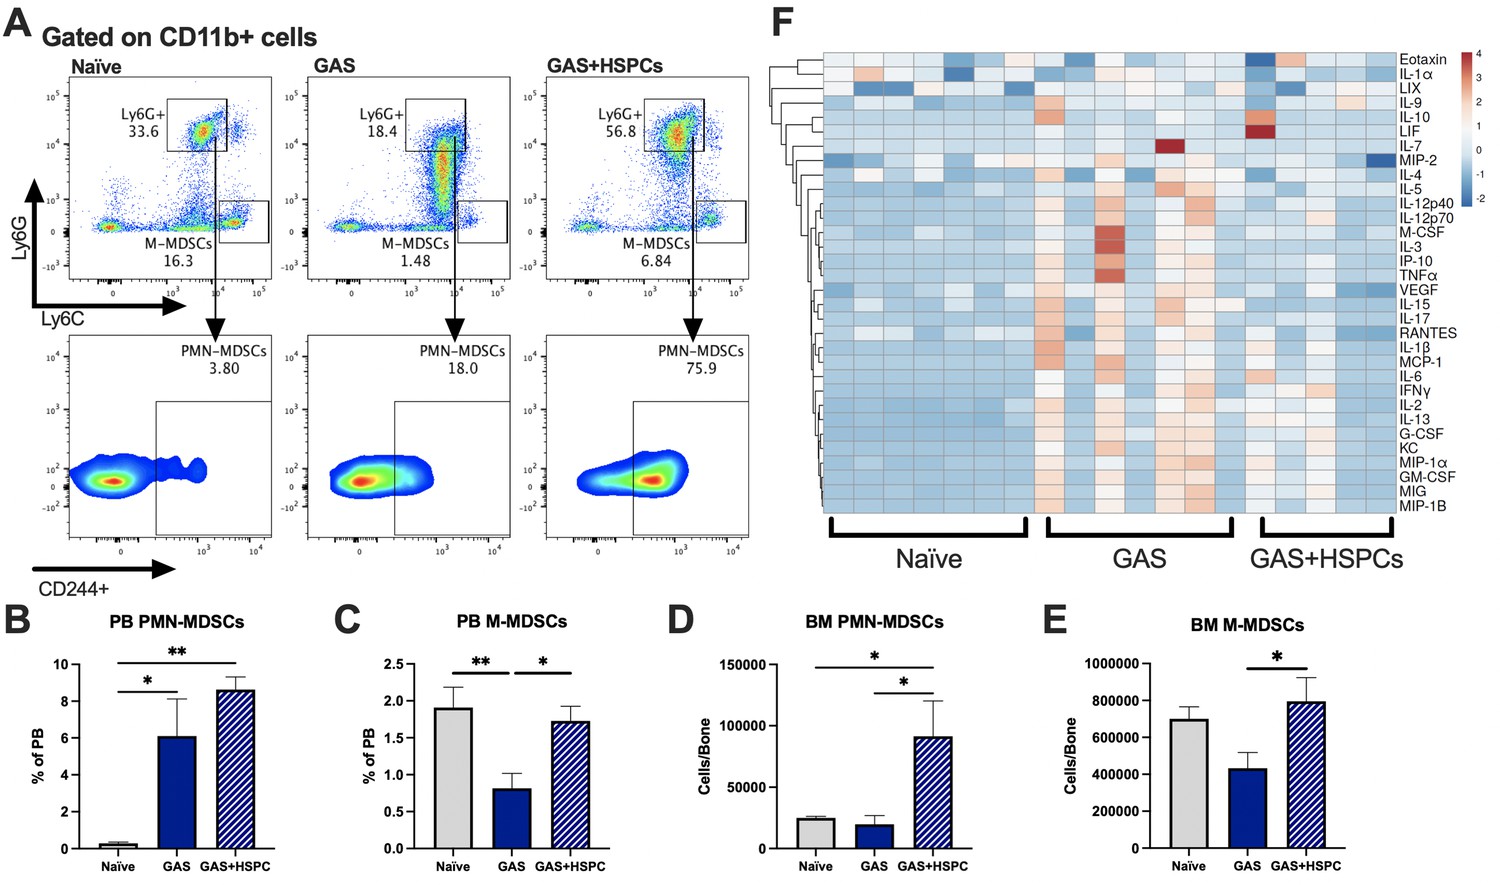
Hematopoietic stem and progenitor cell (HSPC) infusion increases and restores myeloid-derived suppressor cell (MDSC) populations and dampens inflammation after Group A Streptococcus (GAS).
(A) Representative gating of MDSCs by their surface expression of Ly6G and Ly6C at day 3 post infection. Gated on CD11b + cells. Peripheral blood (PB) populations of (B) polymorphonuclear MDSCs (PMN-MDSCs) and (C) monocytic-MDSCs (M-MDSCs) of naïve, GAS-infected, and GAS-infected mice infused with HSPCs. Bone marrow (BM) populations of (D) PMN-MDSCs and (E) M-MDSCs of naïve, GAS-infected, and GAS-infected mice infused with HSPCs. (F) Heatmap of serum cytokine levels using ClustVis web tool (Metsalu and Vilo, 2015). Data representative of two (A–E) or four (F) independent experiments. (B–E) Statistical comparison done using one-way ANOVA with Tukey’s correction for multiple comparisons; n = 7 mice per group; *p < 0.05, **p < 0.01. Outliers were identified using the ROUT method (Q = 5%).
-
Figure 6—source data 1
BM and PB levels of MDSC populations and cytokine levels raw data.
- https://cdn.elifesciences.org/articles/74561/elife-74561-fig6-data1-v1.xlsx
Figure 6—figure supplement 1
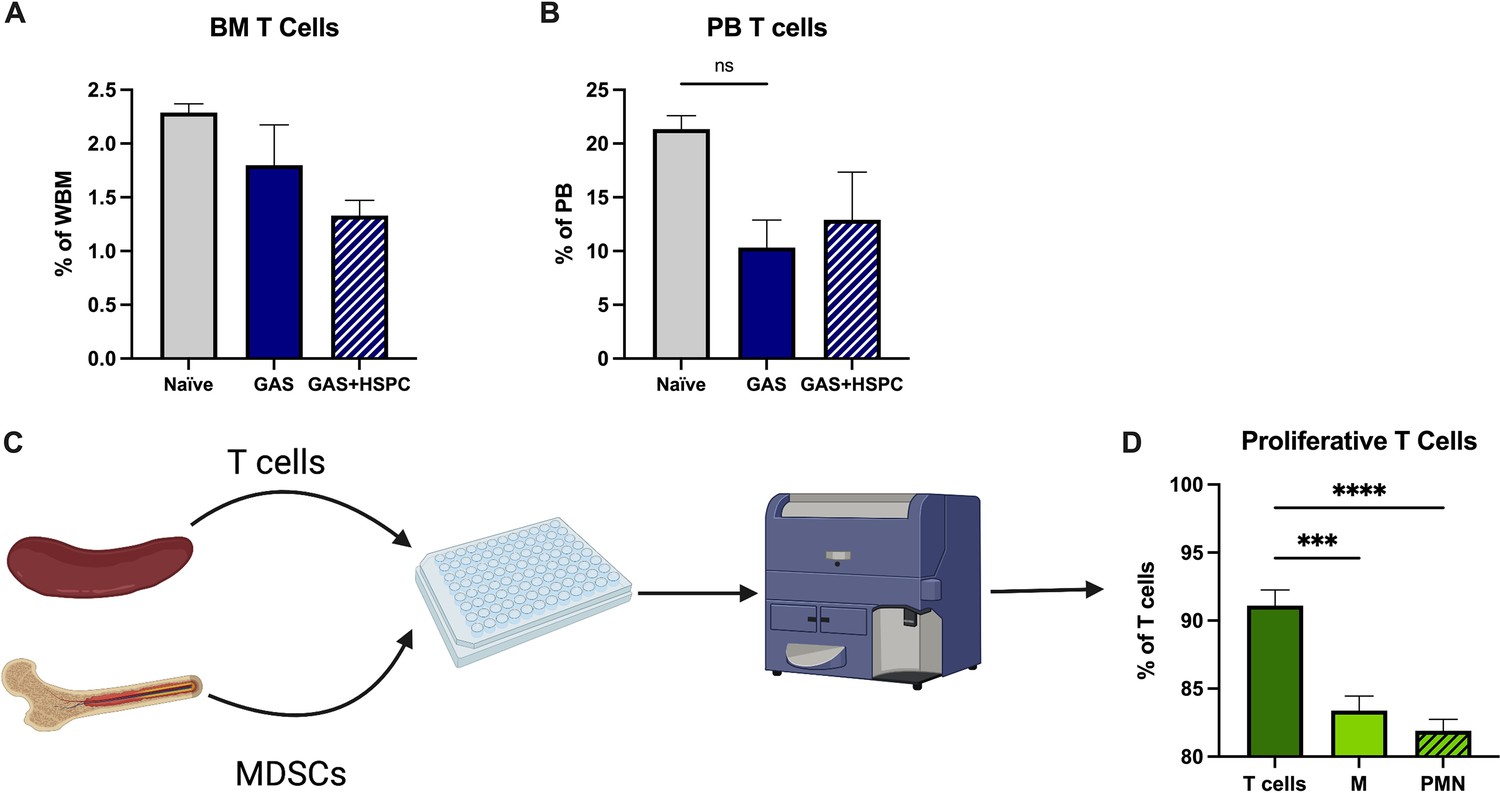
Myeloid-derived suppressor cells (MDSCs) reduce activated T cell proliferation.
The abundance of T cells in the (A) bone marrow (BM) and (B) peripheral blood (PB) of mice; n = 5–7 mice per group. (C) Experimental design of T cell suppression assay. Created with https://BioRender.com. (D) Flow cytometric measurement of T cell proliferation by dilution of CellTrace Violet dye. ‘M’ (monocytic) represents M-MDSCs and ‘PMN’ (polymorphonuclear) represents PMN-MDSCs. Data is representative of at least two experiments. Statistical comparison done using one-way ANOVA and Tukey’s correction for multiple comparisons; ***p < 0.001, ****p < 0.0001.
-
Figure 6—figure supplement 1—source data 1
T cell numbers after infusion and suppression assay data.
- https://cdn.elifesciences.org/articles/74561/elife-74561-fig6-figsupp1-data1-v1.xlsx
Figure 7

Lineage fate of infused hematopoietic stem and progenitor cells (HSPCs) in Group A Streptococcus (GAS)-infected mice skews myeloid without signs of stem cell engraftment.
Gating representation of the lineage fate of (A) bone marrow (BM) HSPCs, (B) BM lineage cells, and (C) peripheral blood (PB) lineage cells 30 days after GAS infection. Data is representative of three independent experiments.
Author response image 1

Author response image 2
Tables
Table 1
Surface markers for flow cytometry.
Hematopoietic cell populations identified by flow cytometry were characterized using the listed surface markers. Lineage (Lin) markers include Gr1, CD11b, B220, CD4, CD8, and Ter119.
| Population | Markers |
|---|---|
| HSC | Lin- ckit+ CD150+ CD48- CD34- Flk2- |
| CD41+ HSCs | Lin- ckit+ CD150+ CD48- CD34- Flk2- CD41+ |
| Donor HSPCs | Lin- ckit+ Sca1+ |
| HSPCs | Lin- ckit+ |
| MPP1 | Lin- ckit+ CD150+ CD48 CD34+ Flk2- |
| MPP2 | Lin- ckit+ CD150+ CD48+ Flk2- |
| MPP3 | Lin- ckit+ CD150 CD48+ CD34+ Flk2- |
| MPP4 | Lin- ckit+ CD150 CD48+ CD34+ Flk2+ |
| GMP | Lin- ckit+ CD41- CD150- CD16/32+ |
| MkP | Lin- ckit+ CD150+ CD41+ |
| Myeloid cells | Gr1+ Mac1+ B220- CD4- CD8- |
| B cells | Gr1- Mac1- B220+ CD4- CD8- |
| T cells | Gr1- Mac1- B220- CD4+ CD8 or Gr1- Mac1- B220- CD4- CD8+ |
| Granulocytes | Gr1+ Mac1+ B220- CD4- CD8- SSC-mid F4/80- |
| Eosinophils | Gr1- Mac1+ B220- CD4- CD8- SSCHi |
| Macrophages | Gr1+ Mac1+ B220- CD4- CD8- SSClow F4/80+ |
| Monocytes | Mac1+ B220- CD4- CD8- SSClow |
| PMN-MDSC | CD11b + Ly6G + Ly6ClowCD244+ |
| M-MDSC | CD11b + Ly6G- Ly6Chi |
Key resources table
| Reagent type (species) or resource | Designation | Source or reference | Identifiers | Additional information |
|---|---|---|---|---|
| Antibody | American Hamster monoclonal Anti-mouse CD3e | Biolegend | Clone 145–2C11 (Cat. No. 100301) | (2 µg/mL) RRID:AB_312666 |
| Antibody | Syrian Hamster monoclonal anti-mouse CD28 | Biolegend | Clone 37.51 (Cat. No. 102101) | (2 µg/mL)RRID:AB_312866 |
| Antibody | Rat Monoclonal anti-mouse Gr1-PECy5 | eBioscience | Clone RB6-8C5 (Cat. No. 15-5931-82) | (1:100)RRID:AB_468813 |
| Antibody | Rat Monoclonal Anti-Mouse CD11b PE-Cyanine5 | eBioscience | Clone M1/70 (Cat. No. 15-0112-82) | (1:100)RRID:AB_468714 |
| Antibody | Rat MonoclonalAnti-Human/Mouse CD45R (B220) PE-Cyanine5 | eBioscience | Clone RA3-6B2 (Cat. No. 15-0452-82) | (1:100)RRID:AB_468755 |
| Antibody | Rat Monoclonal ANTI-MOUSE CD4 PE-Cy5 | eBioscience | Clone GK1.5 (Cat. No. 15-0041-82) | (1:100)RRID:AB_469532 |
| Antibody | Rat Monoclonal Anti-Mouse CD8a PE-Cyanine5 | eBioscience | Clone 53–6.7 (Cat. No. 15-0081-82) | (1:100)RRID:AB_468706 |
| Antibody | Rat Monoclonal Anti-Mouse TER-119 PE-Cyanine5 | eBioscience | Clone TER119 (Cat. No. 15-5921-82) | (1:100)RRID:AB_468810 |
| Antibody | Rat monoclonal anti-mouse Sca-1 Pacific Blue | Biolegend | Clone D7 (Cat. No. 108120) | (1:100)RRID:AB_493273 |
| Antibody | Rat monoclonal anti-mouse Ly-6G | Biolegend | Clone 1A8 (Cat. No. 127605) | (1:100)RRID:AB_1236488 |
| Antibody | Mouse monoclonalAnti-Mouse CD45.1 PE | Biolegend | Clone A20 (Cat. No.110707) | (1:100)RRID:AB_313496 |
| Antibody | Rat Monoclonal anti-mouse CD117 (c-Kit) APC-eFluor 780 | eBioscience | Clone 2B8 (CaT. No. 47-1171-82) | (1:100)RRID:AB_1272177 |
| Antibody | Rat MonoclonalAnti-Mouse CD150 PECy7 | Biolegend | Clone TC15-12F12.2 (Cat. No. 115914) | (1:100)RRID:AB_439797 |
| Antibody | American Hamster Monoclonal Anti-mouse CD48 APC | eBioscience | Clone HM48-1 (Cat. No. 17-0481-82) | (1:100)RRID:AB_469408 |
| Antibody | Rat Monoclonal Anti-Mouse CD34 FITC | eBioscience | Clone RAM34 (11-0341-82) | (1:50)RRID:AB_465021 |
| Antibody | Rat Monoclonal Anti-Mouse CD135 DyLight680 | Novus | Clone A2F10 (Cat. No. NBP1-43352FR) | (1:50)RRID:AB_2904163 |
| Antibody | Rat Monoclonal Anti-Mouse CD16/32 BV605 | BD | Clone 2.4G2 (93) (Cat. No. 563006) | (1:100)RRID:AB_2737947 |
| Antibody | Rat Monoclonal Anti Mouse CD41 BV480 | BD | Clone MWReg30 (Cat. No. 746554) | (1:100)RRID:AB_2743844 |
| Antibody | Rat Monoclonal Anti-mouse Ly-6C APC | Biolegend | Clone HK1.4 (Cat. No. 128016) | (1:100)RRID:AB_1732076 |
| Antibody | Rat Monoclonal Anti-mouse CD244 PECy7 | eBioscience | Clone eBio244F4 (Cat. No. 25-2441-82) | (1:100)RRID:AB_2573432 |
| Antibody | Rat Monoclonal Anti-Mouse F4/80 Pacific Blue | ThermoFisher | Clone BM8 (Cat. No. MF48028) | (1:100)RRID:AB_1500083 |
| Chemical compound, drug | Penicillin-Streptomycin | Invitrogen | (Cat. No. 15140122) | |
| Chemical compound, drug | Hanks' Balanced Salt Solution | Gibco/Thermofisher | HBSS (Cat. No. 14170161) | |
| Chemical compound, drug | HEPES (1M) | Gibco/Thermofisher | Cat. No. 15630080 | |
| Chemical compound, drug | Tamoxifen | Sigma | (Cat. No. 10540-29-1) | |
| Commercial assay or kit | CD117 Microbeads | Miltenyi-Biotec | (Cat. No. 130-091-224) | |
| Commercial assay or kit | CD3e Microbead Kit, Mouse | Miltenyi-Biotec | (Cat. No. 130-094-973) | |
| Commercial assay or kit | Invitrogen SuperScript IV First-Strand Synthesis System | Invitrogen | (Cat. No. 18091050) | |
| Commercial assay or kit | iTaq Universal SYBR Green Supermix; BioRad | Bio Rad | (Cat. No. 172–5121) | |
| Peptide, recombinant protein | Recombinant Mouse IL-2 | Biolegend | (Cat. No. 575404) | |
| Sequence-based reagent | Nucleoprotein (NP) Forward primer | IDT | NP F1 | 5'-GGGTGAGAATGGACGAAAAAC-3' |
| Sequence-based reagent | Nucleoprotein (NP) Reverse primer | IDT | NP R1 | 5'-GATCCATCATTGCTTTTTGTGCA-3' |
| Software, algorithm | ClustVis | Metsalu and Vilo, 2015 | ClustVis | RRID:SCR_017133 |
| Strain, strain background (Mus musculus) | KRT18-CreERT2: Rosa26-lox-STOP-lox-TdTomato | This paper | Tamoxifen-inducible Cre system | |
| Strain, strain background (Mus musculus) | C57Bl/6J | The Jackson Laboratory | Strain #000664 | Wildtype mouse line – CD45.2RRID:IMSR_JAX:000664 |
| Strain, strain background (Mus musculus) | B6.SJL-Ptprca Pepcb/BoyJ | The Jackson Laboratory | Strain #002014 | C57Bl/6J congenic strain - CD45.1RRID:IMSR_JAX:002014 |
| Strain, strain background (Streptococcus pyogenes) | Group A Streptococcus | clinical isolate | MGAS315, emm3 genotype, Serotype M3 | |
| Strain, strain background (Orthomyxoviridae, influenza virus A) | Influenza A virus | ATCC | PR8 H1N1 | |
| Commercial assay or kit | CellTrace Violet Cell Proliferation Kit, for flow cytometry | Invitrogen | (Cat. No. C34571) |
Additional files
Download links
A two-part list of links to download the article, or parts of the article, in various formats.
Downloads (link to download the article as PDF)
Open citations (links to open the citations from this article in various online reference manager services)
Cite this article (links to download the citations from this article in formats compatible with various reference manager tools)
Hematopoietic stem and progenitor cells improve survival from sepsis by boosting immunomodulatory cells
eLife 11:e74561.
https://doi.org/10.7554/eLife.74561


