KDM6B interacts with TFDP1 to activate P53 signaling in regulating mouse palatogenesis
- Center for Craniofacial Molecular Biology, Herman Ostrow School of Dentistry, University of Southern California, United States
Figures
Figure 1 with 3 supplements

Loss of Kdm6b in cranial neural crest (CNC)-derived cells results in cleft palate.
(A, B) Whole-mount oral view shows complete cleft palate phenotype in Wnt1Cre;Kdm6bfl/fl mice. Arrowhead in (B) indicates the cleft palate. Scale bar: 2 mm. (C, D) CT imaging reveals that the palatine process of the maxilla and palatine bone (PB) is missing in Wnt1Cre;Kdm6bfl/fl mice. White arrowheads in (C) indicate the palatine process of maxilla (PPM) in control mice, and red arrows indicate the PB. White asterisk in (D) indicates the missing PPM in Wnt1Cre;Kdm6bfl/fl mice, and red asterisk in (D) indicates the missing PB in Kdm6b mutant mice. Scale bars: 1 mm. (E, F) Sagittal views of CT images demonstrate the locations of HE sections in (G–R). Red lines indicate the locations of sections. Yellow arrow in (E) indicates palatal shelf, and yellow asterisk in (F) indicates cleft. Scale bars: 1 mm. (G–R) Histological analysis of control and Wnt1Cre;Kdm6bfl/fl mice. (H, J, L, N, P, R) are magnified images of boxes in (G, I, K, M, O, Q), respectively. Asterisks in (M, O, Q) indicate cleft in Kdm6b mutant mice. Scale bar: 200 µm. Mes: mesenchyme.
Figure 1—figure supplement 1
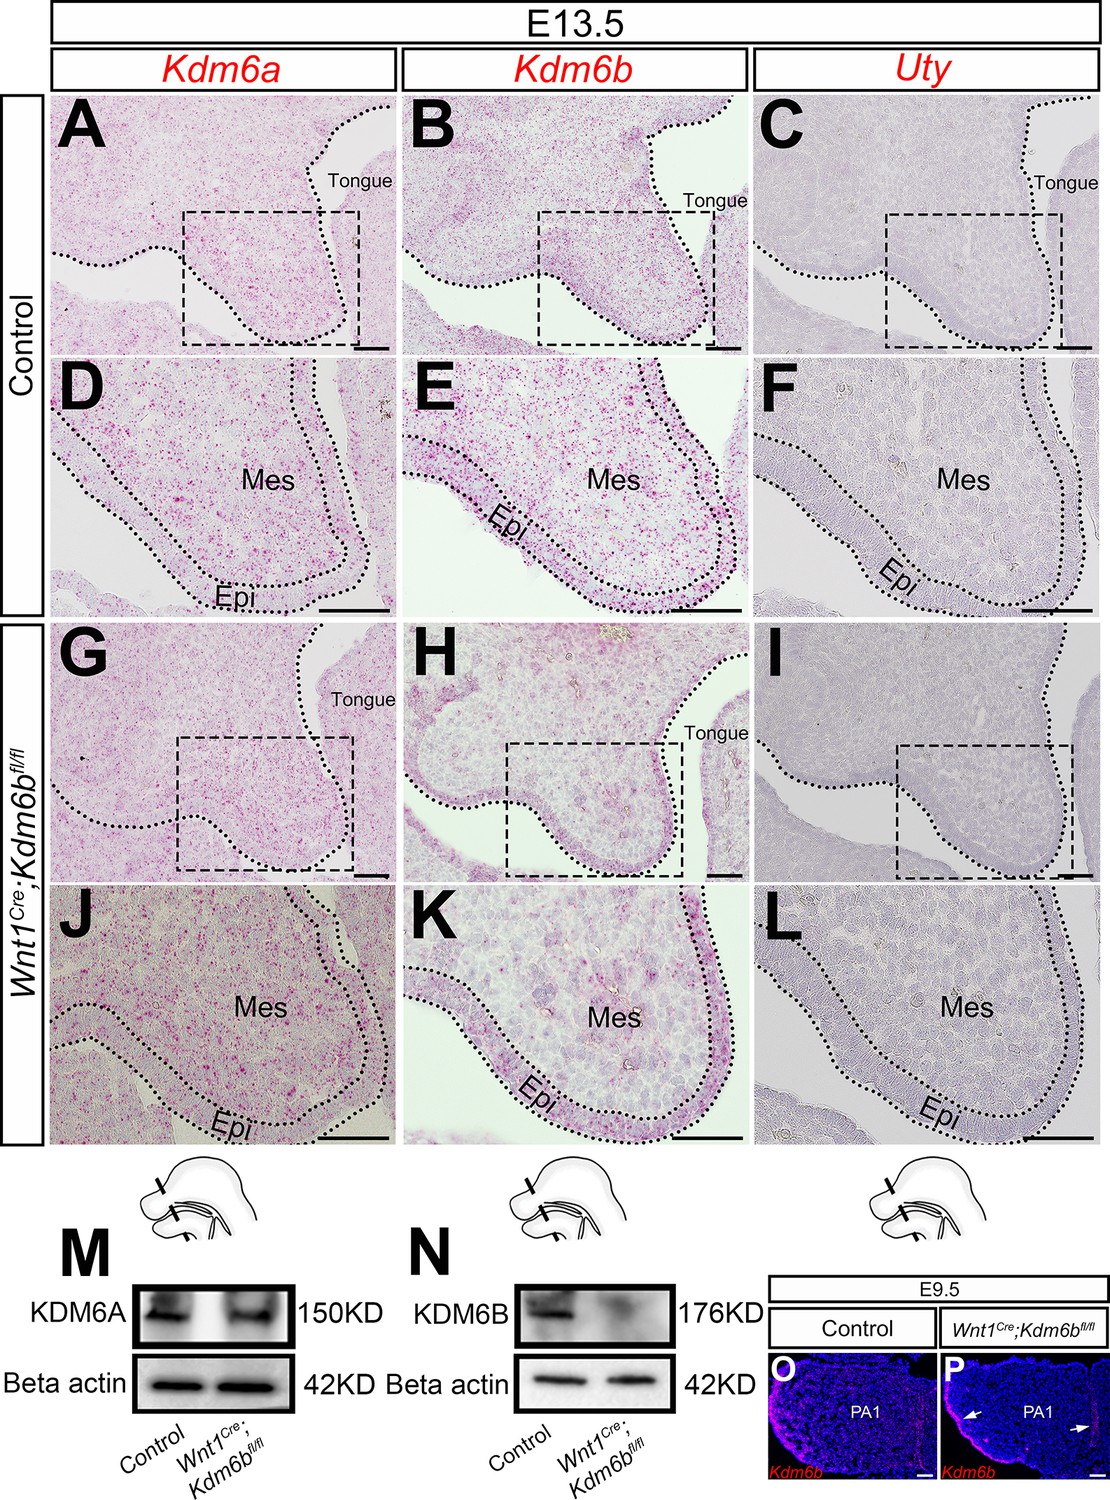
Expression of KDM6 family.
(A–L) Expression of KDM6 family genes in the palatal region at E13.5 using RNAscope in situ hybridization. (D–F, J–L) are magnified images of boxes in (A–C, G–I), respectively. Dotted lines in (A–C, G–I) indicate region of palatal shelf (PS). Dotted lines in (D–F, J–L) indicate epithelium (Epi). Schematic drawing at the bottom of the figure indicates the location of the presented section. Scale bar: 50 µm. Mes: mesenchyme. (M, N) Protein quantification of KDM6A and KDM6B in control and Kdm6b mutant palatal region at E13.5 using Western blot. (O, P) Expression of Kdm6b in the first pharyngeal arch (PA1) at E9.5 assessed using RNAscope in situ hybridization. Arrows in (P) indicate expression of Kdm6b at epithelium. Scale bar: 50 µm.
-
Figure 1—figure supplement 1—source data 1
Source data for Figure 1—figure supplement 1M.
- https://cdn.elifesciences.org/articles/74595/elife-74595-fig1-figsupp1-data1-v2.zip
-
Figure 1—figure supplement 1—source data 2
Source data for Figure 1—figure supplement 1N.
- https://cdn.elifesciences.org/articles/74595/elife-74595-fig1-figsupp1-data2-v2.zip
Figure 1—figure supplement 2
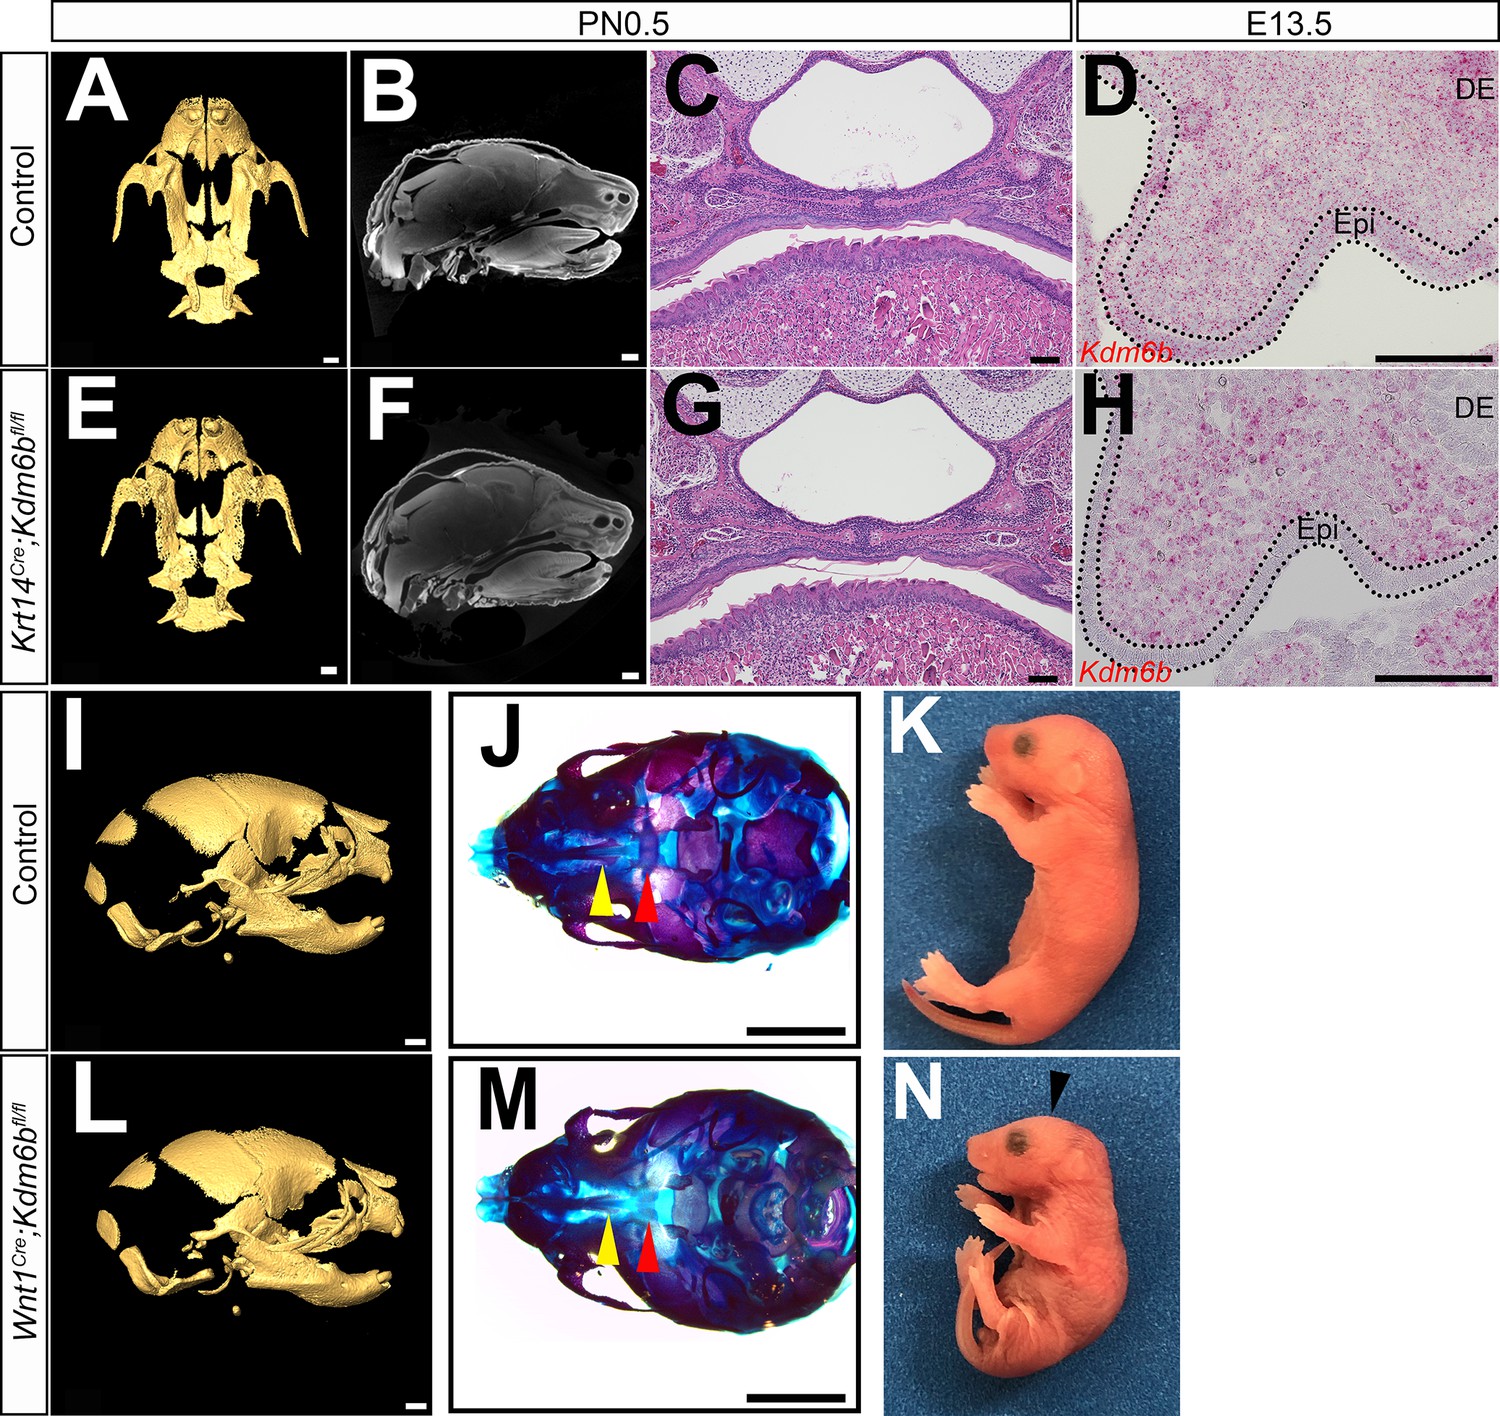
Loss of Kdm6b in epithelium (Epi) and cranial neural crest (CNC)-derived cells.
(A–C, E–G) CT images and histological analysis of Krt14Cre;Kdm6bfl/fl mice at PN0.5. Scale bars in (A, E): 0.4 mm; Scale bars in (B, F): 0.6 mm; scale bars in (C, G): 100 µm. (D, H) Expression of Kdm6b assessed using RNAscope in situ hybridization at E13.5. Kdm6b is efficiently knocked out from Epi in Krt14Cre;Kdm6bfl/fl mice. Dotted lines in (D, H) indicate Epi. Scale bar: 100 µm. DE: dental epithelium. (I–N) No obvious phenotype was observed in skull bones or mandible in Wnt1Cre;Kdm6bfl/fl mice at PN0.5. Yellow triangles in (J, M) indicate the location of palatine process of maxilla, and red triangle indicates the location of palatine bone. Arrowhead in (N) indicates flattened skull observed in Wnt1Cre;Kdm6bfl/fl mice. Scale bars in (I, L): 0.6 mm; scale bars in (J, M): 1 mm.
Figure 1—figure supplement 3
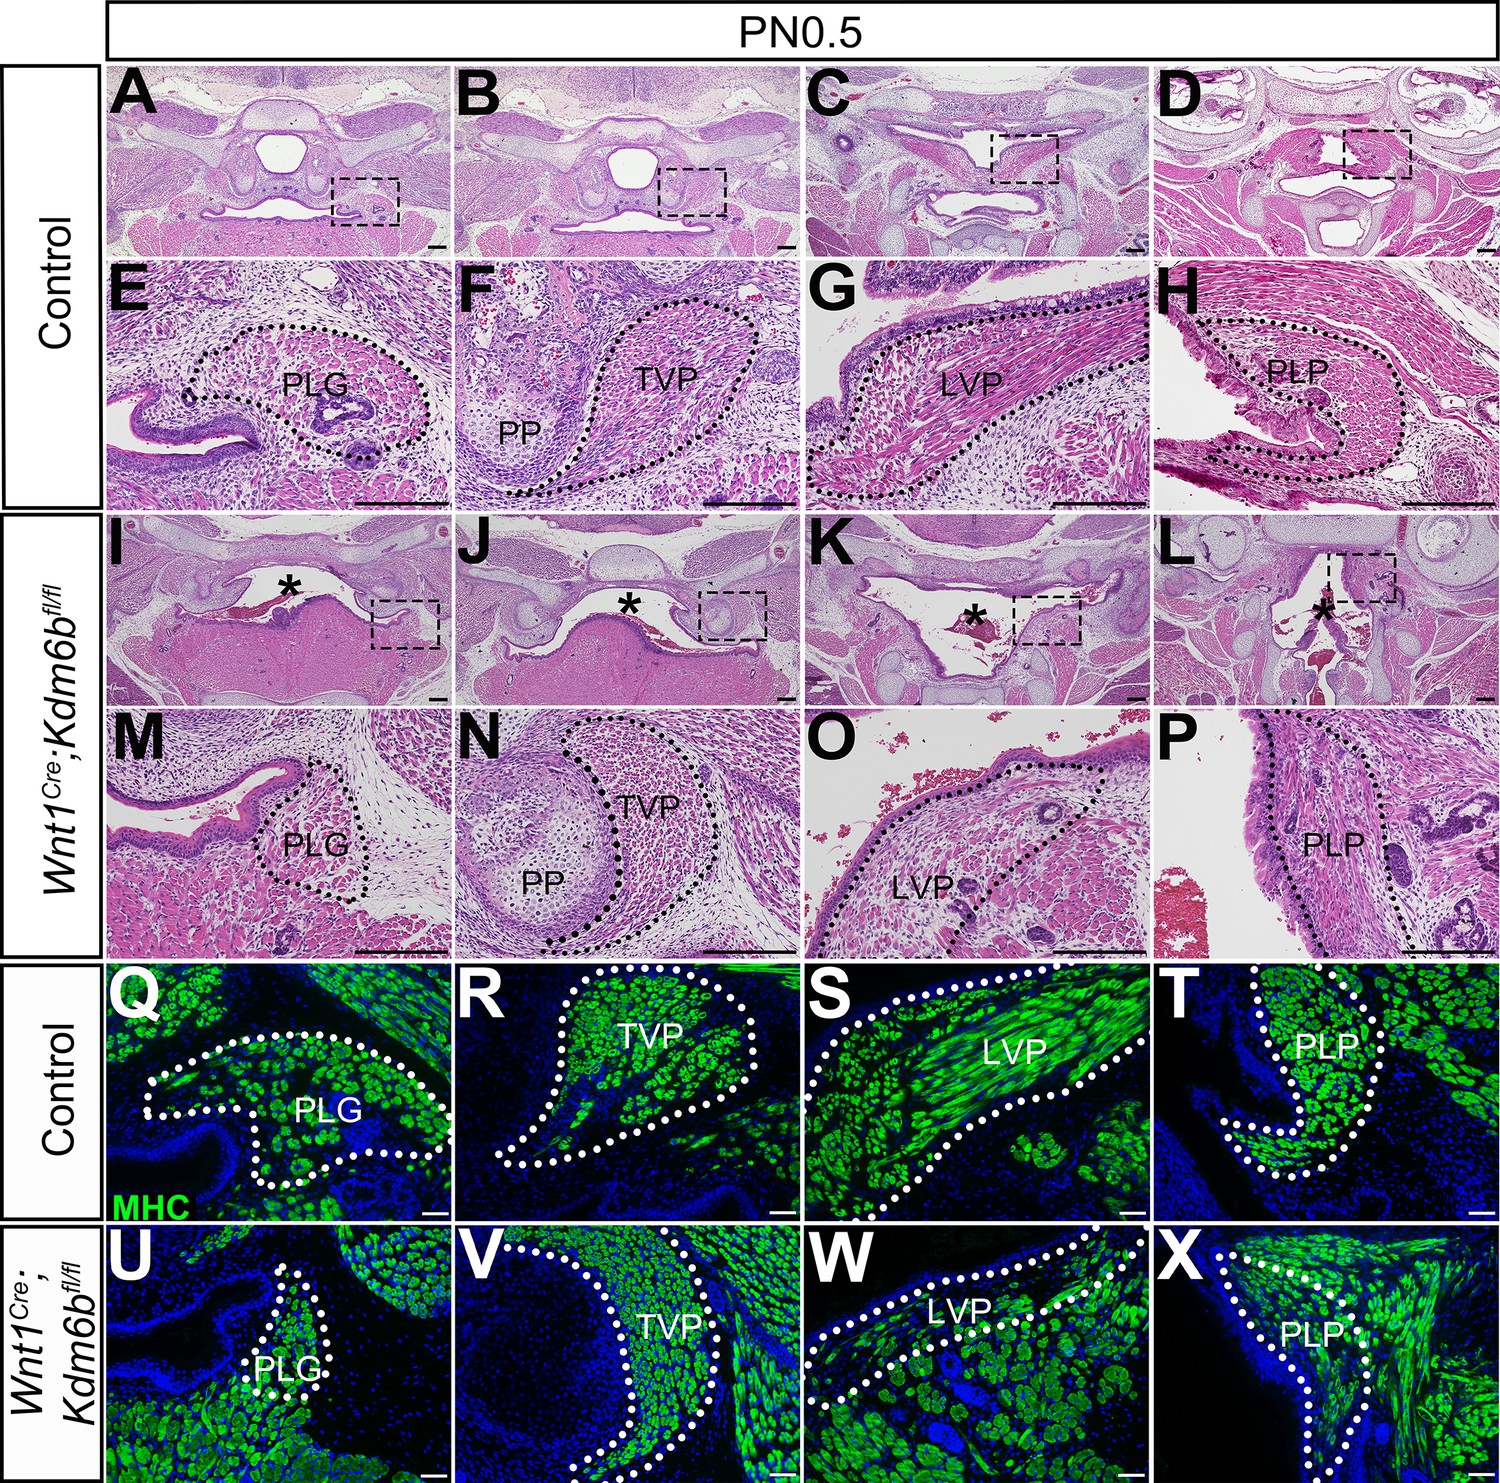
Loss of Kdm6b in cranial neural crest (CNC)-derived cells results in soft palate muscle defects.
(A–P) Histological analysis of soft palate muscles at PN0.5. Boxes in (A–D, I–L) are shown magnified in (E–H, M–P), respectively. Dotted lines outline each muscle. Asterisks in (I–L) indicate cleft palate observed in Wnt1Cre;Kdm6bfl/fl mice. PP: pterygoid plate; PLG: palatoglossus; TVP: tensor veli palatini; LVP: levator veli palatini; PLP: palatopharyngeus. Scale bar: 100 µm. Asterisks in (I–L) indicate cleft in Wnt1Cre;Kdm6bfl/fl mice. (Q–X) Immunostaining of MHC at PN0.5. Dotted lines outline each muscle. Scale bar: 50 µm.
Figure 2 with 1 supplement
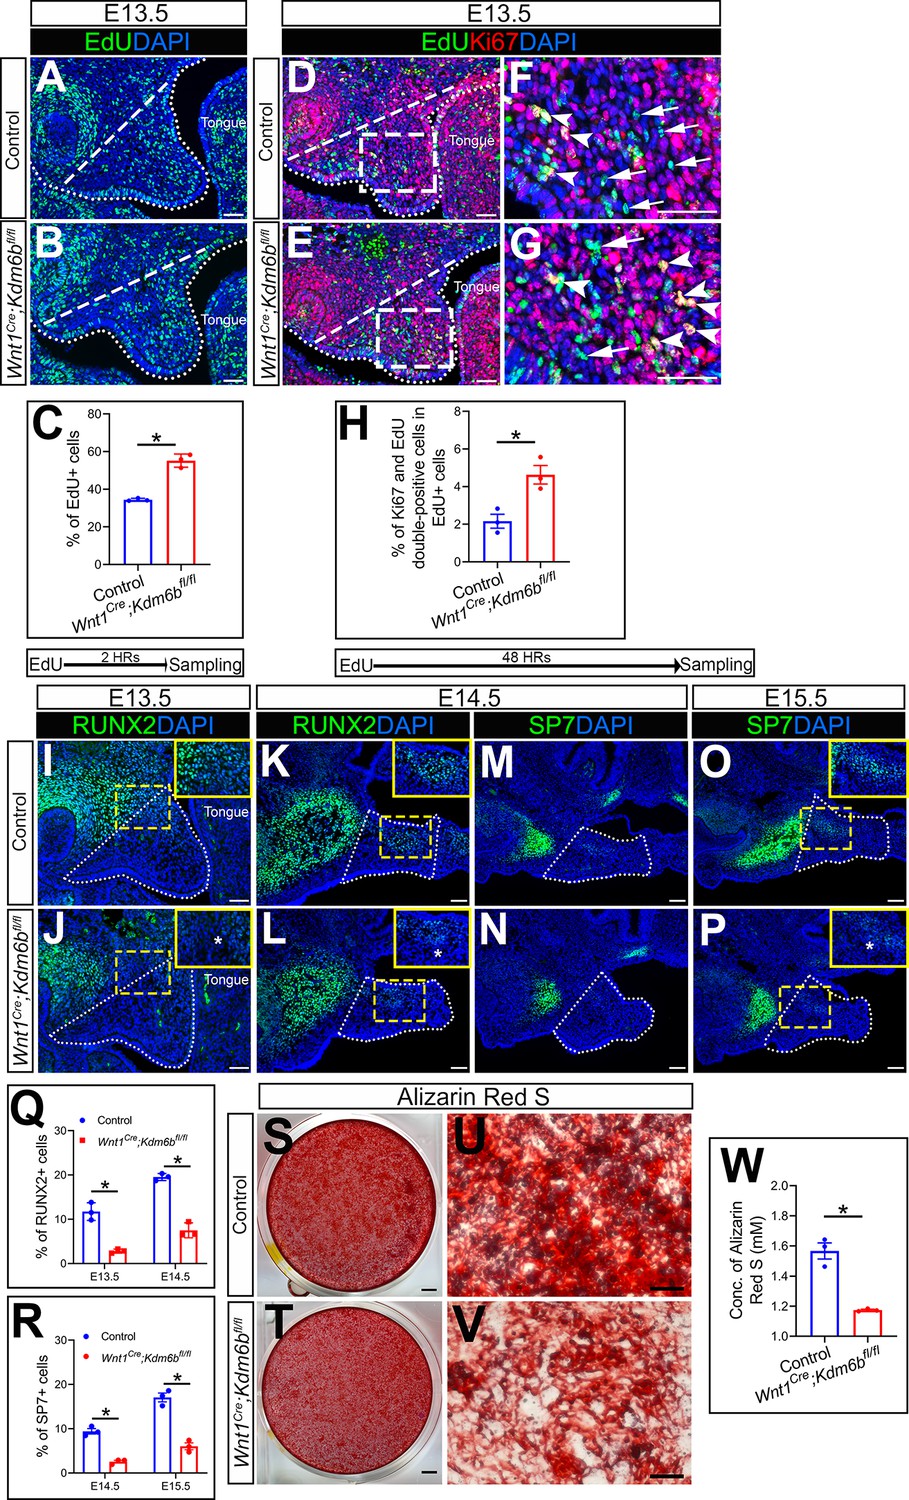
Kdm6b is critical for proliferation and differentiation of cranial neural crest (CNC)-derived palatal mesenchyme cells.
(A, B) Immunostaining of EdU at E13.5 after 2 hr of EdU labeling. Dotted lines indicate palatal shelf region. Dashed lines indicate the palatal region used for quantification in (C). Scale bar: 50 µm. (C) Quantification of EdU+ cells represented in (A, B). *p<0.05. (D–G) Co-localization of EdU and Ki67 at E13.5 after 48 hr of EdU labeling. Dotted lines indicate palatal shelf region. Dashed lines indicate the palatal region used for quantification in (H). (F, G) are magnified images of boxes in (D, E). Arrows in (F, G) indicate representative cells that are only EdU+, while arrowheads indicate representative cells that are positive for both EdU and Ki67. Scale bar: 50 µm. (H) Quantification of EdU and Ki67 double-positive cells represented in (D, E). *p<0.05. (I–L) Immunostaining of RUNX2 at indicated stages. Insets are higher-magnification images of boxes in (I–L). Asterisks in (J, L) indicate decreased RUNX2+ cells observed in Wnt1Cre;Kdm6bfl/fl mice. Scale bar: 50 µm. White dotted lines indicate the palatal region used for quantification in (Q). (M–P) Immunostaining of SP7 at indicated stages. Insets are higher-magnification images of boxes in (O, P). Asterisk in (P) indicates decreased SP7+ cells observed in Wnt1Cre;Kdm6bfl/fl mice. Scale bar: 50 µm. White dotted lines indicate the palatal region used for quantification in (R). (Q, R) Quantification results for RUNX2+ and SP7+ cells represented in (I–P). *p<0.05. (S–W) Osteogenic differentiation assay using Alizarin red S staining. (W) is the quantification result of Alizarin red S staining represented in (S, T). Scale bars: 2 mm in (S, T); 200 µm in (U, V). *p<0.05.
-
Figure 2—source data 1
Source data for Figure 2C.
- https://cdn.elifesciences.org/articles/74595/elife-74595-fig2-data1-v2.xlsx
-
Figure 2—source data 2
Source data for Figure 2H.
- https://cdn.elifesciences.org/articles/74595/elife-74595-fig2-data2-v2.xlsx
-
Figure 2—source data 3
Source data for Figure 2Q.
- https://cdn.elifesciences.org/articles/74595/elife-74595-fig2-data3-v2.xlsx
-
Figure 2—source data 4
Source data for Figure 2R.
- https://cdn.elifesciences.org/articles/74595/elife-74595-fig2-data4-v2.xlsx
-
Figure 2—source data 5
Source data for Figure 2W.
- https://cdn.elifesciences.org/articles/74595/elife-74595-fig2-data5-v2.xlsx
Figure 2—figure supplement 1
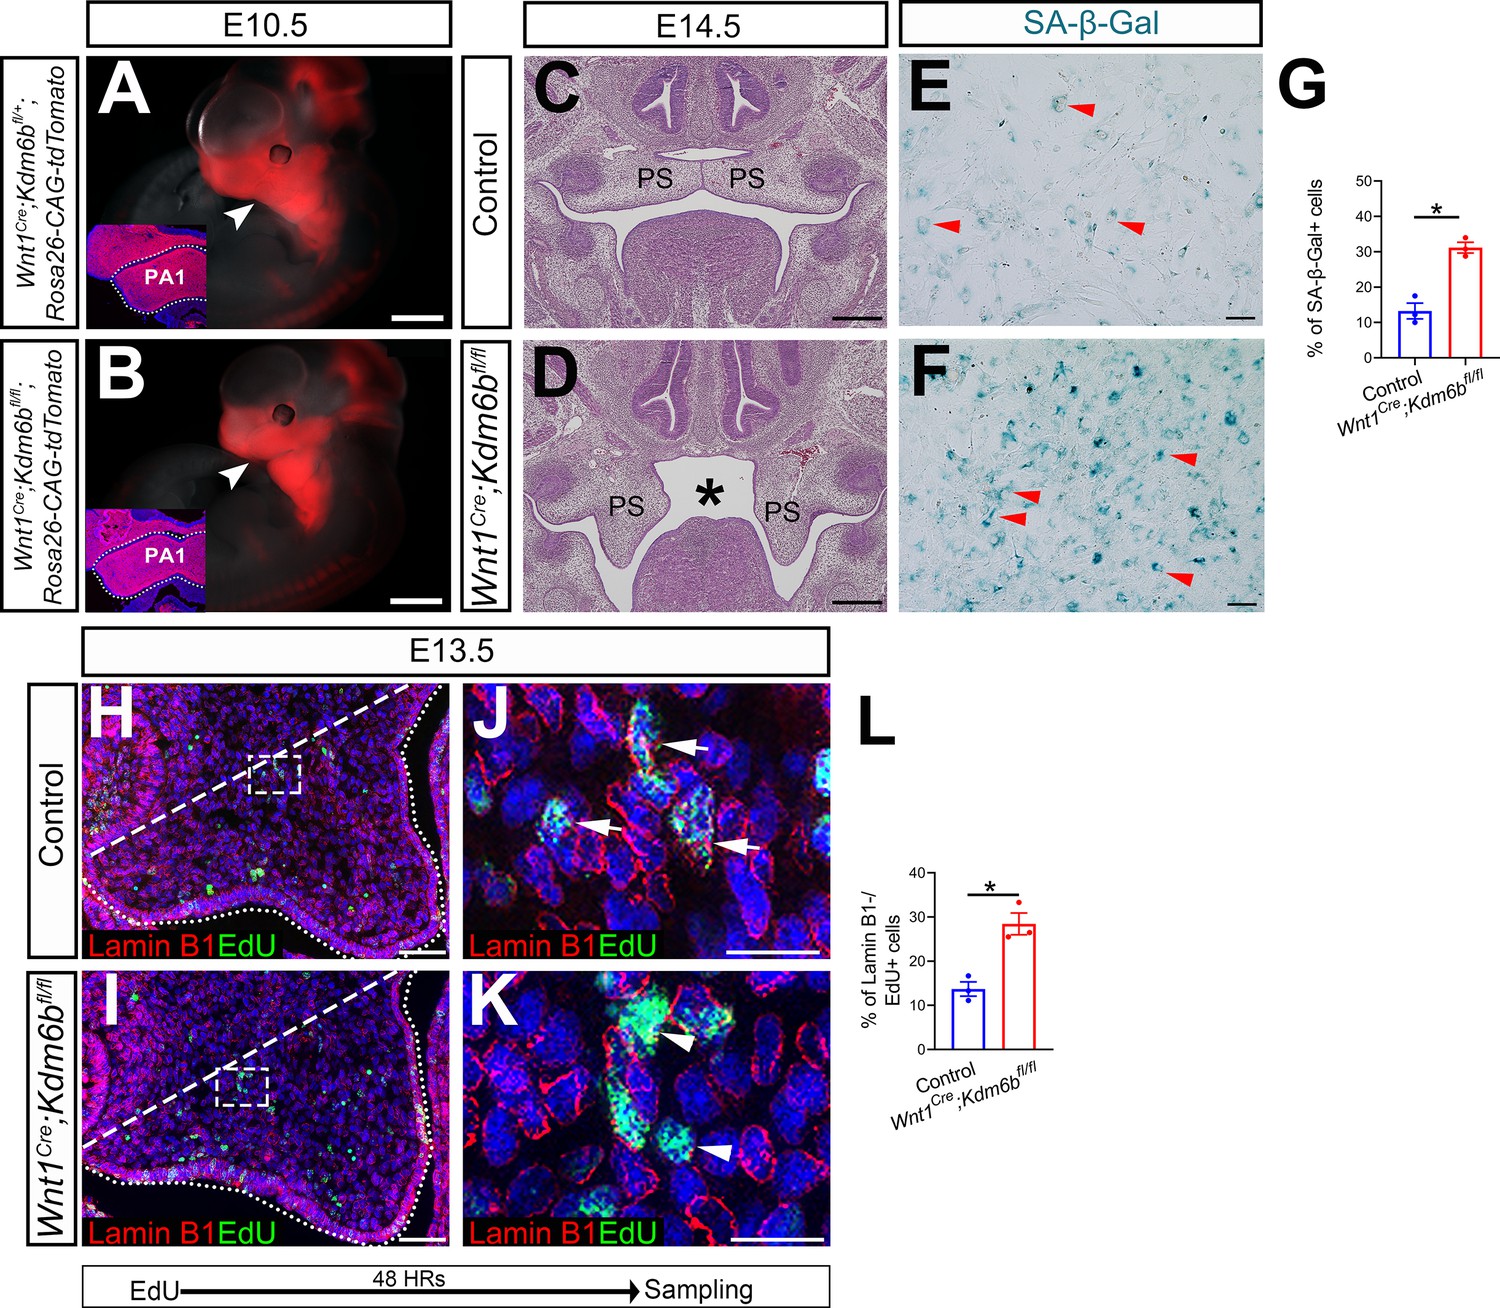
Kdm6b is not required for cranial neural crest cells (CNCCs) to populate pharyngeal arches but is critical for survival of palatal mesenchymal cells.
(A, B) Whole-mount images of tdTomato reporter mice at E10.5. Arrowheads indicate CNCCs that have successfully migrated to the pharyngeal arch at E10.5. No differences were observed between control and Wnt1Cre;Kdm6bfl/fl mutant mice. Insets show immunostaining of tdTomato at E10.5. Dotted lines in the insets indicate first pharyngeal arch (PA1). Scale bars: 1 mm. (C, D) Histological analysis of samples at E14.5. Asterisk in (D) indicates cleft palate observed in Wnt1Cre;Kdm6bfl/fl mice. Scale bar: 100 µm. (E, F) Senescence β-galactosidase staining using cell culture from E13.5 palatal mesenchymal cells. Arrowheads in (E, F) indicate representative β-galactosidase+ cells. Scale bar: 100 µm. (G) Quantification of senescence-associated β-galactosidase activity represented in (E, F). *p<0.05. (H–K) Co-localization of EdU and Lamin B1 at E13.5 after 48 hr of EdU labeling. Dotted lines indicate palatal shelf region. Dashed lines indicate the palatal region used for quantification in (L). (J, K) are magnified images of boxes in (H, I), respectively. Arrows in (J) indicate representative cells that are positive for both Lamin B1 and EdU, while arrowheads in (K) indicate representative cells that are EdU positive and Lamin B1 negative. Scale bar: 50 µm in (H, I), 25 µm in (J, K). (L) Quantification of cells that are EdU positive and Lamin B1 negative represented in (H, I). *p<0.05.
-
Figure 2—figure supplement 1—source data 1
Source data for Figure 2—figure supplement 1G.
- https://cdn.elifesciences.org/articles/74595/elife-74595-fig2-figsupp1-data1-v2.xlsx
-
Figure 2—figure supplement 1—source data 2
Source data for Figure 2—figure supplement 1L.
- https://cdn.elifesciences.org/articles/74595/elife-74595-fig2-figsupp1-data2-v2.xlsx
Figure 3
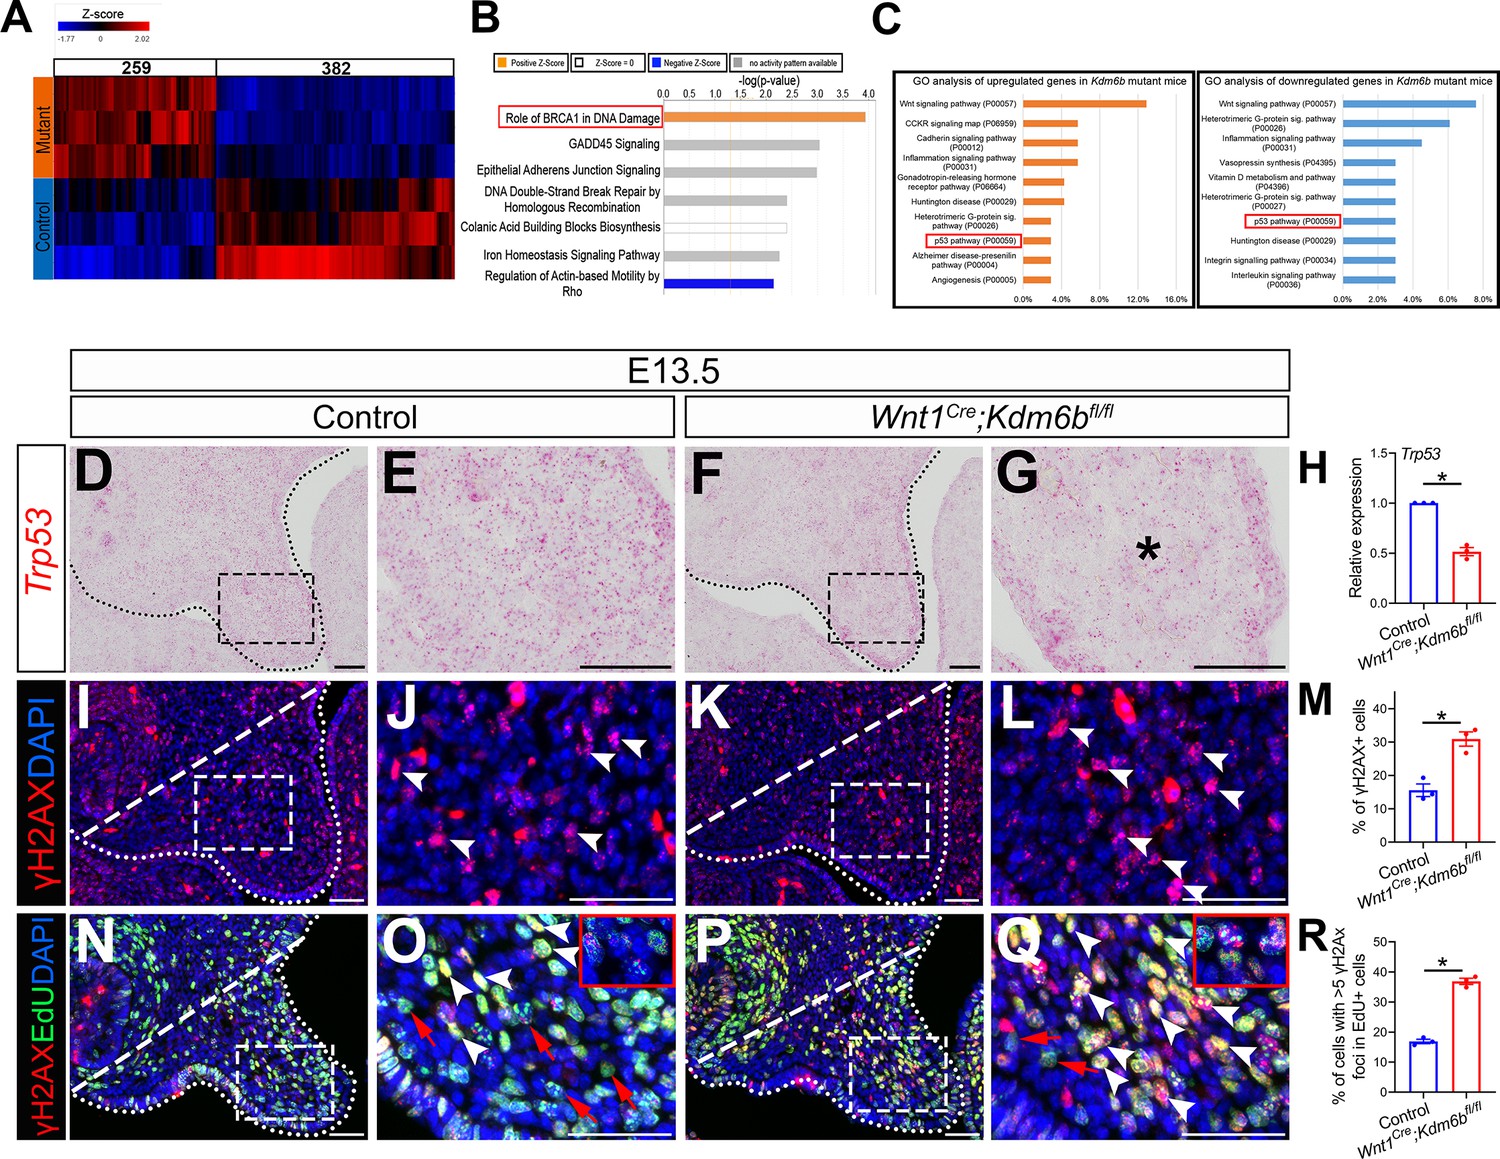
P53 signaling pathway is disturbed in Wnt1Cre;Kdm6bfl/fl mice.
(A) Bulk RNA-seq of palatal tissues collected at E12.5 represented in heatmap. Differentially expressed genes were selected using p<0.05 and fold change <–1.2 or >1.2. (B) Top seven signaling pathways disturbed in Kdm6b mutant mice, identified by Ingenuity Pathway Analysis. Red box indicates the top upregulated pathway observed in Wnt1Cre;Kdm6bfl/fl sample. (C) Top 10 signaling pathways identified by Gene Ontology analysis using differentially expressed genes identified by bulk RNA-seq analysis. Red box indicates P53 signaling is one of the top 10 pathways. X-axis shows the percentage of genes hit against total number of pathways hit. (D–G) Expression of Trp53 at E13.5 using RNAscope in situ hybridization. Dotted lines in (D, F) indicate palatal shelf. (E, G) are magnified images of boxes in (D, F). Asterisk in (G) indicates decreased expression of Trp53 observed in Wnt1Cre;Kdm6bfl/fl mice. Scale bar: 50 µm. (H) RT-qPCR quantification of Trp53 in palatal tissues collected at E13.5. *p<0.05. (I–L) Immunostaining of γH2AX at E13.5. Dotted lines in (I, K) indicate palatal shelf and dashed lines indicate quantification area. (J, L) are magnified images of boxes in (I, K), respectively. Arrowheads in (J, L) indicate representative γH2AX+ cells. Scale bar: 50 µm. (M) Quantification of γH2AX+ cells represented in (I, K). *p<0.05. (N–Q) Co-localization of EdU and γH2AX at E13.5 after 2 hr of EdU labeling. Dotted lines in (N, P) indicate palatal shelf region, while dashed lines indicate the palatal region used for quantification in (R). (O, Q) are magnified images of boxes in (N, P), respectively. Red arrows in (O, Q) indicate representative EdU+ cells with less than five γH2AX foci, while white arrowheads indicate representative cells that are positive for EdU and with greater than five γH2AX foci. Scale bar: 50 µm. (R) Quantification of EdU+ cells with greater than five γH2AX foci represented in (N, P).*p<0.05.
-
Figure 3—source data 1
Source data for Figure 3H.
- https://cdn.elifesciences.org/articles/74595/elife-74595-fig3-data1-v2.xlsx
-
Figure 3—source data 2
Source data for Figure 3M.
- https://cdn.elifesciences.org/articles/74595/elife-74595-fig3-data2-v2.xlsx
-
Figure 3—source data 3
Source data for Figure 3R.
- https://cdn.elifesciences.org/articles/74595/elife-74595-fig3-data3-v2.xlsx
Figure 4 with 1 supplement
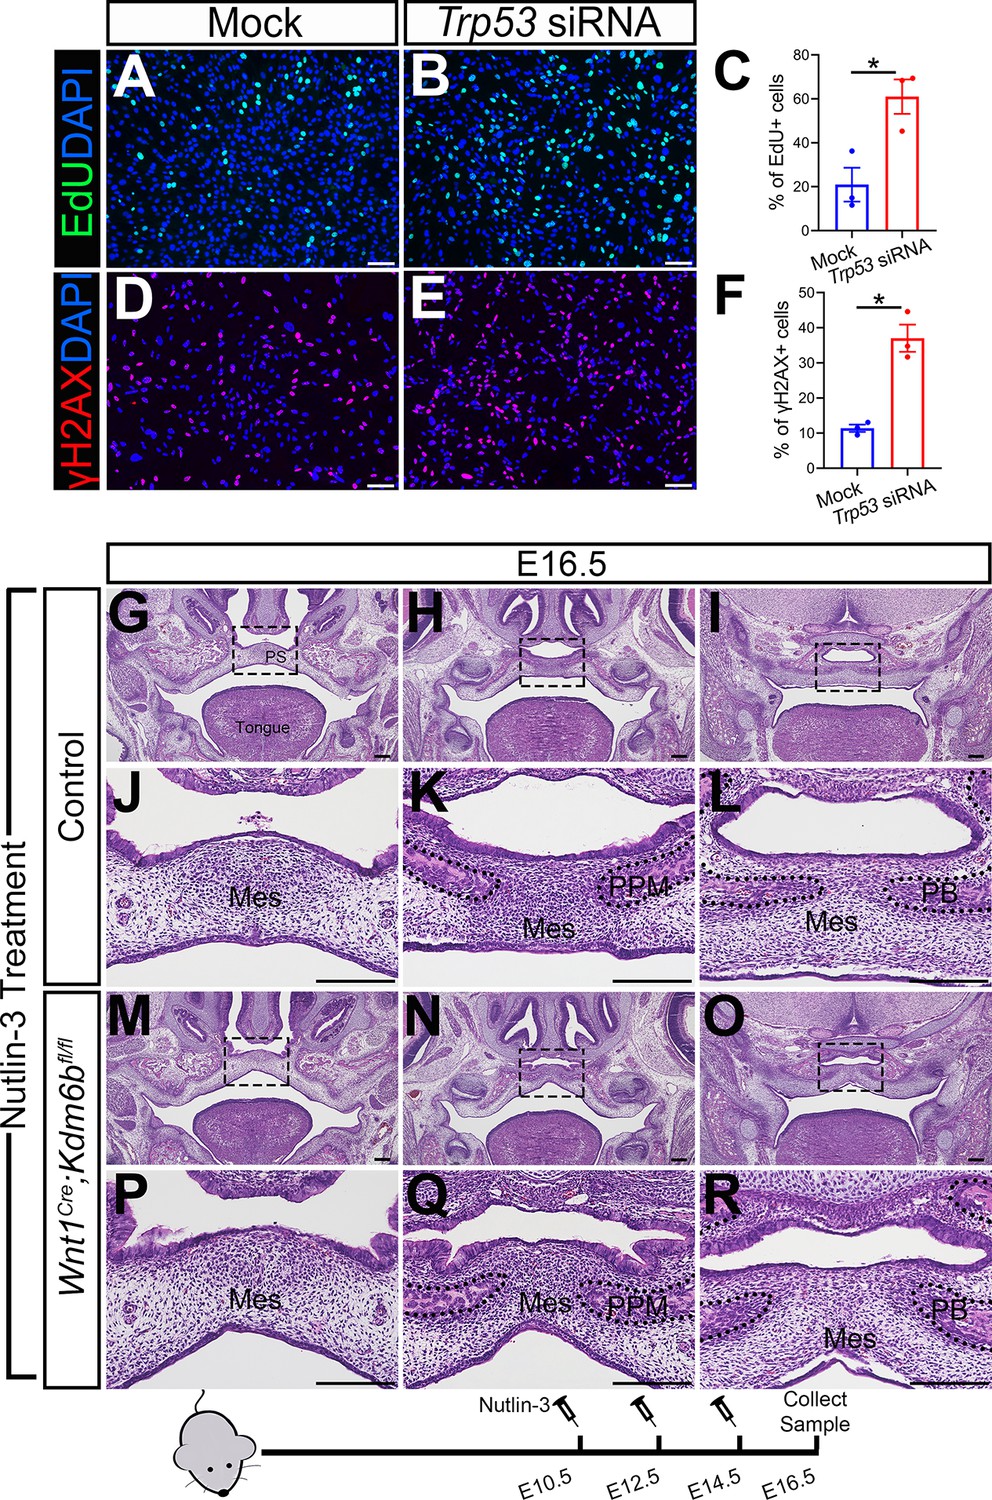
Altered Trp53 expression is responsible for the developmental defects in Wnt1Cre;Kdm6bfl/fl mice.
(A–C) Cells collected from E13.5 palatal tissue are transfected with siRNA to knock down expression of Trp53. Cell proliferation is evaluated using EdU labeling 3 days after transfection. (A, B) show proliferation of cells assessed by EdU labeling. Difference in EdU+ cells between mock- and siRNA-transfected groups is quantified in (C). Scale bar: 100 µm. *p<0.05. (D–F) Cells collected from E13.5 palatal tissue are transfected with siRNA to knock down expression of Trp53. DNA damage is evaluated using γH2AX 3 days after transfection. (D, E) show γH2AX+ cells. Difference in γH2AX+ cells between mock- and siRNA-transfected groups is quantified in (F). Scale bar: 100 µm. *p<0.05. (G–R) Histological analysis of control and Wnt1Cre;Kdm6bfl/fl mice treated with Nutlin-3. (J–L, P–R) are magnified images of boxes in (G–I, M–O), respectively. Scale bar: 200 µm. Mes: mesenchyme; PPM: palatine process of maxilla; PB: palatine bone.
-
Figure 4—source data 1
Source data for Figure 4C.
- https://cdn.elifesciences.org/articles/74595/elife-74595-fig4-data1-v2.xlsx
-
Figure 4—source data 2
Source data for Figure 4F.
- https://cdn.elifesciences.org/articles/74595/elife-74595-fig4-data2-v2.xlsx
Figure 4—figure supplement 1
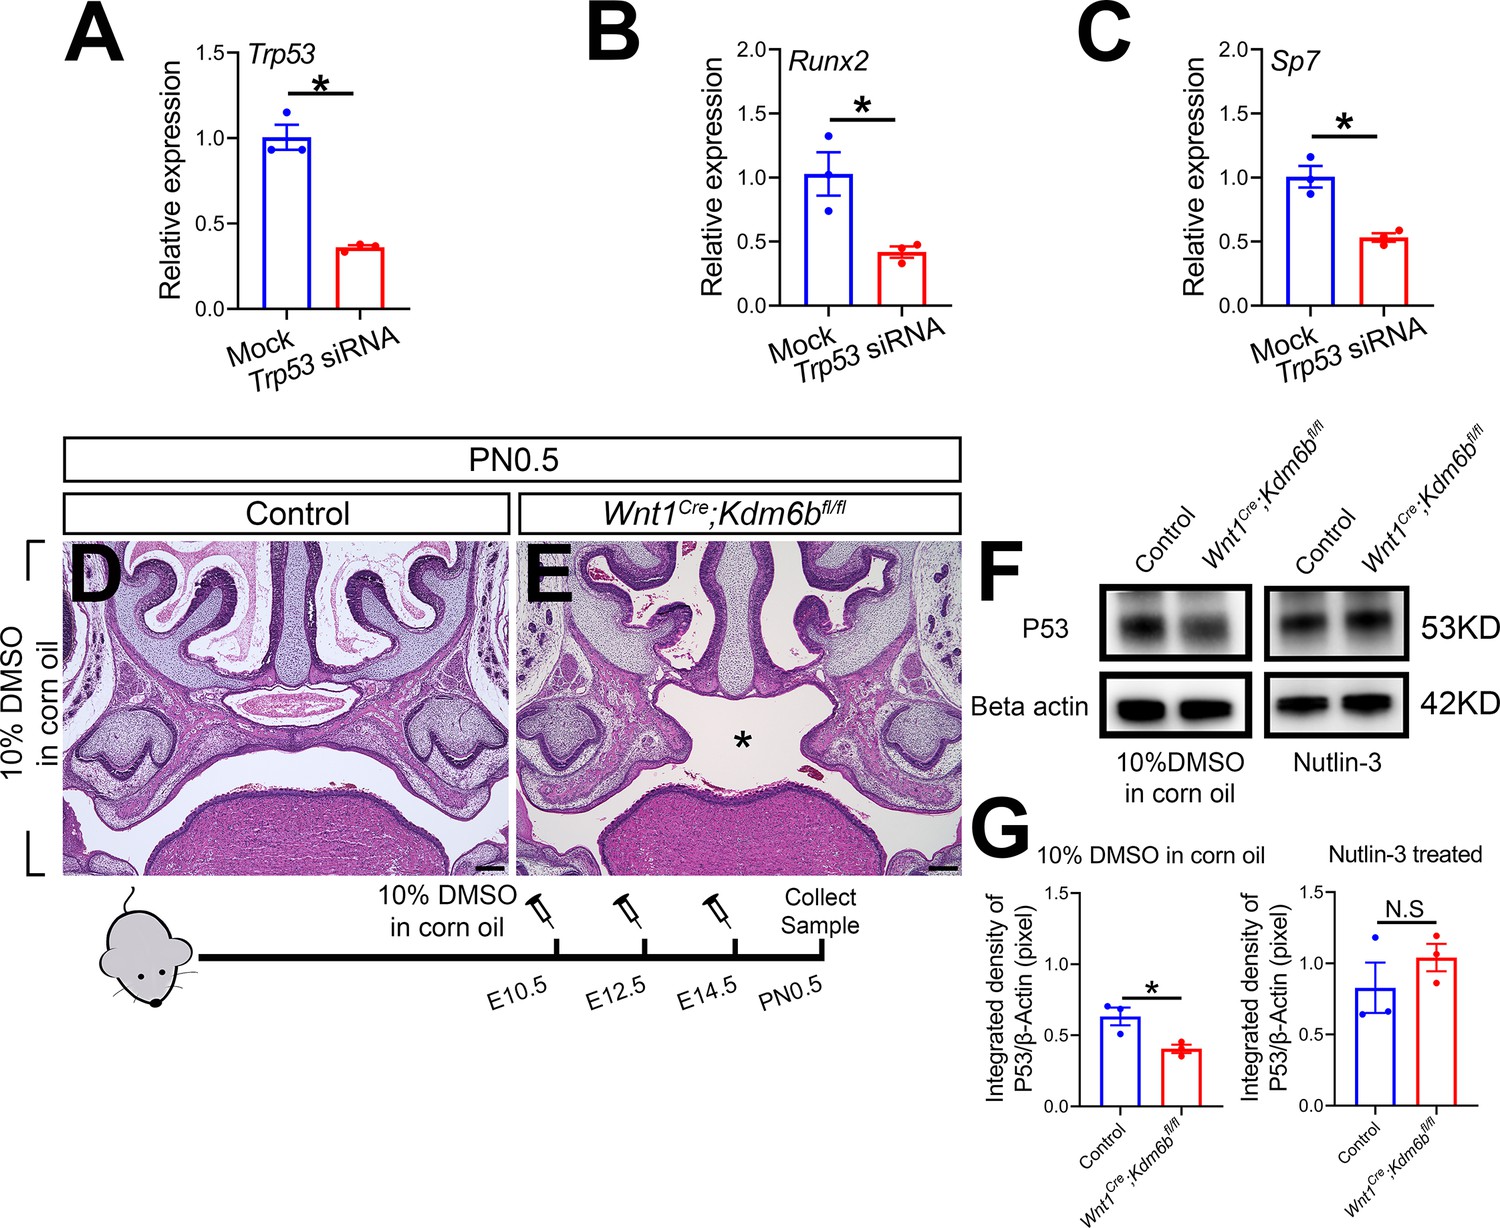
Trp53 plays a critical role in regulating palatogenesis.
(A–C) RT-qPCR analysis of Trp53, Runx2, and Sp7 expression in cells isolated from the palatal region of control mice 3 days after transfection with Trp53 siRNA. *p<0.05. (D, E) Histological analysis of samples treated with 10% DMSO in corn oil at E10.5, E12.5, and E14.5. Asterisk in (E) indicates cleft palate observed in Wnt1Cre;Kdm6bfl/fl mouse. Scale bar: 200 µm. (F) P53 protein in the palatal region quantified using Western blot. (G) Quantification of Western blot represented in (F). *p<0.05. N.S: not significant.
-
Figure 4—figure supplement 1—source data 1
Source data for Figure 4—figure supplement 1A.
- https://cdn.elifesciences.org/articles/74595/elife-74595-fig4-figsupp1-data1-v2.xlsx
-
Figure 4—figure supplement 1—source data 2
Source data for Figure 4—figure supplement 1B.
- https://cdn.elifesciences.org/articles/74595/elife-74595-fig4-figsupp1-data2-v2.xlsx
-
Figure 4—figure supplement 1—source data 3
Source data for Figure 4—figure supplement 1C.
- https://cdn.elifesciences.org/articles/74595/elife-74595-fig4-figsupp1-data3-v2.xlsx
-
Figure 4—figure supplement 1—source data 4
Source data for Figure 4—figure supplement 1F.
- https://cdn.elifesciences.org/articles/74595/elife-74595-fig4-figsupp1-data4-v2.zip
-
Figure 4—figure supplement 1—source data 5
Source data for Figure 4—figure supplement 1G.
- https://cdn.elifesciences.org/articles/74595/elife-74595-fig4-figsupp1-data5-v2.xlsx
Figure 5
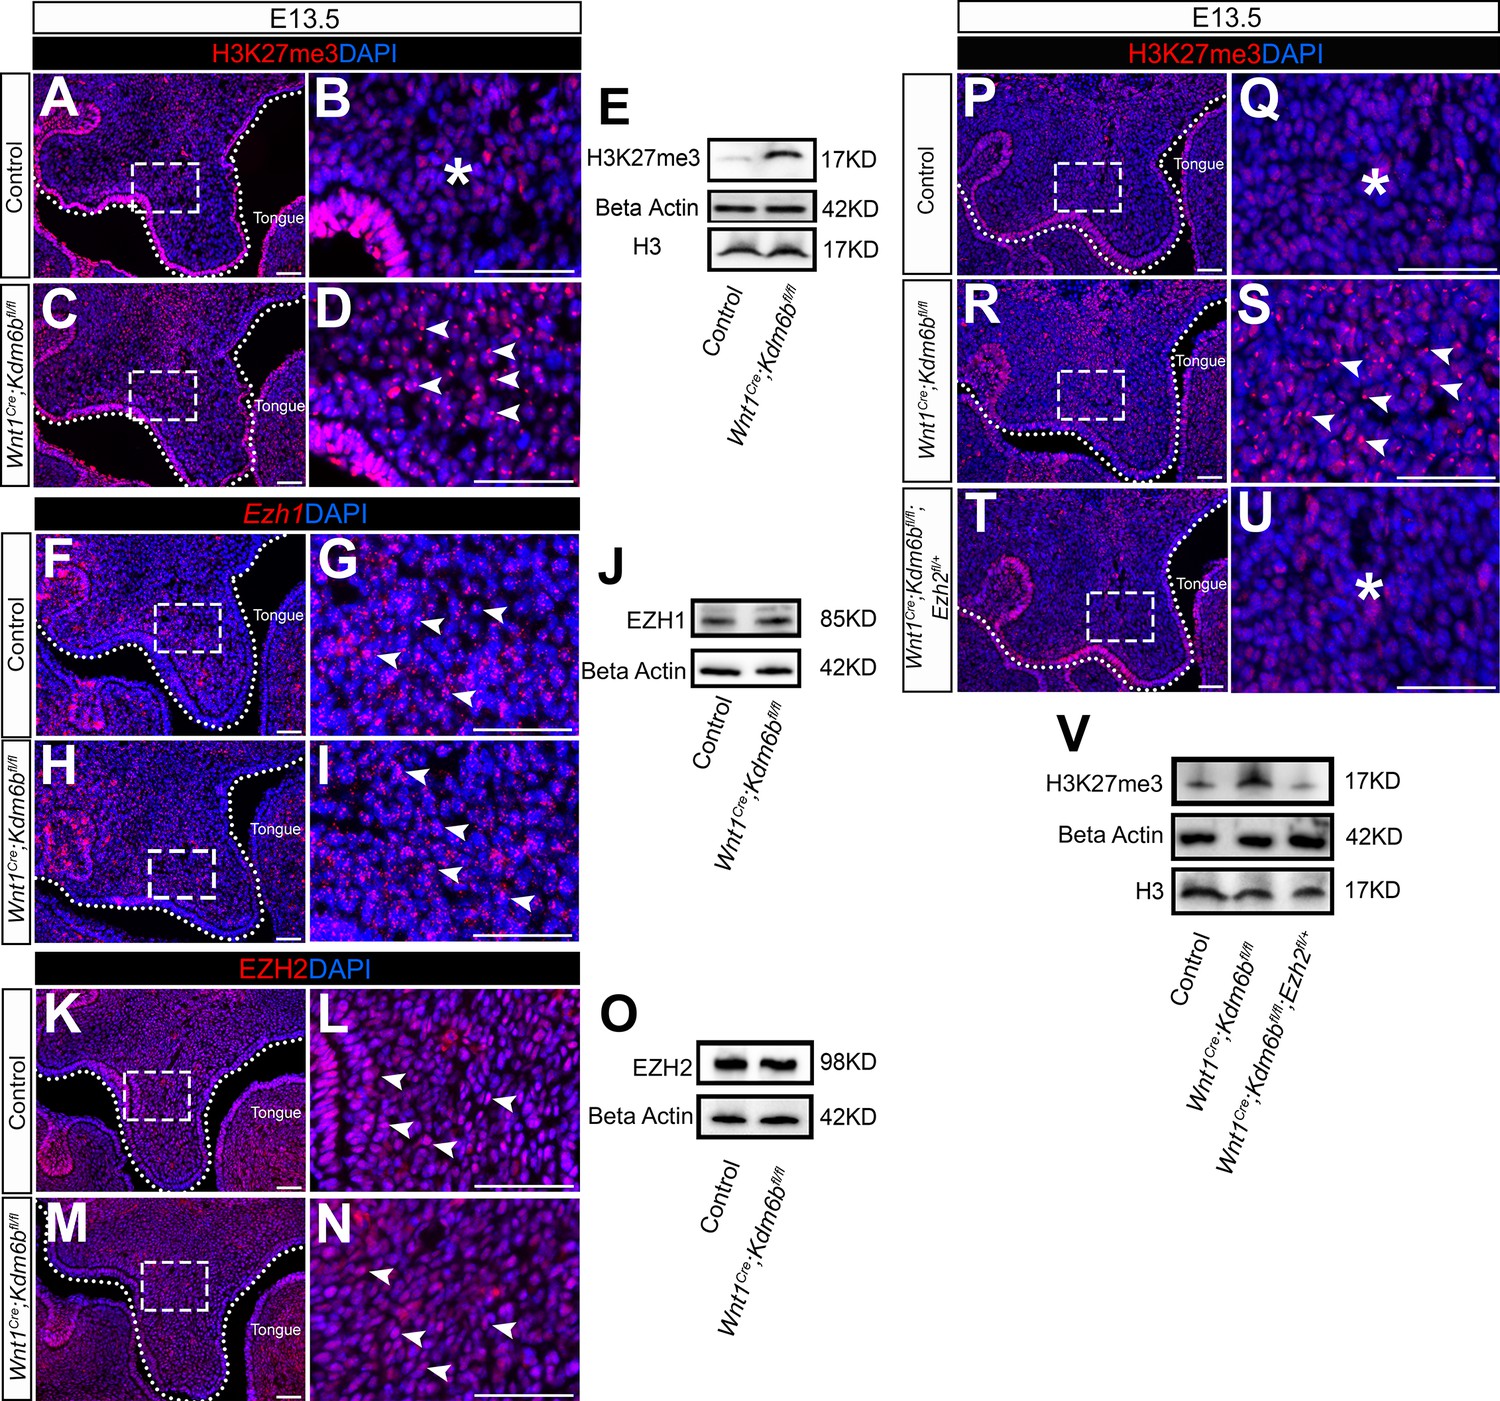
Level of H3K27me3 is antagonistically regulated by Kdm6b and Ezh2 during palatogenesis.
(A–E) Contribution of H3K27me3 in the palatal shelf is evaluated using immunostaining and Western blot at E13.5. Dotted lines in (A, C) indicate palatal shelf region. (B, D) are magnified images of boxes in (A, C). Asterisk in (B) indicates no accumulation of H3K27me3 observed in control mice. Arrowheads in (D) indicate accumulation of H3K27me3 observed in Wnt1Cre;Kdm6bfl/fl mice. Scale bar: 50 µm. (F–J) Contribution of Ezh1 in the palatal shelf is evaluated using RNAscope in situ hybridization and Western blot at E13.5. Dotted lines in (F, H) indicate palatal shelf region. (G, I) are magnified images of boxes in (F, H). Arrowheads in (G, I) indicate representative Ezh1+ cells. Scale bar: 50 µm. (K–O) Contribution of EZH2 in the palatal shelf is evaluated using immunostaining and Western blot at E13.5. Dotted lines in (K, M) indicate palatal shelf region. (L, N) are magnified images of boxes in (K, M). Arrowheads in (L, N) indicate representative EZH2+ cells. Scale bar: 50 µm. (P–V) Contribution of H3K27me3 in the palatal shelf of control mice, Kdm6b mutant mice, and EZH2 haploinsufficient model is evaluated using immunostaining and Western blot at E13.5. Dotted lines in (P, R, T) indicate palatal shelf region. (Q, S, U) are magnified images of boxes in (P, R, T), respectively. Asterisks in (Q, U) indicate no accumulation of H3K27me3 observed in control (Q) and Wnt1Cre;Kdm6bfl/fl;Ezh2fl/+ mice (U). White arrowheads in (S) indicate accumulation of H3K27me3 observed in Wnt1Cre;Kdm6bfl/fl mice. Scale bar: 50 µm.
-
Figure 5—source data 1
Source data for Figure 5E.
- https://cdn.elifesciences.org/articles/74595/elife-74595-fig5-data1-v2.zip
-
Figure 5—source data 2
Source data for Figure 5J.
- https://cdn.elifesciences.org/articles/74595/elife-74595-fig5-data2-v2.zip
-
Figure 5—source data 3
Source data for Figure 5O.
- https://cdn.elifesciences.org/articles/74595/elife-74595-fig5-data3-v2.zip
-
Figure 5—source data 4
Source data for Figure 5V.
- https://cdn.elifesciences.org/articles/74595/elife-74595-fig5-data4-v2.zip
Figure 6
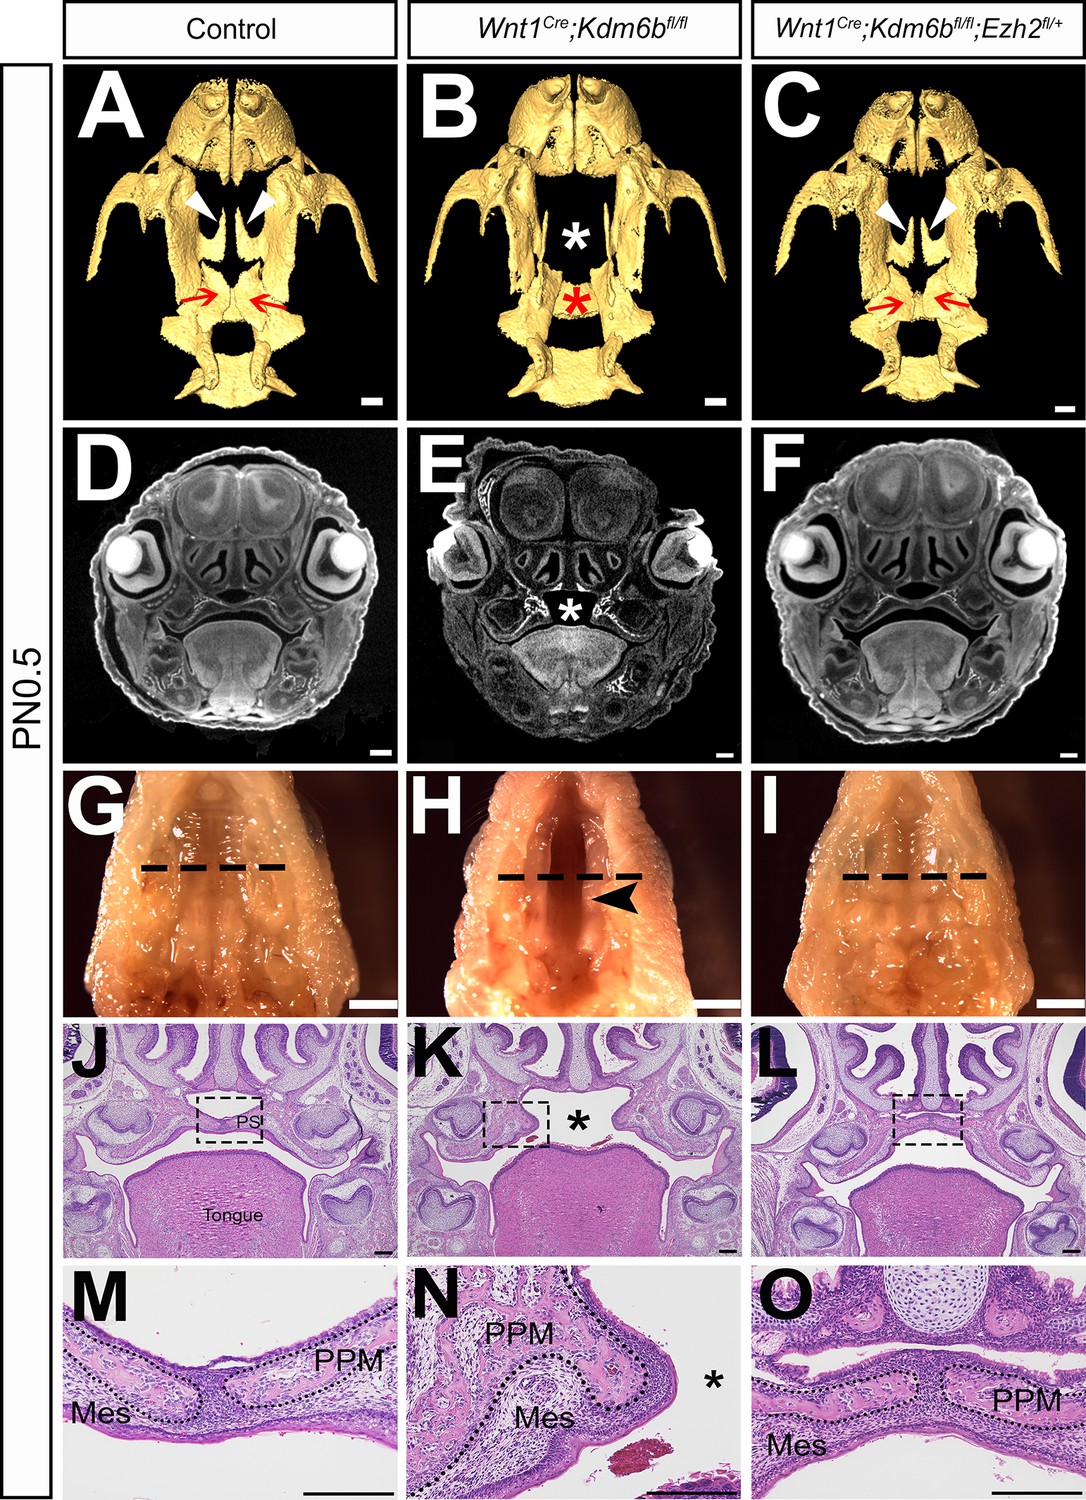
Haploinsufficiency of Ezh2 rescues cleft palate in Wnt1Cre;Kdm6bfl/fl;Ezh2fl/+ mice.
(A–C) CT images at PN0.5. White arrowheads in (A, C) indicate palatine process of maxilla (PPM) observed in control and Wnt1Cre;Kdm6bfl/fl;Ezh2fl/+ rescue model. Red arrows in (A, C) indicate palatine bone observed in control and Wnt1Cre;Kdm6bfl/fl;Ezh2fl/+ rescue model. White asterisk in (B) indicates missing palate PPM in Wnt1Cre;Kdm6bfl/fl mice, and red asterisk indicates missing palatine bone in Kdm6b mutant mice. Scale bar: 0.4 mm. (D–F) Coronal views of CT images at PN0.5. Asterisk in (E) indicates cleft palate observed in Wnt1Cre;Kdm6bfl/fl mice. Scale bar: 0.3 mm. (G–I) Whole-mount oral view at PN0.5. Arrowhead in (H) shows complete cleft palate observed in Wnt1Cre;Kdm6bfl/fl mice. Dashed lines in (G–I) indicate location of sections in (J–O). Scale bar: 2 mm. (J–O) Histological analysis of samples at PN0.5. Asterisk in (K, N) indicates cleft palate in Wnt1Cre;Kdm6bfl/fl mice. (M–O) are magnified images of boxes in (J–L), respectively. Dotted lines in (M–O) outline the bone structure. Scale bar: 200 µm. Mes: mesenchyme.
Figure 7
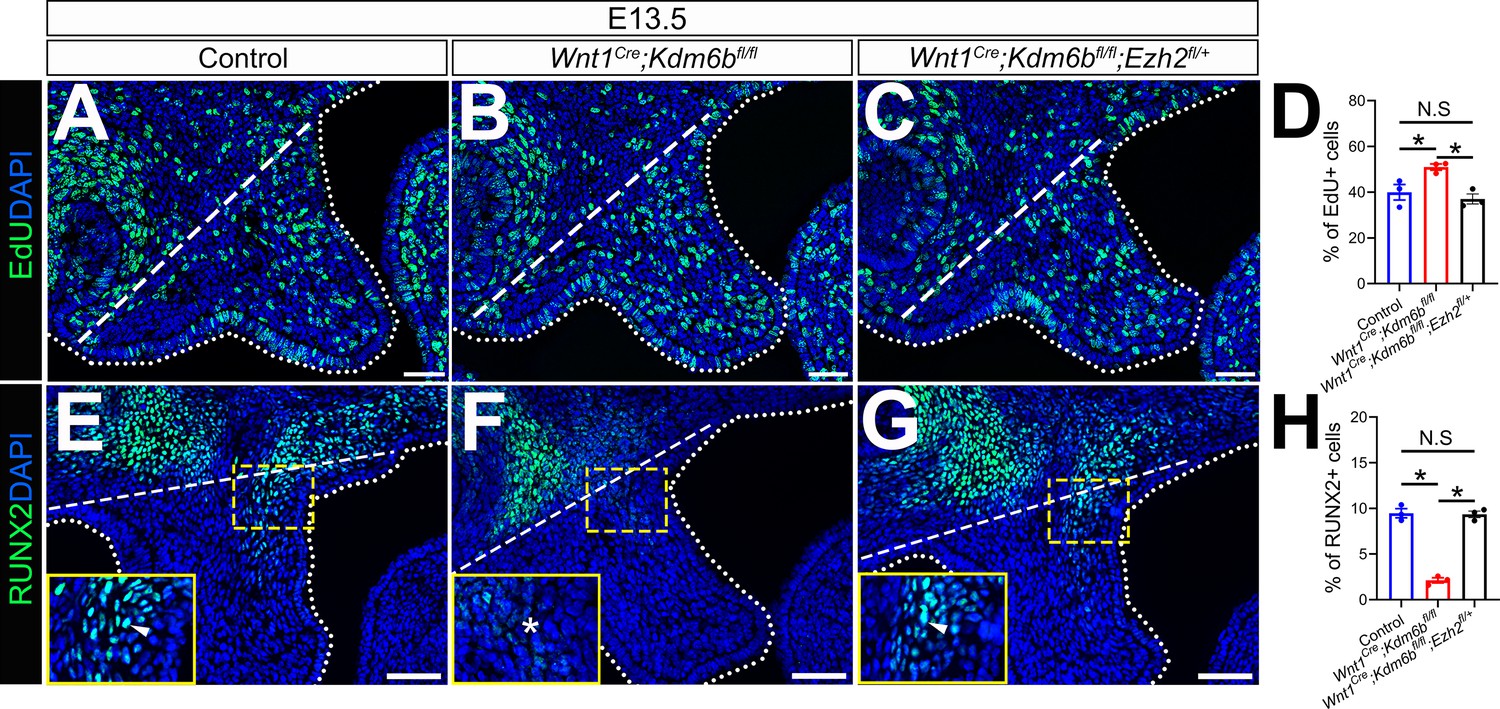
EdU+ and RUNX2+ cells are restored in Wnt1Cre;Kdm6bfl/fl;Ezh2fl/+ mice.
(A–C) Immunostaining of EdU at E13.5 after 2 hr of EdU labeling. Dotted lines indicate palatal shelf region. Dashed lines indicate the palatal region used for quantification in (D). Scale bar: 50 µm. (D) Quantification of EdU+ cells represented in (A–C). ANOVA is used for statistical analysis. *p<0.05. N.S: not significant. (E–G) Immunostaining of RUNX2 at E13.5. Dotted lines indicate palatal shelf region. Dashed lines indicate the palatal region used for quantification in (H). Scale bar: 50 µm. (H) Quantification of RUNX2+ cells represented in (E–G). ANOVA is used for statistical analysis. *p<0.05. N.S: not significant.
-
Figure 7—source data 1
Source data for Figure 7D.
- https://cdn.elifesciences.org/articles/74595/elife-74595-fig7-data1-v2.xlsx
-
Figure 7—source data 2
Source data for Figure 7H.
- https://cdn.elifesciences.org/articles/74595/elife-74595-fig7-data2-v2.xlsx
Figure 8 with 1 supplement
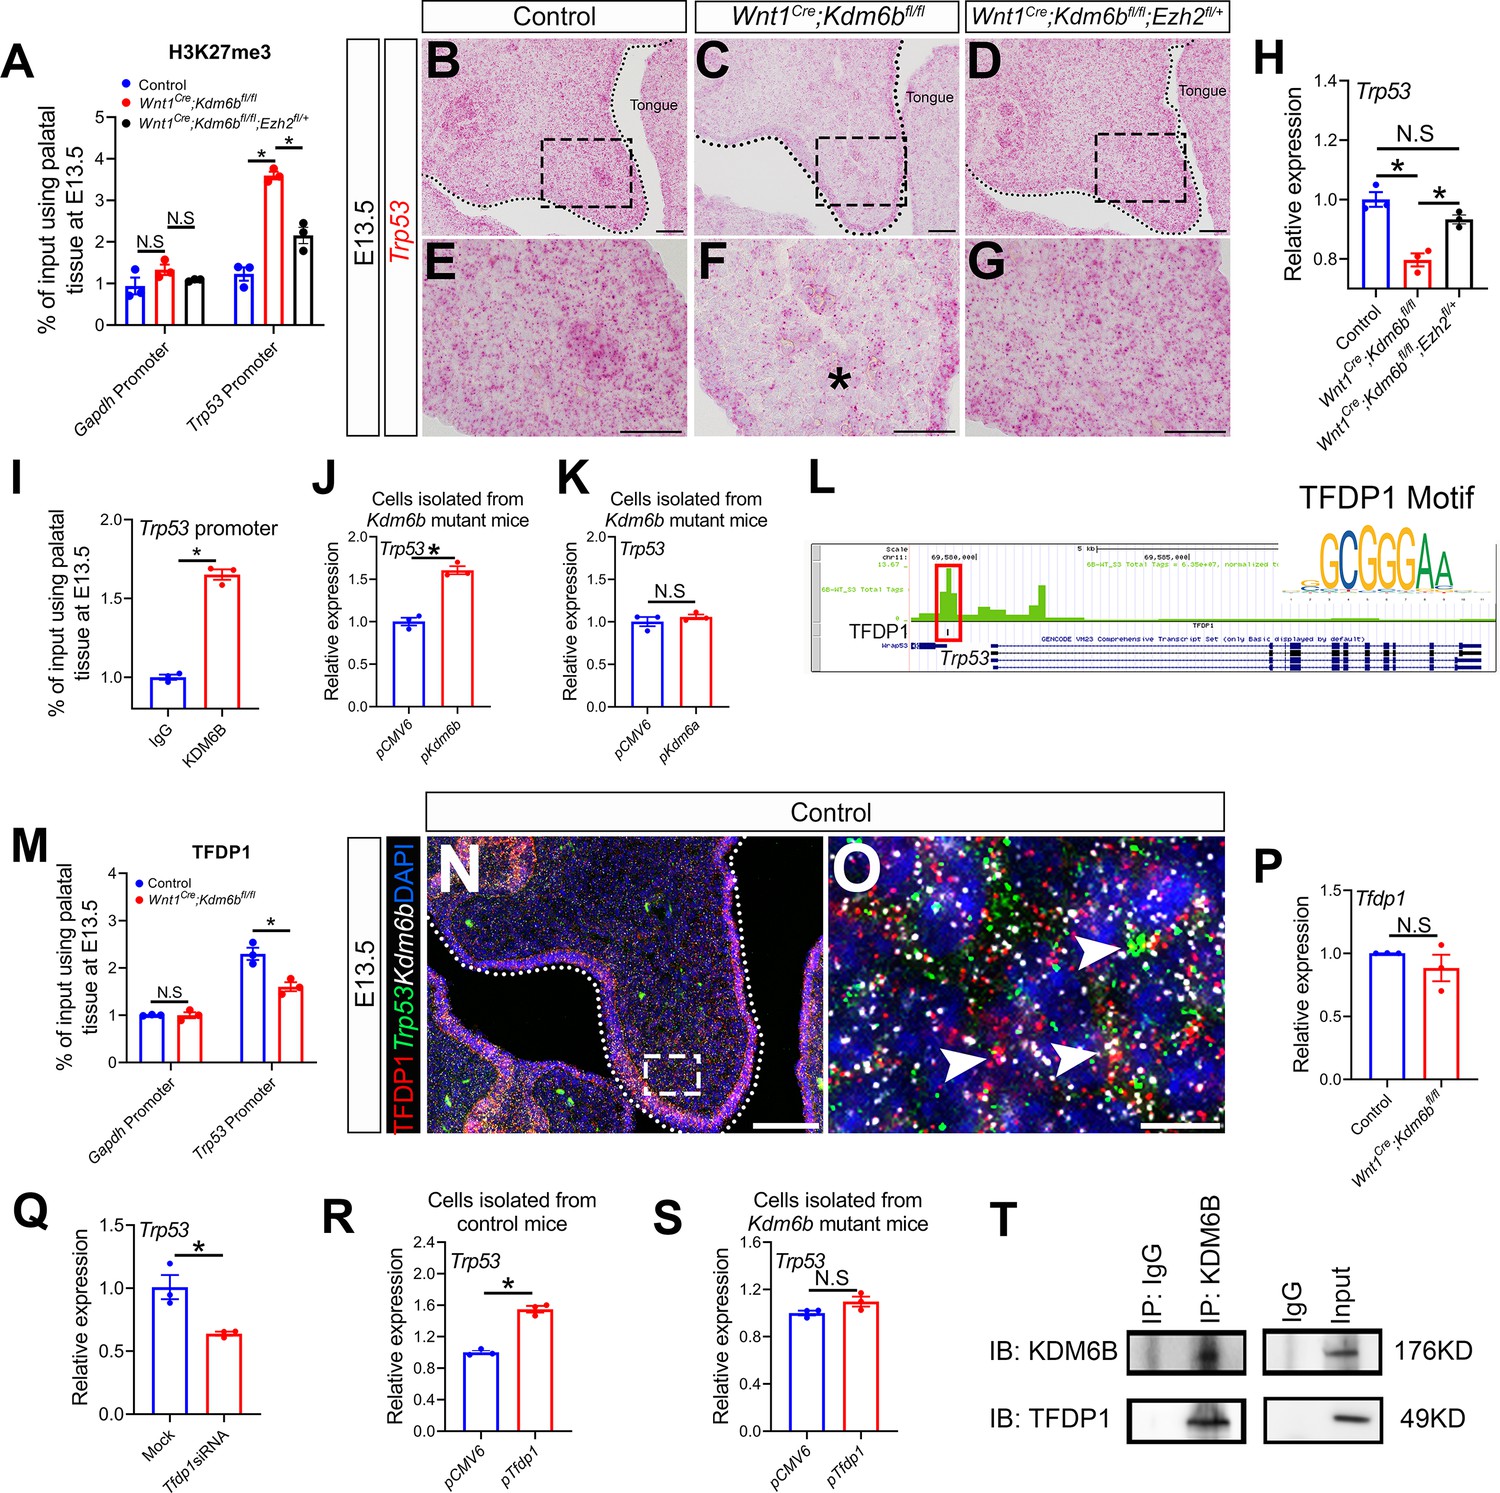
Kdm6b regulates expression of Trp53 through H3K27me3 and interacts with transcription factor TFDP1 in the activation of Trp53.
(A) ChIP-qPCR shows H3K27me3 deposition at the promoter region of Trp53 in palatal tissues of control, Kdm6b mutant, and Ezh2 haploinsufficient mice. ANOVA is used for statistical analysis. *p<0.05. N.S: not significant. (B–G) Expression of Trp53 in the palatal region at E13.5 using RNAscope in situ hybridization. Dotted lines in (B–D) indicate palatal shelf. (E–G) are magnified images of boxes in (B–D), respectively. Asterisk in (F) indicates decreased expression of Trp53 observed in Wnt1Cre;Kdm6bfl/fl mice. Scale bar: 50 µm. (H) RT-qPCR analysis of Trp53 expression in the palatal region of control, Kdm6b mutant, and Ezh2 haploinsufficient mice. ANOVA is used for statistical analysis. *p<0.05. N.S: not significant. (I) ChIP-qPCR shows KDM6B deposition at the promoter region of Trp53 in the palatal tissue of control mice. *p<0.05. (J, K) RT-qPCR analysis of Trp53 expression in palatal mesenchymal cells transfected with Kdm6b- or Kdm6a-overexpressing plasmids. *p<0.05. N.S: not significant. (L) ATAC-seq analysis indicates that the promoter region of Trp53 is accessible for transcription factor TFDP1. (M) ChIP-qPCR using palatal tissue shows that binding of TFDP1 to the promoter of Trp53 decreases in the Kdm6b mutant mice. *p<0.05. N.S: not significant. (N, O) Co-localization of TFDP1, Kdm6b, and Trp53 at E13.5 using immunostaining and RNAscope in situ hybridization. Dotted lines in (N) indicate palatal shelf. (O) is a magnified image of the box in (N). Arrowheads in (O) indicate representative cells that are positive for TFDP1, Kdm6b, and Trp53. Scale bar: 50 µm in (N) and 5 µm in (O). (P) RT-qPCR quantification shows the expression of Tfdp1 in samples collected at E13.5. N.S: not significant. (Q) RT-qPCR analysis of Trp53 expression in palatal mesenchymal cells after Tfdp1 siRNA transfection. *p<0.05. (R, S) RT-qPCR analysis of Trp53 expression in palatal mesenchymal cells transfected with Tfdp1 overexpressing plasmid. (R) *p<0.05. N.S: not significant. (T) Co-immunoprecipitation (Co-IP) experiment using protein extract from palatal tissues indicates that KDM6B and TFDP1 are present in the same complex. Anti-KDM6B antibody was used for immunoprecipitation (IP). IgG served as negative control. IB: immunoblotting.
-
Figure 8—source data 1
Source data for Figure 8A.
- https://cdn.elifesciences.org/articles/74595/elife-74595-fig8-data1-v2.xlsx
-
Figure 8—source data 2
Source data for Figure 8H.
- https://cdn.elifesciences.org/articles/74595/elife-74595-fig8-data2-v2.xlsx
-
Figure 8—source data 3
Source data for Figure 8I.
- https://cdn.elifesciences.org/articles/74595/elife-74595-fig8-data3-v2.xlsx
-
Figure 8—source data 4
Source data for Figure 8J.
- https://cdn.elifesciences.org/articles/74595/elife-74595-fig8-data4-v2.xlsx
-
Figure 8—source data 5
Source data for Figure 8K.
- https://cdn.elifesciences.org/articles/74595/elife-74595-fig8-data5-v2.xlsx
-
Figure 8—source data 6
Source data for Figure 8M.
- https://cdn.elifesciences.org/articles/74595/elife-74595-fig8-data6-v2.xlsx
-
Figure 8—source data 7
Source data for Figure 8P.
- https://cdn.elifesciences.org/articles/74595/elife-74595-fig8-data7-v2.xlsx
-
Figure 8—source data 8
Source data for Figure 8Q.
- https://cdn.elifesciences.org/articles/74595/elife-74595-fig8-data8-v2.xlsx
-
Figure 8—source data 9
Source data for Figure 8R.
- https://cdn.elifesciences.org/articles/74595/elife-74595-fig8-data9-v2.xlsx
-
Figure 8—source data 10
Source data for Figure 8S.
- https://cdn.elifesciences.org/articles/74595/elife-74595-fig8-data10-v2.xlsx
-
Figure 8—source data 11
Source data for Figure 8T.
- https://cdn.elifesciences.org/articles/74595/elife-74595-fig8-data11-v2.zip
Figure 8—figure supplement 1
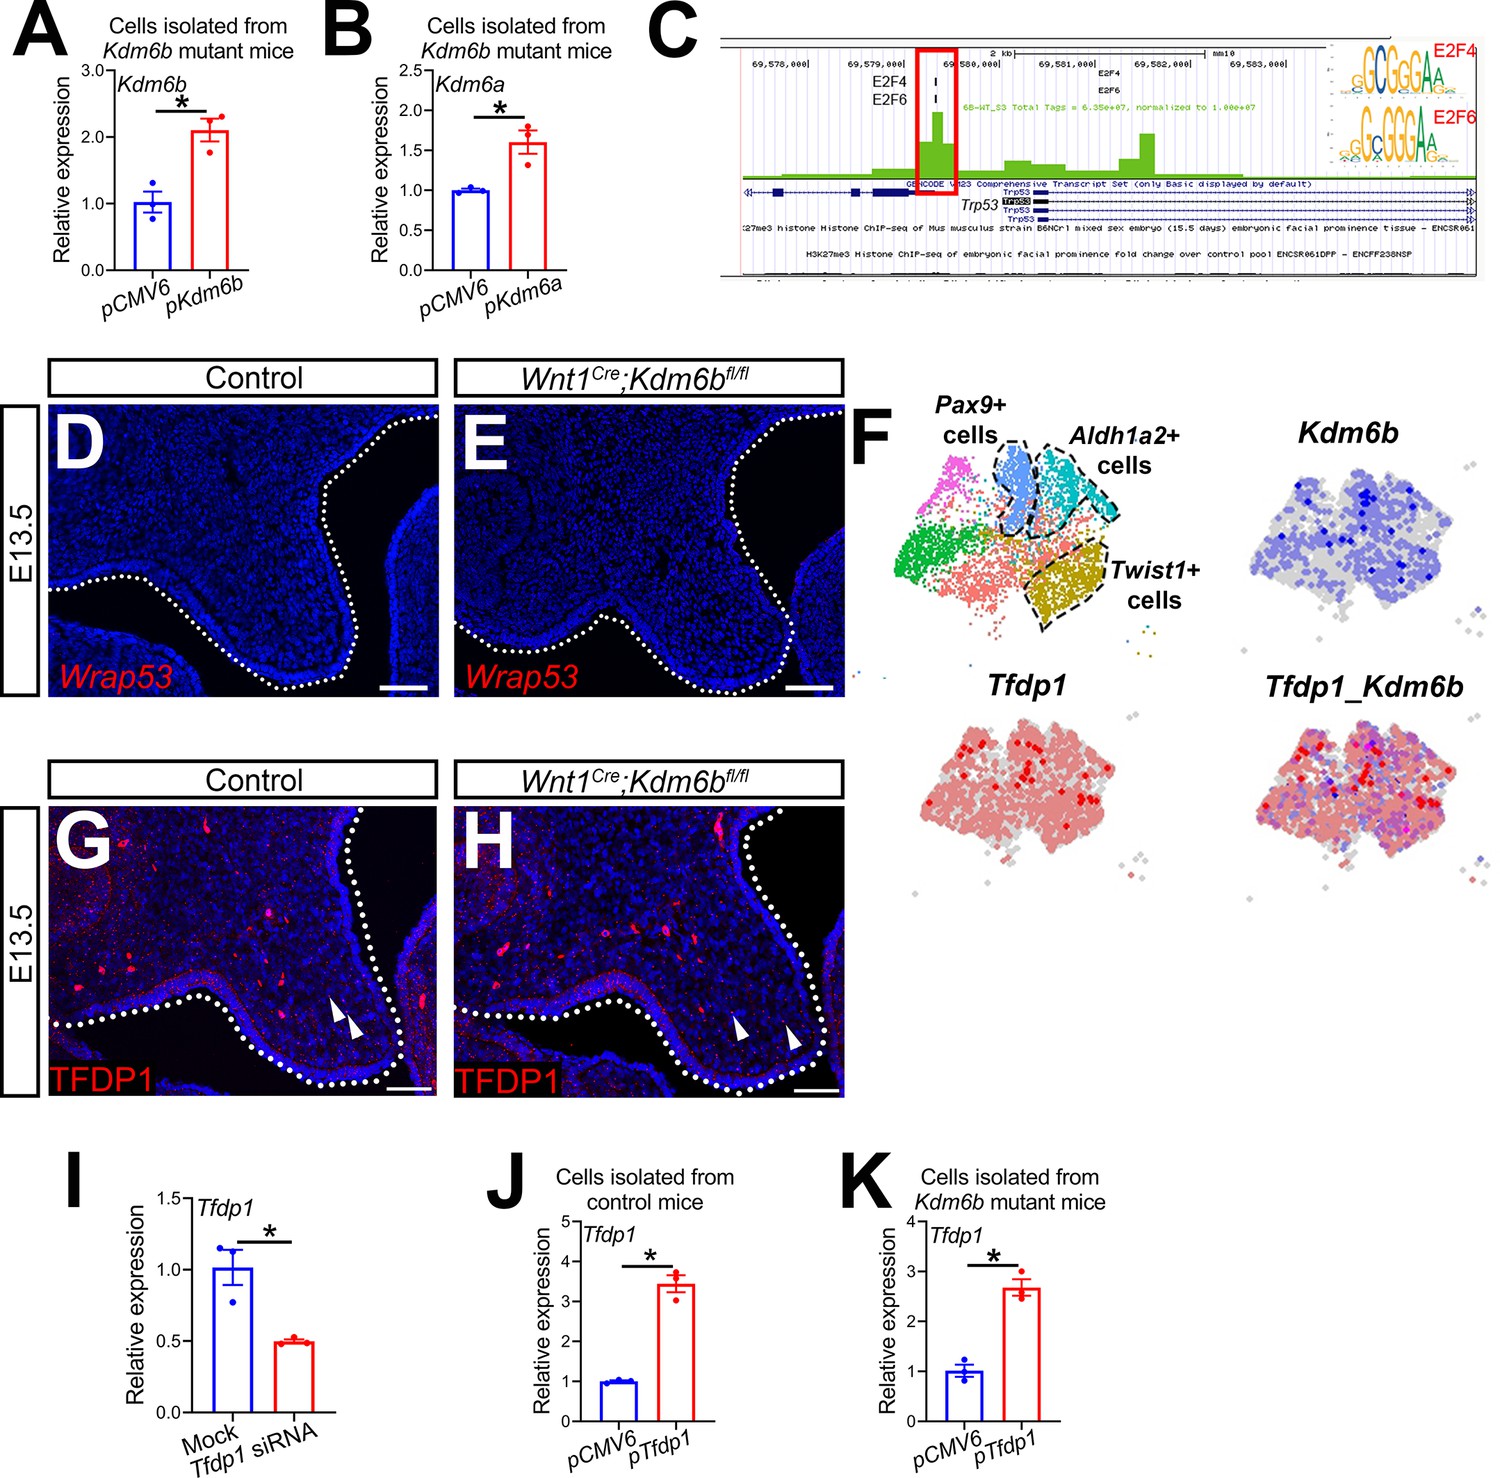
KDM6B and transcription factors are involved in regulating Trp53.
(A, B) RT-qPCR analysis of Kdm6a and Kdm6b expression in palatal mesenchymal cells isolated from Wnt1Cre;Kdm6bfl/fl mice after transfection with Kdm6a- or Kdm6b- overexpressing plasmids. *p<0.05. (C) ATAC-seq analysis suggests that the promoter of Trp53 is accessible to transcription factors E2F4 and E2F6. (D, E) Expression of Wrap53 in the palatal region at E13.5 using RNAscope in situ hybridization. Dotted lines in (D, E) indicate palatal shelf. Scale bar: 50 µm. (F) Co-expression of Kdm6b and Tfdp1 in the palate region at E13.5 using published scRNA-seq analysis (GEO: GSE155928). (G, H) Immunostaining of TFDP1 in the palatal region of control and Kdm6b mutant mice. Arrows indicate representative TFDP1+ cells. Scale bar: 50 µm. (I) RT-qPCR analysis of Tfdp1 expression in cells isolated from the palatal region of control mice 3 days after transfection with Tfdp1 siRNA. *p<0.05. (J, K) RT-qPCR analysis of Tfdp1 expression in palatal mesenchymal cells isolated from control and Kdm6b mutant mice after transfection with Tfdp1-overexpressing plasmid. (J) represents the result using cells isolated from control mice, and (K) represents the result using cells isolated from Wnt1Cre;Kdm6bfl/fl mice. *p<0.05.
-
Figure 8—figure supplement 1—source data 1
Source data for Figure 8—figure supplement 1A.
- https://cdn.elifesciences.org/articles/74595/elife-74595-fig8-figsupp1-data1-v2.xlsx
-
Figure 8—figure supplement 1—source data 2
Source data for Figure 8—figure supplement 1B.
- https://cdn.elifesciences.org/articles/74595/elife-74595-fig8-figsupp1-data2-v2.xlsx
-
Figure 8—figure supplement 1—source data 3
Source data for Figure 8—figure supplement 1I.
- https://cdn.elifesciences.org/articles/74595/elife-74595-fig8-figsupp1-data3-v2.xlsx
-
Figure 8—figure supplement 1—source data 4
Source data for Figure 8—figure supplement 1J.
- https://cdn.elifesciences.org/articles/74595/elife-74595-fig8-figsupp1-data4-v2.xlsx
-
Figure 8—figure supplement 1—source data 5
Source data for Figure 8—figure supplement 1K.
- https://cdn.elifesciences.org/articles/74595/elife-74595-fig8-figsupp1-data5-v2.xlsx
Figure 9
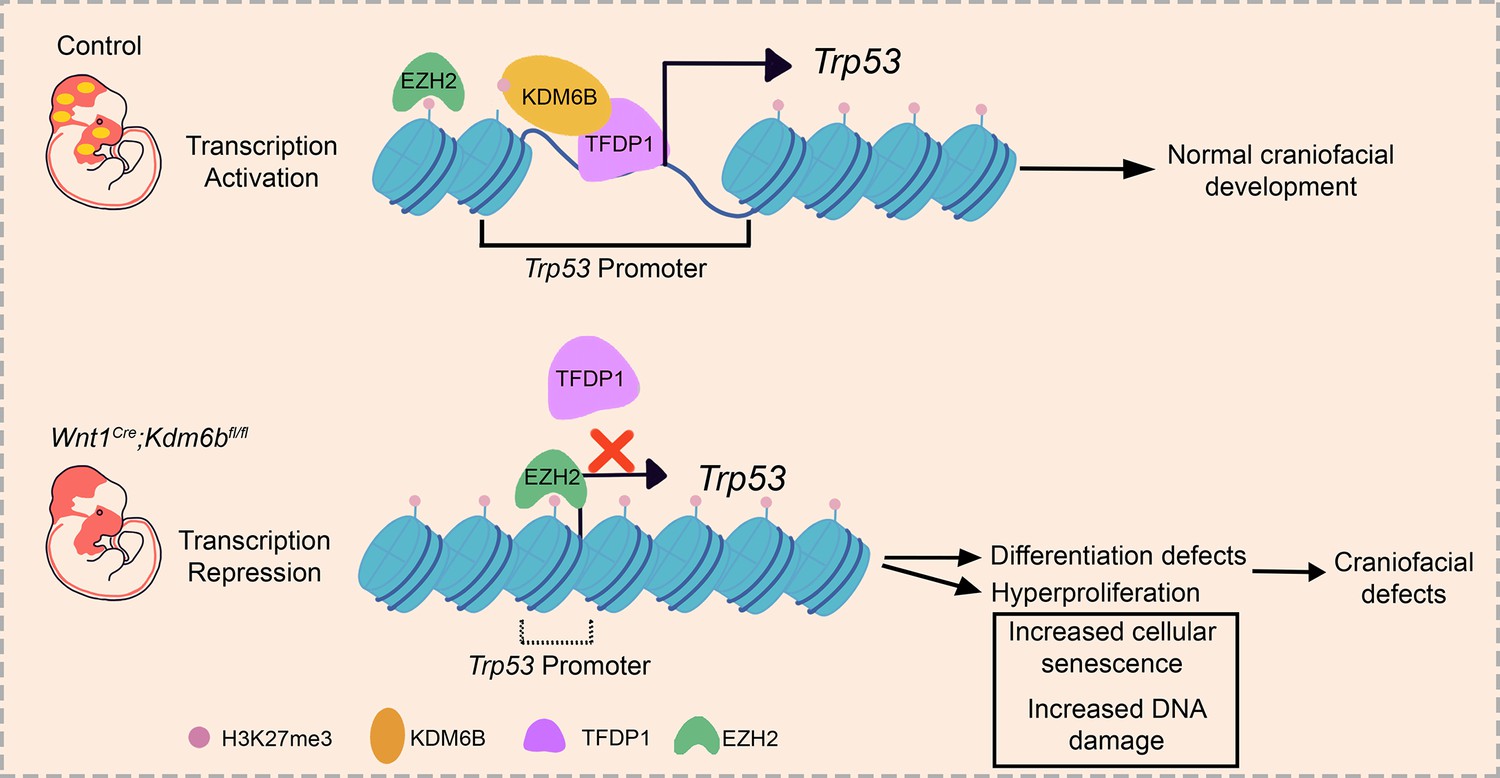
Summary schematic drawing.
Tables
Key resources table
| Reagent type (species) or resource | Designation | Source or reference | Identifiers | Additional information |
|---|---|---|---|---|
| Strain, strain background (Mus musculus) | Kdm6bflox/flox | Manna et al., 2015, Jackson Laboratory | Stock# 029615;RRID:IMSR_JAX:029615 | |
| Strain, strain background (M. musculus) | Ezh2flox/flox | Jackson Laboratory | Stock# 022616; RRID:IMSR_JAX:022616 | |
| Strain, strain background (M. musculus) | Trp53flox/flox | Jackson Laboratory | Stock# 008462;RRID:IMSR_JAX:008462 | |
| Strain, strain background (M. musculus) | Wnt1Cre | Zhao et al., 2008 | ||
| Strain, strain background (M. musculus) | Krt14cre | Jackson Laboratory | Stock# 018964;RRID:IMSR_JAX:018964 | |
| Strain, strain background (M. musculus) | ROSA26loxp-STOP-loxp-tdTomato | Jackson Laboratory | Stock# 007905;RRID:IMSR_JAX:007905 | |
| Sequence-based reagent | Mm-Kdm6a probe | Advanced Cell Diagnostics | Cat# 456961 | |
| Sequence-based reagent | Mm-Kdm6b probe | Advanced Cell Diagnostics | Cat# 477971 | |
| Sequence-based reagent | Mm-Kdm6b-01 probe | Advanced Cell Diagnostics | Cat# 501231 | |
| Sequence-based reagent | Mm-Uty probe | Advanced Cell Diagnostics | Cat# 451741 | |
| Sequence-based reagent | Mm-Trp53 probe | Advanced Cell Diagnostics | Cat# 402331 | |
| Sequence-based reagent | Mm-Trp53-C2 probe | Advanced Cell Diagnostics | Cat# 402331-C2 | |
| Sequence-based reagent | Mm-Ezh1 probe | Advanced Cell Diagnostics | Cat# 415501 | |
| Sequence-based reagent | Mm-Wrap53 probe | Advanced Cell Diagnostics | Cat# 1143201-C1 | |
| Antibody | Myosin heavy chain (MHC) (mouse monoclonal) | DSHB | Cat# P13538 | (1:10) |
| Antibody | Histone H3 tri methyl K27 (rabbit monoclonal) | Cell Signaling Technology | Cat# 9733s | (1:200)(1:1000) |
| Antibody | Phospho-histone H2A.X (rabbit monoclonal) | Cell Signaling Technology | Cat# 9718s | (1:200) |
| Antibody | DP1 (rabbit monoclonal) | Abcam | Cat# ab124678 | (1:100)(1:1000) |
| Antibody | EZH2 (rabbit monoclonal) | Cell Signaling Technology | Cat# 5246s | (1:200)(1:2000) |
| Antibody | RUNX2 (rabbit monoclonal) | Cell Signaling Technology | Cat# 12556s | (1:200) |
| Antibody | SP7 (rabbit polyclonal) | Abcam | Cat# ab22552 | (1:200) |
| Antibody | Lamin B1 (rabbit monoclonal) | Cell Signaling Technology | Cat# 17416s | (1:100) |
| Antibody | Anti-mouse Alexa Fluor 488 (goat polyclonal) | Life Technologies | Cat# A11001 | (1:200) |
| Antibody | Anti-mouse Alexa Fluor 568 (goat polyclonal) | Life Technologies | Cat# A-11004 | (1:200) |
| Antibody | Anti-rat Alexa Fluor 488 (goat polyclonal) | Life Technologies | Cat# A-11006 | (1:200) |
| Antibody | Anti-rabbit Alexa Fluor 488 (goat polyclonal) | Life Technologies | Cat# A-11008 | (1:200) |
| Antibody | Anti-rabbit Alexa Fluor 568 (goat polyclonal) | Life Technologies | Cat# A-11036 | (1:200) |
| Antibody | EZH1 (rabbit polyclonal) | Abcam | Cat# ab189833 | (1:1000) |
| Antibody | KDM6A (rabbit polyclonal) | Abcam | Cat# ab36938 | (1:1000) |
| Antibody | KDM6B (C-term) (rabbit polyclonal) | AbCEPTA | Cat# AP1022b | (1:1000) |
| Antibody | KDM6B (N-term) (rabbit polyclonal) | AbCEPTA | Cat# AP1022a | (1:1000) |
| Antibody | P53 (mouse monoclonal) | Santa Cruz | Cat# sc-126 | (1:1000) |
| Antibody | Histone H3 (rabbit monoclonal) | Cell Signaling Technology | Cat# 4499s | (1:1000) |
| Antibody | β-Actin (mouse monoclonal) | Abcam | Cat# Ab20272 | (1:2000) |
| Antibody | Rabbit IgG HRP-conjugated antibody (goat polyclonal) | R&D System | Cat# HAF008 | (1:2000) |
| Antibody | Mouse IgG HRP-conjugated antibody (goat polyclonal) | R&D System | Cat# HAF007 | (1:2000) |
| Antibody | HRP, mouse anti-rabbit IgG LCS (mouse monoclonal) | IPKine | Cat# A25022 | (1:2000) |
| Commercial assay or kit | Goat anti-mouse IgG Alexa Fluor 488 Tyramide SuperBoost Kit | Thermo Fisher Scientific | Cat# B40912 | (1:200) |
| Commercial assay or kit | RNAscope Multiplex Fluorescent Kit v2 | Advanced Cell Diagnostics | Cat# 323110 | |
| Commercial assay or kit | RNAscope 2.5 HD Assay – RED | Advanced Cell Diagnostics | Cat# 322350 | |
| Commercial assay or kit | TSA Plus Cyanine 3 System | PerkinElmer | Cat# NEL744001KT | |
| Commercial assay or kit | TSA Plus Fluoresceine System | PerkinElmer | Cat# NEL771B001KT | |
| Commercial assay or kit | RNeasy Micro Kit | QIAGEN | Cat# 74004 | |
| Commercial assay or kit | DAB Peroxidase (HRP) Substrate Kit (with nickel) | Vector Laboratories | RRID:AB_2336382;Cat# SK4100 | |
| Software, algorithm | ImageJ | NIH | RRID:SCR_003070 | |
| Software, algorithm | Ingenuity Pathway Analysis | QIAGEN, Inc | RRID:SCR_008653 | |
| Software, algorithm | GraphPad Prism | GraphPad Software | RRID:SCR_002798 | |
| Software, algorithm | Seurat | Satija lab | RRID:SCR_016341 | |
| Software, algorithm | Cell Ranger | 10X Genomics, Inc | RRID:SCR_017344 |
Additional files
-
Supplementary file 1
Antibodies used for in vivo immunostaining.
- https://cdn.elifesciences.org/articles/74595/elife-74595-supp1-v2.docx
-
Supplementary file 2
Probes used for in situ RNAscope.
- https://cdn.elifesciences.org/articles/74595/elife-74595-supp2-v2.docx
-
Supplementary file 3
Primers used for ChIP-qPCR and RT-qPCR.
- https://cdn.elifesciences.org/articles/74595/elife-74595-supp3-v2.docx
-
Supplementary file 4
Antibodies used for Western blot and co-immunoprecipitation (co-IP).
- https://cdn.elifesciences.org/articles/74595/elife-74595-supp4-v2.docx
-
Supplementary file 5
siRNA used in cell culture experiments.
- https://cdn.elifesciences.org/articles/74595/elife-74595-supp5-v2.docx
-
Supplementary file 6
Plasmids used in cell culture experiments.
- https://cdn.elifesciences.org/articles/74595/elife-74595-supp6-v2.docx
-
Supplementary file 7
QC report for ATAC-seq.
- https://cdn.elifesciences.org/articles/74595/elife-74595-supp7-v2.docx
-
Transparent reporting form
- https://cdn.elifesciences.org/articles/74595/elife-74595-transrepform1-v2.docx
Download links
A two-part list of links to download the article, or parts of the article, in various formats.
Downloads (link to download the article as PDF)
Open citations (links to open the citations from this article in various online reference manager services)
Cite this article (links to download the citations from this article in formats compatible with various reference manager tools)
KDM6B interacts with TFDP1 to activate P53 signaling in regulating mouse palatogenesis
eLife 11:e74595.
https://doi.org/10.7554/eLife.74595


