KDM6B interacts with TFDP1 to activate P53 signaling in regulating mouse palatogenesis
- Center for Craniofacial Molecular Biology, Herman Ostrow School of Dentistry, University of Southern California, United States
Abstract
Epigenetic regulation plays extensive roles in diseases and development. Disruption of epigenetic regulation not only increases the risk of cancer, but can also cause various developmental defects. However, the question of how epigenetic changes lead to tissue-specific responses during neural crest fate determination and differentiation remains understudied. Using palatogenesis as a model, we reveal the functional significance of Kdm6b, an H3K27me3 demethylase, in regulating mouse embryonic development. Our study shows that Kdm6b plays an essential role in cranial neural crest development, and loss of Kdm6b disturbs P53 pathway-mediated activity, leading to complete cleft palate along with cell proliferation and differentiation defects in mice. Furthermore, activity of H3K27me3 on the promoter of Trp53 is antagonistically controlled by Kdm6b, and Ezh2 in cranial neural crest cells. More importantly, without Kdm6b, the transcription factor TFDP1, which normally binds to the promoter of Trp53, cannot activate Trp53 expression in palatal mesenchymal cells. Furthermore, the function of Kdm6b in activating Trp53 in these cells cannot be compensated for by the closely related histone demethylase Kdm6a. Collectively, our results highlight the important role of the epigenetic regulator KDM6B and how it specifically interacts with TFDP1 to achieve its functional specificity in regulating Trp53 expression, and further provide mechanistic insights into the epigenetic regulatory network during organogenesis.
Editor's evaluation
Using the mouse secondary palate as a model, this study reports original findings on the function of Kdm6b, a H3K27me3 demethylase, in the regulation of embryonic development. The authors show that Kdm6b plays an essential role in neural crest development, and that loss of Kdm6b perturbs the p53 pathway, leading to complete clefting of the secondary palate along with cell proliferation and differentiation defects.
https://doi.org/10.7554/eLife.74595.sa0Introduction
Embryonic development is a highly complex self-assembly process during which precursor cells are coordinated to generate appropriate cell types and assemble them into well-defined structures, tissues, and organs (Shahbazi et al., 2016). During this process, precursor cells undergo extensive and rapid cell proliferation until they reach the point of exit from the cell cycle to differentiate into various cell lineages (Ruijtenberg and van den Heuvel, 2016; Miermont et al., 2019). How these precursor cells modulate expression of different genes and proceed through diverse proliferation and differentiation processes is a very complex and interesting question. Growing evidence shows that epigenetic regulation, which includes mechanisms such as DNA methylation, histone modifications, chromatin accessibility, and higher-order organization of chromatin, provides the ability to modify gene expression and associated protein production in a cell type-specific manner, thus playing an essential role in achieving signaling specificity and regulating cell fate during embryonic development (Hanna et al., 2018).
Among these various layers of epigenetic regulation, DNA methylation and histone methylation are the best characterized and known to be key regulators of diverse cellular events (Bannister and Kouzarides, 2011; Smith and Meissner, 2013; Molina-Serrano et al., 2019). For example, methylation of lysine 27 on histone H3 (H3K27me) by methyltransferases is a feature of heterochromatin that renders it inaccessible to transcription factors, thus maintaining transcriptional repression, across many species (Wiles and Selker, 2017). On the other hand, methylation of H3K4me3 found near the promoter region can couple with the NURF complex to increase chromatin accessibility for gene activation (Wysocka et al., 2006; Soares et al., 2017). Demethylation, which results from removing a methyl group, also plays important roles during development. For instance, demethylation of H3K4 is required for maintaining pluripotency in embryonic stem cells, and demethylases KDM6A and KDM6B are required for proper gene expression in mature T cells (Lessard and Crabtree, 2010; Jambhekar et al., 2019). These studies clearly show that failure to maintain epigenomic integrity can cause deleterious consequences for embryonic development and adult tissue homeostasis (Henckel et al., 2007; Kim et al., 2009; Kang et al., 2019).
Palatogenesis is a complex process known to be regulated by multiple genetic regulatory mechanisms, including several signaling pathways (BMP, SHH, WNT, FGF, and TGFβ) and different transcription factors (such as Msx1, Sox9, Lhx6/8, Dlx5, and Shox2) (Satokata and Maas, 1994; Yu et al., 2005; Chai and Maxson, 2006; Levi et al., 2006; Cobourne et al., 2009; Lee and Saint-Jeannet, 2011; Nakamura et al., 2011; Bush and Jiang, 2012; He and Chen, 2012; Parada and Chai, 2012; Xu et al., 2016; Reynolds et al., 2019). However, environmental effects can also contribute to orofacial defects, which lends further support to the notion that genetic factors are not sufficient to fully explain the etiology of many birth defects (Dixon et al., 2011; Roessler et al., 2012; Seelan et al., 2012). Furthermore, case studies have revealed that heterozygous mutation of a chromatin-remodeling factor, SATB2, and variation in DNA methylation can cause cleft palate in patients (Leoyklang et al., 2007; Chandrasekharan and Ramanathan, 2014; Young et al., 2021). These cases have drawn our attention to the function of epigenetic regulation in palatogenesis.
The contribution of cranial neural crest cells (CNCCs) is critical to palate mesenchyme formation. Recently, studies have begun to address the role of epigenetic regulation in neural crest cell fate determination during development. For instance, homozygous loss of Arid1a, a subunit of SWI/SNF chromatin remodeling complex, in neural crest cells results in lethality in mice, associated with severe defects in the heart and craniofacial bones (Chandler and Magnuson, 2016). In addition, both lysine methyltransferase Kmt2a and demethylase Kdm6a are essential for cardiac and neural crest development (Shpargel et al., 2017; Sen et al., 2020). However, how these epigenetic changes lead to tissue-specific response during neural crest fate determination remain to be elucidated.
In this study, using palatogenesis as a model we investigated the functional significance of the demethylase Kdm6b in regulating the fate of CNCCs during palatogenesis. We have discovered that loss of Kdm6b in cranial neural crest (CNC)-derived cells results in complete cleft palate along with soft palate muscle defects. We also found cell proliferation and differentiation defects of CNC-derived cells in Kdm6b mutant mice. More importantly, our study shows that the level of H3K27me3 on the promoter of Trp53 (also known as P53 in human) is antagonistically controlled by Kdm6b and Ezh2. Furthermore, without Kdm6b, the transcription factor TFDP1, which binds to the promoter of Trp53, cannot activate expression of Trp53 in palatal mesenchymal cells. More importantly, the function of Kdm6b in activating Trp53 in these cells cannot be compensated for by the closely related histone demethylase Kdm6a. Our study highlights the importance of epigenetic regulation on cell fate decision and its function in regulating activity of Trp53 in CNC-derived cells during organogenesis.
Results
Loss of Kdm6b in CNC-derived cells results in craniofacial malformations
Previous research has shown that the X-chromosome-linked H3K27 demethylase KDM6A is indispensable for neural crest cell differentiation and viability as it establishes appropriate chromatin structure (Schwarz et al., 2014; Shpargel et al., 2017). However, we do not yet have a comprehensive understanding of the roles of two other members of the KDM6 family, Kdm6b and Uty, in regulating CNCCs during craniofacial development. More importantly, we have yet to understand how demethylase achieves its functional specificity in regulating downstream target genes. In order to elucidate the functions of Kdm6b and Uty, we first evaluated the expression patterns of KDM6 family members in the palatal region (Figure 1—figure supplement 1A–F). We found that, of these, Kdm6b is more abundantly expressed than Kdm6a and Uty in both palate mesenchymal and epithelial cells, which indicated it might play a critical role in regulating palatogenesis.
To investigate the tissue-specific function of Kdm6b during craniofacial development, we generated Wnt1Cre;Kdm6bfl/fl and Krt14Cre;Kdm6bfl/fl mice to specifically target the deletion of Kdm6b in CNC-derived and epithelial cells, respectively. Loss of Kdm6b in CNC-derived cells resulted in complete cleft palate in Wnt1Cre;Kdm6bfl/fl mice (90% phenotype penetrance, N = 10) and postnatal lethality at newborn stage (100% phenotype penetrance, N = 10) without interrupting expression of other KDM6 family members ( Figure 1A and B, Figure 1—figure supplement 1A–N). To evaluate when Kdm6b was inactivated in the CNC-derived cells, we also investigated the expression of Kdm6b at E9.5, well prior to the formation of the palate primordium, and found that Kdm6b was efficiently inactivated in the CNC-derived cells at this stage (Figure 1—figure supplement 1O and P). Interestingly, loss of Kdm6b in epithelial cells did not lead to obvious defects in the craniofacial region in Krt14Cre;Kdm6bfl/fl mice (Figure 1—figure supplement 2A–H). These results emphasized that Kdm6b is specifically required in CNC-derived cells during palatogenesis. CT images also confirmed the complete cleft palate phenotype and revealed that the most severe defects in the palatal region of Wnt1Cre;Kdm6bfl/fl mice were hypoplastic palatine processes of the maxilla and palatine bones (Figure 1C and D). Except for a minor flattened skull, other CNC-derived bones did not show significant differences between control and Wnt1Cre;Kdm6bfl/fl mice (Figure 1—figure supplement 2I–N). To evaluate the phenotype in more detail, we performed histological analysis and found that although the palatal shelves were able to elevate, the maxilla and palatine bones, as well as the palate stromal mesenchyme and soft palate muscles, failed to grow towards the midline in Wnt1Cre;Kdm6bfl/fl mice (Figure 1G–R, Figure 1—figure supplement 3A–P). Furthermore, in the posterior soft palate region, Wnt1Cre;Kdm6bfl/fl mice also showed morphological defects related to the orientation of muscle fibers and the pterygoid plate (Figure 1—figure supplement 3A–X). However, since the soft palate forms subsequent to the hard palate, it is difficult to identify whether the soft palatal muscle phenotype is a primary defect or a consequence resulting from an anterior cleft. Therefore, we focused on the anterior hard palate for further investigation. Collectively, these data indicate that mesenchymal Kdm6b is indispensable for craniofacial development and plays an essential role during palatogenesis.
Figure 1 with 3 supplements see all

Loss of Kdm6b in cranial neural crest (CNC)-derived cells results in cleft palate.
(A, B) Whole-mount oral view shows complete cleft palate phenotype in Wnt1Cre;Kdm6bfl/fl mice. Arrowhead in (B) indicates the cleft palate. Scale bar: 2 mm. (C, D) CT imaging reveals that the palatine process of the maxilla and palatine bone (PB) is missing in Wnt1Cre;Kdm6bfl/fl mice. White arrowheads in (C) indicate the palatine process of maxilla (PPM) in control mice, and red arrows indicate the PB. White asterisk in (D) indicates the missing PPM in Wnt1Cre;Kdm6bfl/fl mice, and red asterisk in (D) indicates the missing PB in Kdm6b mutant mice. Scale bars: 1 mm. (E, F) Sagittal views of CT images demonstrate the locations of HE sections in (G–R). Red lines indicate the locations of sections. Yellow arrow in (E) indicates palatal shelf, and yellow asterisk in (F) indicates cleft. Scale bars: 1 mm. (G–R) Histological analysis of control and Wnt1Cre;Kdm6bfl/fl mice. (H, J, L, N, P, R) are magnified images of boxes in (G, I, K, M, O, Q), respectively. Asterisks in (M, O, Q) indicate cleft in Kdm6b mutant mice. Scale bar: 200 µm. Mes: mesenchyme.
Kdm6b is critical for proliferation and differentiation of CNC-derived palatal mesenchymal cells
During craniofacial development, CNCCs migrate ventrolaterally and populate the branchial arches to give rise to distinct mesenchymal structures in the head and neck, such as the palate. Failure of CNCCs to populate pharyngeal arches causes craniofacial defects (Noden, 1983; Noden, 1991; Trainor and Krumlauf, 2000; Cordero et al., 2011). To determine whether Kdm6b mutant CNCCs successfully populate the first pharyngeal arch, which gives rise to the palatal shelves, we generated tdTomato reporter mice and collected samples at E10.5. The results showed that CNCCs’ migration was not adversely affected in Kdm6b mutant mice (Figure 2—figure supplement 1A and B). Then, we evaluated the process of palatogenesis at different embryonic stages and found that the cleft palate phenotype emerged as early as E14.5 in Wnt1Cre;Kdm6bfl/fl mice (Figure 2—figure supplement 1C and D). These data established that Kdm6b is not essential for CNCCs entering the pharyngeal arch but is specifically required in regulating post-migratory CNC-derived cells during palatogenesis.
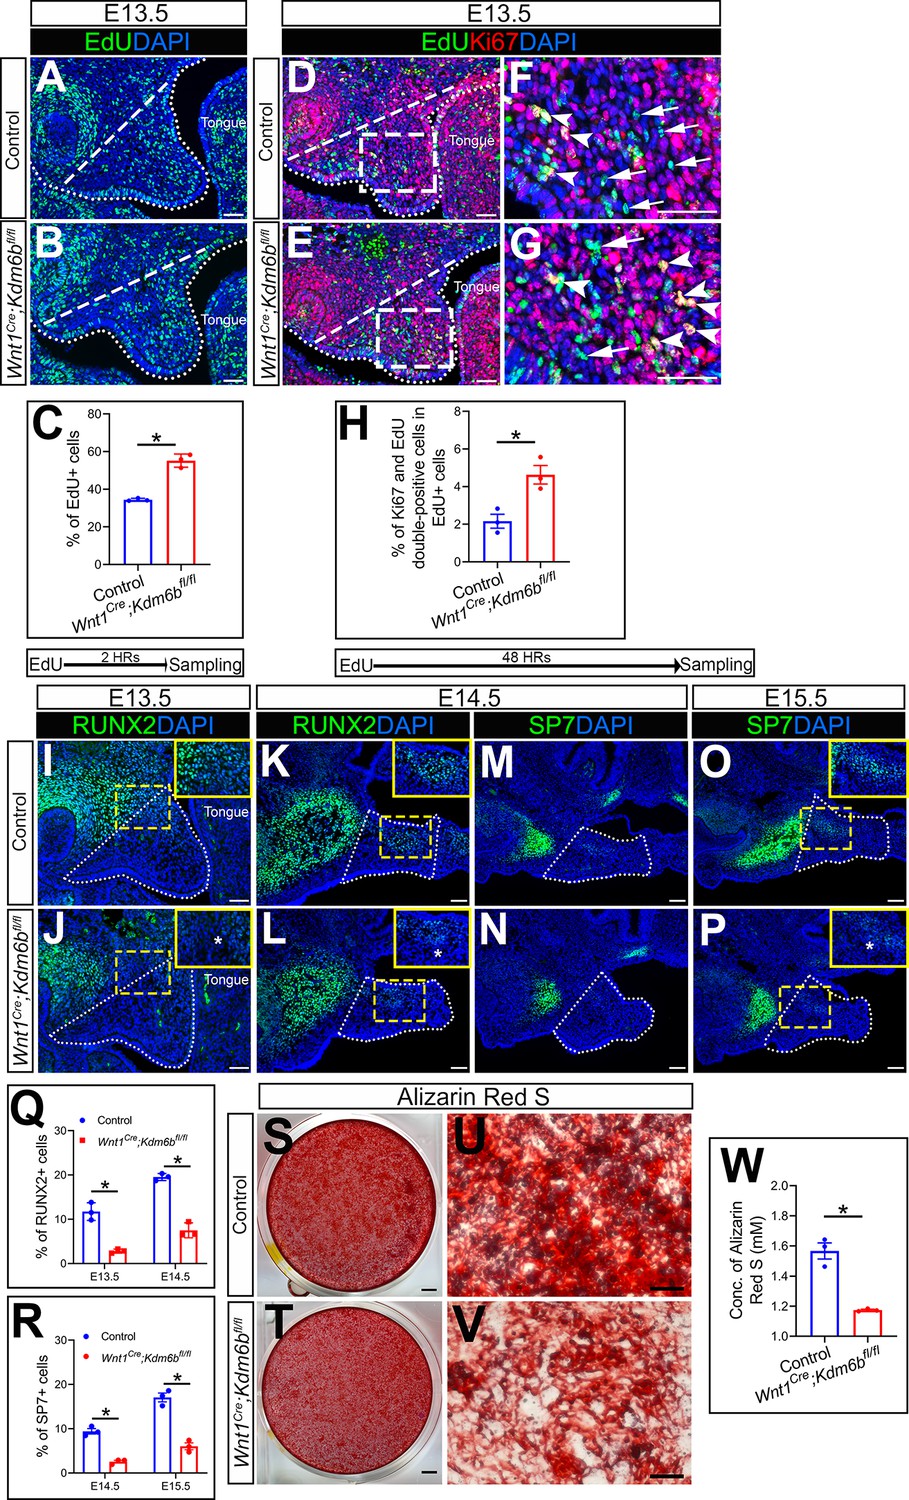
Because cell proliferation defects in CNC-derived cells frequently lead to craniofacial defects, we tested whether loss of Kdm6b can affect cell proliferation using EdU labeling. After 2 hr of EdU labeling, we found that the number of cells positively stained with EdU was significantly increased in the CNC-derived palatal mesenchyme in Wnt1Cre;Kdm6bfl/fl mice compared to controls (Figure 2A–C). In addition, after 48 hr of EdU labeling, we found that the number of Ki67 and EdU double-positive cells was significantly increased in Wnt1Cre;Kdm6bfl/fl mice (Figure 2D–H). These results indicated that loss of Kdm6b in CNC-derived cells resulted in more cells remaining in the cell cycle and actively proliferating, which further led to hyperproliferation of mesenchymal cells in the palatal region of Wnt1Cre;Kdm6bfl/fl mice. Meanwhile, palatal mesenchymal cells of Wnt1Cre;Kdm6bfl/fl mice showed more expression of β-galactosidase, which suggested increased cellular senescence in Wnt1Cre;Kdm6bfl/fl mice (Figure 2—figure supplement 1E–G). To evaluate cellular senescence in vivo, we stained Lamin B1 in EdU-labeled samples. After 48 hr of EdU labeling, we found that there was less expression of Lamin B1 in the palatal mesenchyme of Wnt1Cre;Kdm6bfl/fl mice. More importantly, fewer EdU+ cells expressing Lamin B1 were observed in Wnt1Cre;Kdm6bfl/fl mice (Figure 2—figure supplement 1H–L). These data suggested that hyperproliferation may cause increased cellular senescence in palatal mesenchymal cells of Wnt1Cre;Kdm6bfl/fl mice.
Figure 2 with 1 supplement see all
Kdm6b is critical for proliferation and differentiation of cranial neural crest (CNC)-derived palatal mesenchyme cells.
(A, B) Immunostaining of EdU at E13.5 after 2 hr of EdU labeling. Dotted lines indicate palatal shelf region. Dashed lines indicate the palatal region used for quantification in (C). Scale bar: 50 µm. (C) Quantification of EdU+ cells represented in (A, B). *p<0.05. (D–G) Co-localization of EdU and Ki67 at E13.5 after 48 hr of EdU labeling. Dotted lines indicate palatal shelf region. Dashed lines indicate the palatal region used for quantification in (H). (F, G) are magnified images of boxes in (D, E). Arrows in (F, G) indicate representative cells that are only EdU+, while arrowheads indicate representative cells that are positive for both EdU and Ki67. Scale bar: 50 µm. (H) Quantification of EdU and Ki67 double-positive cells represented in (D, E). *p<0.05. (I–L) Immunostaining of RUNX2 at indicated stages. Insets are higher-magnification images of boxes in (I–L). Asterisks in (J, L) indicate decreased RUNX2+ cells observed in Wnt1Cre;Kdm6bfl/fl mice. Scale bar: 50 µm. White dotted lines indicate the palatal region used for quantification in (Q). (M–P) Immunostaining of SP7 at indicated stages. Insets are higher-magnification images of boxes in (O, P). Asterisk in (P) indicates decreased SP7+ cells observed in Wnt1Cre;Kdm6bfl/fl mice. Scale bar: 50 µm. White dotted lines indicate the palatal region used for quantification in (R). (Q, R) Quantification results for RUNX2+ and SP7+ cells represented in (I–P). *p<0.05. (S–W) Osteogenic differentiation assay using Alizarin red S staining. (W) is the quantification result of Alizarin red S staining represented in (S, T). Scale bars: 2 mm in (S, T); 200 µm in (U, V). *p<0.05.
-
Figure 2—source data 1
Source data for Figure 2C.
- https://cdn.elifesciences.org/articles/74595/elife-74595-fig2-data1-v2.xlsx
-
Figure 2—source data 2
Source data for Figure 2H.
- https://cdn.elifesciences.org/articles/74595/elife-74595-fig2-data2-v2.xlsx
-
Figure 2—source data 3
Source data for Figure 2Q.
- https://cdn.elifesciences.org/articles/74595/elife-74595-fig2-data3-v2.xlsx
-
Figure 2—source data 4
Source data for Figure 2R.
- https://cdn.elifesciences.org/articles/74595/elife-74595-fig2-data4-v2.xlsx
-
Figure 2—source data 5
Source data for Figure 2W.
- https://cdn.elifesciences.org/articles/74595/elife-74595-fig2-data5-v2.xlsx
Typically, cell proliferation and differentiation are inversely correlated. Differentiation of precursor cells is generally associated with arrested proliferation and permanently exiting the cell cycle (Ruijtenberg and van den Heuvel, 2016). To test whether cell differentiation was affected in the CNC-derived palatal mesenchyme in Wnt1Cre;Kdm6bfl/fl mice, we examined the distribution of the early osteogenesis marker RUNX2 and the later osteogenesis marker SP7 in the palatal region from E13.5 to E15.5 (Figure 2I–R). There was a decrease in the number of RUNX2+ cells in the palatal mesenchyme at both E13.5 and E14.5 in Wnt1Cre;Kdm6bfl/fl mice in comparison to the control (Figure 2I–L and Q). In addition, SP7+ cells were also decreased in Wnt1Cre;Kdm6bfl/fl mice at both E14.5 and E15.5 (Figure 2M–P and R). Furthermore, when we induced osteogenic differentiation in palatal mesenchymal cells from E13.5 embryos for 3 weeks, we found that cells from Wnt1Cre;Kdm6bfl/fl mice showed much less calcium deposition than cells from control mice, indicating a reduction in osteogenic potential in cells from Kdm6b mutant mice (Figure 2S–W). These results indicated that Kdm6b was indispensable for maintaining normal proliferation and differentiation of CNC-derived cells.
Loss of Kdm6b in CNC-derived cells disturbs P53 pathway-mediated activity
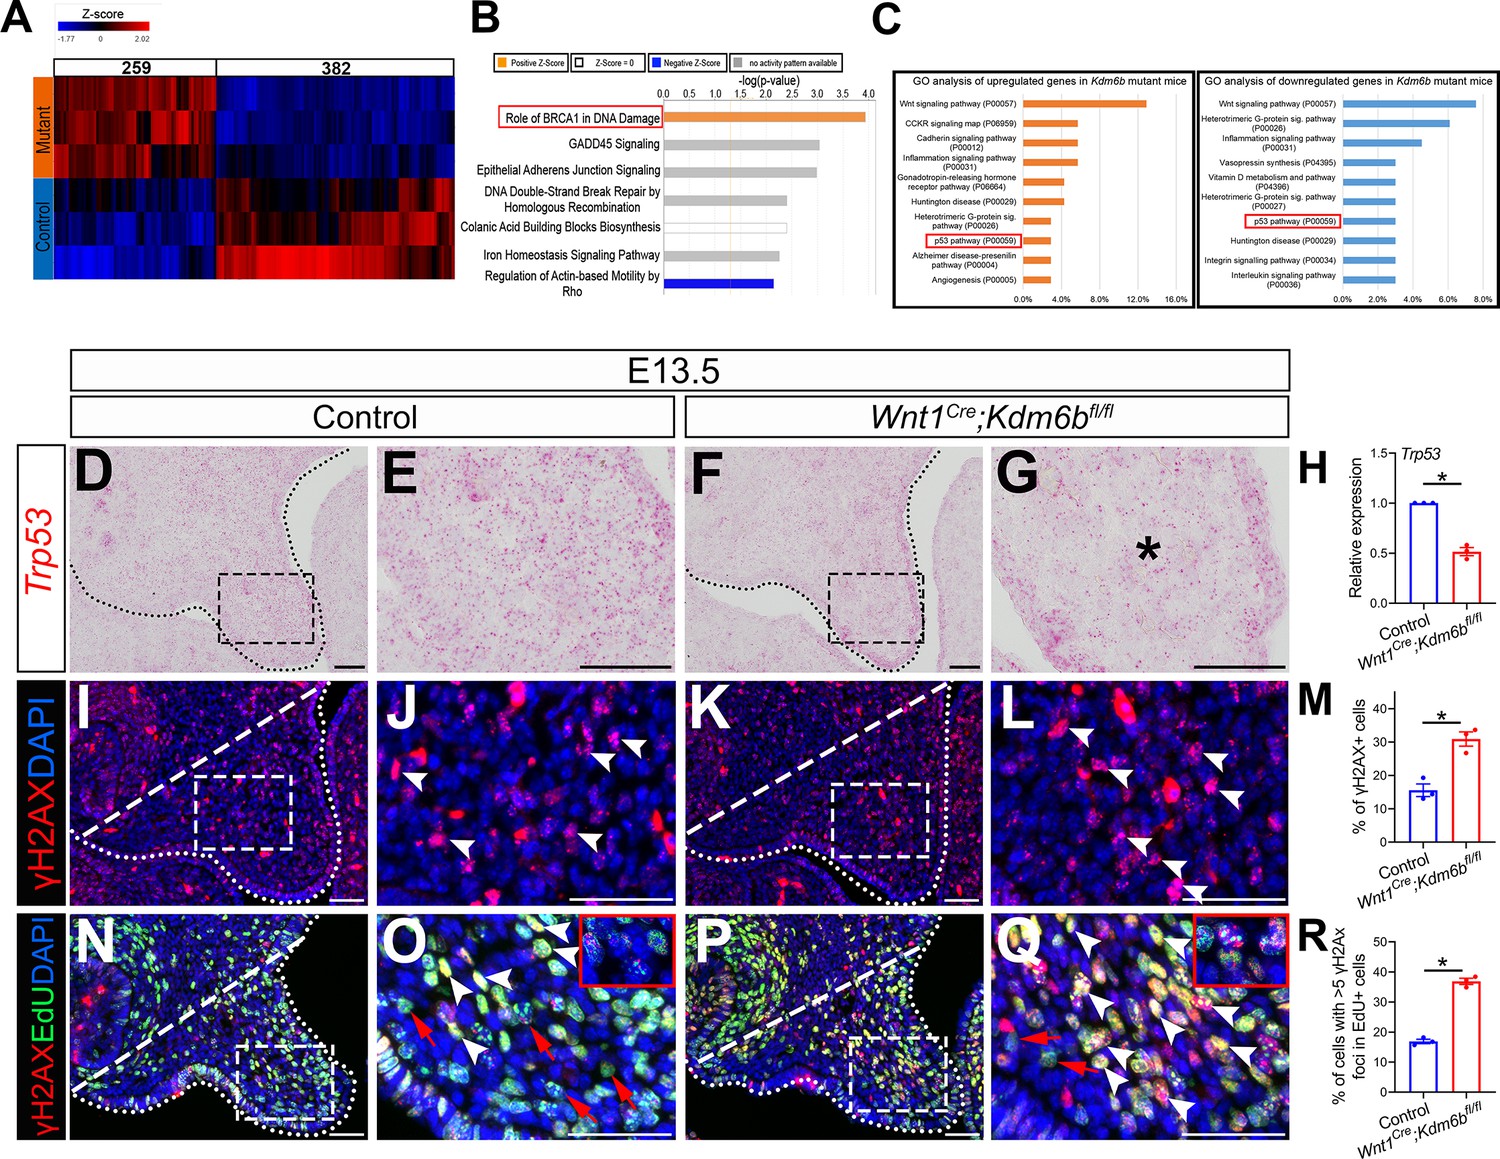
In order to identify the downstream targets of Kdm6b in the palatal mesenchyme, we performed RNA-seq analysis of palatal tissue at E12.5. The results showed that more genes were downregulated than upregulated in the palatal mesenchyme in Wnt1Cre;Kdm6bfl/fl mice (Figure 3A), which is consistent with the function of Kdm6b in removing the repressive mark H3K27me3. We further used Ingenuity Pathway Analysis (IPA) and Gene Ontology (GO) analysis to analyze the pathways that were most disturbed in the palatal mesenchyme in Kdm6b mutant mice. Surprisingly, both analyses indicated that pathways involving Trp53 might be disturbed in the palatal mesenchyme in Wnt1Cre;Kdm6bfl/fl mice (Figure 3B and C).
Figure 3
P53 signaling pathway is disturbed in Wnt1Cre;Kdm6bfl/fl mice.
(A) Bulk RNA-seq of palatal tissues collected at E12.5 represented in heatmap. Differentially expressed genes were selected using p<0.05 and fold change <–1.2 or >1.2. (B) Top seven signaling pathways disturbed in Kdm6b mutant mice, identified by Ingenuity Pathway Analysis. Red box indicates the top upregulated pathway observed in Wnt1Cre;Kdm6bfl/fl sample. (C) Top 10 signaling pathways identified by Gene Ontology analysis using differentially expressed genes identified by bulk RNA-seq analysis. Red box indicates P53 signaling is one of the top 10 pathways. X-axis shows the percentage of genes hit against total number of pathways hit. (D–G) Expression of Trp53 at E13.5 using RNAscope in situ hybridization. Dotted lines in (D, F) indicate palatal shelf. (E, G) are magnified images of boxes in (D, F). Asterisk in (G) indicates decreased expression of Trp53 observed in Wnt1Cre;Kdm6bfl/fl mice. Scale bar: 50 µm. (H) RT-qPCR quantification of Trp53 in palatal tissues collected at E13.5. *p<0.05. (I–L) Immunostaining of γH2AX at E13.5. Dotted lines in (I, K) indicate palatal shelf and dashed lines indicate quantification area. (J, L) are magnified images of boxes in (I, K), respectively. Arrowheads in (J, L) indicate representative γH2AX+ cells. Scale bar: 50 µm. (M) Quantification of γH2AX+ cells represented in (I, K). *p<0.05. (N–Q) Co-localization of EdU and γH2AX at E13.5 after 2 hr of EdU labeling. Dotted lines in (N, P) indicate palatal shelf region, while dashed lines indicate the palatal region used for quantification in (R). (O, Q) are magnified images of boxes in (N, P), respectively. Red arrows in (O, Q) indicate representative EdU+ cells with less than five γH2AX foci, while white arrowheads indicate representative cells that are positive for EdU and with greater than five γH2AX foci. Scale bar: 50 µm. (R) Quantification of EdU+ cells with greater than five γH2AX foci represented in (N, P).*p<0.05.
-
Figure 3—source data 1
Source data for Figure 3H.
- https://cdn.elifesciences.org/articles/74595/elife-74595-fig3-data1-v2.xlsx
-
Figure 3—source data 2
Source data for Figure 3M.
- https://cdn.elifesciences.org/articles/74595/elife-74595-fig3-data2-v2.xlsx
-
Figure 3—source data 3
Source data for Figure 3R.
- https://cdn.elifesciences.org/articles/74595/elife-74595-fig3-data3-v2.xlsx
The tumor suppressor P53 plays prominent roles in regulating DNA damage response, including arresting cell growth for DNA repair, directing cellular senescence, and activating apoptosis (Mijit et al., 2020). Mutation of Trp53 is a major cause of cancer development (Williams and Schumacher, 2016). Previous research has shown that some homozygous Trp53 mutant mice exhibit craniofacial defects, including cleft palate, while inappropriate activation of Trp53 during embryogenesis also causes developmental defects, including craniofacial abnormalities (Tateossian et al., 2015; Bowen et al., 2019). These results suggest that precise dosage of Trp53 is indispensable for craniofacial development. We analyzed the expression of Trp53 in our samples and found that it significantly decreased in the palatal region of the Kdm6b mutant mice (Figure 3D–H). These results indicate that Kdm6b plays an important role in regulating the P53 pathway in the CNC-derived mesenchyme during palatogenesis. To further evaluate the consequence of downregulated Trp53 in Wnt1Cre;Kdm6bfl/fl mice, we assessed DNA damage, which are tightly related to the function of Trp53, in our study. We found that DNA damage increased, as indicated by γH2AX expression, in the palatal mesenchyme in Wnt1Cre;Kdm6bfl/fl mice (Figure 3I–M). More importantly, we observed significantly increased γH2AX foci in the EdU+ cells of Wnt1Cre;Kdm6bfl/fl palatal mesenchyme (Figure 3N–R). These data indicated that actively proliferating cells in Wnt1Cre;Kdm6bfl/fl mice experienced more severe DNA damage compared to those in the control mice, which might be the result of replication stress caused by the hyperproliferation we observed in Wnt1Cre;Kdm6bfl/fl mice.
Altered Trp53 expression is responsible for the developmental defects in Wnt1Cre;Kdm6bfl/fl mice
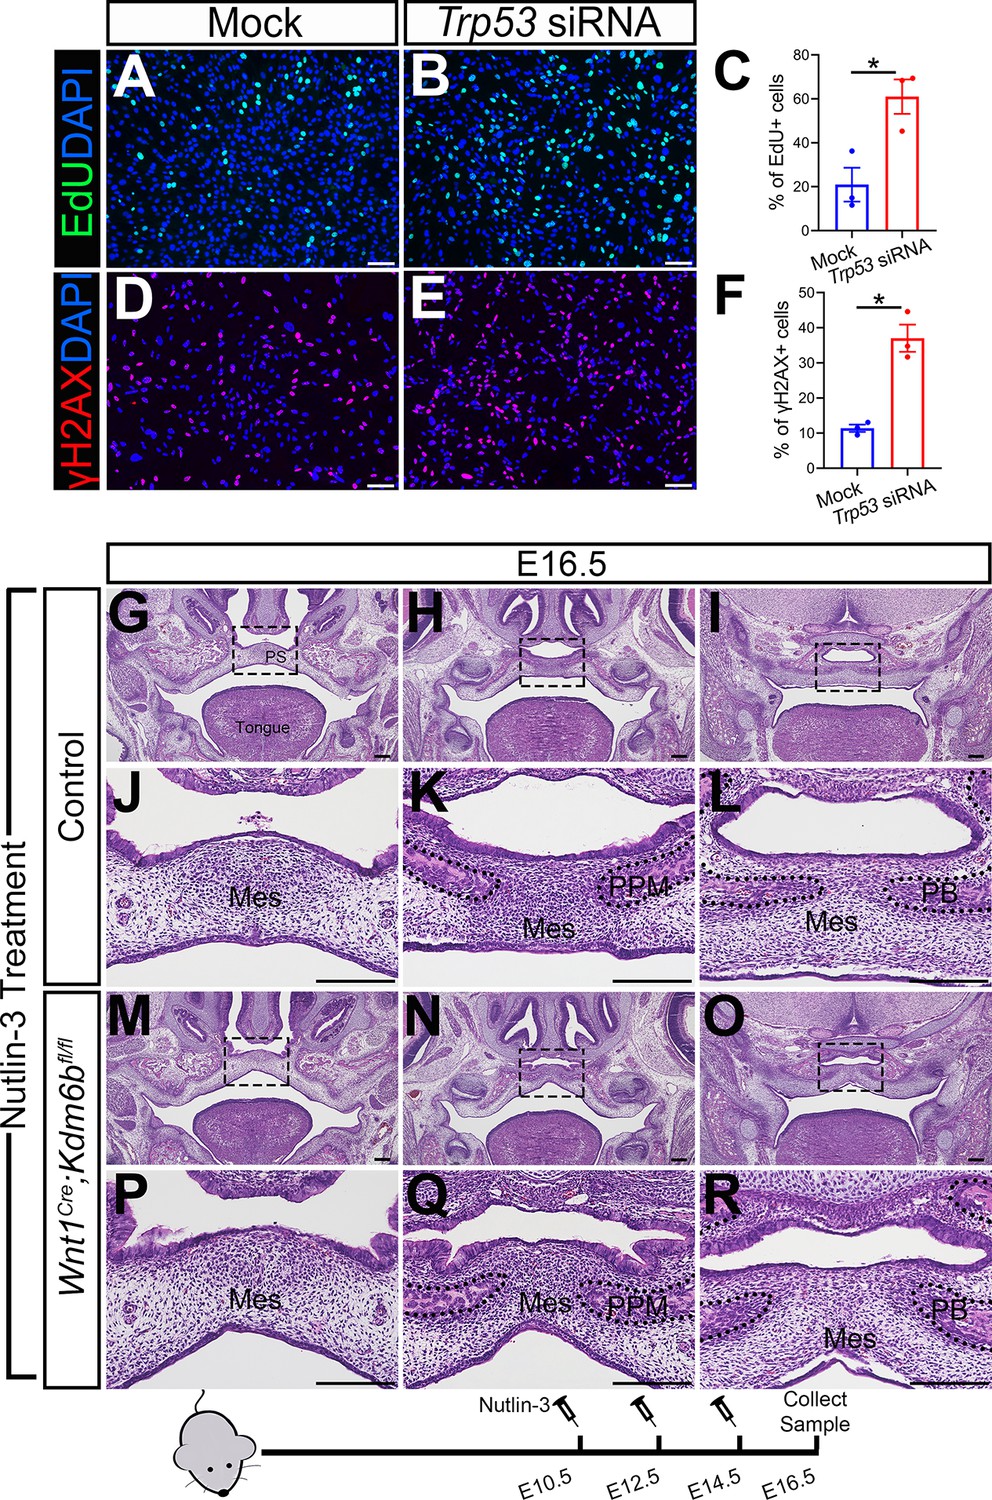
To further test whether downregulated expression of Trp53 is a key factor in the developmental defects we observed in Wnt1Cre;Kdm6bfl/fl mice, we transfected palatal mesenchymal cells from control mice with siRNA to knock down Trp53. qPCR revealed that the expression of Trp53 was significantly decreased in the cells treated with siRNA after 3 days (Figure 4—figure supplement 1A). At the same time, the group transfected with siRNA for Trp53 showed a significant increase in EdU+ cells (Figure 4A–C). In addition, significantly increased γH2AX+ cells were also observed in the group transfected with siRNA for Trp53 (Figure 4D–F). These data suggested that downregulated expression of Trp53 in the palatal mesenchymal cells is a key factor that led to the hyperproliferation and increased DNA damage we observed in Wnt1Cre;Kdm6bfl/fl mice. Furthermore, expression of both Runx2 and Sp7 was also significantly reduced in the palatal mesenchymal cells transfected with siRNA for Trp53 (Figure 4—figure supplement 1B and C), which indicated that the downregulated expression of Trp53 in the palatal mesenchymal cells resulted in differentiation defects, which were also observed in Wnt1Cre;Kdm6bfl/fl mice.
Figure 4 with 1 supplement see all
Altered Trp53 expression is responsible for the developmental defects in Wnt1Cre;Kdm6bfl/fl mice.
(A–C) Cells collected from E13.5 palatal tissue are transfected with siRNA to knock down expression of Trp53. Cell proliferation is evaluated using EdU labeling 3 days after transfection. (A, B) show proliferation of cells assessed by EdU labeling. Difference in EdU+ cells between mock- and siRNA-transfected groups is quantified in (C). Scale bar: 100 µm. *p<0.05. (D–F) Cells collected from E13.5 palatal tissue are transfected with siRNA to knock down expression of Trp53. DNA damage is evaluated using γH2AX 3 days after transfection. (D, E) show γH2AX+ cells. Difference in γH2AX+ cells between mock- and siRNA-transfected groups is quantified in (F). Scale bar: 100 µm. *p<0.05. (G–R) Histological analysis of control and Wnt1Cre;Kdm6bfl/fl mice treated with Nutlin-3. (J–L, P–R) are magnified images of boxes in (G–I, M–O), respectively. Scale bar: 200 µm. Mes: mesenchyme; PPM: palatine process of maxilla; PB: palatine bone.
-
Figure 4—source data 1
Source data for Figure 4C.
- https://cdn.elifesciences.org/articles/74595/elife-74595-fig4-data1-v2.xlsx
-
Figure 4—source data 2
Source data for Figure 4F.
- https://cdn.elifesciences.org/articles/74595/elife-74595-fig4-data2-v2.xlsx
To further investigate the function of Trp53 in Wnt1Cre;Kdm6bfl/fl mice, we tried to increase P53 in Kdm6b mutant mice using available small molecules. Previous research showed that MDM2, a ubiquitin ligase, specifically targets P53 for degradation and there is increased P53 activity in Mdm2 mutant mice, which exhibit a range of developmental defects (Arya et al., 2010; Bowen and Attardi, 2019; Bowen et al., 2019). Nutlin-3, an MDM2 inhibitor that can specifically interrupt interaction between MDM2 and P53, increases P53 in mouse primary neural stem progenitor cells and rescues neurogenic deficits in Fmr1 KO mice (Li et al., 2016). We treated pregnant mice with Nutlin-3 at a dosage based on their body weight at E10.5, E12.5, and E14.5 of pregnancy and then collected samples at E16.5 for analysis. To assess the potential influence of the solvent used to dissolve Nutlin-3 (10% DMSO in corn oil), we also treated mice with 10% DMSO in corn oil at the same embryonic stages. None of the Kdm6b mutant mice were rescued after this treatment (N = 3) (Figure 4—figure supplement 1D and E). In contrast, Nutlin-3 treatment successfully rescued the cleft palate in three out of five Wnt1Cre;Kdm6bfl/fl mice (Figure 4G–R). The remaining two showed a normal hard palate, but presented with posterior soft palate defects. Western blot analysis showed that the protein level of P53 was successfully restored in the Nutlin-3-treated group (Figure 4—figure supplement 1F and G). This result further revealed that downregulation of Trp53 in Wnt1Cre;Kdm6bfl/fl mice plays an essential role in the palatal defects. The genetic interaction between Kdm6b and Trp53 is important for the development of post-migratory CNCCs.
Level of H3K27me3 is antagonistically regulated by Kdm6b and Ezh2 during palatogenesis
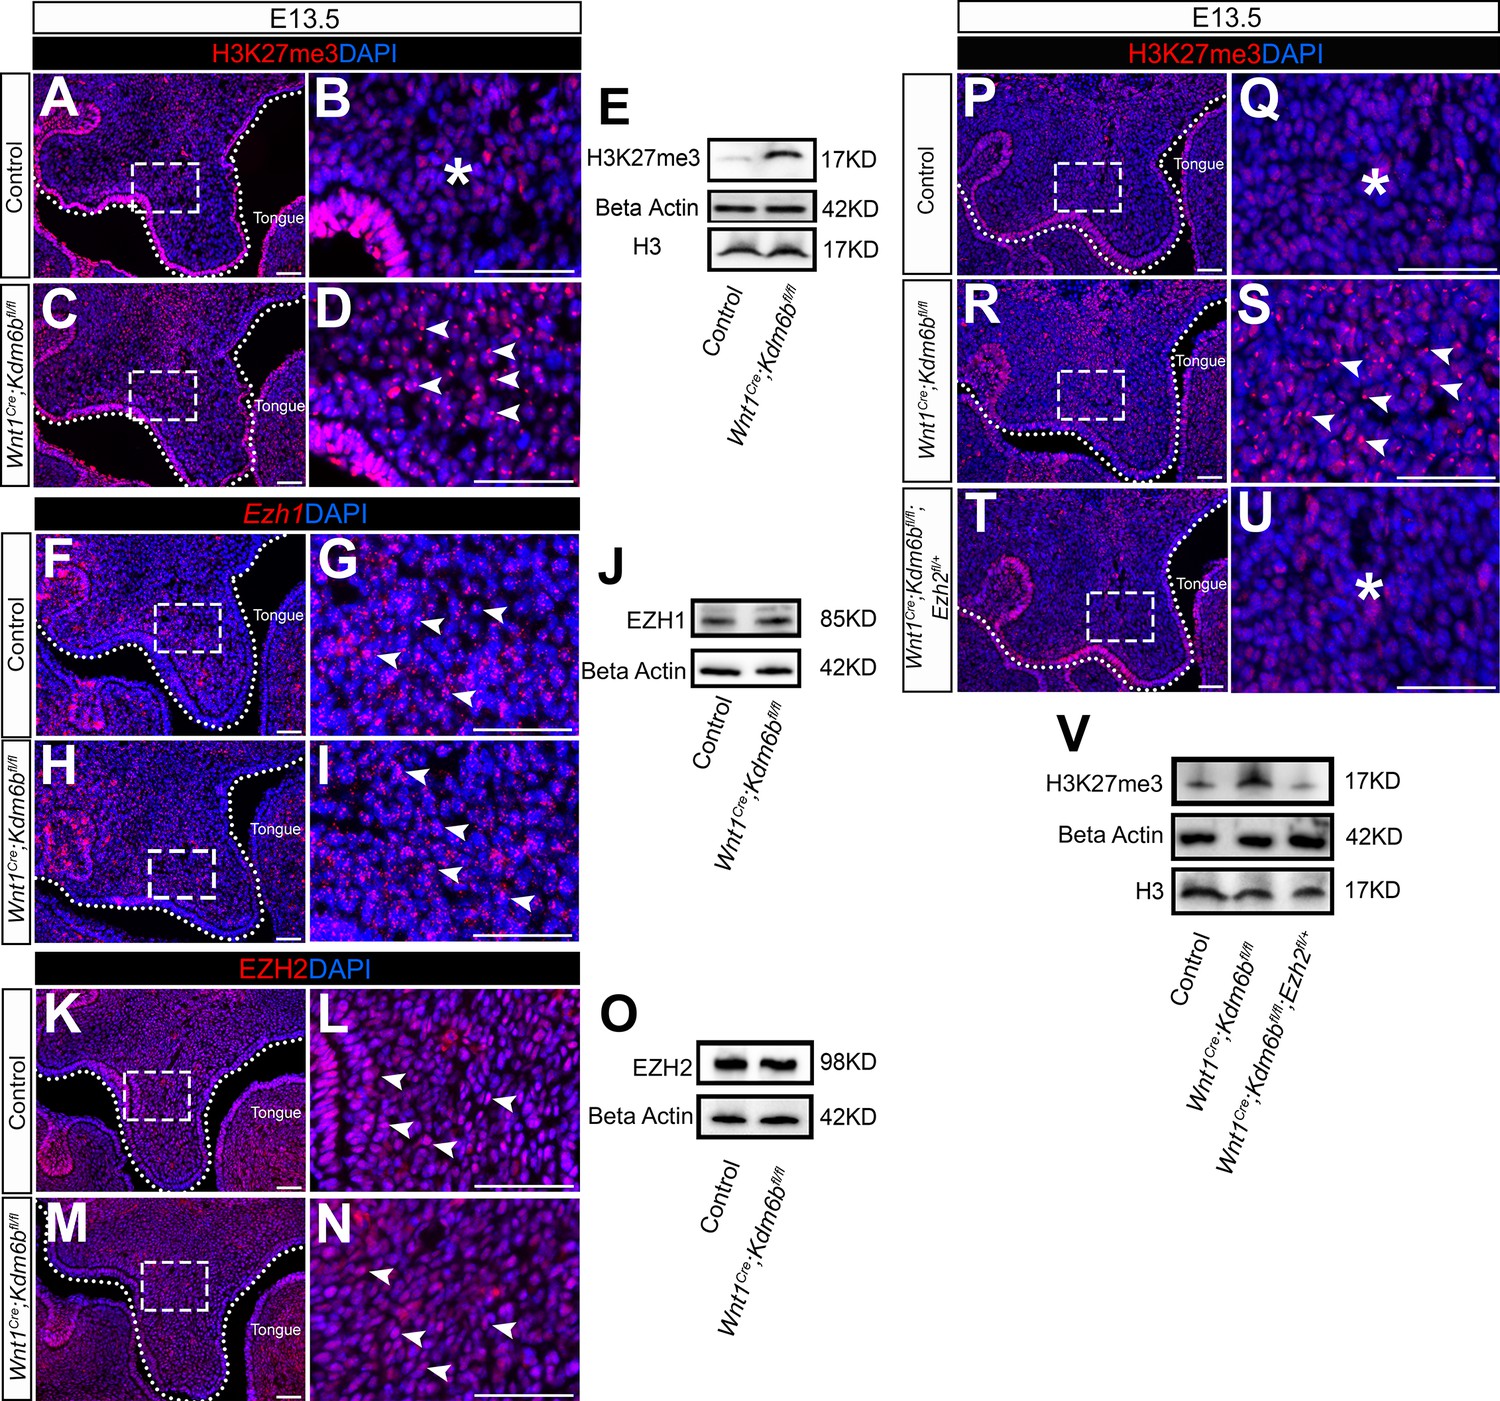
The lysine-specific demethylase KDM6B is able to activate gene expression via removing the H3K27me3 repressive mark (Jiang et al., 2013). To investigate whether Kdm6b regulates the expression of Trp53 through modifying the level of H3K27me3, we first examined the status of H3K27me3 in our samples and found that loss of Kdm6b in CNC-derived cells resulted in accumulation of H3K27me3 in the nucleus of CNC-derived palatal mesenchymal cells (Figure 5A–D). Furthermore, immunoblotting revealed that the level of H3K27me3 was increased in the palatal region of Kdm6b mutant mice (Figure 5E). Since the level of H3K27me3 can also be modified by the methyltransferases EZH1 and EZH2, we further evaluated whether expression of EZH1 and EZH2 was affected in the palatal region. We found no obvious differences in either the distribution of Ezh1+ cells or the EZH1 protein level between control and Kdm6b mutant mice (Figure 5F–J). Similarly, no dramatic changes were observed in either the distribution of EZH2+ cells or its protein level between control and Kdm6b mutant mice (Figure 5K–O). These results indicated that increased H3K27me3 in Wnt1Cre;Kdm6bfl/fl mice was mainly caused by loss of Kdm6b in CNC-derived cells. However, we did notice a broader contribution and stronger signal of EZH2 than EZH1 in the CNC-derived palatal mesenchyme. To investigate whether an increase of H3K27me3 in the CNC-derived cells caused the cleft phenotype we observed in Wnt1Cre;Kdm6bfl/fl mice, we generated Wnt1Cre;Kdm6bfl/fl;Ezh2fl/+ mice and assessed the level of H3K27me3 in this model. In Wnt1Cre;Kdm6bfl/fl;Ezh2fl/+ mice, we observed a rescue of the abnormal accumulation of H3K27me3 (Figure 5P–V). More importantly, haploinsufficiency of Ezh2 in this model successfully rescued the cleft palate phenotype observed in Wnt1Cre;Kdm6bfl/fl mice (Figure 6A–O) with 70% efficiency (N = 10). CT scanning showed that both the palatine processes of the maxilla and palatine bone were restored in the Wnt1Cre;Kdm6bfl/fl;Ezh2fl/+ mice (Figure 6A–C). Both bone and palatal mesenchymal tissue were rescued in Wnt1Cre;Kdm6bfl/fl;Ezh2fl/+ mice (Figure 6D–O). Furthermore, both EdU+ and RUNX2+ cells were restored to normal levels in Wnt1Cre;Kdm6bfl/fl;Ezh2fl/+ mice (Figure 7A–H). These results suggested that an antagonistic interaction between the histone demethylase KDM6B and methyltransferase EZH2 that modulates H3K27me3 is essential for palatogenesis.
Figure 5
Level of H3K27me3 is antagonistically regulated by Kdm6b and Ezh2 during palatogenesis.
(A–E) Contribution of H3K27me3 in the palatal shelf is evaluated using immunostaining and Western blot at E13.5. Dotted lines in (A, C) indicate palatal shelf region. (B, D) are magnified images of boxes in (A, C). Asterisk in (B) indicates no accumulation of H3K27me3 observed in control mice. Arrowheads in (D) indicate accumulation of H3K27me3 observed in Wnt1Cre;Kdm6bfl/fl mice. Scale bar: 50 µm. (F–J) Contribution of Ezh1 in the palatal shelf is evaluated using RNAscope in situ hybridization and Western blot at E13.5. Dotted lines in (F, H) indicate palatal shelf region. (G, I) are magnified images of boxes in (F, H). Arrowheads in (G, I) indicate representative Ezh1+ cells. Scale bar: 50 µm. (K–O) Contribution of EZH2 in the palatal shelf is evaluated using immunostaining and Western blot at E13.5. Dotted lines in (K, M) indicate palatal shelf region. (L, N) are magnified images of boxes in (K, M). Arrowheads in (L, N) indicate representative EZH2+ cells. Scale bar: 50 µm. (P–V) Contribution of H3K27me3 in the palatal shelf of control mice, Kdm6b mutant mice, and EZH2 haploinsufficient model is evaluated using immunostaining and Western blot at E13.5. Dotted lines in (P, R, T) indicate palatal shelf region. (Q, S, U) are magnified images of boxes in (P, R, T), respectively. Asterisks in (Q, U) indicate no accumulation of H3K27me3 observed in control (Q) and Wnt1Cre;Kdm6bfl/fl;Ezh2fl/+ mice (U). White arrowheads in (S) indicate accumulation of H3K27me3 observed in Wnt1Cre;Kdm6bfl/fl mice. Scale bar: 50 µm.
-
Figure 5—source data 1
Source data for Figure 5E.
- https://cdn.elifesciences.org/articles/74595/elife-74595-fig5-data1-v2.zip
-
Figure 5—source data 2
Source data for Figure 5J.
- https://cdn.elifesciences.org/articles/74595/elife-74595-fig5-data2-v2.zip
-
Figure 5—source data 3
Source data for Figure 5O.
- https://cdn.elifesciences.org/articles/74595/elife-74595-fig5-data3-v2.zip
-
Figure 5—source data 4
Source data for Figure 5V.
- https://cdn.elifesciences.org/articles/74595/elife-74595-fig5-data4-v2.zip
Figure 6
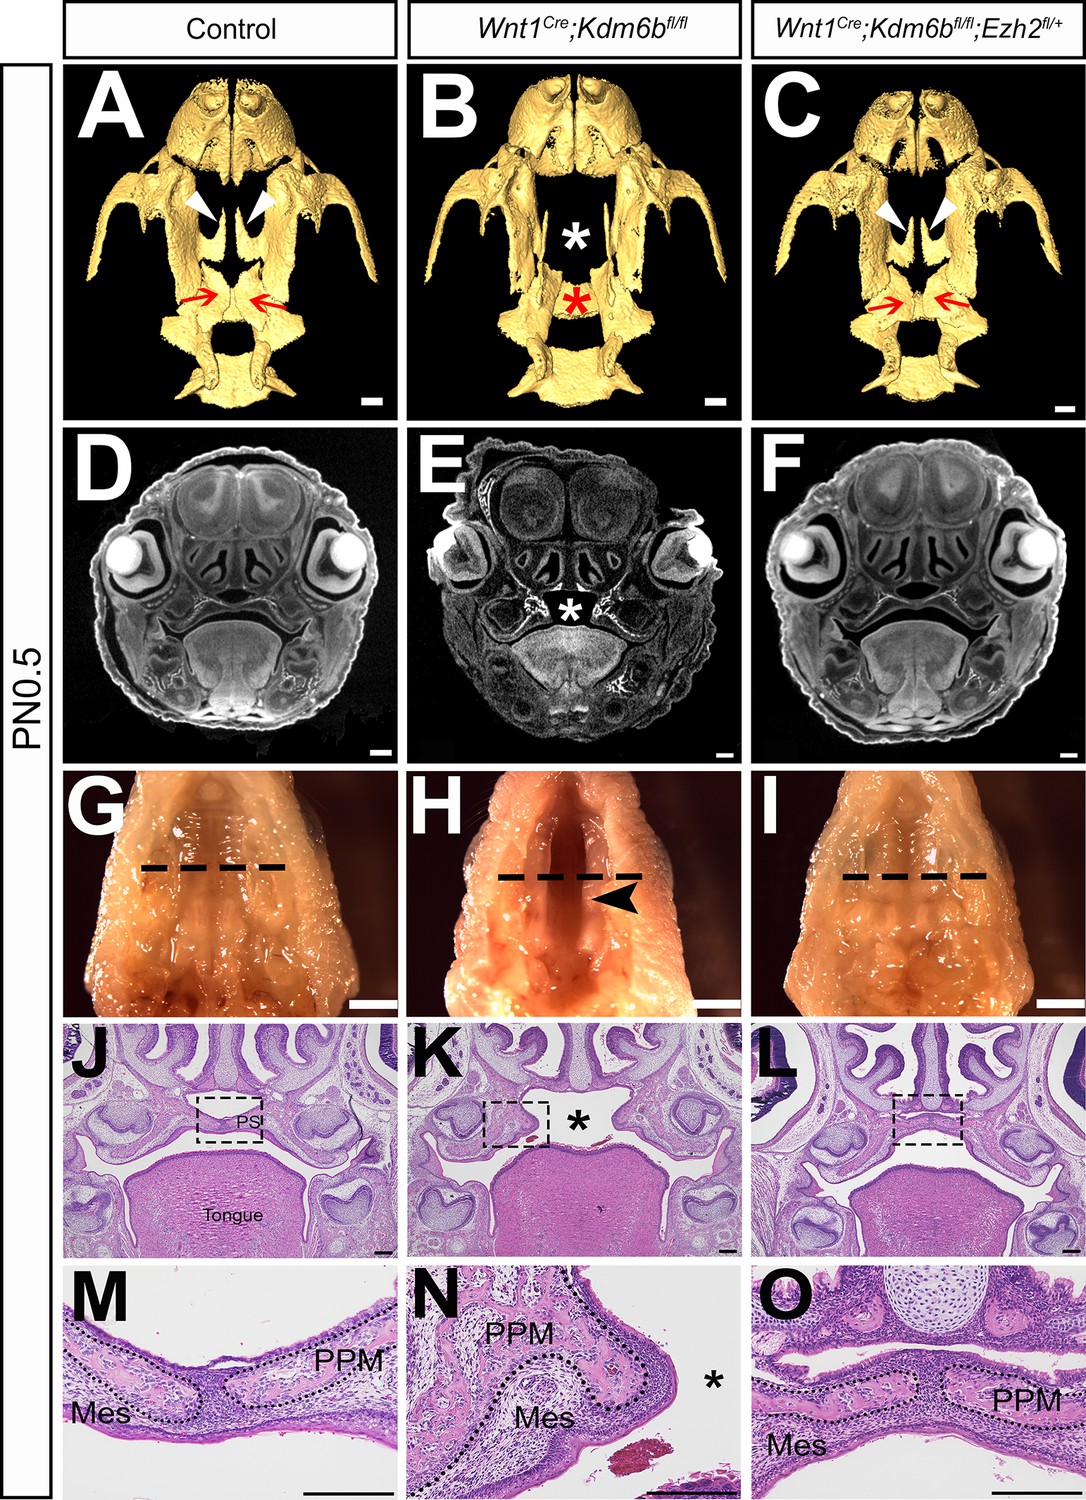
Haploinsufficiency of Ezh2 rescues cleft palate in Wnt1Cre;Kdm6bfl/fl;Ezh2fl/+ mice.
(A–C) CT images at PN0.5. White arrowheads in (A, C) indicate palatine process of maxilla (PPM) observed in control and Wnt1Cre;Kdm6bfl/fl;Ezh2fl/+ rescue model. Red arrows in (A, C) indicate palatine bone observed in control and Wnt1Cre;Kdm6bfl/fl;Ezh2fl/+ rescue model. White asterisk in (B) indicates missing palate PPM in Wnt1Cre;Kdm6bfl/fl mice, and red asterisk indicates missing palatine bone in Kdm6b mutant mice. Scale bar: 0.4 mm. (D–F) Coronal views of CT images at PN0.5. Asterisk in (E) indicates cleft palate observed in Wnt1Cre;Kdm6bfl/fl mice. Scale bar: 0.3 mm. (G–I) Whole-mount oral view at PN0.5. Arrowhead in (H) shows complete cleft palate observed in Wnt1Cre;Kdm6bfl/fl mice. Dashed lines in (G–I) indicate location of sections in (J–O). Scale bar: 2 mm. (J–O) Histological analysis of samples at PN0.5. Asterisk in (K, N) indicates cleft palate in Wnt1Cre;Kdm6bfl/fl mice. (M–O) are magnified images of boxes in (J–L), respectively. Dotted lines in (M–O) outline the bone structure. Scale bar: 200 µm. Mes: mesenchyme.
Figure 7
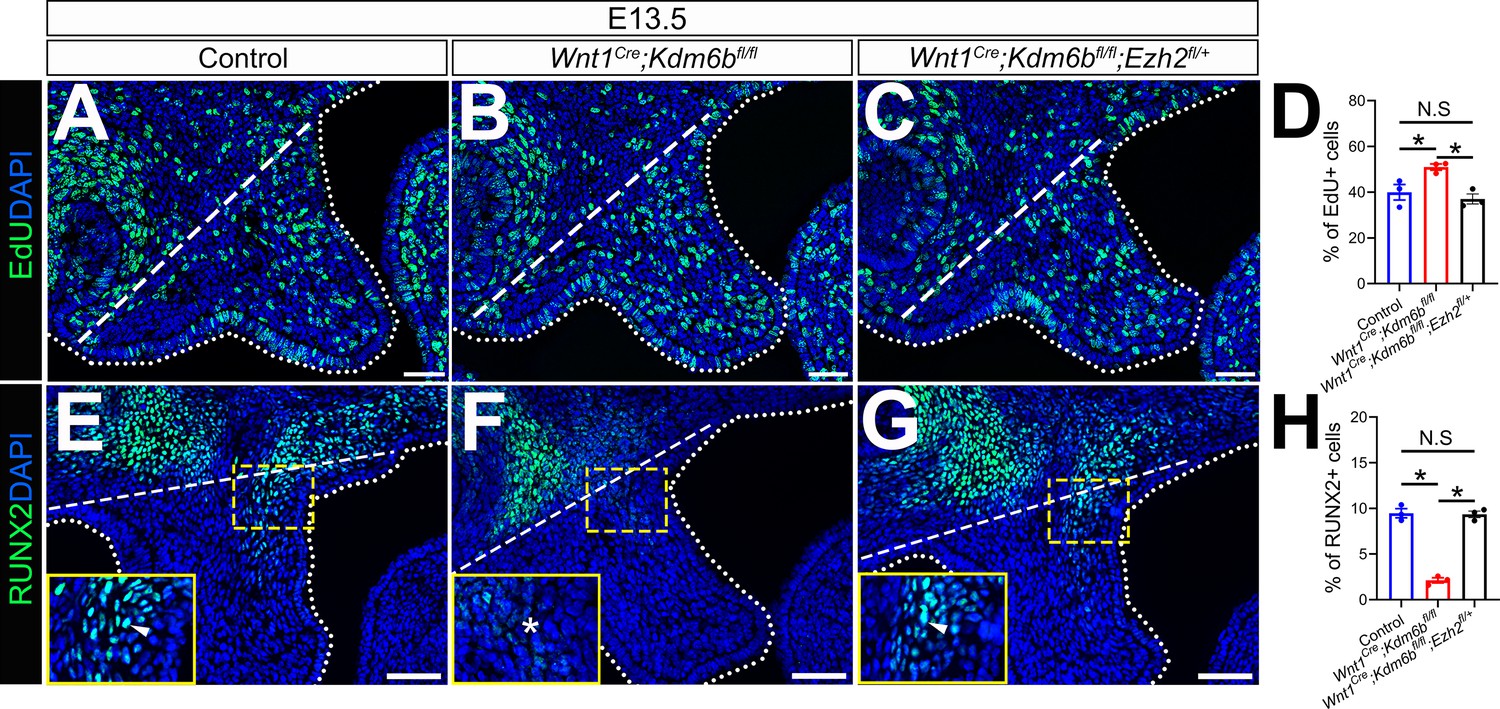
EdU+ and RUNX2+ cells are restored in Wnt1Cre;Kdm6bfl/fl;Ezh2fl/+ mice.
(A–C) Immunostaining of EdU at E13.5 after 2 hr of EdU labeling. Dotted lines indicate palatal shelf region. Dashed lines indicate the palatal region used for quantification in (D). Scale bar: 50 µm. (D) Quantification of EdU+ cells represented in (A–C). ANOVA is used for statistical analysis. *p<0.05. N.S: not significant. (E–G) Immunostaining of RUNX2 at E13.5. Dotted lines indicate palatal shelf region. Dashed lines indicate the palatal region used for quantification in (H). Scale bar: 50 µm. (H) Quantification of RUNX2+ cells represented in (E–G). ANOVA is used for statistical analysis. *p<0.05. N.S: not significant.
-
Figure 7—source data 1
Source data for Figure 7D.
- https://cdn.elifesciences.org/articles/74595/elife-74595-fig7-data1-v2.xlsx
-
Figure 7—source data 2
Source data for Figure 7H.
- https://cdn.elifesciences.org/articles/74595/elife-74595-fig7-data2-v2.xlsx
Kdm6b activates expression of Trp53 through removing H3K27me3 at the promoter of Trp53 and interacts with transcription factor TFDP1 in regulating P53 signaling pathway
Chromatin accessibility represents the degree to which chromatinized DNA is able to physically interact with nuclear macromolecules such as transcription factors for gene regulation (Klemm et al., 2019). The repressive mark H3K27me3 is usually associated with facultative heterochromatin and results in transcriptional repression due to decreased chromatin accessibility (Wiles and Selker, 2017; Möller et al., 2019; den Broeder et al., 2020). The methyltransferase EZH2 and demethylases KDM6A/KDM6B can regulate the methylation status of H3K27 to affect gene expression (Pediconi et al., 2019). To test whether Kdm6b and Ezh2 can regulate expression of Trp53 via H3K27me3, we first examined whether deposition of H3K27me3 changes at the promoter of Trp53 in our models using ChIP-qPCR. A primer set was designed at 1127 bp upstream of Trp53 exon 1, and the results showed that deposition of H3K27me3 significantly increased at the promoter of Trp53 in the palatal region of Kdm6b mutant mice, while this increase was dampened in the Ezh2 haploinsufficiency model (Figure 8A). Meanwhile, haplosufficiency of Ezh2 in Wnt1Cre;Kdm6bfl/fl;Ezh2fl/+ mice was able to restore the decreased expression of Trp53 observed in the CNC-derived palatal mesenchyme of Wnt1Cre;Kdm6bfl/fl mice (Figure 8B–H). These data suggested that Kdm6b and Ezh2 co-regulate expression of Trp53 through H3K27me3. To further reveal whether KDM6B regulates the expression of Trp53 directly, we performed ChIP-qPCR using KDM6B antibody and found that deposition of KDM6B significantly increased at the promoter of Trp53 in the palatal region (Figure 8I). In addition, to test whether KDM6B has a unique role in activating Trp53 during palatogenesis, we transfected palatal mesenchymal cells from Kdm6b mutant mice with either a plasmid overexpressing Kdm6b or a plasmid overexpressing another histone demethylase, Kdm6a. Increased expression of Trp53 could be detected only in the group transfected with Kdm6b-overexpressing plasmid (Figure 8J and K, Figure 8—figure supplement 1A and B). These results indicated that Kdm6b has an essential and unique role in activating Trp53 during palatogenesis.
Figure 8 with 1 supplement see all
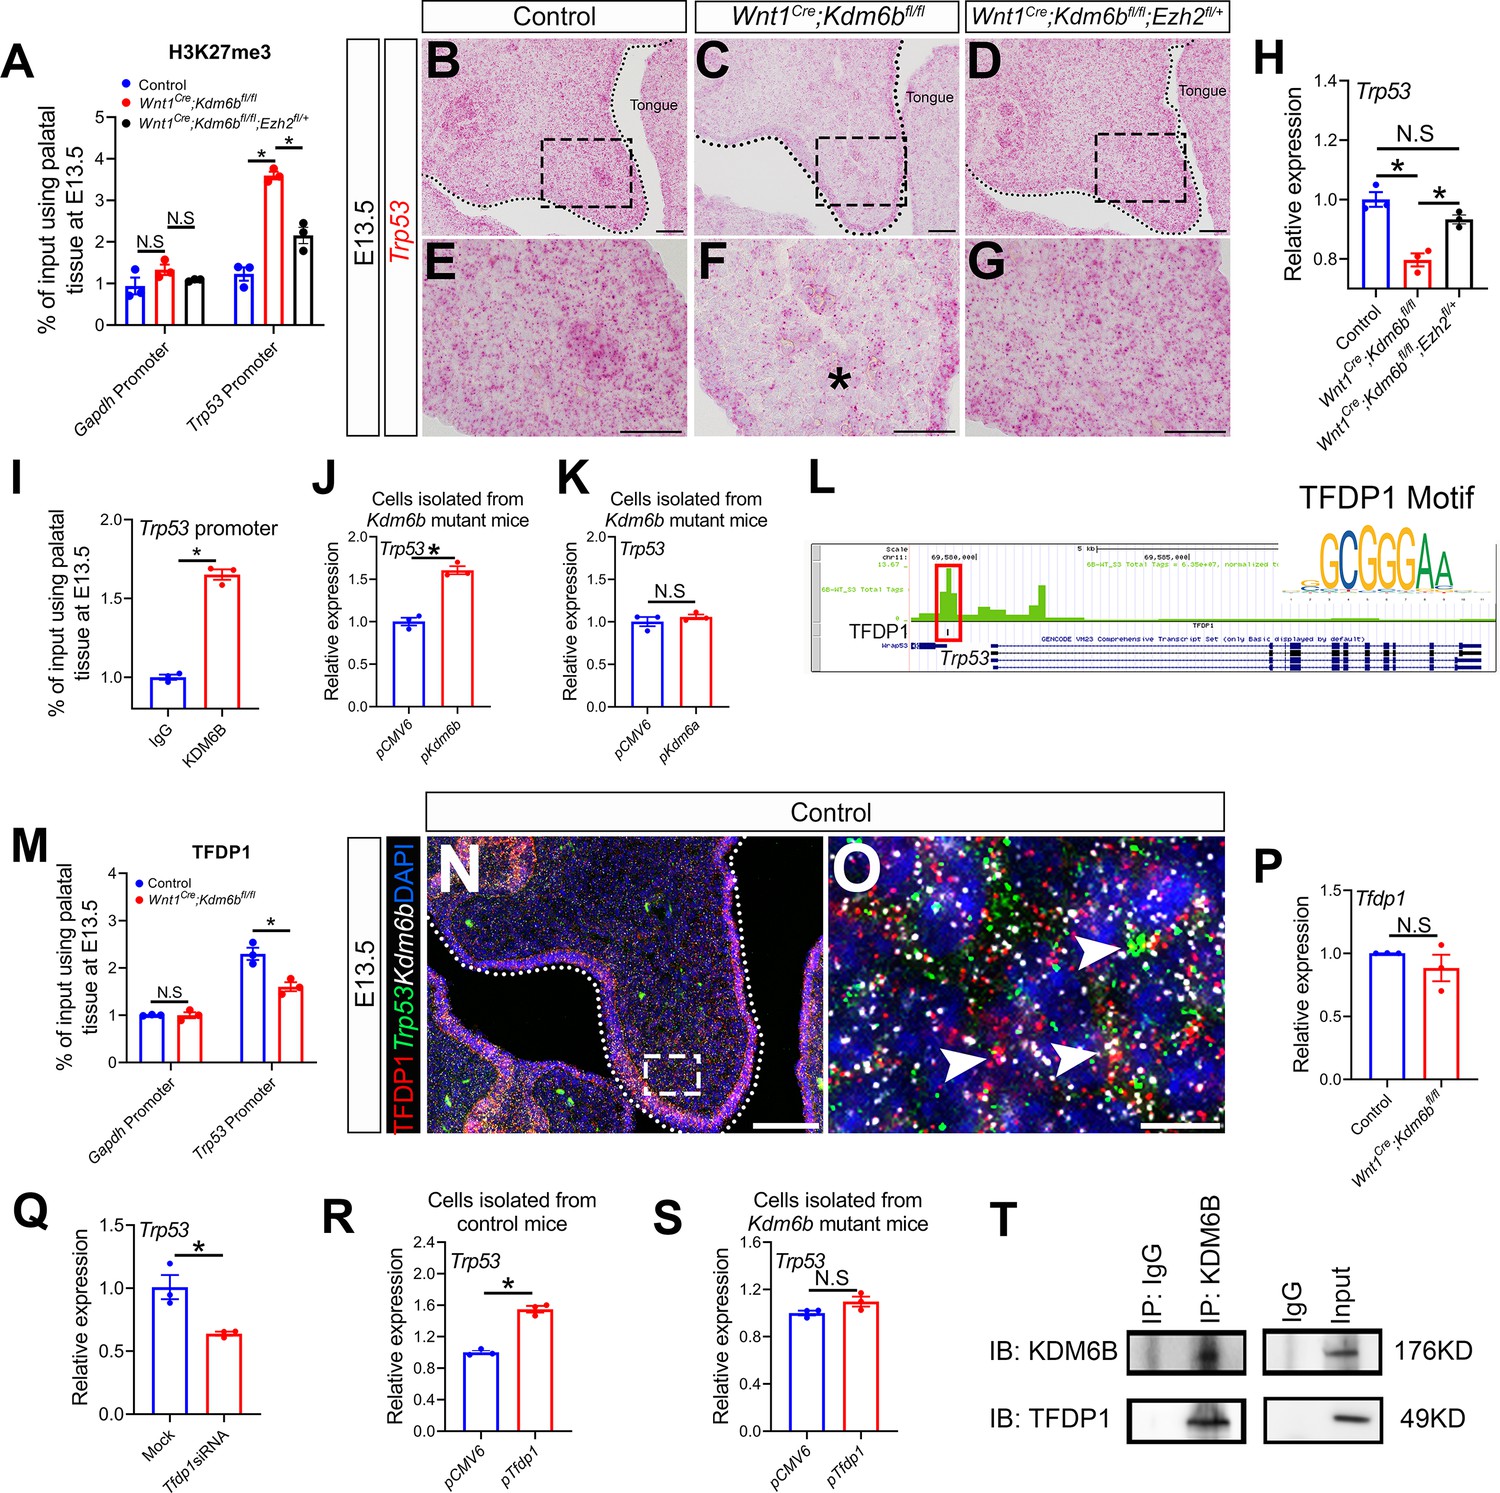
Kdm6b regulates expression of Trp53 through H3K27me3 and interacts with transcription factor TFDP1 in the activation of Trp53.
(A) ChIP-qPCR shows H3K27me3 deposition at the promoter region of Trp53 in palatal tissues of control, Kdm6b mutant, and Ezh2 haploinsufficient mice. ANOVA is used for statistical analysis. *p<0.05. N.S: not significant. (B–G) Expression of Trp53 in the palatal region at E13.5 using RNAscope in situ hybridization. Dotted lines in (B–D) indicate palatal shelf. (E–G) are magnified images of boxes in (B–D), respectively. Asterisk in (F) indicates decreased expression of Trp53 observed in Wnt1Cre;Kdm6bfl/fl mice. Scale bar: 50 µm. (H) RT-qPCR analysis of Trp53 expression in the palatal region of control, Kdm6b mutant, and Ezh2 haploinsufficient mice. ANOVA is used for statistical analysis. *p<0.05. N.S: not significant. (I) ChIP-qPCR shows KDM6B deposition at the promoter region of Trp53 in the palatal tissue of control mice. *p<0.05. (J, K) RT-qPCR analysis of Trp53 expression in palatal mesenchymal cells transfected with Kdm6b- or Kdm6a-overexpressing plasmids. *p<0.05. N.S: not significant. (L) ATAC-seq analysis indicates that the promoter region of Trp53 is accessible for transcription factor TFDP1. (M) ChIP-qPCR using palatal tissue shows that binding of TFDP1 to the promoter of Trp53 decreases in the Kdm6b mutant mice. *p<0.05. N.S: not significant. (N, O) Co-localization of TFDP1, Kdm6b, and Trp53 at E13.5 using immunostaining and RNAscope in situ hybridization. Dotted lines in (N) indicate palatal shelf. (O) is a magnified image of the box in (N). Arrowheads in (O) indicate representative cells that are positive for TFDP1, Kdm6b, and Trp53. Scale bar: 50 µm in (N) and 5 µm in (O). (P) RT-qPCR quantification shows the expression of Tfdp1 in samples collected at E13.5. N.S: not significant. (Q) RT-qPCR analysis of Trp53 expression in palatal mesenchymal cells after Tfdp1 siRNA transfection. *p<0.05. (R, S) RT-qPCR analysis of Trp53 expression in palatal mesenchymal cells transfected with Tfdp1 overexpressing plasmid. (R) *p<0.05. N.S: not significant. (T) Co-immunoprecipitation (Co-IP) experiment using protein extract from palatal tissues indicates that KDM6B and TFDP1 are present in the same complex. Anti-KDM6B antibody was used for immunoprecipitation (IP). IgG served as negative control. IB: immunoblotting.
-
Figure 8—source data 1
Source data for Figure 8A.
- https://cdn.elifesciences.org/articles/74595/elife-74595-fig8-data1-v2.xlsx
-
Figure 8—source data 2
Source data for Figure 8H.
- https://cdn.elifesciences.org/articles/74595/elife-74595-fig8-data2-v2.xlsx
-
Figure 8—source data 3
Source data for Figure 8I.
- https://cdn.elifesciences.org/articles/74595/elife-74595-fig8-data3-v2.xlsx
-
Figure 8—source data 4
Source data for Figure 8J.
- https://cdn.elifesciences.org/articles/74595/elife-74595-fig8-data4-v2.xlsx
-
Figure 8—source data 5
Source data for Figure 8K.
- https://cdn.elifesciences.org/articles/74595/elife-74595-fig8-data5-v2.xlsx
-
Figure 8—source data 6
Source data for Figure 8M.
- https://cdn.elifesciences.org/articles/74595/elife-74595-fig8-data6-v2.xlsx
-
Figure 8—source data 7
Source data for Figure 8P.
- https://cdn.elifesciences.org/articles/74595/elife-74595-fig8-data7-v2.xlsx
-
Figure 8—source data 8
Source data for Figure 8Q.
- https://cdn.elifesciences.org/articles/74595/elife-74595-fig8-data8-v2.xlsx
-
Figure 8—source data 9
Source data for Figure 8R.
- https://cdn.elifesciences.org/articles/74595/elife-74595-fig8-data9-v2.xlsx
-
Figure 8—source data 10
Source data for Figure 8S.
- https://cdn.elifesciences.org/articles/74595/elife-74595-fig8-data10-v2.xlsx
-
Figure 8—source data 11
Source data for Figure 8T.
- https://cdn.elifesciences.org/articles/74595/elife-74595-fig8-data11-v2.zip
As an H3K27me3 demethylase, KDM6B is important for the regulation of chromatin structure for gene expression. To target a specific sequence in genome, a histone demethylase needs to interact with DNA binding proteins such as transcription factors or IncRNAs (Dimitrova et al., 2015; Gurrion et al., 2017). To identify a transcription factor that can interact with KDM6B, we performed ATAC-seq analysis of palate tissue at E13.5. Through motif analysis, we found that the promoter region of Trp53 was accessible to members of the E2F transcription factor family (E2F4 and E2F6) and transcription factor TFDP1 (also known as Dp1), a binding partner of E2F family members (Figure 8L, Figure 8—figure supplement 1C). We noticed that this open region was also located at the Transcription start site (TSS) of Wrap53, which was previously reported to regulate endogenous Trp53 mRNA levels and P53 protein levels (Mahmoudi et al., 2009). To evaluate whether the decrease of Trp53 was caused by altered expression of Wrap53 in our model, we examined the expression of Wrap53 in the palatal region at E13.5. Almost no expression of Wrap53 was detected in the palatal region (Figure 8—figure supplement 1D and E). Previous research reported that inactivation of E2Fs resulted in milder phenotypes than those associated with loss of Tfdp1, which leads to early embryonic lethality (Kohn et al., 2003). This result suggested that TFDP1 may play a more critical role than E2Fs during embryonic development. A motif of TFDP1 was detected 1011 bp upstream of Trp53 exon 1, which is very close to the H3K27me3 deposition site, by ATAC-seq analysis. ChIP-qPCR using palate tissue at E13.5 also revealed that binding of TFDP1 to the promoter region of Trp53 decreased in the Kdm6b mutant mice (Figure 8M). Immunohistochemistry analysis showed that TFDP1+ cells were distributed in the palatal region and co-expressed with Trp53 and Kdm6b (Figure 8N and O). We also confirmed co-expression of Kdm6b and Tfdp1 in the palatal region (especially enriched in Pax9+, Aldh1a2+, and Twist1+ cells) using our previously published scRNA-seq data (Figure 8—figure supplement 1F; Han et al., 2021). Meanwhile, the expression level and distribution of TFDP1 were not affected in the palatal mesenchyme of Wnt1Cre;Kdm6bfl/fl mice (Figure 8P, Figure 8—figure supplement 1G and H). These data indicated that Tfdp1 is not a downstream target of Kdm6b. To further test whether Tfdp1 regulated expression of Trp53 in the palatal mesenchymal cells, we transfected palatal mesenchymal cells from control mice at E13.5 using siRNA to knock down Tfdp1. qPCR revealed that the expression of Trp53 was decreased in cells treated with siRNA for Tfdp1 (Figure 8Q, Figure 8—figure supplement 1I). This data further indicated that Trp53 is a direct downstream target of Tfdp1.
To reveal the function of Kdm6b-Tfdp1 interaction in the regulation of Trp53 during palatogenesis, we transfected palatal mesenchymal cells with Tfdp1-overexpressing plasmid and found that the expression of Trp53 increased in the cells from control mice but not in the cells from Wnt1Cre;Kdm6bfl/fl mice (Figure 8R and S, Figure 8—figure supplement 1J and K). This result suggested that Kdm6b is specifically required and plays an essential role in the activation of Trp53 through interaction with Tfdp1 during palatogenesis. We performed co-immunoprecipitation (Co-IP) experiments and found that KDM6B and TFDP1 were indeed involved in the same complex (Figure 8T). Collectively, these data suggested that KDM6B and TFDP1 work together to activate Trp53 expression in the palatal mesenchyme and play an important role in regulating palatogenesis (Figure 9).
Figure 9
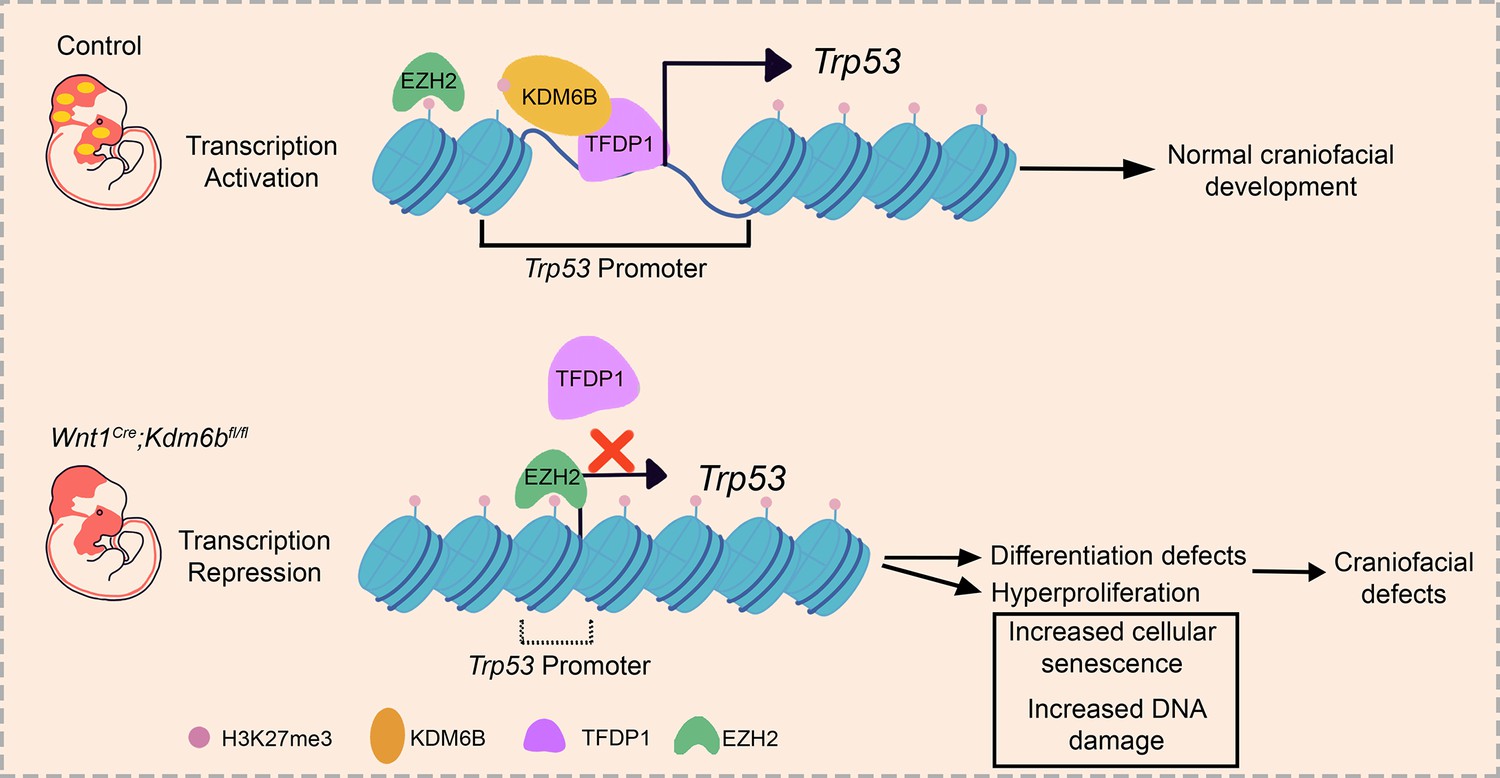
Summary schematic drawing.
Discussion
The development of an organism from a single cell to multiple different cell types requires tightly regulated gene expression (Bruneau et al., 2019). Transcription factors, which are among the key regulators of this process, are intimately involved in cell fate commitment (Nelms and Labosky, 2010; Soldatov et al., 2019). However, a transcription factor by itself cannot act on densely packed DNA in chromatin form. Thus, transcription factors must work in coordination with epigenetic regulatory mechanisms such as histone modifications, DNA methylation, chromatin remodeling, and others to dynamically regulate chromatin states for gene expression (Wilson and Filipp, 2018; Gökbuget and Blelloch, 2019). Insults to the epigenetic landscape due to genetic, environmental, or metabolic factors can lead to diverse developmental defects and diseases (Hobbs et al., 2014; Zoghbi and Beaudet, 2016; Flavahan et al., 2017). Cleft palate comprises 30% of orofacial clefts and can result from genetic mutations, environmental effects, or a combination thereof (Seelan et al., 2012). Much progress has been made in taking inventory of the gene mutations associated with craniofacial defects in recent years, and growing evidence has shown that epigenetic regulation plays an important role during neural crest development. For example, haploinsufficiency of KDM6A in humans causes severe psychomotor developmental delay, global growth restriction, seizures and cleft palate (Lindgren et al., 2013). Furthermore, studies have shown that Kdm6a and Arid1a are both indispensable during neural crest development (Chandler and Magnuson, 2016; Shpargel et al., 2017). DNA methyltransferase3A (DNMT3A) plays a critical role in mediating the transition from neural tube to neural crest fate (Hu et al., 2012). Meanwhile, loss of Ezh2, a component of PRC2, in CNC-derived cells completely prevents craniofacial bone and cartilage formation (Schwarz et al., 2014). These studies have clearly shown that epigenetic regulation is crucial for neural crest development. In this study, we further demonstrate the important role of epigenetic regulation during the neural crest contribution to palate development using Wnt1Cre;Kdm6bfl/fl mice as a model. We show that the demethylase KDM6B is not only required for normal CNC-derived palatal mesenchymal cell proliferation, but also for maintaining cell differentiation.
Epigenetic regulators, transcription factors, and lineage-specific genes work together to achieve spatiotemporally restricted, tissue-specific gene regulation (Hu et al., 2014). In this study, we reveal that Kdm6b works with the transcription factor Tfdp1 to specifically regulate the expression of Trp53 during palatogenesis. The molecular mechanisms underlying the function of Trp53 in genomic stability and tumor suppression have been studied extensively. However, the role of Trp53 in regulating the development of CNC-derived cells still remains largely unclear, although several studies have been conducted recently on certain aspects of this topic. For instance, it has been shown that Trp53 is able to coordinate CNC cell growth and epithelial-mesenchymal transition/delamination processes by modulating cell cycle genes and proliferation (Rinon et al., 2011). It has also been established that both deletion and overexpression of Trp53 result in craniofacial defects (Tateossian et al., 2015; Bowen et al., 2019). Furthermore, nuclear stabilization of P53 protein in Tcof+/- induces neural crest cell progenitors to undergo cell cycle arrest and caspase3-mediated apoptosis in the neuroepithelium. Inhibition of P53 function successfully rescues the neurocristopathy in an animal model of Treacher Collins syndrome, which results from mutation in Tcof1 (Jones et al., 2008). These studies have clearly shown that appropriate function of Trp53 is indispensable in CNCCs. However, none of these studies have addressed upstream regulation of Trp53 in CNCCs.
Here, we show that proper function of Trp53 during the differentiation and proliferation of CNCCs is orchestrated by Kdm6b and Ezh2 through H3K27me3. Altering the balance between Ezh2 and Kdm6b can cause abnormal H3K27me3 function, which further affects the downstream transcription factor Trp53. In addition, we have detected spontaneous DNA damage in the developing palate and increased accumulation of DNA damage in the Wnt1Cre;Kdm6bfl/fl mice. These findings further demonstrate the critical function of Trp53 in protecting embryonic cells from DNA damage during development. Furthermore, the ability of cells to proliferate is limited by the length of the telomeres, which gradually shorten during each cell replication (Blagoev, 2009). Once the telomeres are too short for DNA replication, the result is cellular senescence, which induces an irreversible inability to proliferate (Bernadotte et al., 2016). In this study, we show that downregulated expression of Trp53 in Wnt1Cre;Kdm6bfl/fl mice results in hyperproliferation and increased DNA damage in the proliferative cells, which might further lead to increased cell senescence. Previous studies reported that few Trp53-/- mice exhibit cleft palate or other craniofacial abnormalities, which suggests that loss of Trp53 alone is not powerful enough to cause defects during craniofacial development (Rinon et al., 2011; Tateossian et al., 2015) and that there might be other factors that can compensate for the loss of function of Trp53. In our study, Wnt1Cre;Kdm6bfl/fl mice showed a cleft palate phenotype with high penetrance, and using MDM2 inhibitor Nutlin-3 we successfully rescued cleft palate in Kdm6b mutant mice. Our results suggested that in the Kdm6b mutant mice the decrease of Trp53 cannot be compensated for by other factors, and disturbed P53 signaling is the key factor causing cleft palate in Kdm6b mutant mice.
Previous research has shown that KDM3A functions as a cofactor of STAT3 to activate the JAK2-STAT3 signaling pathway (Kim et al., 2018) and that KDM2A coordinates with c-Fos in regulating COX-2 (Lu et al., 2015). Our study shows that KDM6B coordinates with the transcription factor TFDP1 to activate expression of Trp53 in CNCCs, and that Ezh2 and Kdm6b co-regulate H3K27 methylation status, which may affect the ability of TFDP1 to bind to the chromatin during palatogenesis. It has been reported that Tfdp1 is crucial for embryonic development and regulating Wnt/β-catenin signaling (Kohn et al., 2003; Kim et al., 2012). Interaction between KDM6B and TFDP1 discovered in this study further increases our knowledge of the coordination between epigenetic regulators and transcription factors during organogenesis. As environmental insults can adversely affect the function of epigenetic regulators, our findings provide a better understanding of the epigenetic regulation and transcription factors involved in regulating the fate of CNC cells and craniofacial development, which can provide important clues about human development, as well as potential therapeutic approaches for craniofacial birth defects.
Materials and methods
Key resources table
| Reagent type (species) or resource | Designation | Source or reference | Identifiers | Additional information |
|---|---|---|---|---|
| Strain, strain background (Mus musculus) | Kdm6bflox/flox | Manna et al., 2015, Jackson Laboratory | Stock# 029615;RRID:IMSR_JAX:029615 | |
| Strain, strain background (M. musculus) | Ezh2flox/flox | Jackson Laboratory | Stock# 022616; RRID:IMSR_JAX:022616 | |
| Strain, strain background (M. musculus) | Trp53flox/flox | Jackson Laboratory | Stock# 008462;RRID:IMSR_JAX:008462 | |
| Strain, strain background (M. musculus) | Wnt1Cre | Zhao et al., 2008 | ||
| Strain, strain background (M. musculus) | Krt14cre | Jackson Laboratory | Stock# 018964;RRID:IMSR_JAX:018964 | |
| Strain, strain background (M. musculus) | ROSA26loxp-STOP-loxp-tdTomato | Jackson Laboratory | Stock# 007905;RRID:IMSR_JAX:007905 | |
| Sequence-based reagent | Mm-Kdm6a probe | Advanced Cell Diagnostics | Cat# 456961 | |
| Sequence-based reagent | Mm-Kdm6b probe | Advanced Cell Diagnostics | Cat# 477971 | |
| Sequence-based reagent | Mm-Kdm6b-01 probe | Advanced Cell Diagnostics | Cat# 501231 | |
| Sequence-based reagent | Mm-Uty probe | Advanced Cell Diagnostics | Cat# 451741 | |
| Sequence-based reagent | Mm-Trp53 probe | Advanced Cell Diagnostics | Cat# 402331 | |
| Sequence-based reagent | Mm-Trp53-C2 probe | Advanced Cell Diagnostics | Cat# 402331-C2 | |
| Sequence-based reagent | Mm-Ezh1 probe | Advanced Cell Diagnostics | Cat# 415501 | |
| Sequence-based reagent | Mm-Wrap53 probe | Advanced Cell Diagnostics | Cat# 1143201-C1 | |
| Antibody | Myosin heavy chain (MHC) (mouse monoclonal) | DSHB | Cat# P13538 | (1:10) |
| Antibody | Histone H3 tri methyl K27 (rabbit monoclonal) | Cell Signaling Technology | Cat# 9733s | (1:200)(1:1000) |
| Antibody | Phospho-histone H2A.X (rabbit monoclonal) | Cell Signaling Technology | Cat# 9718s | (1:200) |
| Antibody | DP1 (rabbit monoclonal) | Abcam | Cat# ab124678 | (1:100)(1:1000) |
| Antibody | EZH2 (rabbit monoclonal) | Cell Signaling Technology | Cat# 5246s | (1:200)(1:2000) |
| Antibody | RUNX2 (rabbit monoclonal) | Cell Signaling Technology | Cat# 12556s | (1:200) |
| Antibody | SP7 (rabbit polyclonal) | Abcam | Cat# ab22552 | (1:200) |
| Antibody | Lamin B1 (rabbit monoclonal) | Cell Signaling Technology | Cat# 17416s | (1:100) |
| Antibody | Anti-mouse Alexa Fluor 488 (goat polyclonal) | Life Technologies | Cat# A11001 | (1:200) |
| Antibody | Anti-mouse Alexa Fluor 568 (goat polyclonal) | Life Technologies | Cat# A-11004 | (1:200) |
| Antibody | Anti-rat Alexa Fluor 488 (goat polyclonal) | Life Technologies | Cat# A-11006 | (1:200) |
| Antibody | Anti-rabbit Alexa Fluor 488 (goat polyclonal) | Life Technologies | Cat# A-11008 | (1:200) |
| Antibody | Anti-rabbit Alexa Fluor 568 (goat polyclonal) | Life Technologies | Cat# A-11036 | (1:200) |
| Antibody | EZH1 (rabbit polyclonal) | Abcam | Cat# ab189833 | (1:1000) |
| Antibody | KDM6A (rabbit polyclonal) | Abcam | Cat# ab36938 | (1:1000) |
| Antibody | KDM6B (C-term) (rabbit polyclonal) | AbCEPTA | Cat# AP1022b | (1:1000) |
| Antibody | KDM6B (N-term) (rabbit polyclonal) | AbCEPTA | Cat# AP1022a | (1:1000) |
| Antibody | P53 (mouse monoclonal) | Santa Cruz | Cat# sc-126 | (1:1000) |
| Antibody | Histone H3 (rabbit monoclonal) | Cell Signaling Technology | Cat# 4499s | (1:1000) |
| Antibody | β-Actin (mouse monoclonal) | Abcam | Cat# Ab20272 | (1:2000) |
| Antibody | Rabbit IgG HRP-conjugated antibody (goat polyclonal) | R&D System | Cat# HAF008 | (1:2000) |
| Antibody | Mouse IgG HRP-conjugated antibody (goat polyclonal) | R&D System | Cat# HAF007 | (1:2000) |
| Antibody | HRP, mouse anti-rabbit IgG LCS (mouse monoclonal) | IPKine | Cat# A25022 | (1:2000) |
| Commercial assay or kit | Goat anti-mouse IgG Alexa Fluor 488 Tyramide SuperBoost Kit | Thermo Fisher Scientific | Cat# B40912 | (1:200) |
| Commercial assay or kit | RNAscope Multiplex Fluorescent Kit v2 | Advanced Cell Diagnostics | Cat# 323110 | |
| Commercial assay or kit | RNAscope 2.5 HD Assay – RED | Advanced Cell Diagnostics | Cat# 322350 | |
| Commercial assay or kit | TSA Plus Cyanine 3 System | PerkinElmer | Cat# NEL744001KT | |
| Commercial assay or kit | TSA Plus Fluoresceine System | PerkinElmer | Cat# NEL771B001KT | |
| Commercial assay or kit | RNeasy Micro Kit | QIAGEN | Cat# 74004 | |
| Commercial assay or kit | DAB Peroxidase (HRP) Substrate Kit (with nickel) | Vector Laboratories | RRID:AB_2336382;Cat# SK4100 | |
| Software, algorithm | ImageJ | NIH | RRID:SCR_003070 | |
| Software, algorithm | Ingenuity Pathway Analysis | QIAGEN, Inc | RRID:SCR_008653 | |
| Software, algorithm | GraphPad Prism | GraphPad Software | RRID:SCR_002798 | |
| Software, algorithm | Seurat | Satija lab | RRID:SCR_016341 | |
| Software, algorithm | Cell Ranger | 10X Genomics, Inc | RRID:SCR_017344 |
Animals
To generate Wnt1Cre;Kdm6bfl/fl mice, we crossed Wnt1Cre;Kdm6bfl/+ mice with Kdm6bfl/fl mice (Zhao et al., 2008; Manna et al., 2015). Reporter mice used in this study were tdTomato conditional reporter (JAX#007905) (Madisen et al., 2010). Ezh2fl/fl and Trp53fl/fl mice were purchased from Jackson Laboratory (JAX#022616, #008462) (Marino et al., 2000; Shen et al., 2008). Genotyping was carried out as previously described (Zhao et al., 2008). Briefly, tail samples were lysed by using DirectPCR tail solution (Viagen 102T) with overnight incubation at 55°C. After heat inactivation at 85°C for 1 hr, PCR-based genotyping (GoTaq Green MasterMix, Promega, and C1000 Touch Cycler, Bio-Rad) was used to detect the genes. All mouse studies were conducted with protocols approved by the Department of Animal Resources and the Institutional Animal Care and Use Committee (IACUC) of the University of Southern California (Protocols 9320 and 20299).
MicroCT analysis
Request a detailed protocolMicroCT was used to analyze the control, Kdm6b, and other mutant samples. Mouse samples were dissected and fixed in 4% paraformaldehyde overnight at 4°C followed by CT scanning (Scanco Medical µCT50 scanner) at the University of Southern California Molecular Imaging Center as previously described (Grosshans et al., 2006; Sugii et al., 2017). AVIZO 9.1.0 (Visualization Sciences Group) was used for visualization and 3D microCT reconstruction.
Alcian blue-Alizarin red staining
Request a detailed protocolMouse heads were dissected and fixed in 95% EtOH overnight at room temperature. Staining was performed as previously described (Rigueur and Lyons, 2014). Briefly, 95% EtOH was replaced with 100% acetone for 2 days and then samples were incubated in Alcian blue solution (80% EtOH, 20% glacial acetic acid, and 0.03% [w/v] Alcian blue 8GX [Sigma, A3157]) for 1–3 days. Samples were then de-stained with 70% EtOH and incubated in 95% EtOH overnight. After incubation, samples were pre-cleared with 1% KOH and then incubated in Alizarin red solution (0.005% [w/v] Alizarin red [Sigma, A5533] in 1% [w/v] KOH) for 2–5 days. After clearing samples with 1% KOH, they were stored in 100% glycerol until analysis.
Sample preparation for sectioning
Request a detailed protocolSamples for paraffin sectioning were prepared using the standard protocol in our laboratory. Briefly, samples were fixed in 4% PFA and decalcified with 10% EDTA as needed. Then, the samples were dehydrated with serial ethanol solutions (50, 70, 80, 90, and 100%) at room temperature followed by xylene and then embedded in paraffin wax. Sections were cut to 6 µm on a microtome (Leica) and mounted on SuperFrost Plus slides (Fisher, 48311-703). Cryosectioning samples were fixed and decalcified the same way as samples prepared for paraffin sectioning. Sucrose (15 and 30%) was used to remove water from the samples before embedding them in OCT compound (Tissue-Tek, 4583). Cryosections were cut to 8 µm on a cryostat (Leica) and mounted on SuperFrost Plus slides (Fisher).
Histological analysis
Request a detailed protocolParaffin sections prepared as described above were used for histological analysis. Hematoxylin and eosin staining was performed using the standard protocol (Cardiff et al., 2014).
Immunofluorescence assay
Request a detailed protocolCryosections and paraffin sections prepared as described above were used for immunofluorescence assays. Sections were dried for 2 hr at 55℃. Paraffin sections were deparaffinized and rehydrated before antigen retrieval. Heat-mediated antigen retrieval was used to process sections (Vector, H-3300) and then samples were blocked for 1 hr in blocking buffer at room temperature (PerkinElmer, FP1020). Primary antibodies diluted in blocking buffer were incubated with samples overnight at 4℃. After washing with PBST (0.1% Tween20 in 1× PBS), samples were then incubated with secondary antibodies at room temperature for 2 hr. DAPI (Sigma, D9542) was used for nuclear staining. All images were acquired using Leica DMI 3000B and Keyence BZ-X710/810 microscopes. Detailed information about the primary and secondary antibodies is listed in Supplementary file 1.
EdU labeling
Request a detailed protocolEdU solution was prepared at 10 mg/mL in PBS, and then pregnant mice at the desired stage were given an intraperitoneal injection (IP) based on their weight (0.1 mg of EdU/1 g of mouse). Embryos were collected after 2 hr or 48 hr and then prepared for sectioning as above. EdU signal was detected using Click-It EdU cell proliferation kit (Invitrogen, C10337), and images were acquired using Leica DMI 3000B and Keyence BZ-X710/810 microscopes.
RNAscope in situ hybridization
Request a detailed protocolRNAscope in situ hybridization in this study was performed on cryosections using RNAscope 2.5HD Reagent Kit-RED assay (Advanced Cell Diagnostics, 322350) and RNAscope multiplex fluorescent v2 assay (Advanced Cell Diagnostics, 323100) according to the manufacturer’s protocol. RNAscope probes used in this study included Kdm6a, Kdm6b, Uty, and Trp53. Detailed information about the probes is listed in Supplementary file 2.
RNA-sequencing and analysis
Request a detailed protocolPalate samples from control and Wnt1Cre;Kdm6bfl/fl mice were collected at E12.5 for RNA isolation with RNeasy Micro Kit (QIAGEN) according to the manufacturer’s protocol. The quality of RNA samples was determined using an Agilent 2100 Bioanalyzer, and all samples for sequencing had RNA integrity (RIN) numbers > 9. cDNA library preparation and sequencing were performed at the USC Molecular Genomics Core. Single-end reads with 75 cycles were performed on Illumina HiSeq 4000 equipment, and raw reads were trimmed and aligned using TopHat (version 2.0.8) with the mm10 genome. CPM was used to normalize the data, and differential expression was calculated by selecting transcripts that changed with p< 0.05.
RNA extraction and real-time qPCR
Request a detailed protocolPalatal tissue used for RNA isolation was dissected at desired stages, and an RNeasy Plus Micro Kit (QIAGEN, 74034) was used to isolate the total RNA followed by cDNA synthesis using an iScript cDNA synthesis kit (Bio-Rad, 1708891). Real-time qPCR quantification was done on a Bio-Rad CFX96 Real-Time system using SsoFast EvaGreen Supermix (Bio-Rad, 1725201). Detailed information about the primers is listed in Supplementary file 3.
ChIP-qPCR
Request a detailed protocolPalate tissue was dissected from control and Wnt1Cre;Kdm6bfl/fl mice at E13.5. Each replicate contained 60–80 mg tissue combined from multiple animals. Samples were prepared following the manufacturer’s protocol (Chromatrap, 500191). Briefly, tissue was cut into small pieces and then fixed with 1% formaldehyde at room temperature for 15 min, followed by incubating with 0.65 M glycine solution. Then, the sample was washed twice with PBS, resuspended in Hypotonic Buffer, and incubated at 4℃ for 10 min to obtain nuclei, which were then resuspended in Digestion Buffer. After chromatin was sheared to 100–500 bp fragments using Shearing Cocktail, 10 µg chromatin with H3K27me3 antibody (CST 9733s, 1:50), DP1 antibody (Abcam ab124678, 1:10), KDM6B antibody (Abcepta AP1022b, 1:10), or immunoglobulin G-negative control (2 µg) was added to Column Conditioning Buffer to make up the final volume of 1000 µL. Immunoprecipitation (IP) slurry was mixed thoroughly and incubated on an end-to-end rotor for 1 hr at 4℃. An equivalent amount of chromatin was set as an input. After 1 hr incubation, IP slurry was purified using Chromatrap spin column at room temperature and chromatin was eluted using ChIP-seq elution buffer. Chromatin sample and input were further incubated at 65℃ overnight to reverse cross-linking. DNA was purified with Chromatrap DNA purification column after proteinase K treatment. ChIP eluates, negative control, and input were assayed using real-time qPCR. Primers were designed using the promoter region of Trp53. Detailed information is available in Supplementary file 3.
Western blot and co-immunoprecipitation
Request a detailed protocolFor Western blot, palate tissue was dissected from control and Wnt1Cre;Kdm6bfl/fl mice at E13.5. The tissue sample was lysed using RIPA buffer (Cell Signaling, 9806) with protease inhibitor (Thermo Fisher Scientific, A32929) for 20 min on ice followed by centrifugation at 4℃ to remove tissue debris. Protein extracts were then mixed with sample buffer (Bio-Rad, 1610747) and boiled at 98℃ for 10 min. Then, denatured protein extract was separated in 4–15% precast polyacrylamide gel (Bio-Rad, 456-1084) and then transferred to 0.45 µm PVDF membrane. Transferred membrane was incubated with 5% milk for 1 hr at room temperature and incubated with primary antibody at 4℃ overnight. After washing with TBST, the membrane was incubated with secondary antibody for 2 hr at room temperature and signals were detected using SuperSignal West Femto (Thermo Fisher Scientific, 34094) and Azure 300 (Azure Biosystems).
For Co-IP, palate tissue was dissected from control mice at E13.5 and 60–80 mg tissue was combined as one sample for each replicate. After lysing using RIPA buffer, 60 µL of the protein extract was mixed with sample buffer and boiled at 98℃ to serve as input. The remaining protein extract was incubated with primary antibody at 4℃ overnight. Protein G beads from GE Healthcare (GE Healthcare, 10280243) were used to purify the target protein, and then the protein sample was analyzed using Western blot. Detailed information about the primary and secondary antibodies is listed in Supplementary file 4.
siRNA and plasmid transfection
Request a detailed protocolPalatal tissue was dissected from control and Wnt1Cre;Kdm6bfl/fl mice at E13.5, then cut into small pieces using a scalpel. This minced tissue was then cultured in DMEM medium (Gibco, 2192449) containing 40% MSC FBS (Gibco, 2226685P) and 1% Pen Strep (Gibco, 2145477) at 37℃.
siRNA (QIAGEN) and plasmid (OriGene) transfection was performed following the manufacturer’s protocol (QIAGEN, 301704, and OriGene, TF81001). Briefly, siRNA was transfected into cells in 24-well plates at 10 nM for 3 days followed by qPCR and EdU proliferation assay. Plasmid was transfected into cells in 24-well plates using 1 µg/µL stock solution for 2 days followed by real-time qPCR. The primers designed for qPCR are listed in Supplementary file 3. The siRNA sequence and plasmid information are listed in Supplementary files 5 and 6.
ATAC-seq analysis
Request a detailed protocolPalate tissue of E13.5 control mice was digested using TrypLE express enzyme (Thermo Fisher Scientific, 12605010) and incubated at 37℃ for 20 min with shaking at 600 rpm. Single-cell suspension was prepared according to the 10X Genomics sample preparation protocol and processed to generate ATAC-seq libraries according to a published protocol (Buenrostro et al., 2015). Sequencing was performed using the NextSeq 500 platform (Illumina), and ATAC-seq reads were aligned to the UCSC mm10 reference genome using BWA-MEN (Li, 2013). Then, ATAC-seq peaks were called by MACS2 and annotated. Known transcription factor biding motifs were analyzed by HOMER (Zhang et al., 2008; Heinz et al., 2010). Quality files for sequencing are listed in Supplementary file 7.
Cell differentiation assay
Request a detailed protocolPalatal tissue was dissected from control and Wnt1Cre;Kdm6bfl/fl mice at E13.5 and cultured as previously described. Then, the differentiation assay was conducted according to the manufacturer’s protocol (Gibco, A1007201) (Chen et al., 2020). Briefly, mesenchymal cells were seeded into cell culture plates at the desired concentration followed by incubation at 36°C in a humidified atmosphere of 5% CO2 for the required time (a minimum of 2 hr and up to 4 days). Then, the growth medium was replaced by complete differentiation medium and cells were continuously incubated for 3 weeks under osteogenic conditions. After specific periods of cultivation, cells were stained using 2% Alizarin red S solution (PH 4.2) solution. Images were acquired using EPSON Scan and Keyence BZ-X710/810 microscopes. Quantification of the Alizarin red S staining was conducted according to the manufacturer’s protocol (ScienCell, 8678).
Senescence β-galactosidase staining
Request a detailed protocolPalatal tissue was dissected from control mice at E13.5, then cut into small pieces using a scalpel. This minced tissue was then cultured in DMEM medium (Gibco, 2192449) containing 40% MSC FBS (Gibco, 2226685P) and 1% Pen Strep (Gibco, 2145477) at 37℃. A cell monolayer was stained using a senescence β-galactosidase staining kit (Cell Signaling, 9860) according to the manufacturer’s protocol. Images were acquired using a Keyence BZ-X710/810 microscope.
Nutlin-3 treatment
Request a detailed protocolNutlin-3 (Sigma, N6287) was dissolved in corn oil (Sigma, C8267) with 10% DMSO (Sigma, D2650) and given to pregnant mice on days 10.5, 12.5, and 14.5 of pregnancy at a dosage based on their weight (10 mg/kg) (Li et al., 2016). Then, the embryos were collected at E16.5 for analysis.
Statistics
Statistical analysis was completed using GraphPad Prism, and significance was assessed by independent two-tailed Student’s t-test or ANOVA. The chosen level of significance for all statistical tests in this study was p<0.05. Data is presented as mean ± SEM. N = 3 samples were analyzed for each experimental group unless otherwise stated.
Data availability
Sequencing data have been deposited in GEO under accession code GSE175383.
-
NCBI Gene Expression OmnibusID GSE175383. KDM6B interacts with TFDP1 to activate P53 signalling in regulating mouse palatogenesis.
-
NCBI Gene Expression OmnibusID GSE155928. Runx2-Twist1 interaction coordinates cranial neural crest guidance of soft palate myogenesis.
References
-
Regulation of chromatin by histone modificationsCell Research 21:381–395.https://doi.org/10.1038/cr.2011.22
-
The role of p53 in developmental syndromesJournal of Molecular Cell Biology 11:200–211.https://doi.org/10.1093/jmcb/mjy087
-
Chromatin and epigenetics in development: a Special IssueDevelopment (Cambridge, England) 146:185025.https://doi.org/10.1242/dev.185025
-
ATAC-seq: A Method for Assaying Chromatin Accessibility Genome-WideCurrent Protocols in Molecular Biology 109:21.https://doi.org/10.1002/0471142727.mb2129s109
-
Manual Hematoxylin and Eosin Staining of Mouse Tissue SectionsCold Spring Harbor Protocols 2014:prot073411.https://doi.org/10.1101/pdb.prot073411
-
Recent advances in craniofacial morphogenesisDevelopmental Dynamics 235:2353–2375.https://doi.org/10.1002/dvdy.20833
-
The SWI/SNF BAF-A complex is essential for neural crest developmentDevelopmental Biology 411:15–24.https://doi.org/10.1016/j.ydbio.2016.01.015
-
Cranial neural crest cells on the move: their roles in craniofacial developmentAmerican Journal of Medical Genetics. Part A 155A:270–279.https://doi.org/10.1002/ajmg.a.33702
-
Histone demethylases in chromatin biology and beyondEMBO Reports 16:1620–1639.https://doi.org/10.15252/embr.201541113
-
Cleft lip and palate: understanding genetic and environmental influencesNature Reviews. Genetics 12:167–178.https://doi.org/10.1038/nrg2933
-
Epigenetic plasticity and the hallmarks of cancerScience (New York, N.Y.) 357:eaal2380.https://doi.org/10.1126/science.aal2380
-
Epigenetic control of transcriptional regulation in pluripotency and early differentiationDevelopment (Cambridge, England) 146:dev164772.https://doi.org/10.1242/dev.164772
-
TEDS site phosphorylation of the yeast myosins I is required for ligand-induced but not for constitutive endocytosis of the G protein-coupled receptor Ste2pThe Journal of Biological Chemistry 281:11104–11114.https://doi.org/10.1074/jbc.M508933200
-
Epigenetic regulation in development: is the mouse a good model for the human?Human Reproduction Update 24:556–576.https://doi.org/10.1093/humupd/dmy021
-
Wnt signaling in lip and palate developmentFrontiers of Oral Biology 16:81–90.https://doi.org/10.1159/000337619
-
Epigenetic regulation in neural crest developmentDevelopmental Biology 396:159–168.https://doi.org/10.1016/j.ydbio.2014.09.034
-
Roles and regulation of histone methylation in animal developmentNature Reviews. Molecular Cell Biology 20:625–641.https://doi.org/10.1038/s41580-019-0151-1
-
Epigenetic control in skin development, homeostasis and injury repairExperimental Dermatology 28:453–463.https://doi.org/10.1111/exd.13872
-
DNA methylation, an epigenetic mechanism connecting folate to healthy embryonic development and agingThe Journal of Nutritional Biochemistry 20:917–926.https://doi.org/10.1016/j.jnutbio.2009.06.008
-
Chromatin accessibility and the regulatory epigenomeNature Reviews Genetics 20:207–220.https://doi.org/10.1038/s41576-018-0089-8
-
Dp1 is required for extra-embryonic developmentDevelopment (Cambridge, England) 130:1295–1305.https://doi.org/10.1242/dev.00355
-
Sox9 function in craniofacial development and diseaseGenesis (New York, N.Y 49:200–208.https://doi.org/10.1002/dvg.20717
-
Chromatin regulatory mechanisms in pluripotencyAnnual Review of Cell and Developmental Biology 26:503–532.https://doi.org/10.1146/annurev-cellbio-051809-102012
-
MDM2 inhibition rescues neurogenic and cognitive deficits in a mouse model of fragile X syndromeScience Translational Medicine 8:336ra61.https://doi.org/10.1126/scitranslmed.aad9370
-
The fate of cells undergoing spontaneous DNA damage during developmentDevelopment (Cambridge, England) 146:dev174268.https://doi.org/10.1242/dev.174268
-
Histone Modifications as an Intersection Between Diet and LongevityFrontiers in Genetics 10:192.https://doi.org/10.3389/fgene.2019.00192
-
Transcriptional Control of Neural Crest DevelopmentColloquium Series on Developmental Biology 1:1–227.https://doi.org/10.4199/C00010ED1V01Y201003DEB001
-
Cell movements and control of patterned tissue assembly during craniofacial developmentJournal of Craniofacial Genetics and Developmental Biology 11:192–213.
-
Roles of BMP signaling pathway in lip and palate developmentFrontiers of Oral Biology 16:60–70.https://doi.org/10.1159/000337617
-
Wnt signaling in orofacial clefts: crosstalk, pathogenesis and modelsDisease Models & Mechanisms 12:037051.https://doi.org/10.1242/dmm.037051
-
Whole-mount skeletal stainingMethods in Molecular Biology (Clifton, N.J.) 1130:113–121.https://doi.org/10.1007/978-1-62703-989-5_9
-
Ezh2 is required for neural crest-derived cartilage and bone formationDevelopment (Cambridge, England) 141:867–877.https://doi.org/10.1242/dev.094342
-
Self-organization of the human embryo in the absence of maternal tissuesNature Cell Biology 18:700–708.https://doi.org/10.1038/ncb3347
-
DNA methylation: roles in mammalian developmentNature Reviews. Genetics 14:204–220.https://doi.org/10.1038/nrg3354
-
Determinants of Histone H3K4 Methylation PatternsMolecular Cell 68:773–785.https://doi.org/10.1016/j.molcel.2017.10.013
-
Spatiotemporal structure of cell fate decisions in murine neural crestScience (New York, N.Y.) 364:971.https://doi.org/10.1126/science.aas9536
-
The Dlx5-FGF10 signaling cascade controls cranial neural crest and myoblast interaction during oropharyngeal patterning and developmentDevelopment (Cambridge, England) 144:4037–4045.https://doi.org/10.1242/dev.155176
-
Interactions between the otitis media gene, Fbxo11, and p53 in the mouse embryonic lungDisease Models & Mechanisms 8:1531–1542.https://doi.org/10.1242/dmm.022426
-
H3K27 methylation: a promiscuous repressive chromatin markCurrent Opinion in Genetics & Development 43:31–37.https://doi.org/10.1016/j.gde.2016.11.001
-
p53 in the DNA-Damage-Repair ProcessCold Spring Harbor Perspectives in Medicine 6:a026070.https://doi.org/10.1101/cshperspect.a026070
-
A network of epigenomic and transcriptional cooperation encompassing an epigenomic master regulator in cancerNpj Systems Biology and Applications 4:24.https://doi.org/10.1038/s41540-018-0061-4
-
DNA Methylation Variation Is Identified in Monozygotic Twins Discordant for Non-syndromic Cleft Lip and PalateFrontiers in Cell and Developmental Biology 9:656865.https://doi.org/10.3389/fcell.2021.656865
-
Shox2-deficient mice exhibit a rare type of incomplete clefting of the secondary palateDevelopment (Cambridge, England) 132:4397–4406.https://doi.org/10.1242/dev.02013
-
Model-based Analysis of ChIP-Seq (MACS)Genome Biology 9:r137.https://doi.org/10.1186/gb-2008-9-9-r137
-
Epigenetics and Human DiseaseCold Spring Harbor Perspectives in Biology 8:a019497.https://doi.org/10.1101/cshperspect.a019497
Article and author information
Author details
Funding
National Institutes of Health (R01 DE012711)
- Yang Chai
National Institutes of Health (R01 DE022503)
- Yang Chai
National Institutes of Health (U01 DE028729)
- Yang Chai
The funders had no role in study design, data collection and interpretation, or the decision to submit the work for publication.
Acknowledgements
We thank Bridget Samuels and Linda Hattemer for critical reading of the manuscript and also acknowledge USC Libraries Bioinformatics Service for their assistance with data analysis. We also thank the USC Office of Research and the Norris Medical Library for the bioinformatics software and computing resources.
Ethics
All mouse studies were conducted with protocols approved by the Department of Animal Resources and the Institutional Animal Care and Use Committee (IACUC) of the University of Southern California (Protocols 9320 and 20299).
Copyright
© 2022, Guo et al.
This article is distributed under the terms of the Creative Commons Attribution License, which permits unrestricted use and redistribution provided that the original author and source are credited.
Metrics
-
- 2,362
- views
-
- 388
- downloads
-
- 20
- citations
Views, downloads and citations are aggregated across all versions of this paper published by eLife.
Citations by DOI
-
- 20
- citations for umbrella DOI https://doi.org/10.7554/eLife.74595
Download links
A two-part list of links to download the article, or parts of the article, in various formats.
Downloads (link to download the article as PDF)
Open citations (links to open the citations from this article in various online reference manager services)
Cite this article (links to download the citations from this article in formats compatible with various reference manager tools)
KDM6B interacts with TFDP1 to activate P53 signaling in regulating mouse palatogenesis
eLife 11:e74595.
https://doi.org/10.7554/eLife.74595


