Innate lymphoid cells and COVID-19 severity in SARS-CoV-2 infection
- Program in Molecular Medicine, University of Massachusetts Medical School, United States
- Medical Scientist Training Program, University of Massachusetts Medical School, United States
- Massachusetts Consortium on Pathogen Readiness, United States
- Ragon Institute of MGH, MIT and Harvard, United States
- Massachusetts General Hospital, Mucosal Immunology and Biology Research Center, United States
- Massachusetts General Hospital, Department of Pediatrics, United States
- Harvard Medical School, United States
- Department of Microbiology, Perelman School of Medicine, University of Pennsylvania, United States
- Institute for Immunology, Perelman School of Medicine, University of Pennsylvania, United States
- Division of Pulmonary and Critical Care Medicine, Department of Medicine, University of Pennsylvania Perelman School of Medicine, United States
- Department of Medicine, Brigham and Women’s Hospital, United States
- Howard Hughes Medical Institute, United States
- Department of Biology and Institute of Medical Engineering and Science, Massachusetts Institute of Technology, United States
- Department of Biochemistry and Molecular Biotechnology, University of Massachusetts Medical School, United States
- Broad Institute of Harvard and MIT, United States
Figures
Figure 1
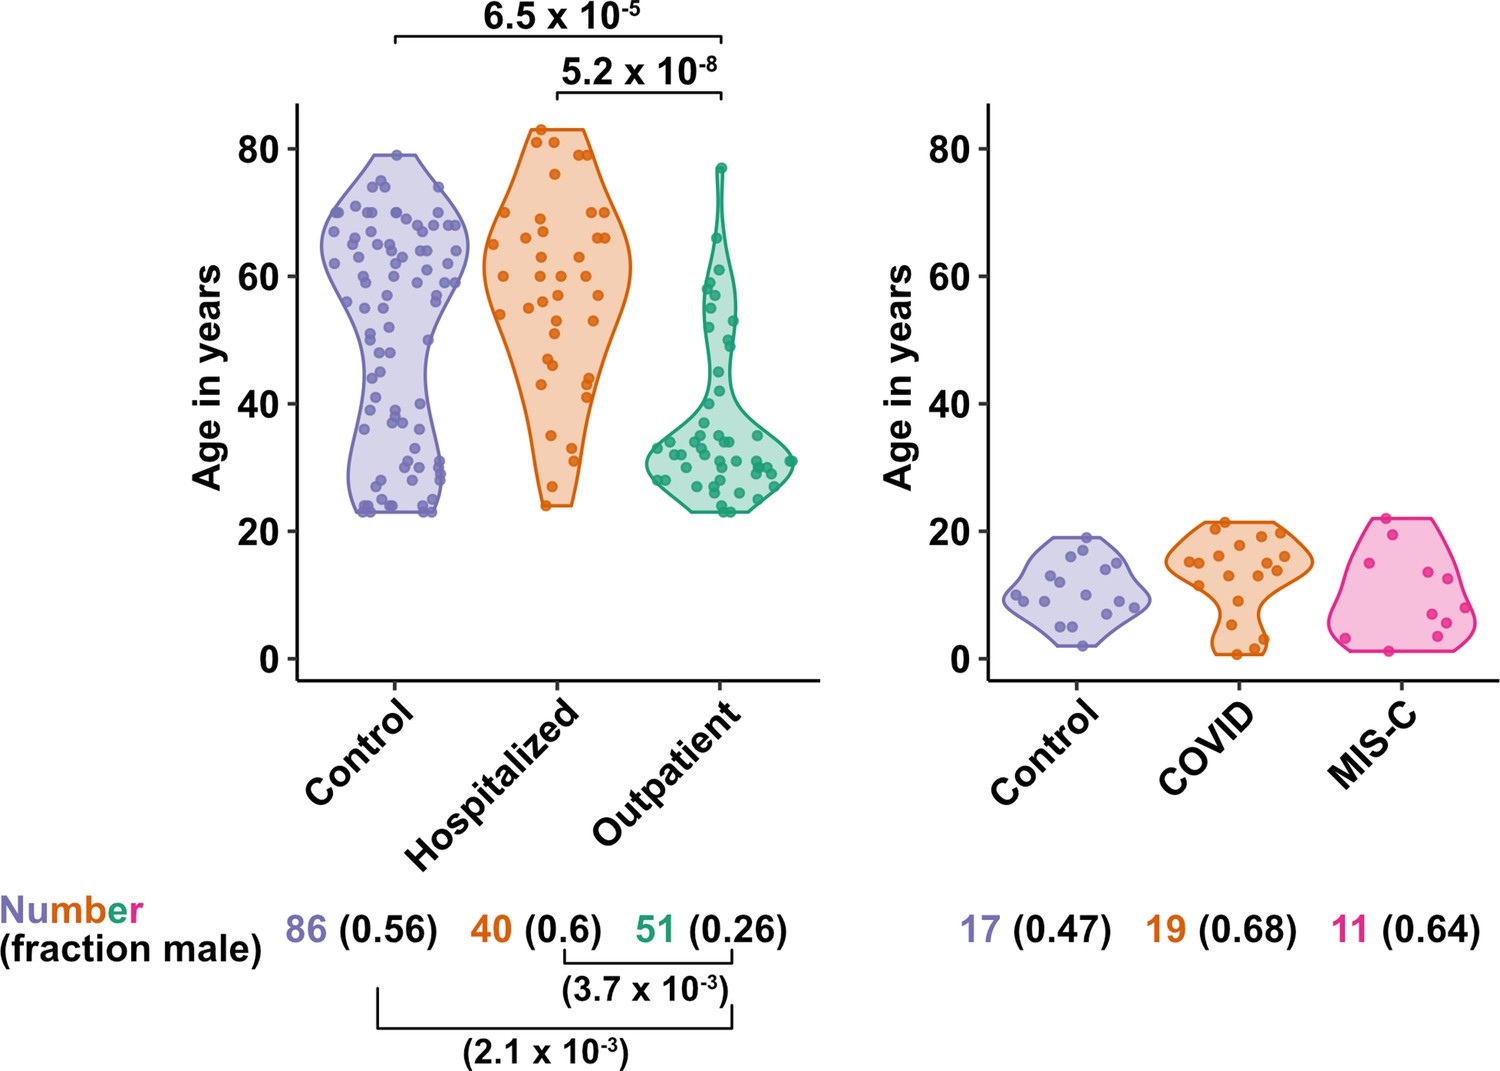
Age and sex of control and SARS-CoV-2-infected blood donors.
Age of the subjects is shown, along with the number of subjects and fraction male in each group, for adult (left) and pediatric (right) cohorts, as indicated. The p-values are from pairwise, two-sided, Wilcoxon rank-sum test for ages and Fisher’s exact test for fraction male, with Bonferroni correction for multiple comparisons. Adjusted p-values < 0.05 are shown.
Figure 2 with 1 supplement
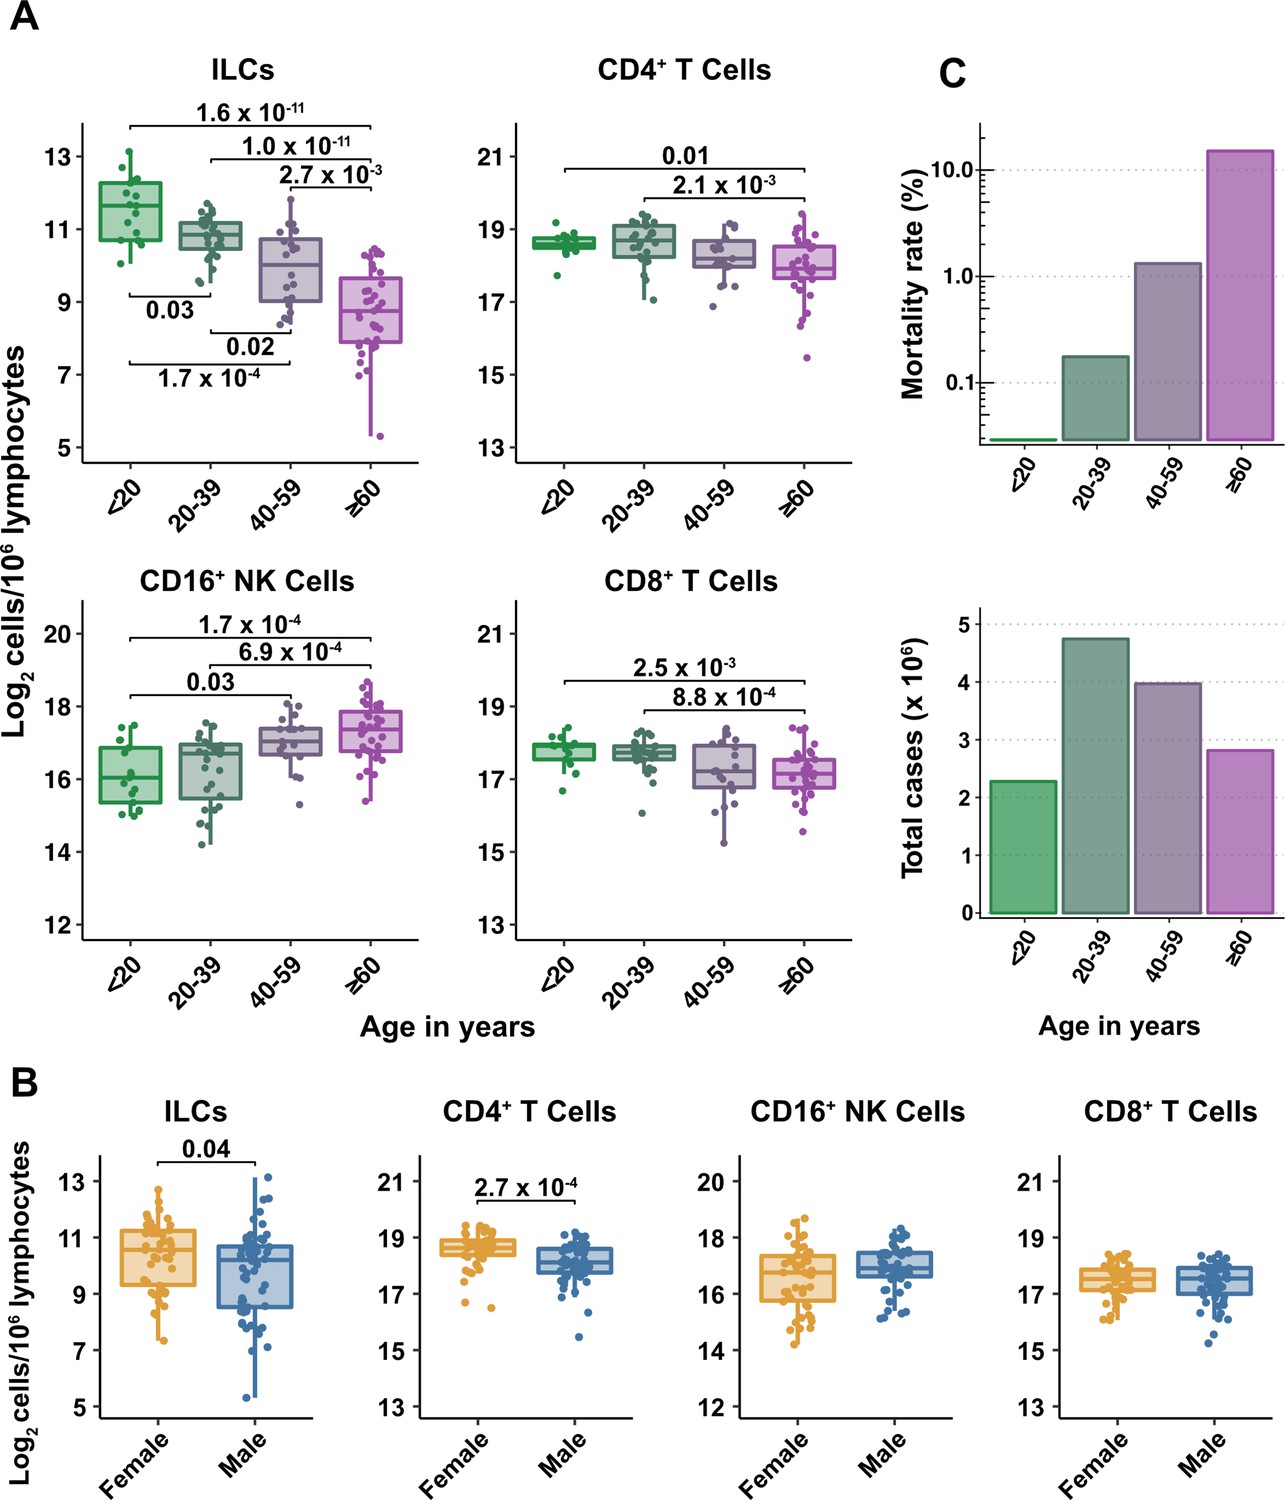
Blood ILC abundance decreases exponentially across the lifespan mirroring the mortality rate from SARS-CoV-2 infection.
(A–B) Log2 abundance per million lymphocytes of the indicated lymphoid cell populations in combined pediatric and adult control data plotted by 20 year bin or by sex, as indicated. Each dot represents an individual blood donor. Boxplots represent the distribution of the data with the center line drawn through the median with the upper and lower bounds of the box at the 75th and 25th percentiles respectively. The upper and lower whiskers extend to the largest or smallest values within 1.5 x the interquartile range (IQR). The p-values are from two-sided, Wilcoxon rank-sum tests with Bonferroni correction for multiple comparisons. Adjusted p-values < 0.05 are shown. (C) Case numbers and mortality rate within the indicated age ranges for cases reported in the United States between Jan 1, 2020, and June 6, 2021.
-
Figure 2—source data 1
Combined demographic, clinical, and flow cytometry data for adult COVID-19 and control cohorts.
Data included in this file are associated with Figures 1—3; Figure 3—figure supplement 1; Figure 6; Tables 1–4; and Supplementary file 2d,e . File name: Adult_COVIDandControl_data.xlsx.
- https://cdn.elifesciences.org/articles/74681/elife-74681-fig2-data1-v2.xlsx
Figure 2—figure supplement 1
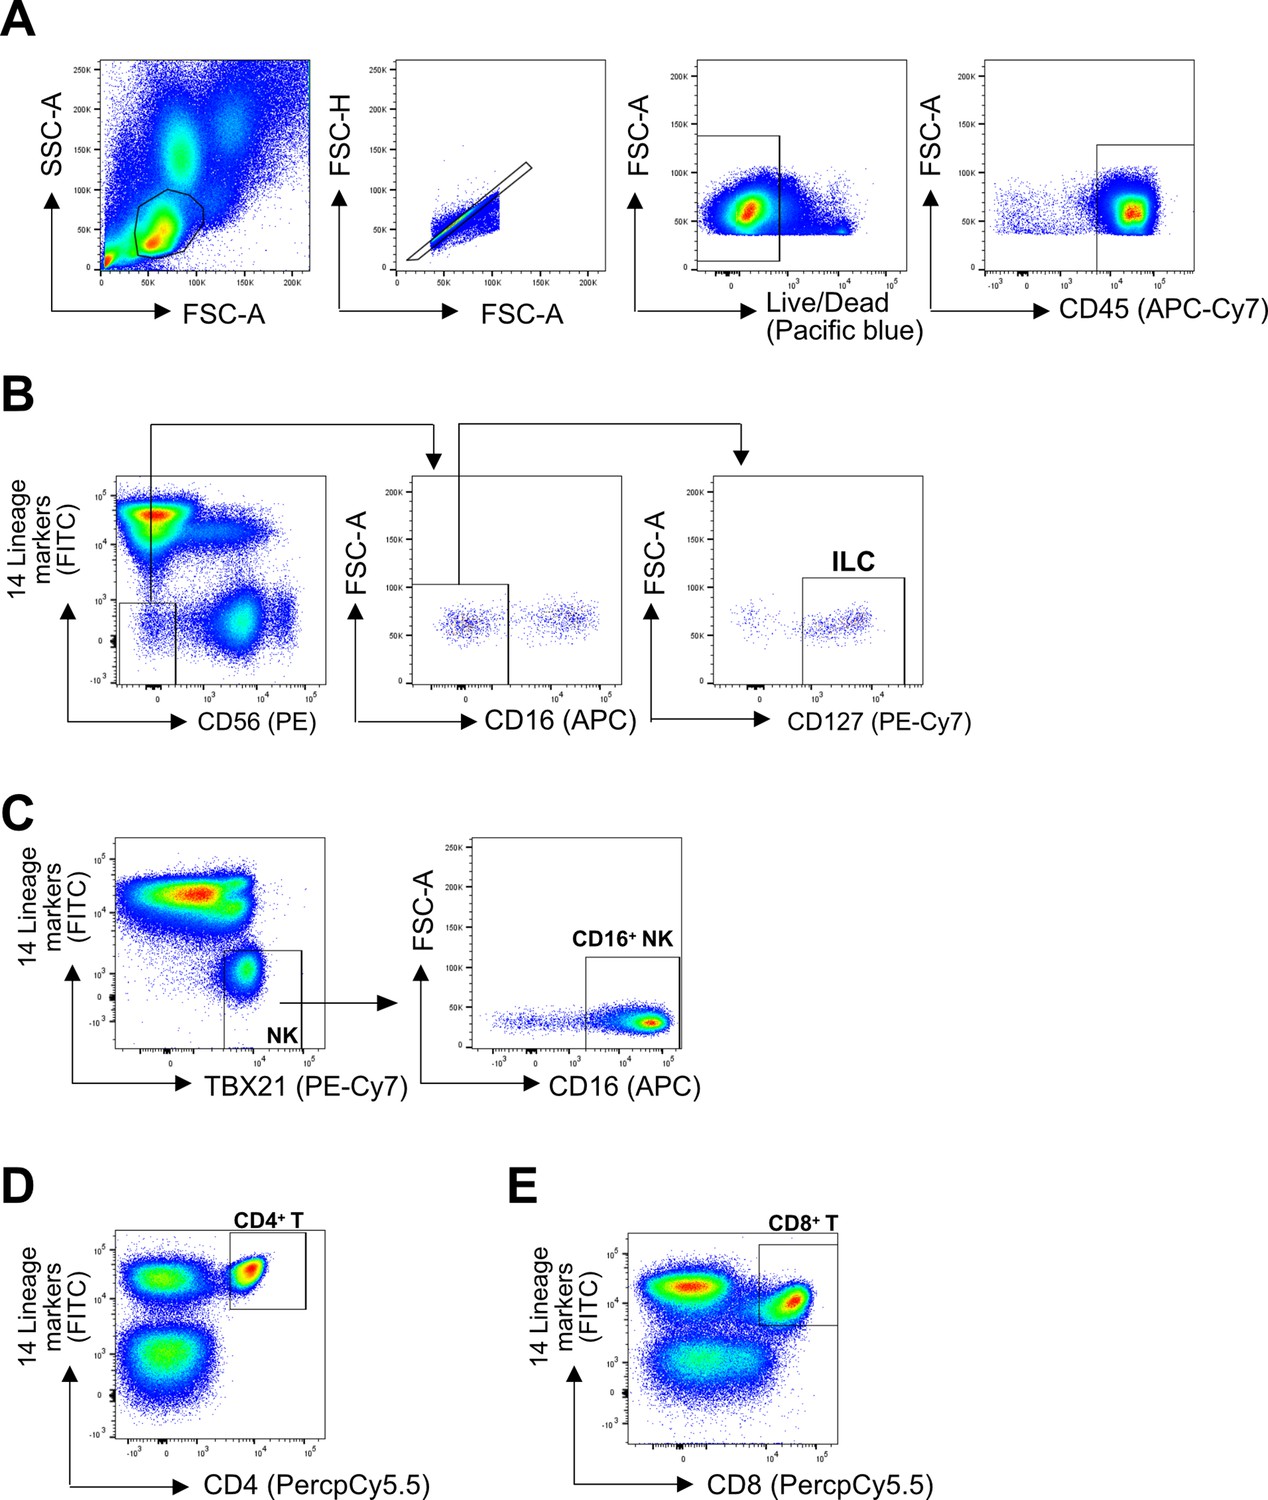
Representative gating strategy.
(A) All cell subsets were first gated on lymphoid cells, singlets, live/dead, and CD45+. Lineage (Lin) markers included antibodies against: CD3, CD4, TCRαβ, TCRγδ, CD19, CD20, CD22, CD34, FcεRIα, CD11c, CD303, CD123, CD1a, and CD14. (B) ILCs were identified as Lin-CD56-CD16-CD127+ (C) CD16+ NK cells were identified as Lin-TBX21+CD16+ (E) CD4+ T cells were identified as Lin+CD4+ (D), and CD8+ T cells were identified as Lin+CD8+.
Figure 3 with 2 supplements
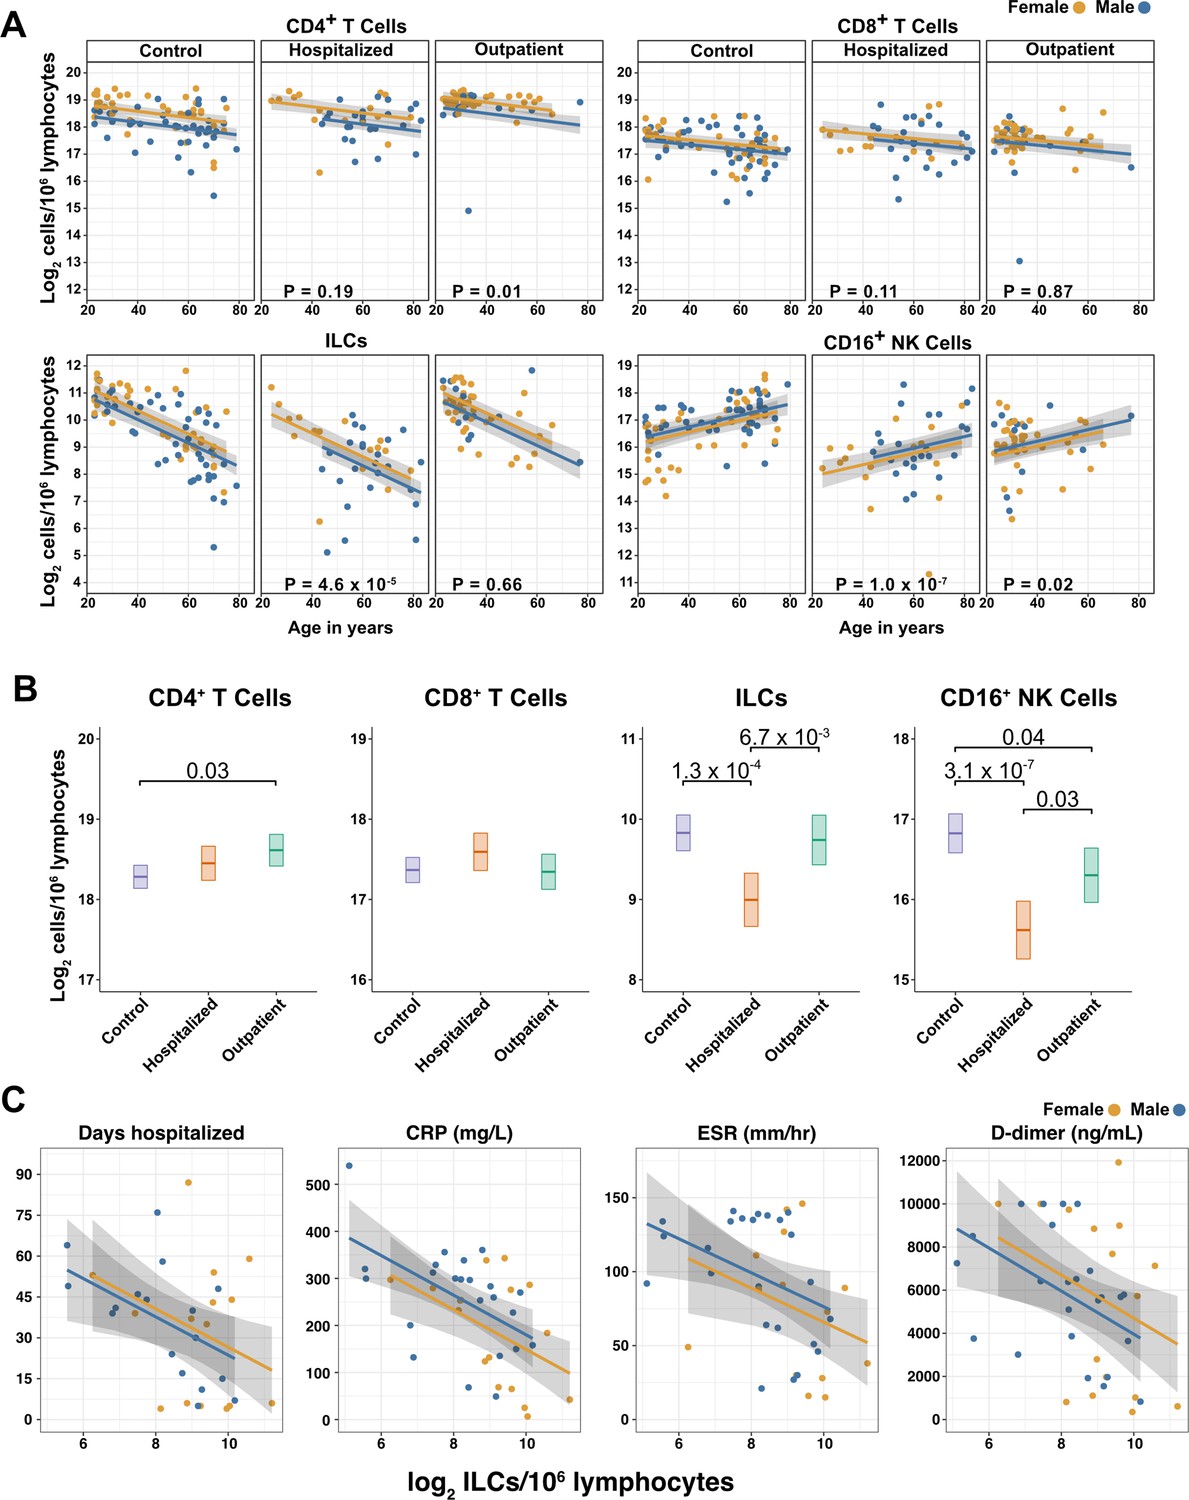
Innate lymphoid cells are depleted in adults hospitalized with COVID-19 and ILC abundance correlates inversely with disease severity.
(A) Effect of age (X-axis) on log2 abundance per million total lymphocytes of the indicated lymphoid cell populations (Y-axis), as determined by the regression analysis in Table 2. Each dot represents an individual blood donor, with yellow for female and blue for male. Shading represents the 95% CI. The p-values are from the regression analysis for comparisons to the control group. (B) Log2 abundance per million lymphocytes of the indicated lymphoid cell populations, shown as estimated marginal means with 95% CI, generated from the multiple linear regressions in Table 2, and averaged across age and sex. The p-values represent pairwise comparisons on the estimated marginal means, adjusted for multiple comparisons with the Tukey method. Adjusted p-values < 0.05 are shown. (C) Association of the indicated clinical parameters with log2 abundance of ILCs per million lymphoid cells. Regression lines are from simplified multiple regression models to permit visualization on a two-dimensional plane. Shading represents the 95% CI. Results of the full models accounting for effects of both age and sex, are reported in Table 4 and the text.
Figure 3—figure supplement 1
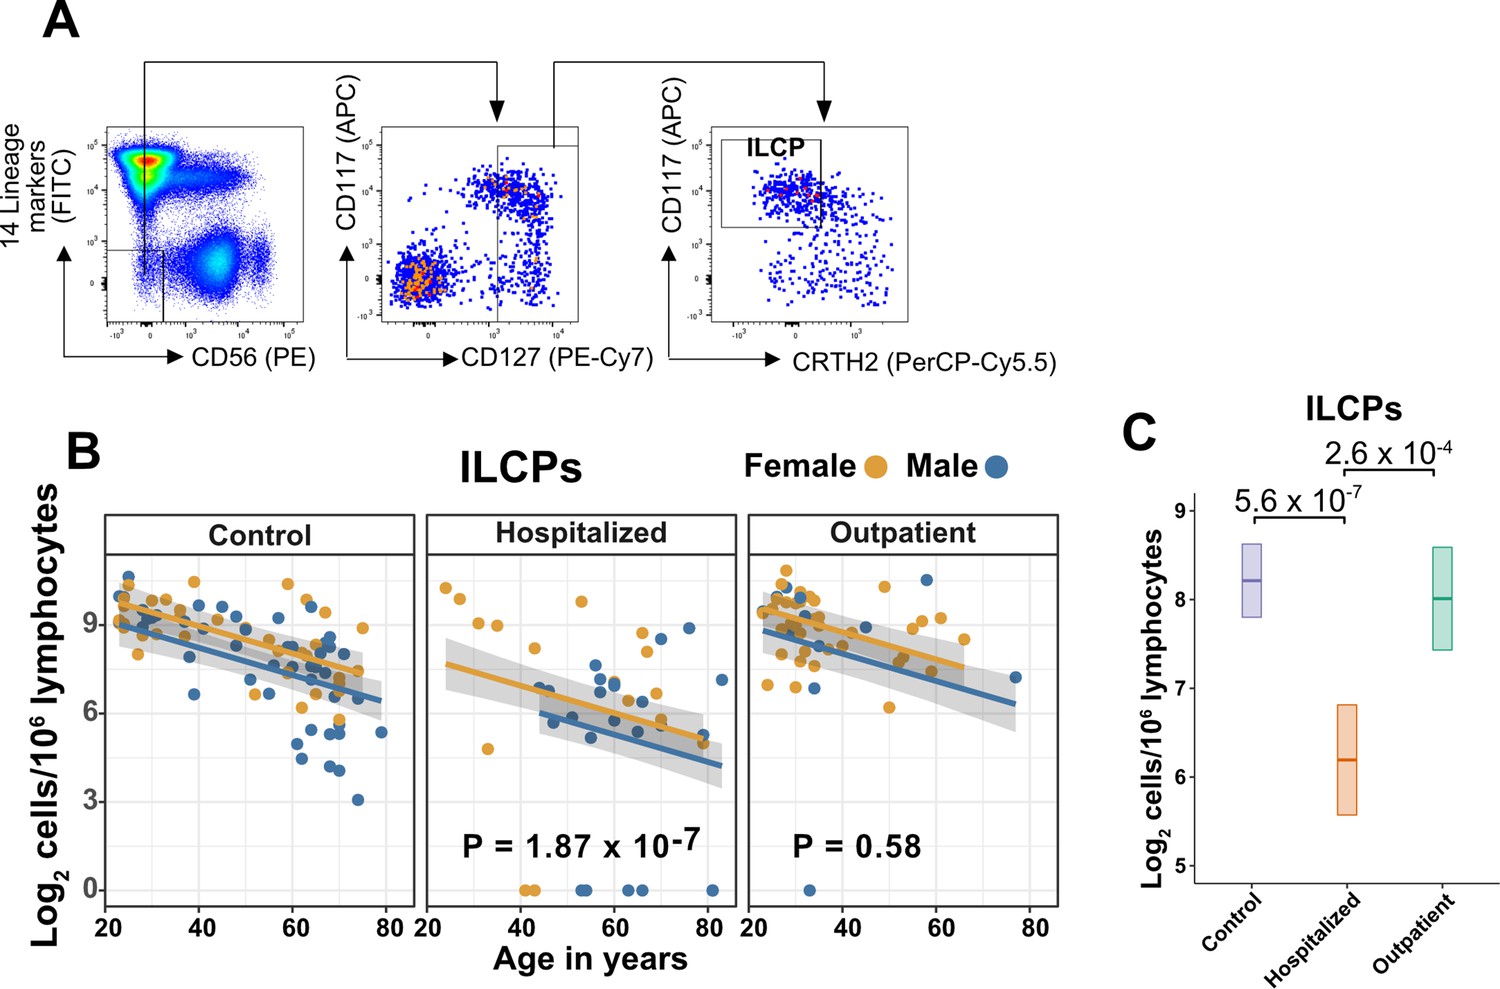
Innate lymphoid cell precursors (ILCPs) decrease with age and are depleted in patients hospitalized with COVID-19.
(A) Representative gating for ILCP identification in PBMCs. Cells were first gated on lymphoid cells, singlets, live/dead, and CD45+. Lineage (Lin) markers included antibodies against: CD3, CD4, TCRαβ, TCRγδ, CD19, CD20, CD22, CD34, FcεRIα, CD11c, CD303, CD123, CD1a, and CD14. (B) Effect of age (X-axis) on log2 ILCP abundance per million total lymphocytes (Y-axis). Each dot represents an individual blood donor, with yellow for female and blue for male. Shading represents the 95% CI. The p-values are from the regression analysis for comparisons to the control group. (C) Lymphoid cell abundance by group, shown as estimated marginal means with 95% CI, generated from the multiple linear regressions in (B), and averaged across age and sex. The p-values represent pairwise comparisons on the estimated marginal means, adjusted for multiple comparisons with the Tukey method.
Figure 3—figure supplement 2
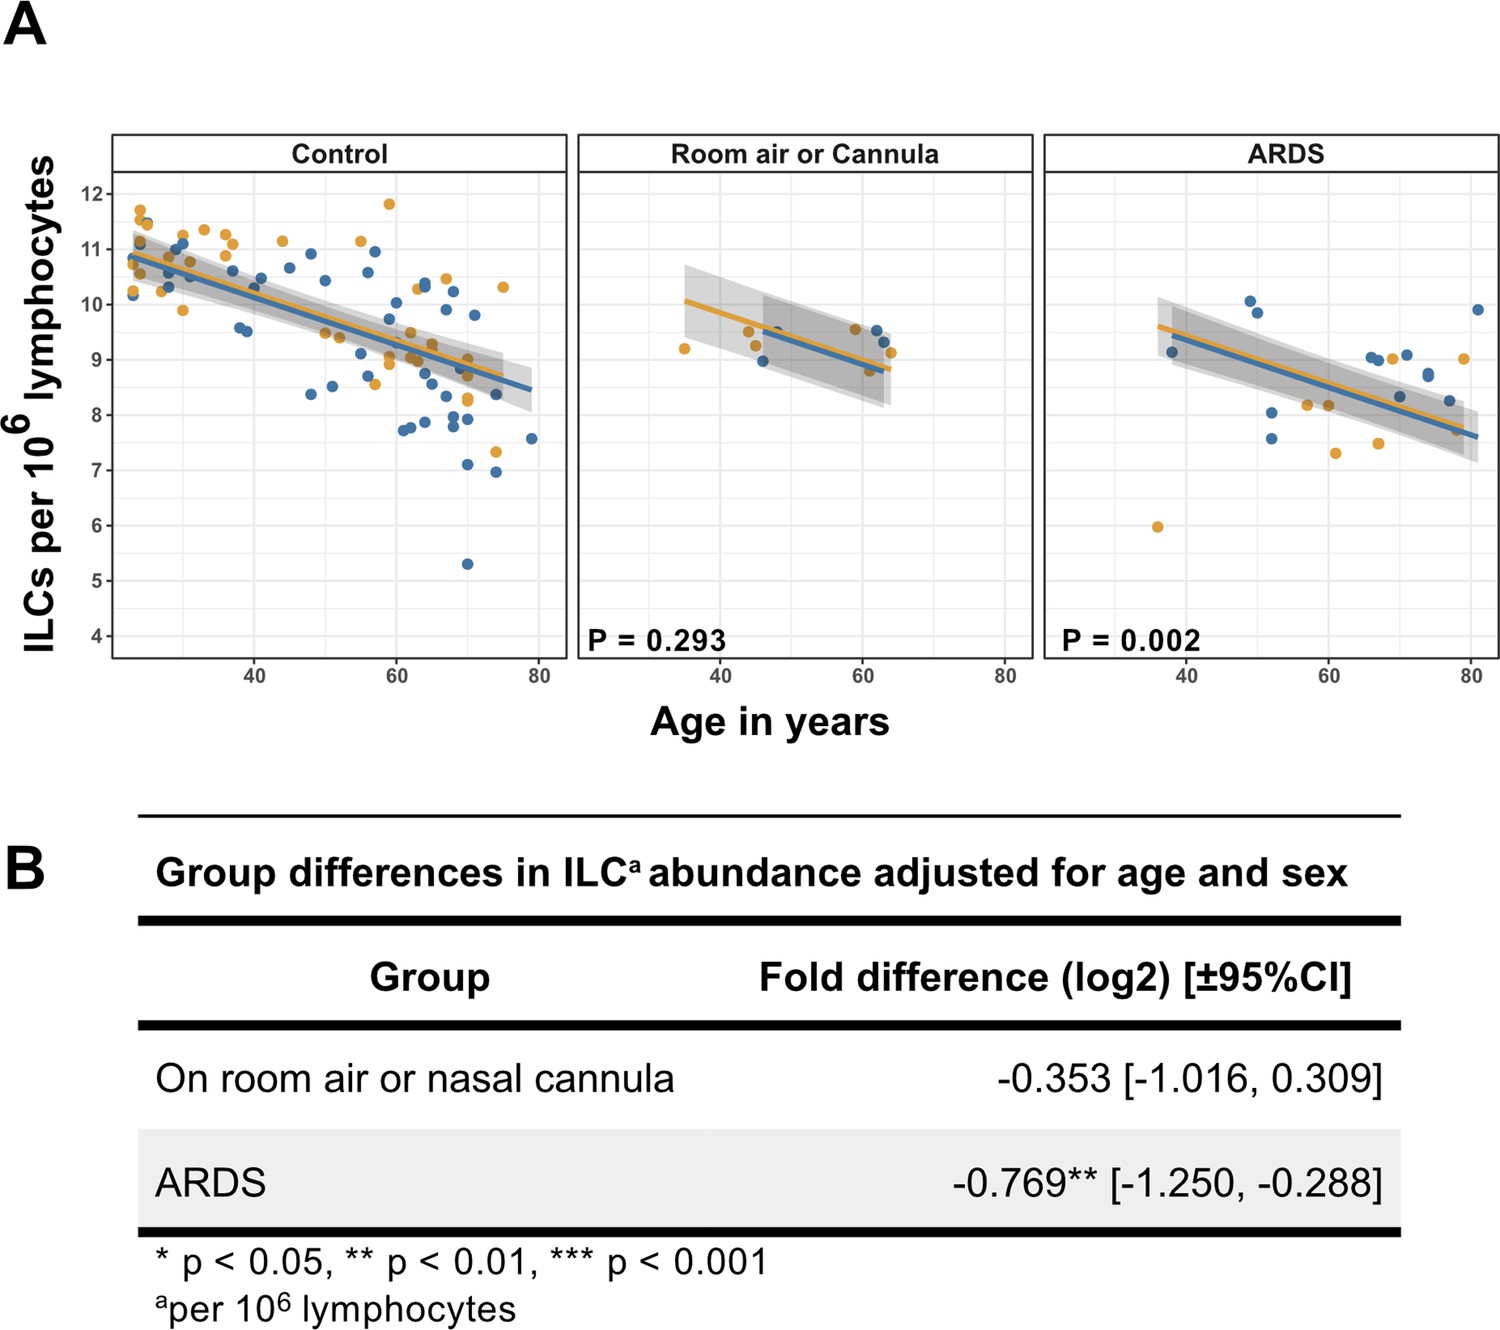
Association of blood ILC depletion with COVID-19 severity in an independent cohort of adults.
(A) Effect of age (X-axis) on log2 ILC abundance per million total lymphocytes (Y-axis) in adult controls from this paper and patients with COVID-19 from Kuri-Cervantes et al., 2020. Patients were stratified into two groups by disease severity. The first group included patients maintained on room air or treated with O2 by nasal cannula. The second group included those with ARDS. Each dot represents an individual blood donor, with yellow for female and blue for male. Shading represents the 95% CI. The p-values are from the regression analysis for comparisons to the control group. (B) Table of regression coefficients for log2 fold difference in ILC abundance for patients with COVID-19, in comparison to the adult healthy control cohort, adjusted for effects of age and sex.
Figure 4 with 2 supplements
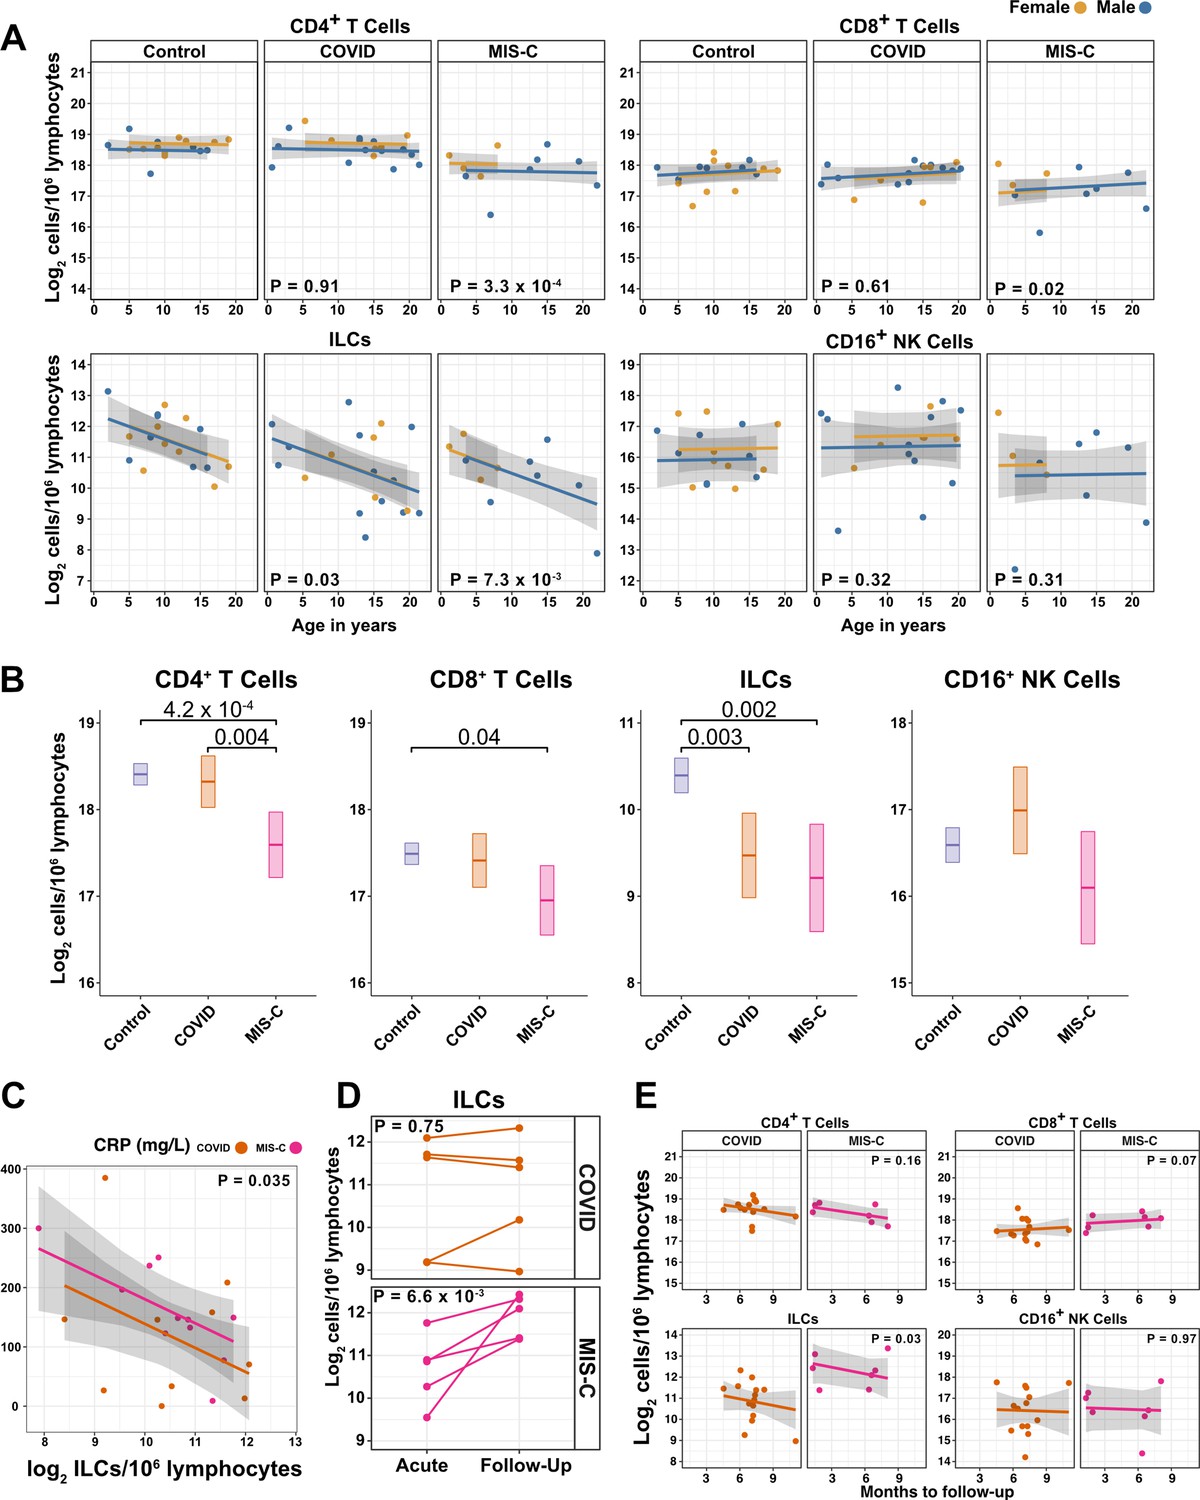
ILCs are depleted in children with COVID-19 or MIS-C.
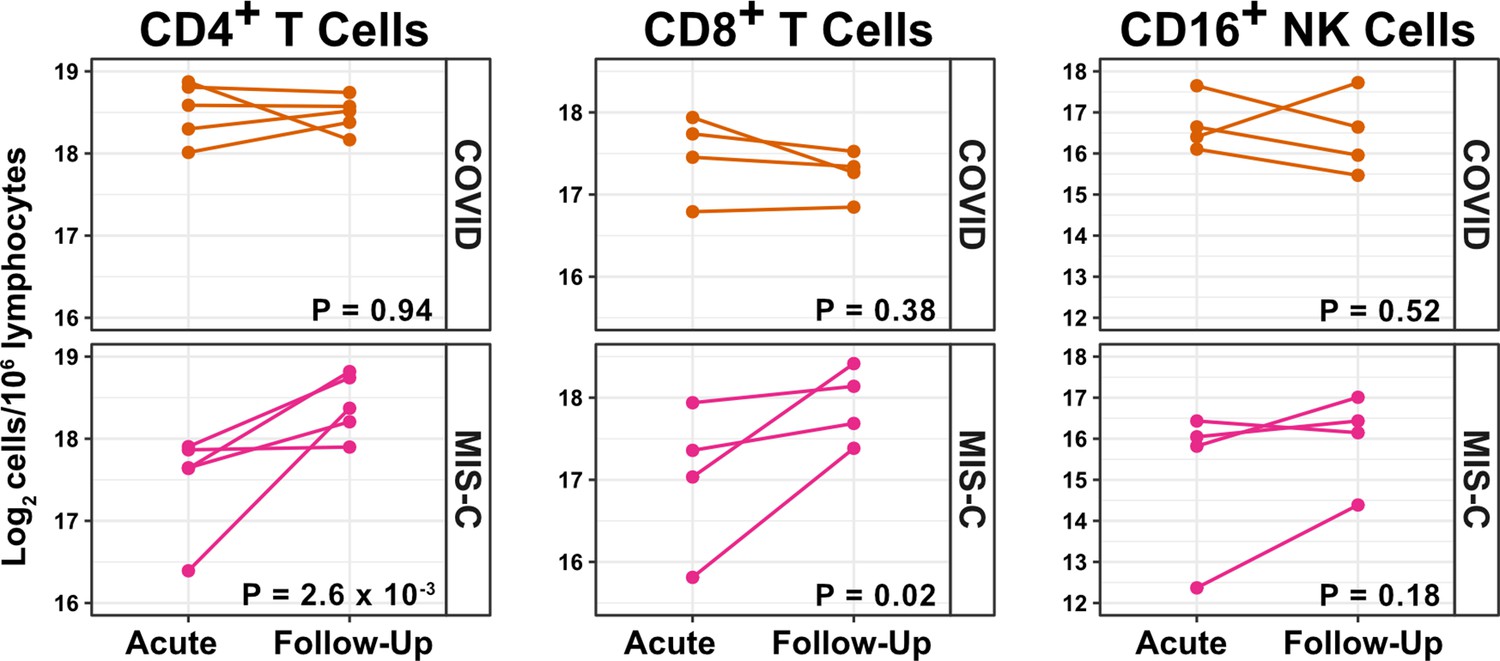
(A) Effect of age (X-axis) on log2 abundance per million lymphocytes of the indicated lymphoid cell populations (Y-axis), as determined by the regression analysis in Table 5. Each dot represents an individual blood donor, with yellow for female and blue for male. Shading represents the 95% CI. The p-values are from the regression analysis for comparisons to the control group. (B) Log2 abundance per million lymphocytes of the indicated lymphoid cell populations, shown as estimated marginal means with 95% CI, generated from the multiple linear regressions in Supplementary file 2g that included the combined pediatric and adult control data, and averaged across age and sex. The p-values represent pairwise comparisons on the estimated marginal means, adjusted for multiple comparisons with the Tukey method. Adjusted p-values < 0.05 are shown. (C) Association of CRP with log2 abundance of ILCs per million lymphocytes. Shading represents the 95% CI. Each dot represents a single blood donor, orange for COVID-19, magenta for MIS-C. The p-value is for the effect of ILC abundance on CRP as determined by linear regression. (D) Log2 ILC abundance per million lymphocytes in longitudinal pairs of samples collected during acute presentation and during follow-up, from individual children with COVID-19 or MIS-C. Each pair of dots connected by a line represents an individual blood donor. The p-values are for change in ILC abundance at follow-up, as determined with a linear mixed model, adjusting for age, sex, and group, and with patient as a random effect. (E) Effect of time to follow-up (X-axis) on log2 abundance per million lymphocytes of the indicated lymphoid cell populations (Y-axis). The p-values are for the difference between the COVID-19 and MIS-C follow-up groups, independent of time to follow-up as determined by multiple linear regression. Shading represents the 95% CI.
-
Figure 4—source data 1
Combined demographic, clinical, and flow cytometry data for pediatric COVID-19, MIS-C, and control cohorts.
Data included in this file are associated with Figures 1 and 4; Figure 4—figure supplement 1; Figure 4—figure supplement 2; Table 5, and Supplementary file 2f,g. File name: Pediatric_ COVID_MISC_andControl_data.xlsx.
- https://cdn.elifesciences.org/articles/74681/elife-74681-fig4-data1-v2.xlsx
Figure 4—figure supplement 1
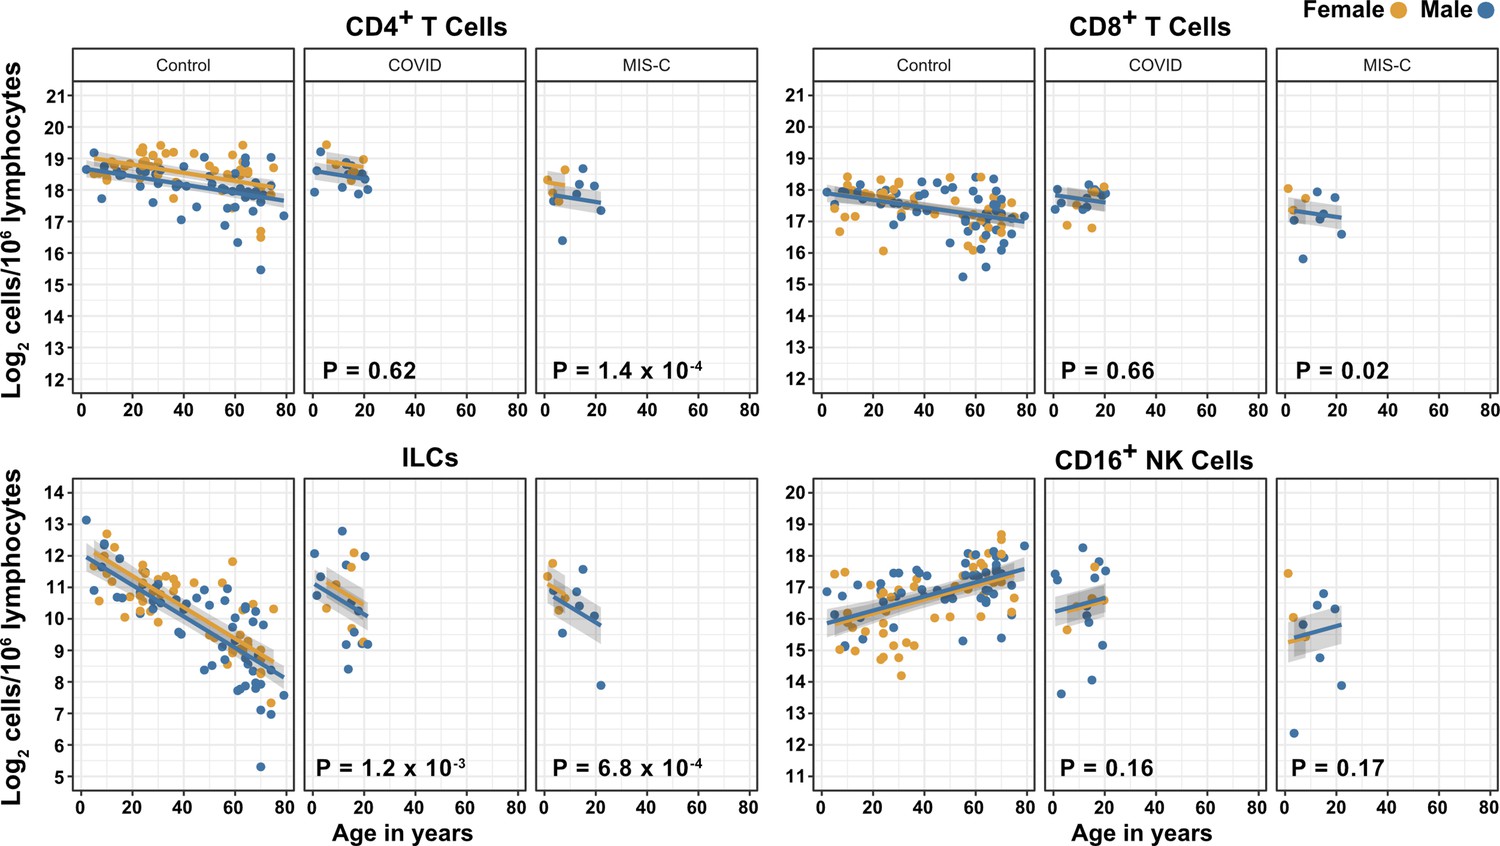
Effects of pediatric COVID-19 and MIS-C on blood lymphoid cell subsets in comparison to full combined adult and pediatric control group.
Effect of age (X-axis) on log2 abundance per million total lymphocytes of the indicated lymphoid cell populations (Y-axis). Each dot represents an individual blood donor, with yellow for female and blue for male. Shading represents the 95% CI. The p-values are from the regression analysis for comparisons to the control group.
Figure 4—figure supplement 2
T cells increase during follow-up from MIS-C.
Log2 ILC abundance per million lymphocytes in longitudinal pairs of samples collected during acute presentation and during follow-up, from individual children with COVID-19 or MIS-C. The p-values are for change in ILC abundance at follow-up, as determined with linear mixed models, adjusting for age, sex, and group, and with patient as a random effect. Differences in sample size among cell types was due to limited sample availability.
Figure 5
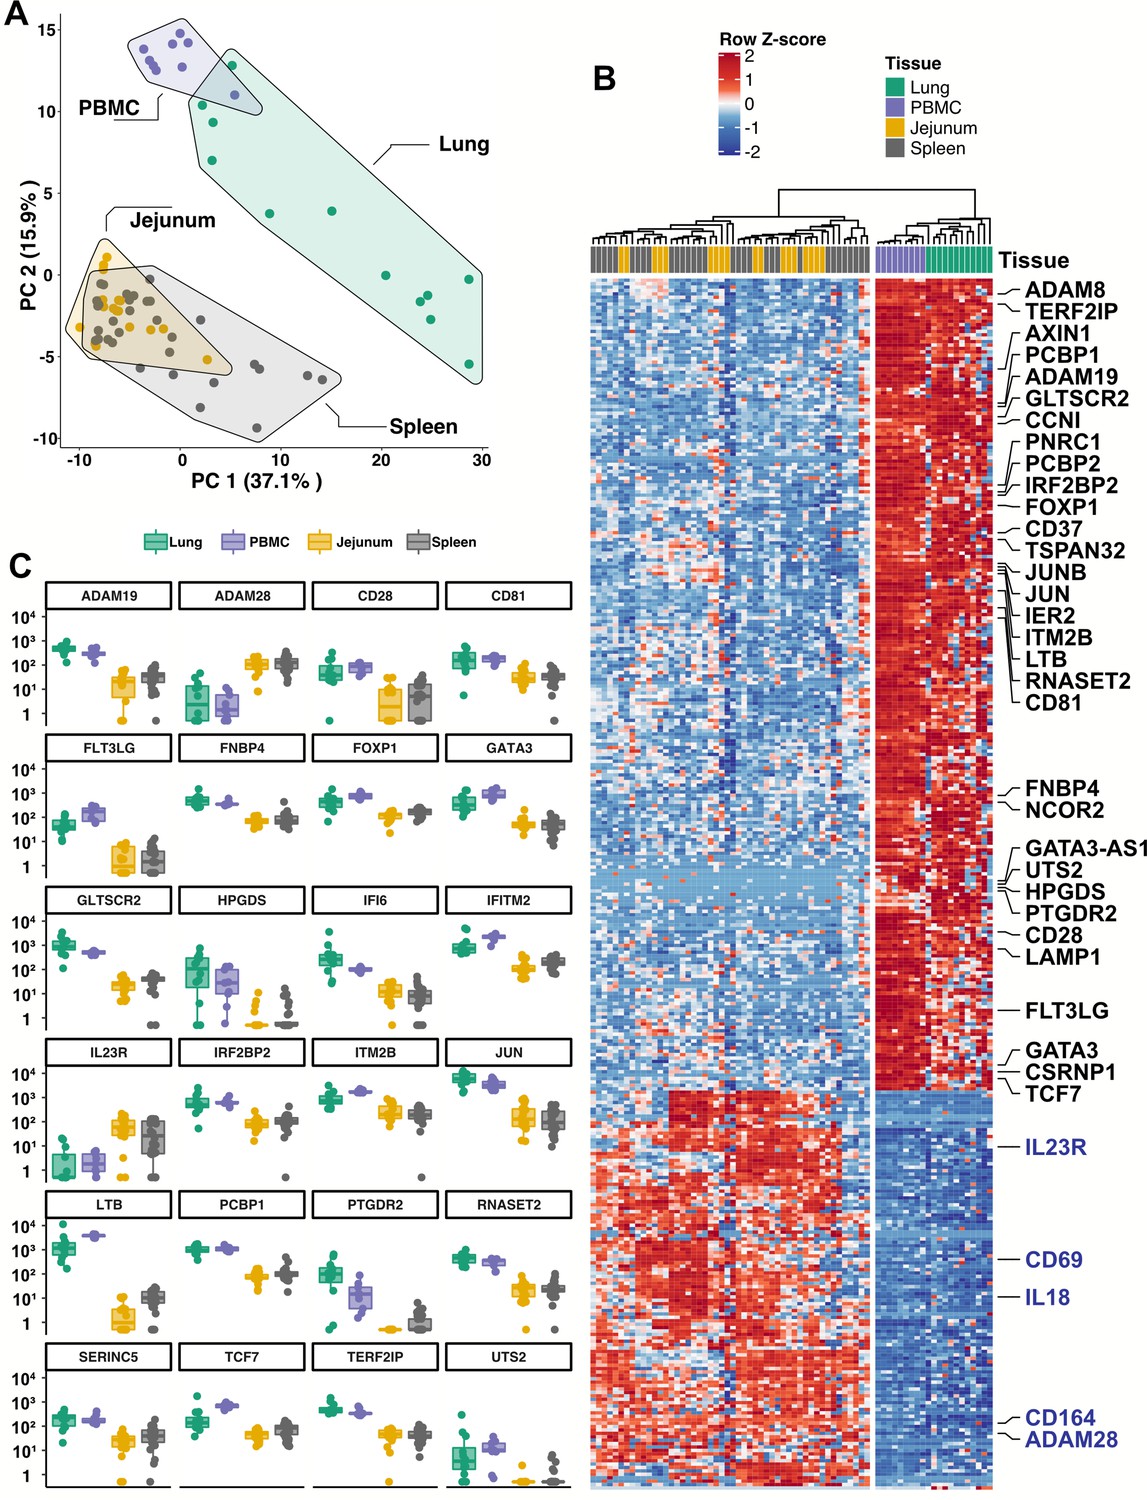
Blood ILCs are transcriptionally similar to lung ILCs.RNA-Seq of ILCs sorted from blood of 9 SARS-CoV-2-uninfected controls in comparison to RNA-Seq data of ILCs sorted from jejunum, lung, and spleen.
(A) PCA plot of first two principal components calculated from the top 250 most variable genes across all samples. Each dot represents an individual sample with blue for ILCs sorted from blood, green for lung, yellow for jejunum, and grey for spleen. (B) Heatmap of 355 genes differentially expressed (fold-change >1.5, padj <0.01 as determined with DESeq2) between either blood or lung ILCs and ILCs from the other tissues. (C) Select genes from (B) plotted as DESeq2 normalized counts. Each dot represents an individual sample with blue for ILCs sorted from blood, green for lung, yellow for jejunum, and grey for spleen. Boxplots represent the distribution of the data with the center line drawn through the median with the upper and lower bounds of the box at the 75th and 25th percentiles, respectively. The upper and lower whiskers extend to the largest or smallest values within 1.5 x the interquartile range (IQR).
Figure 6 with 1 supplement
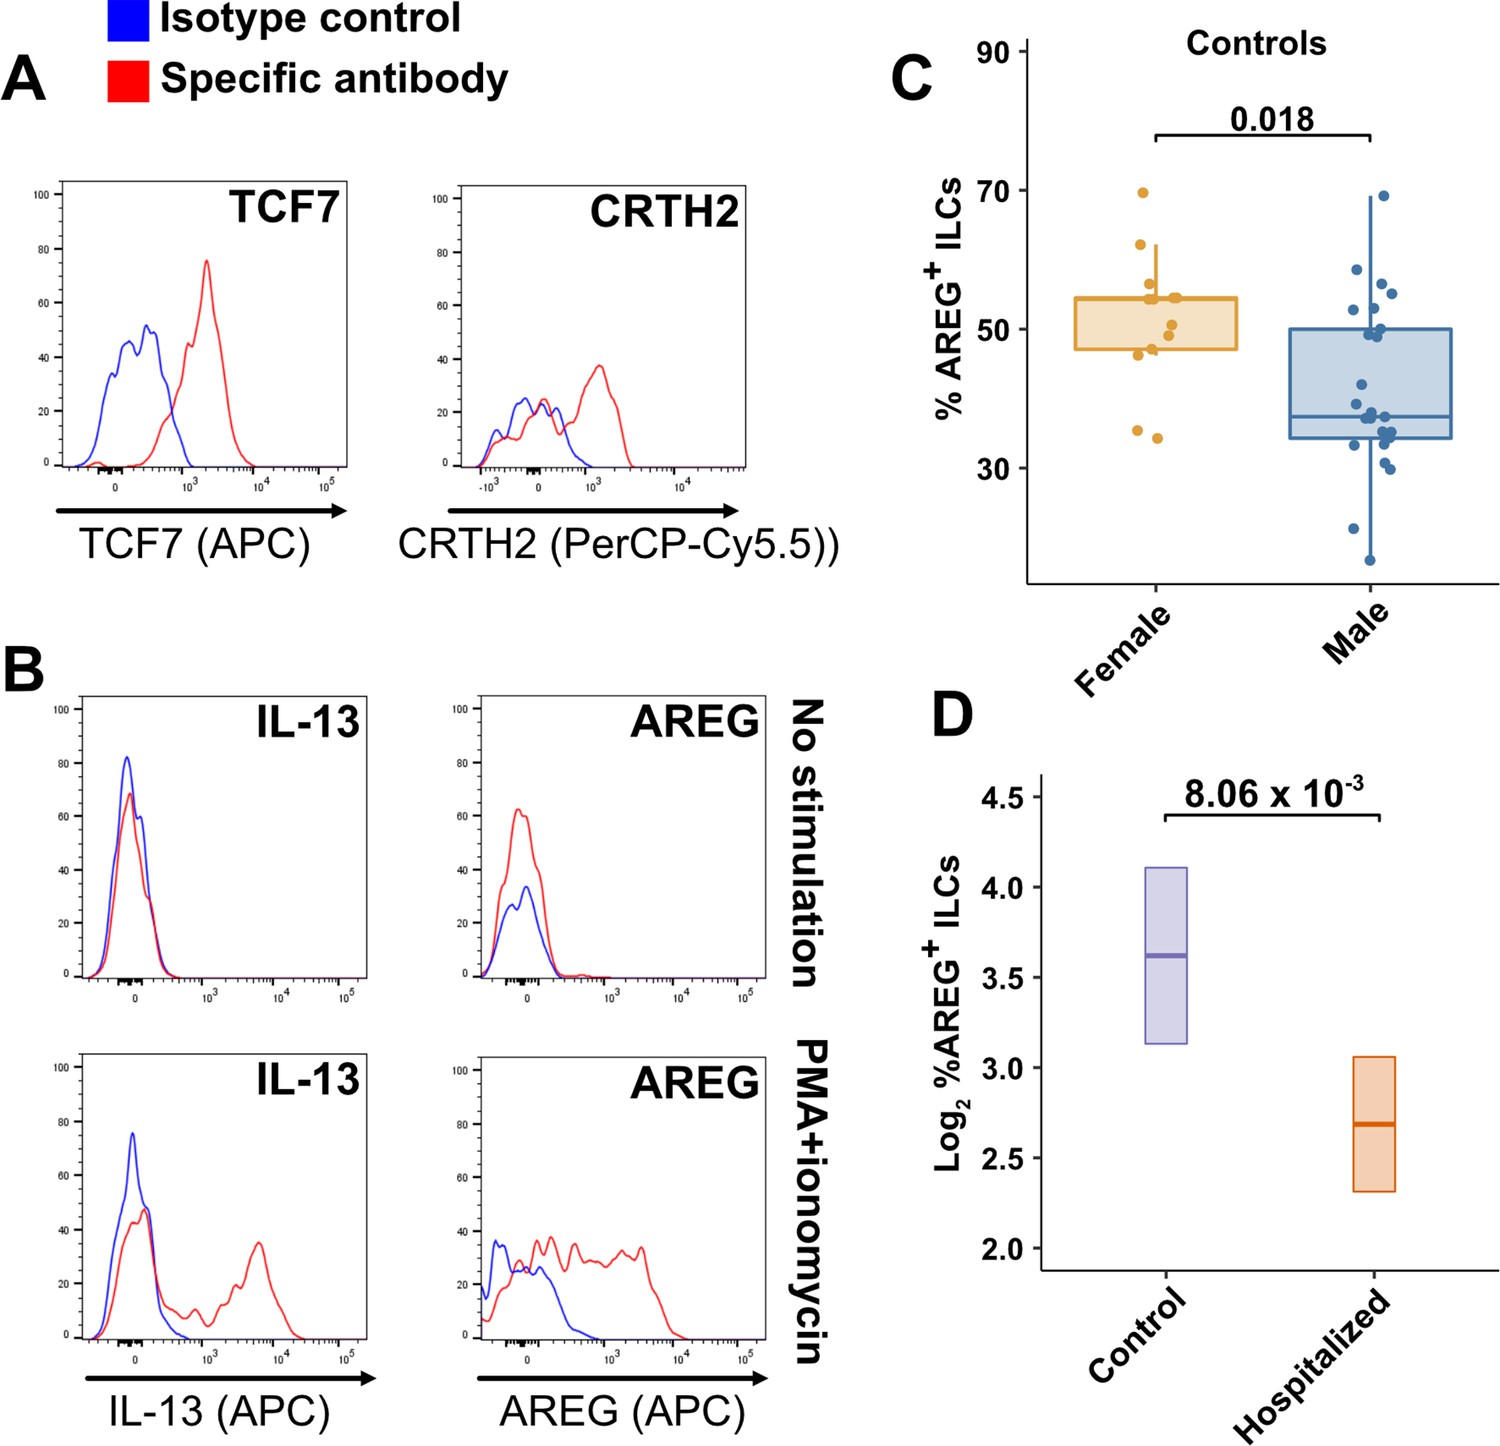
Peripheral blood ILCs exhibit homeostatic ILC2 functions.
(A–B) Flow cytometry for the indicated proteins. Cells in (A) were assayed at steady-state and cells in (B) were assayed either at steady-state or after stimulation with PMA and ionomycin, as indicated. Detection of surface proteins was performed on ILCs gated as Lin-CD56-CD127+ and detection of intracellular proteins was performed on ILCs gated as Lin-TBX21-CD127+. (C) Percent of AREG+ ILCs in blood of control blood donors after stimulation with PMA and ionomycin and gated as Lin-TBX21-CD127+. Each dot represents an individual blood donor (N Female = 13, N Male = 25). Boxplots represent the distribution of the data with the center line drawn through the median with the upper and lower bounds of the box at the 75th and 25th percentiles respectively. The upper and lower whiskers extend to the largest or smallest values within 1.5 x the interquartile range (IQR). The p-value is from a two-sided, Wilcoxon rank-sum test. (D) Log2 percent AREG+ ILCs in blood of controls or people hospitalized with COVID-19 after stimulation with PMA and ionomycin and gated as Lin-TBX21-. Data shown as estimated marginal means with 95% CI, generated from the multiple linear regression reported in the text and averaged across age and sex. The p-value is from the regression analysis.
-
Figure 6—source data 1
Amphiregulin (AREG) flow cytometry data presented in Figure 6 and Figure 6—figure supplement 1.
File name: AREG_in_ILCs.xlsx.
- https://cdn.elifesciences.org/articles/74681/elife-74681-fig6-data1-v2.xlsx
Figure 6—figure supplement 1
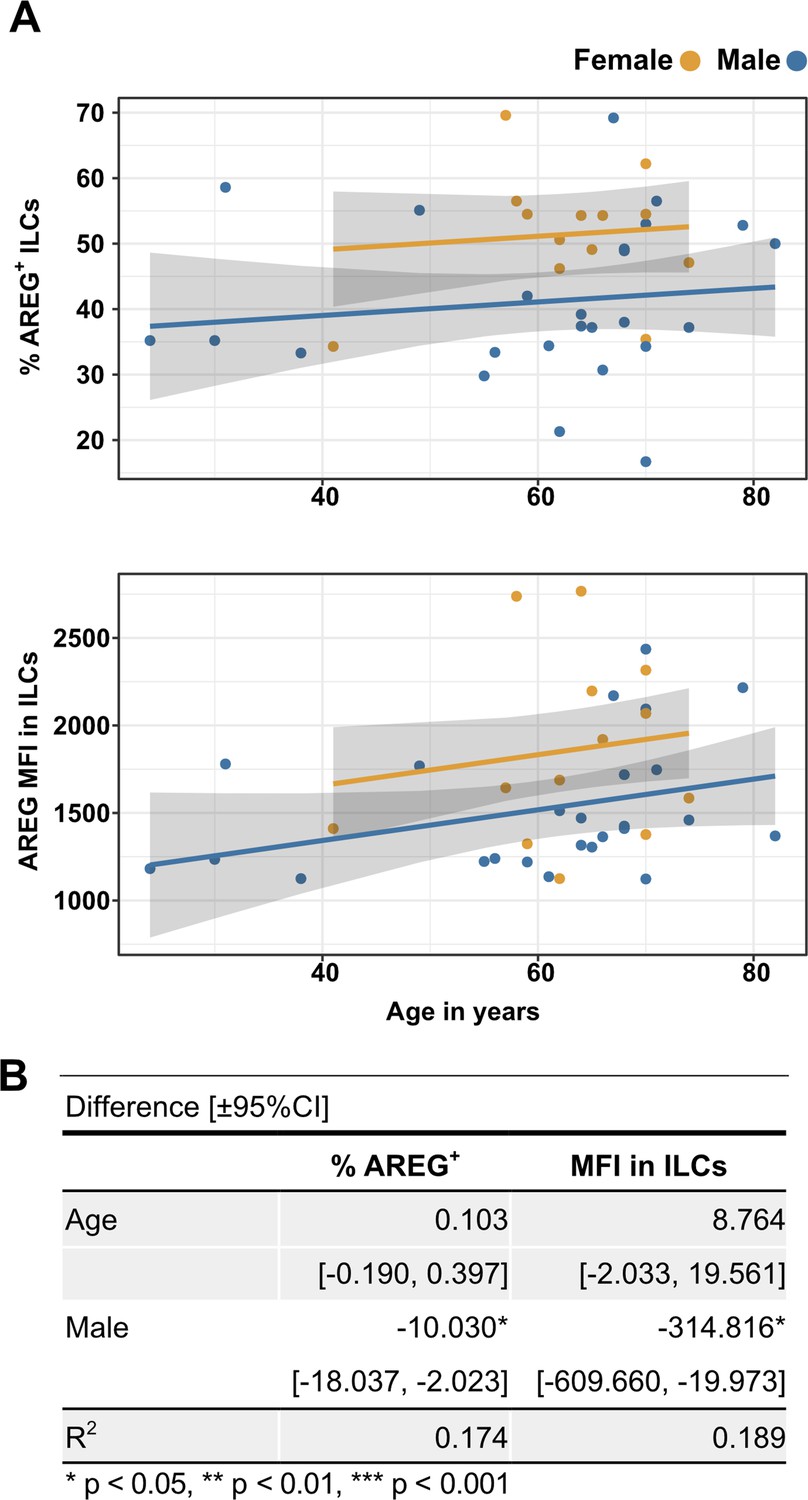
Males have lower percent AREG+ ILCs, and lower AREG MFI in ILCs, than do females, and there is no effect of age on these parameters.
(A) Effect of age (X-axis) on % AREG+ ILCs or MFI in ILCs (Y-axis as indicated). Each dot represents an individual blood donor, with yellow for female and blue for male. Shading represents the 95% CI. (B) Table of results for regression analyses plotted in (A).
Tables
Key resources table
| Reagent type (species) or resource | Designation | Source or reference | Identifiers | Additional information |
|---|---|---|---|---|
| Antibody | Anti-Human BDCA1 (mouse monoclonal) | Biolegend | Cat# 354,208 | Clone: 201 A (FITC) (1:200 dilution) |
| Antibody | Anti-Human CD117 (mouse monoclonal) | Biolegend | Cat# 313,206 | Clone: 104D2 (APC) (1:200 dilution) |
| Antibody | Anti-Human CD11c (mouse monoclonal) | Biolegend | Cat# 301,604 | Clone: 3.9 (FITC) (1:200 dilution) |
| Antibody | Anti-Human CD123 (mouse monoclonal) | Biolegend | Cat# 306,014 | Clone: 6H6 (FITC) (1:200 dilution) |
| Antibody | Anti-Human CD127 (mouse monoclonal) | Biolegend | Cat# 351,320 | Clone: A019D5 (PE/Cyanine7) (1:200 dilution) |
| Antibody | Anti-Human CD14 (mouse monoclonal) | Biolegend | Cat# 325,604 | Clone: HCD14 (FITC) (1:200 dilution) |
| Antibody | Anti-Human CD16 (mouse monoclonal) | Biolegend | Cat# 980,104 | Clone: 3G8 (APC) (1:400 dilution) |
| Antibody | Anti-Human CD19 (mouse monoclonal) | Biolegend | Cat# 302,206 | Clone: HIB19 (FITC) (1:200 dilution) |
| Antibody | Anti-Human CD1a (mouse monoclonal) | Biolegend | Cat# 300,104 | Clone: HI149 (FITC) (1:200 dilution) |
| Antibody | Anti-Human CD20 (mouse monoclonal) | Biolegend | Cat# 302,304 | Clone: 2H7a (FITC) (1:200 dilution) |
| Antibody | Anti-Human CD22 (mouse monoclonal) | Biolegend | Cat# 363,508 | Clone: S-HCL-1 (FITC) (1:200 dilution) |
| Antibody | Anti-Human CD3 (mouse monoclonal) | Biolegend | Cat# 317,306 | Clone: OKT3 (FITC) (1:200 dilution) |
| Antibody | Anti-Human CD34 (mouse monoclonal) | Biolegend | Cat# 343,504 | Clone: 581 (FITC) (1:200 dilution) |
| Antibody | Anti-Human CD4 (mouse monoclonal) | Biolegend | Cat# 317,428 | Clone: OKT4 (PerCP/Cyanine5.5) (1:200 dilution) |
| Antibody | Anti-Human CD4 (mouse monoclonal) | Biolegend | Cat# 317,408 | Clone: OKT4 (FITC) (1:200 dilution) |
| Antibody | Anti-Human CD45 (mouse monoclonal) | BD | Cat# 560,178 | Clone: 2D1 (APC/H7) (1:200 dilution) |
| Antibody | Anti-Human CD56 (mouse monoclonal) | Biolegend | Cat# 318,306 | Clone: HCD56 (PE) (1:200 dilution) |
| Antibody | Anti-Human CD8 (mouse monoclonal) | Biolegend | Cat# 300,924 | Clone: HIT8a (PerCP/Cyanine 5.5) (1:200 dilution) |
| Antibody | Anti-Human CRTH2 (rat monoclonal) | Biolegend | Cat# 350,116 | Clone: BM16 (PerCP/Cyanine5.5) (1:200 dilution) |
| Antibody | Anti-Human FcεR1α (mouse monoclonal) | Biolegend | Cat# 334,608 | Clone: AER-37 (FITC) (1:200 dilution) |
| Antibody | Anti-Human TBX21 (mouse monoclonal) | ebioscience | Cat# 25-5825-82 | Clone: ebio4B10 (PE/Cyanine7) (1:200 dilution) |
| Antibody | Anti-Human TCRα/β (mouse monoclonal) | Biolegend | Cat# 306,706 | Clone: IP26 (FITC) (1:200 dilution) |
| Antibody | Anti-Human TCRγ/δ (mouse monoclonal) | Biolegend | Cat# 331,208 | Clone: B1 (FITC) (1:200 dilution) |
| Antibody | Anti-Human TCF7 (rabbit monoclonal) | Cell Signaling | Cat# 37,636 s | Clone: C63D9 (APC) (1:200 dilution) |
| Antibody | Anti-Human IL-13 (rat monoclonal) | Biolegend | Cat# 501,908 | Clone: JES10-5A2 (APC) (1:200 dilution) |
| Antibody | Anti-Human AREG (mouse monoclonal) | ebioscience | Cat# 17-5370-42 | Clone: AREG559 |
| Antibody | mouse IgG1, k isotype control (mouse monoclonal) | Biolegend | Cat# 400,112 | Clone: MOPC-21 (PE) (1:200 dilution) |
| Antibody | mouse IgG1, k isotype control (mouse monoclonal) | Biolegend | Cat# 400,120 | Clone: MOPC-21 (APC) (1:200 dilution) |
| Antibody | Rabbit IgG, isotype control (rabbit monoclonal) | Cell Signaling | Cat# 3,452 S | (Alexa Fluor 647) (1:200 dilution) |
| Antibody | Rat IgG1, k isotype control (rat monoclonal) | Biolegend | Cat# 400,412 | Clone: RTK2071 (APC) (1:200 dilution) |
| Biological Samples (Homo sapiens) | PBMCs | New York Biologics | https://www.newyorkbiologics.com/ | |
| Biological Samples (Homo sapiens) | PBMCs | MassCPR | https://masscpr.hms.harvard.edu/ | |
| Biological Samples (Homo sapiens) | PBMCs | MGH Pediatric COVID-19 Biorepository | ||
| Commercial assay or kit | Cell stimulation cocktail | eBioscience | Cat# 00-4970-03 | |
| Chemical compound, drug | Protein transport inhibitor | eBioscience | Cat# 00-4980-03 | |
| Chemical compound, drug | TRIzol reagent | Invitrogen | Cat# 15596018 | |
| Commercial assay or kit | AMPure XP beads | Beckman Culter | Cat# A63880 | |
| Commercial assay or kit | ExoSAP-IT | Affymetrix | Cat# 78,200 | |
| Commercial assay or kit | Live and Dead violet viability kit | Invitrogen | Cat# L-34963 | |
| Commercial assay or kit | Foxp3 /Transcription Factor Staining Buffer Set | eBioscience | Cat# 00-5523-00 | |
| Commercial assay or kit | HiScribe T7 High Yield RNA Synthesis Kit | NEB | Cat# E2040S | |
| Commercial assay or kit | NEBNext Ultra II Non directional Second Strand Synthesis Module | NEB | Cat# E6111L | |
| Software, algorithm | R computer software environment (version 4.0.2) | The R Foundation R Development Core Team, 2020 | https://www.r-project.org/ | |
| Software, algorithm | FlowJo | FlowJo, LLC | https://www.flowjo.com/ | |
| Software, algorithm | tidyverse v1.3.1 | Wickham et al., 2019 | https://www.tidyverse.org | |
| Software, algorithm | ggplot2 v3.3.3 | Wickham, 2016 | https://ggplot2.tidyverse.org | |
| Software, algorithm | ggpubr v0.4.0 | Kassambara, 2020 | https://rpkgs.datanovia.com/ggpubr/ | |
| Software, algorithm | ComplexHeatmap v2.4.3 | Gu et al., 2016 | https://github.com/jokergoo/ComplexHeatmap | |
| Software, algorithm | emmeans v1.6.0 | Wieduwilt et al., 2020 | https://CRAN.R-project.org/package=emmeans | |
| Software, algorithm | lme4 v1.1–27 | Bates et al., 2015 | https://cran.r-project.org/web/packages/lme4/index.html | |
| Software, algorithm | lmerTest v3.1–3 | Kuznetsova et al., 2017 | https://cran.r-project.org/web/packages/lmerTest/index.html | |
| Software, algorithm | DolphinNext RNA-Seq pipeline (Revision 4) | Yukselen et al., 2020 | https://github.com/UMMS-Biocore/dolphinnext | |
| Software, algorithm | STAR v2.1.6 | Dobin et al., 2013 | https://github.com/alexdobin/STAR | |
| Software, algorithm | RSEM v1.3.1 | Li and Dewey, 2011 | http://deweylab.github.io/RSEM/ | |
| Software, algorithm | DESeq2 v1.28.1 | Love et al., 2014 | https://bioconductor.org/packages/release/bioc/html/DESeq2.html | |
| Software, algorithm | clusterProfiler v3.16.1 | Yu et al., 2012 | https://guangchuangyu.github.io/software/clusterProfiler/ |
Table 1
Demographic and clinical characteristics of adult blood donor groups.
| Characteristic | ControlN = 86 | HospitalizedN = 40 | OutpatientN = 51 |
|---|---|---|---|
| Mean age (range) - years | 50.9 (23–79) | 57.6 (24–83) | 36.8 (23–77) |
| Sex – number (%) | |||
| Male | 48 (55.8) | 24 (60) | 13 (25.5) |
| Female | 38 (44.2) | 16 (40) | 38 (74.5) |
| Mean symptom duration at sample collection (range) – days | 21.8 (5–66) | 26.9 (1–61) | |
| Diabetes mellitus diagnosis – number (%) | 11 (27.5) | 1 (2) | |
| ICU admission – number (%) | 33 (82.5) | ||
| Intubation with mechanical ventilation – number (%) | 32 (80) | ||
| Deaths – number (%) | 7 (17.5) | ||
| Mean time hospitalized (range) – days | 34.2 (4–87) | ||
| Max lab value – mean (range) | |||
| CRP – mg/L | 228.6 (6.5–539.5) | ||
| ESR – mm/h | 89.0 (15–146) | ||
| D-dimer – (ng/mL) | 5700 (351–11923) |
Table 2
Change in cell abundance due to age, sex, and COVID-19 severity fold difference (log2) [± 95% CI].
| CD4+ T* | ILC* | CD8+ T* | CD16+ NK* | |
|---|---|---|---|---|
| Age | –0.012*** | –0.043*** | –0.009* | 0.021*** |
| [–0.018,–0.005] | [–0.053,–0.033] | [–0.016,–0.002] | [0.010, 0.032] | |
| Male | –0.409*** | –0.334* | –0.177 | 0.184 |
| [–0.618,–0.201] | [–0.659,–0.010] | [–0.406, 0.051] | [–0.169, 0.538] | |
| Hospitalized | 0.168 | –0.835*** | 0.227 | –1.205*** |
| [–0.084, 0.421] | [–1.228,–0.441] | [–0.050, 0.503] | [–1.633,–0.778] | |
| Outpatient | 0.332* | –0.088 | –0.023 | –0.522* |
| [0.082, 0.581] | [–0.478, 0.302] | [–0.298, 0.253] | [–0.948,–0.095] | |
| R2 | 0.275 | 0.478 | 0.070 | 0.232 |
-
*p< 0.05, **p < 0.01, ***p < 0.001.
-
*
per 106 lymphocytes.
Table 3
Odds of hospitalization*.
| Cell count† | Odds ratio‡ | 95% Confidence interval | p-value |
| CD4+ T | 0.576 | 0.211–1.28 | 0.198 |
| ILC | 0.454 | 0.213–0.808 | 0.018 |
| CD8+ T | 1.2 | 0.584–3.06 | 0.652 |
| CD16+ NK | 0.841 | 0.538–1.27 | 0.412 |
-
*
Adjusted for age, sex, diagnosis of diabetes mellitus, and symptom duration at time of sample collection.
-
†
per 106 lymphocytes.
-
‡
per twofold increase in cell population abundance.
Table 4
Association of cell type abundance with time in hospital and laboratory values*.
| Cell count† | Days hospitalized | CRP (mg/L)‡ | ESR (mm/h)‡ | D-dimer (ng/mL)‡ |
|---|---|---|---|---|
| CD4+ T | –10.843 | –3.335 | –2.674 | –1868.847* |
| [–22.511, 0.825] | [–56.162, 49.492] | [–23.840, 18.492] | [–3375.630, –362.063] | |
| ILC | –9.381** | –46.288*** | –11.035* | –1098.515* |
| [–15.755,–3.008] | [–71.337, –21.238] | [-21.936,–0.134] | [–1932.842, –264.188] | |
| CD8+ T | 3.366 | 32.247 | 15.317 | 486.192 |
| [–8.992, 15.724] | [–16.509, 81.003] | [–4.127, 34.761] | [–1049.836, 2022.221] | |
| CD16+ NK | –4.775 | –14.619 | –5.159 | –404.873 |
| [–11.251, 1.701] | [–44.011, 14.774] | [–16.809, 6.491] | [–1316.261, 506.516] |
-
* p< 0.05, ** p < 0.01, *** p < 0.001.
-
*
coefficients are for each two-fold increase in cell population abundance, adjusted for age and sex [ ± 95% CI].
-
†
per 106 lymphoid cells.
-
‡
Maximum lab value recorded during course of hospitalization.
Table 5
Change in pediatric cohort cell abundance due to age, sex, and group.
Fold difference (log2) [± 95% CI].
| CD4+T* | ILC* | CD8+T* | CD16+NK* | |
|---|---|---|---|---|
| Age | –0.004 | –0.083** | 0.012 | 0.004 |
| [–0.027, 0.019] | [–0.135,–0.032] | [–0.014, 0.039] | [–0.060, 0.068] | |
| Male | –0.219 | –0.027 | 0.060 | –0.343 |
| [–0.492, 0.054] | [–0.640, 0.586] | [–0.249, 0.370] | [–1.098, 0.413] | |
| COVID | 0.018 | –0.754* | –0.088 | 0.416 |
| [–0.290, 0.327] | [–1.447,–0.061] | [–0.432, 0.257] | [–0.424, 1.257] | |
| MIS-C | –0.678*** | –1.098** | –0.503* | –0.498 |
| [–1.028,–0.328] | [–1.884,–0.313] | [–0.904,–0.101] | [–1.479, 0.483] | |
| R2 | 0.359 | 0.342 | 0.169 | 0.106 |
-
* p < 0.05, ** p < 0.01, *** p < 0.001
-
*
aper 106 lymphocytes
Additional files
-
Supplementary file 1
Antibodies and sequencing primers used here.
(a) Antibodies Used in Flow Cytometry. (b) Primers for bulk RNA-Seq.
- https://cdn.elifesciences.org/articles/74681/elife-74681-supp1-v2.xlsx
-
Supplementary file 2
Supplementary Tables.
(a) Race and Ethnicity of Adult Cohorts (b) Demographic and Clinical Characteristics of Pediatric Blood Donor Groups (c) Comparison of sex ratios between control age groups (d) Change in Lymphocyte Abundance Per 106 PBMCs Due to Age, Sex, and COVID-19 Severity in Adult cohorts (e) Change in Lymphoid Cell Abundance Per 106 PBMCs Due to Age, Sex, and COVID-19 Severity (f) Odds of Hospitalization in Pediatric Cohort (g) Change in Pediatric Cohort Lymphoid Cell Abundance Per 106 lymphocytes due to Group; Adjusted for Effects of Age and Sex with Combined Pediatric and Adult Control Data (h) Gene ontology analysis results.
- https://cdn.elifesciences.org/articles/74681/elife-74681-supp2-v2.xlsx
-
Transparent reporting form
- https://cdn.elifesciences.org/articles/74681/elife-74681-transrepform1-v2.pdf
Download links
A two-part list of links to download the article, or parts of the article, in various formats.
Downloads (link to download the article as PDF)
Open citations (links to open the citations from this article in various online reference manager services)
Cite this article (links to download the citations from this article in formats compatible with various reference manager tools)
Innate lymphoid cells and COVID-19 severity in SARS-CoV-2 infection
eLife 11:e74681.
https://doi.org/10.7554/eLife.74681


