Perception of a conserved family of plant signalling peptides by the receptor kinase HSL3
- The Sainsbury Laboratory, University of East Anglia, United Kingdom
- The Plant Signaling Mechanisms Laboratory, Department of Plant Molecular Biology, University of Lausanne, Switzerland
- Institute of Plant Molecular Biology, Zurich‐Basel Plant Science Center, University of Zurich, Switzerland
- MWSchmid GmbH, Switzerland
Figures
Figure 1 with 2 supplements

CTNIPs are a novel family of plant signalling peptide.
(a) Heat map showing log2(FC) expression levels of CTNIP1–4 in response to a range of elicitors (data obtained from Bjornson et al., 2021). CTNIP5 was excluded as it is unannotated in the TAIR10 annotation, which was used to map the RNA sequencing reads. (b) Sequence probability logo from Arabidopsis CTNIP1–4 generated using WebLogo3. Signal peptide (as predicted by SignalP5.0) and CTNIP motif are indicated, and conserved cysteine residues are highlighted in yellow. Amino acids are coloured based on their biochemical properties: red = acidic; blue = basic; black = hydrophobic, and green = polar. (c–d) Cytoplasmic calcium influx measured in p35S::AEQUORIN seedlings after treatment with 1 μM CTNIP relative to pre-treated levels (n = 8 seedlings). (c) Points represent mean; error bars represent SEM. (d) Represents mean relative Ca2+ influx between 5 and 15 min. A line represents mean; error bars represent SD. p-Values indicate significance relative to the wild-type (WT) control in a Dunnett’s multiple comparison test following one-way ANOVA. (e) Western blot using α-p42/p44-ERK recognising phosphorylated MAP kinases in seedlings treated with 100 nM CTNIPs or mock for 15 min. The membrane was stained with CBB, as a loading control. (f–g) ROS production in leaf disks collected from 4-week-old Arabidopsis plants induced by 1 μM CTNIP4 application (n ≥8). (f) Points represent mean; error bars represent SEM. (g) Integrated ROS production over 40 min. Line represents mean; error bars represent SD. p-Values indicate significance relative to the WT control in a two-tailed t-test. All experiments were repeated and analysed three times with similar results. ROS, reactive oxygen species; CBB, Coomassie brilliant blue.
-
Figure 1—source data 1
CTNIPs are a novel family of plant signalling peptide.
- https://cdn.elifesciences.org/articles/74687/elife-74687-fig1-data1-v2.xlsx
-
Figure 1—source data 2
CTNIP-induced MAPK phosphorylation.
- https://cdn.elifesciences.org/articles/74687/elife-74687-fig1-data2-v2.pdf
Figure 1—figure supplement 1
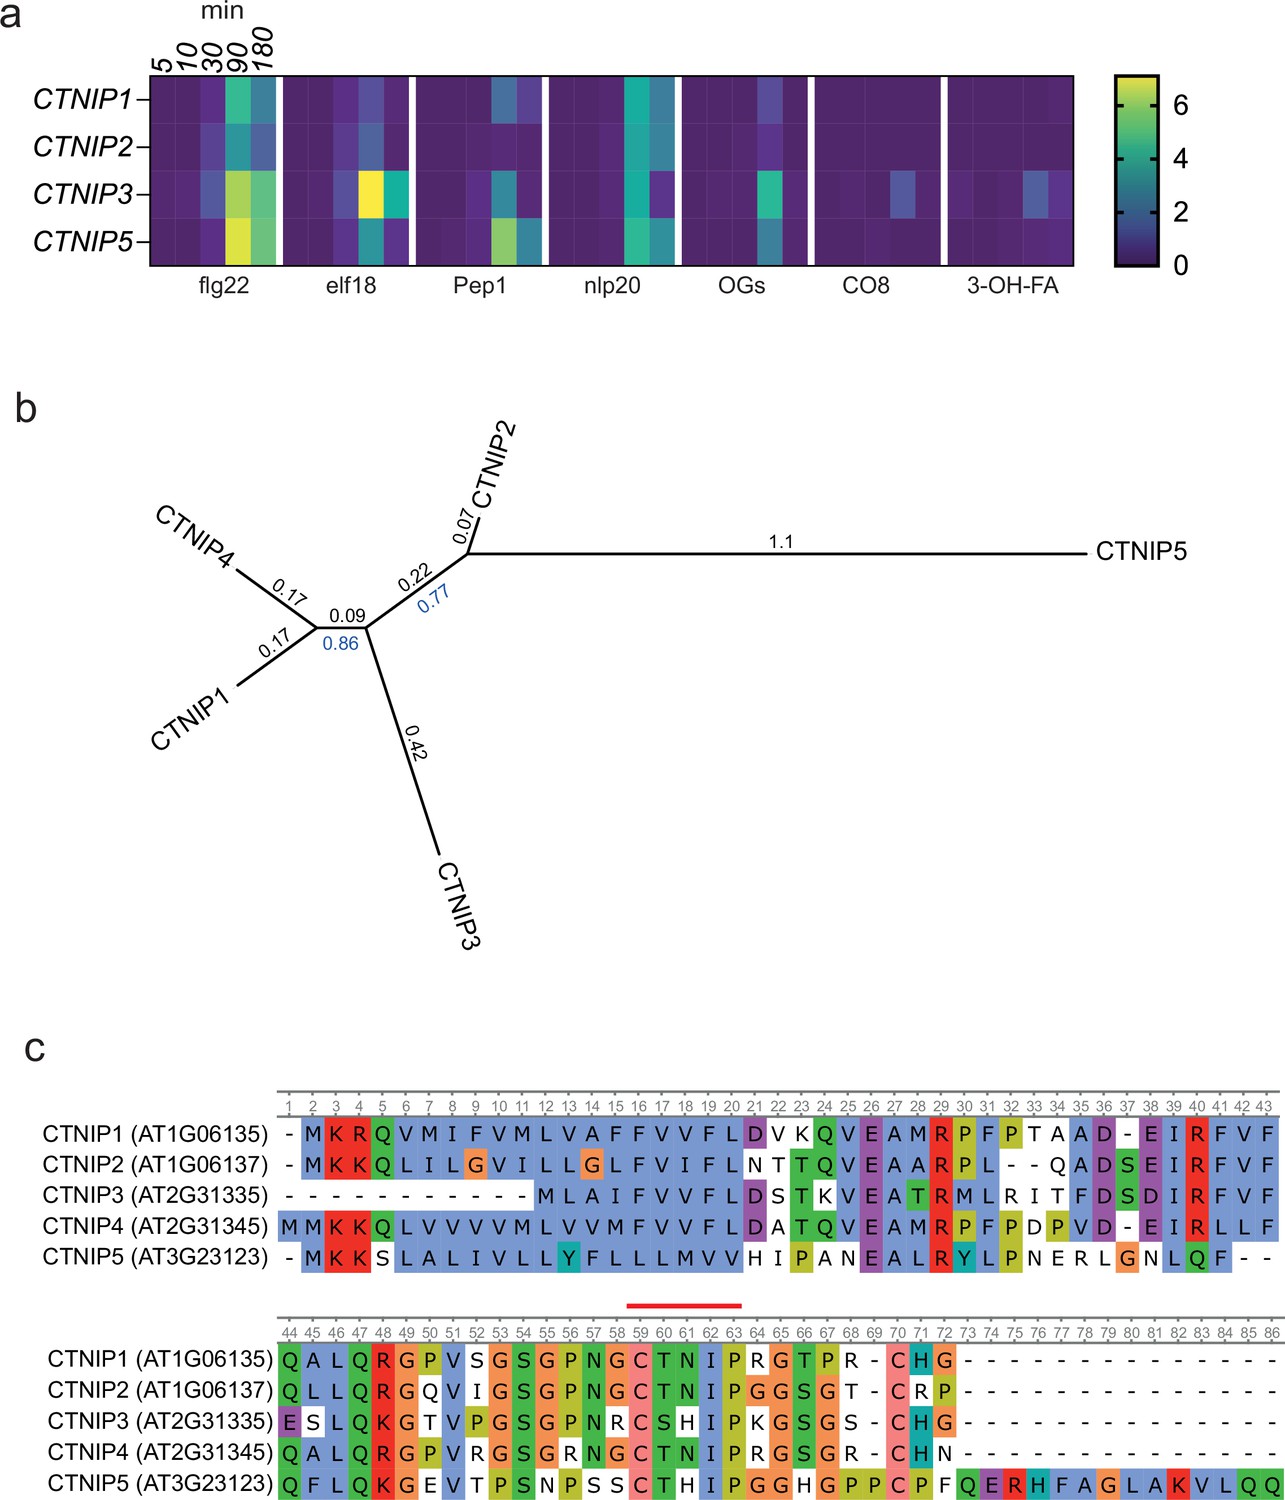
Alignment and phylogeny of Arabidopsis CTNIPs.
(a) Expression heat map showing log2(FC) expression levels of CTNIP1, CTNIP2, CTNIP3, and CTNIP5 taken from ArrayExpress which mapped to the Araport11 annotation (Athar et al., 2019; Bjornson et al., 2021). CTNIP4 overlaps with the adjacent transcript AT2G31340 in the Araport11 annotation. Thus, no reads mapped uniquely to CTNIP4 and consequently no differential expression data could be obtained. (b) Phylogeny of Arabidopsis CTNIPs. Full-length protein sequences were aligned using MUSCLE and a phylogeny was inferred using the maximum-likelihood method and JTT matrix-based model conducted in MEGAX. 1000 bootstraps were performed and values shown in blue. Branch lengths are shown in black. (c) Alignment used to generate (b). CTNIP motif is highlighted in red.
-
Figure 1—figure supplement 1—source data 1
Expression levels of CTNIP1, CTNIP2, CTNIP3, and CTNIP5.
- https://cdn.elifesciences.org/articles/74687/elife-74687-fig1-figsupp1-data1-v2.xlsx
Figure 1—figure supplement 2
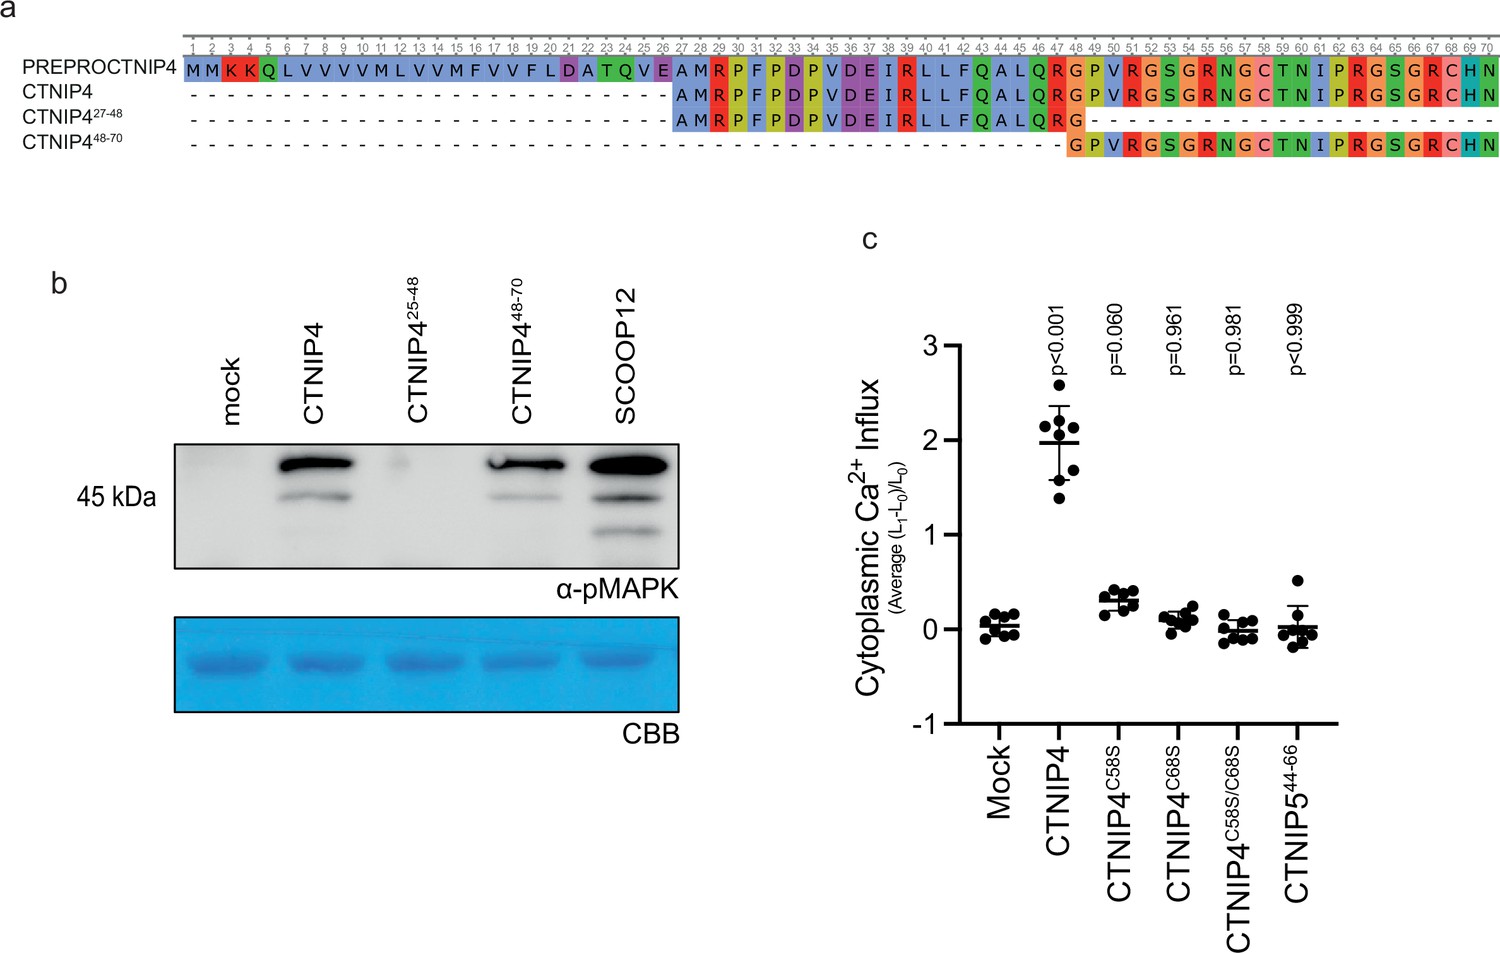
Characterisation of CTNIP synthetic peptides.
(a) Alignment of CTNIP4 peptide sequences used in this manuscript. (b) Western blot using α-p42/p44-ERK recognising phosphorylated MAP kinases in seedlings treated with 100 nM CTNIP4 fragments or mock for 15 min. The membrane was stained with Coomassie brilliant blue (CBB), as a loading control. (c) Mean relative Ca2+ influx induced by 1 μM CTNIP in p35S::AEQUORIN seedlings between 5 and 15 min, relative to pre-treatment (n = 8 seedlings). A line represents mean; error bars represent SD. p-Values indicate significance relative to the wild-type (WT) control in a Dunnett’s multiple comparison test following one-way ANOVA.
-
Figure 1—figure supplement 2—source data 1
CTNIP-induced calcium influx.
- https://cdn.elifesciences.org/articles/74687/elife-74687-fig1-figsupp2-data1-v2.xlsx
-
Figure 1—figure supplement 2—source data 2
CTNIP-induced MAPK phosophorylation.
- https://cdn.elifesciences.org/articles/74687/elife-74687-fig1-figsupp2-data2-v2.pdf
Figure 2 with 3 supplements
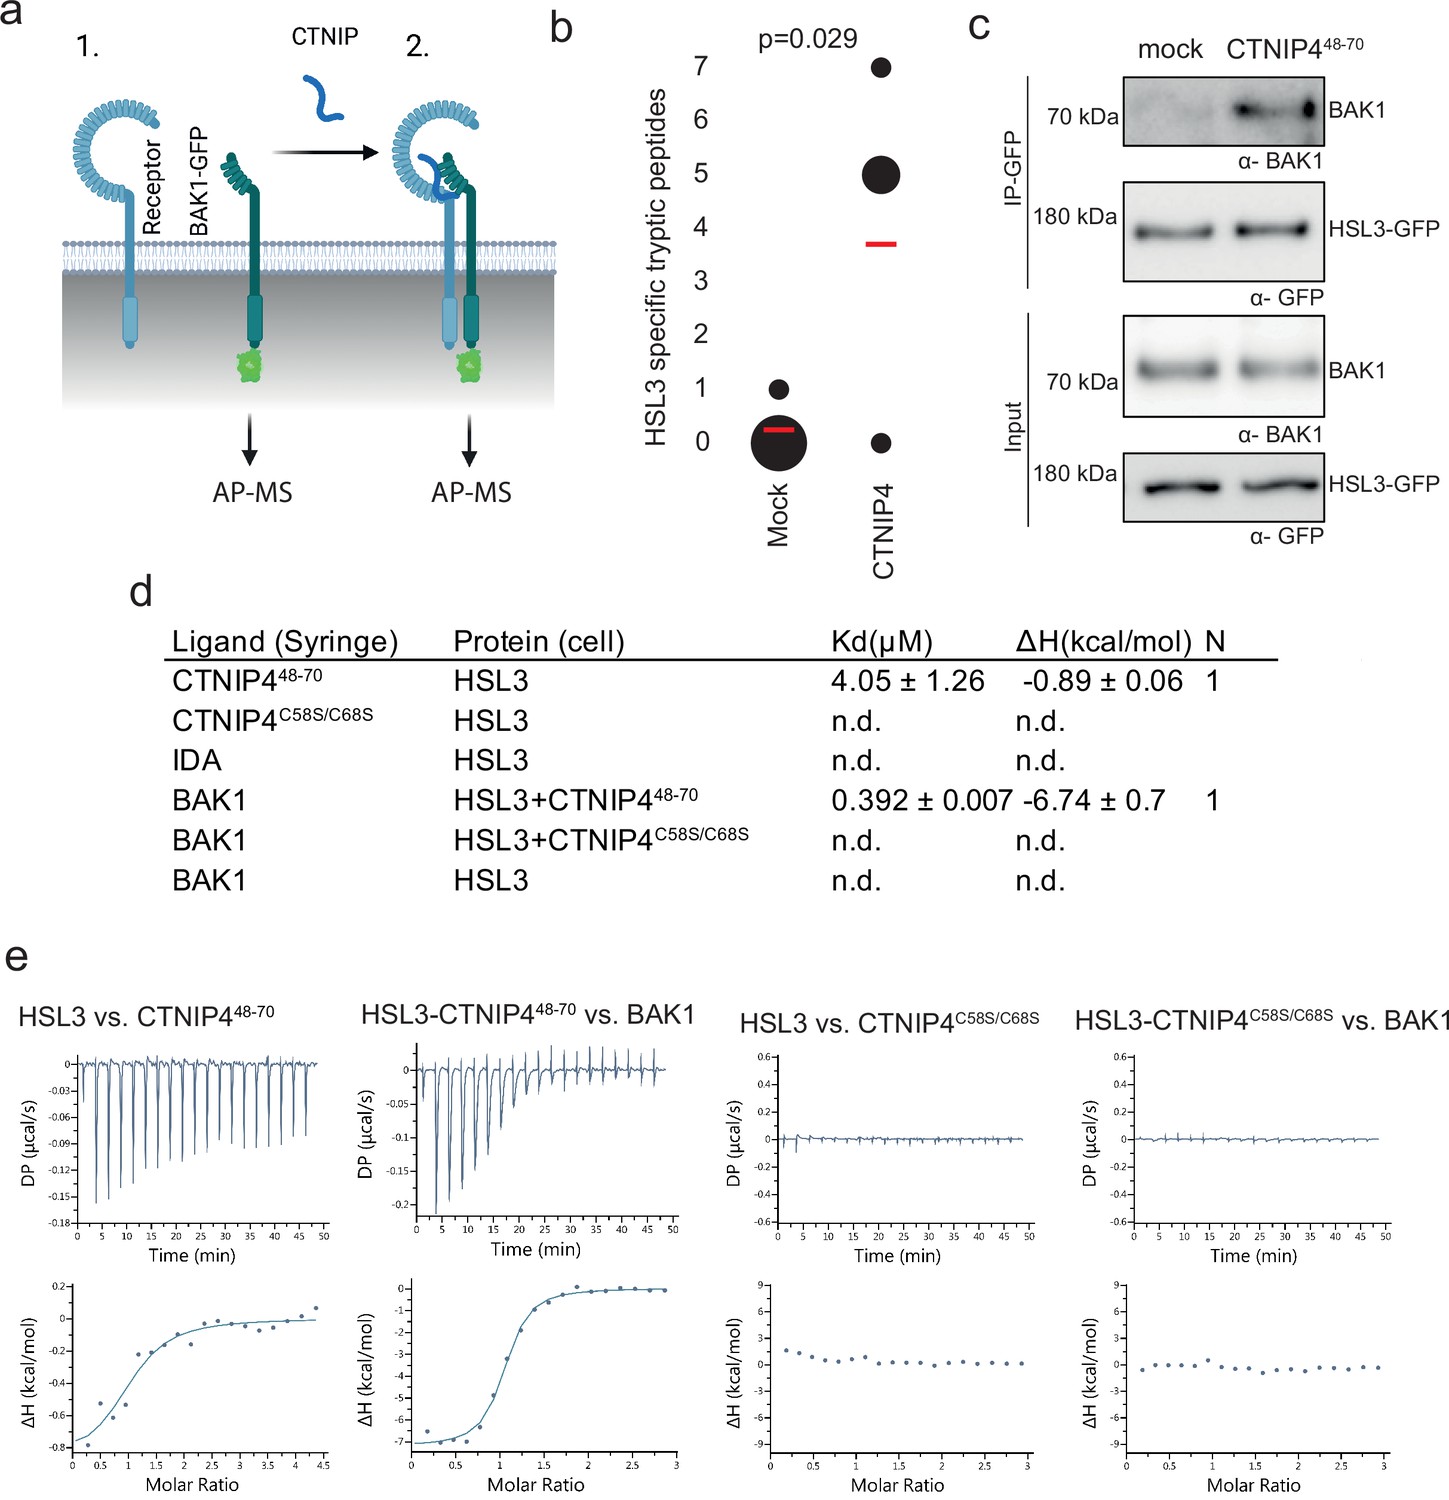
HAESA-LIKE 3 (HSL3) forms a CTNIP-induced receptor complex with BAK1.
(a) Schematic representation of BAK1-GFP immunoprecipitation in the (1) absence or (2) presence of CTNIP4 treatment to identify protein associations induced by CTNIP. Figure generated using Biorender. (b) HSL3-specific spectral counts identified in four independent biological replicates where BAK1-GFP was pulled down in the presence or absence of 1 μM CTNIP4 treatment. Circle diameter is proportional to the number of replicates. Red lines indicate the mean spectral counts for each treatment. p-Values indicate significance relative to the untreated control in a two-tailed t-test. (c) Affinity purification of BAK1 with HSL3-GFP from HSL3-GFP seedlings treated with 1 μM CTNIP448-70 or water for 10 min. Western blots were probed with antibodies α-GFP and α-BAK1. This experiment was repeated three times with similar results. (d) Isothermal titration calorimetry (ITC) summary table of HSL3 vs. CTNP448-70, CTNP4C58S/C68S and INFLORESCENCE DEFICIENT IN ABSCISSION (IDA) peptides, and contribution of the BAK1 co-receptor to the ternary complex formation. Kd, (dissociation constant) indicates the binding affinity between the two molecules considered (nM). The N indicates the reaction stoichiometry (N=1 for a 1:1 interaction). The values indicated in the table are the mean ± SEM of two independent experiments. (e) ITC experiments of HSL3 vs. CTNIP4 and CTNIP4C58S/C68S, in the absence and presence of the co-receptor BAK1. GFP, green fluorescent protein.
-
Figure 2—source data 1
HSL3-specific spectral counts.
- https://cdn.elifesciences.org/articles/74687/elife-74687-fig2-data1-v2.xlsx
-
Figure 2—source data 2
Westernblots showing affinity purification of BAK1 with HSL3-GFP.
- https://cdn.elifesciences.org/articles/74687/elife-74687-fig2-data2-v2.pdf
Figure 2—figure supplement 1
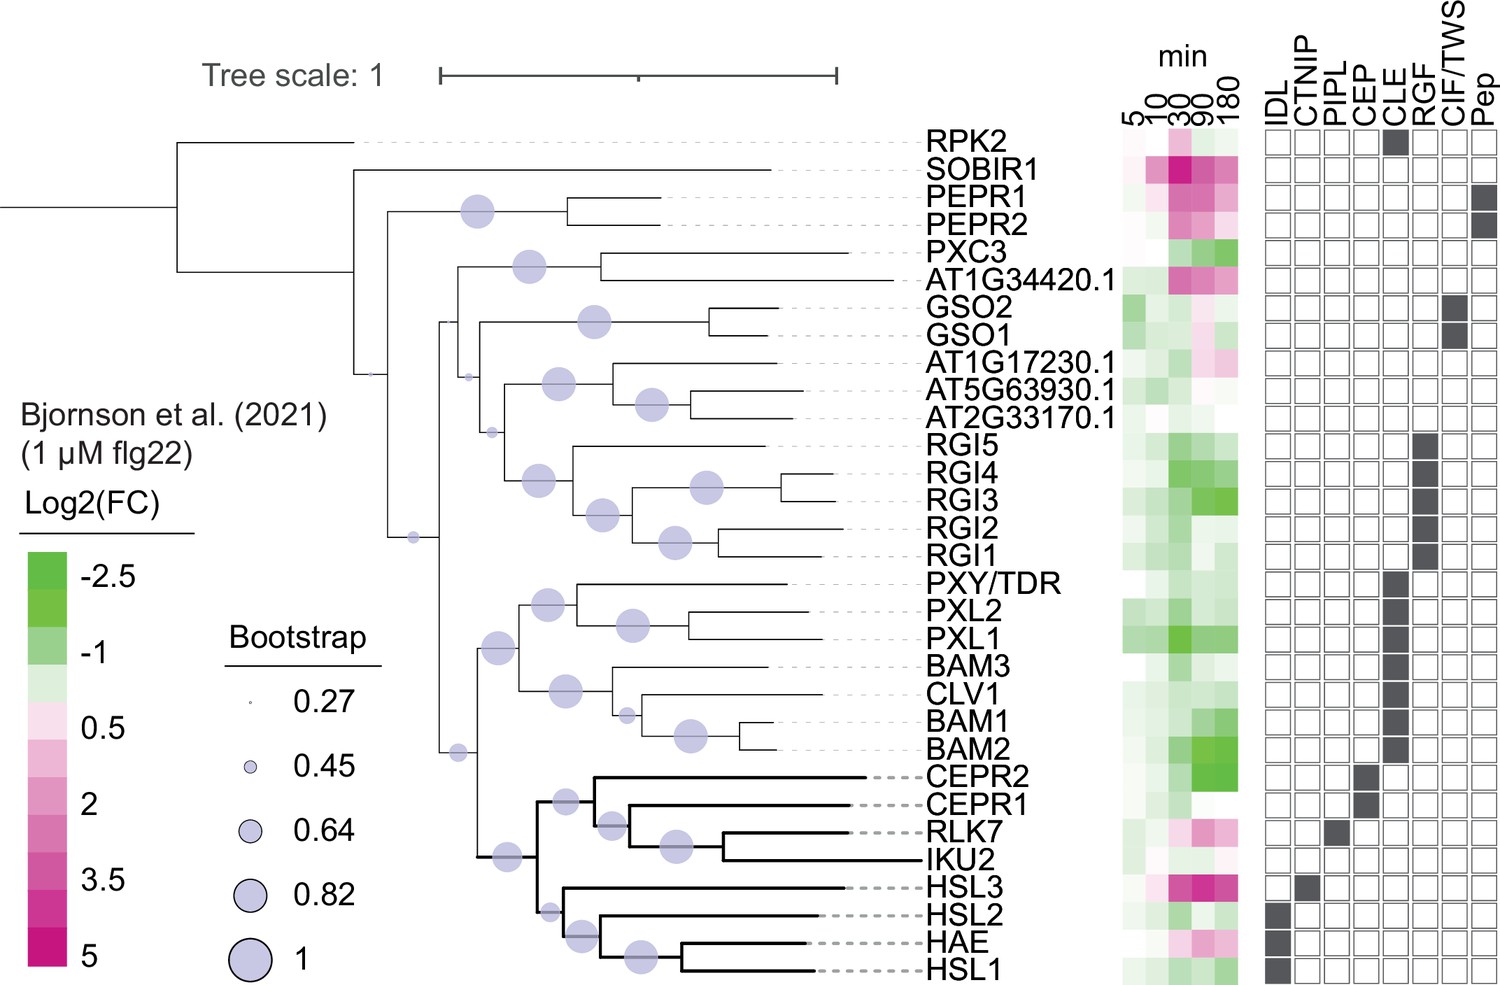
Phylogeny of Arabidopsis leucine-rich repeat receptor kinase (LRR-RK) subfamily XI.
Phylogeny of full-length protein sequences of the Arabidopsis LRR-RK subfamily XI. Sequences were aligned using MUSCLE and a phylogeny was inferred using the maximum-likelihood method and JTT matrix-based model conducted in MEGAX. 1000 bootstraps were performed and are indicated based on the size of the blue circles. Expression of these receptors in response to 1 μM flg22 treatment was extracted from Bjornson et al., 2021, and is represented in a heat map. Known ligands for LRR-RK subfamily XI are highlighted to the right (Butenko et al., 2003; Cho et al., 2008; Crook et al., 2020; Doblas et al., 2017; Doll et al., 2020; Hou et al., 2014; Krol et al., 2010; Morita et al., 2016; Mou et al., 2017; Nakayama et al., 2017; Ogawa et al., 2008; Okuda et al., 2020; Ou et al., 2016; Qian et al., 2018; Rojo et al., 2002; Roman et al., 2022; Santiago et al., 2016; Shinohara et al., 2016; Song et al., 2016; Tabata et al., 2014; Yamaguchi et al., 2010; Yamaguchi et al., 2006; Zhang et al., 2016).
-
Figure 2—figure supplement 1—source data 1
Flg22-induced expression data of LRR-RK subfamily XI.
- https://cdn.elifesciences.org/articles/74687/elife-74687-fig2-figsupp1-data1-v2.xlsx
Figure 2—figure supplement 2
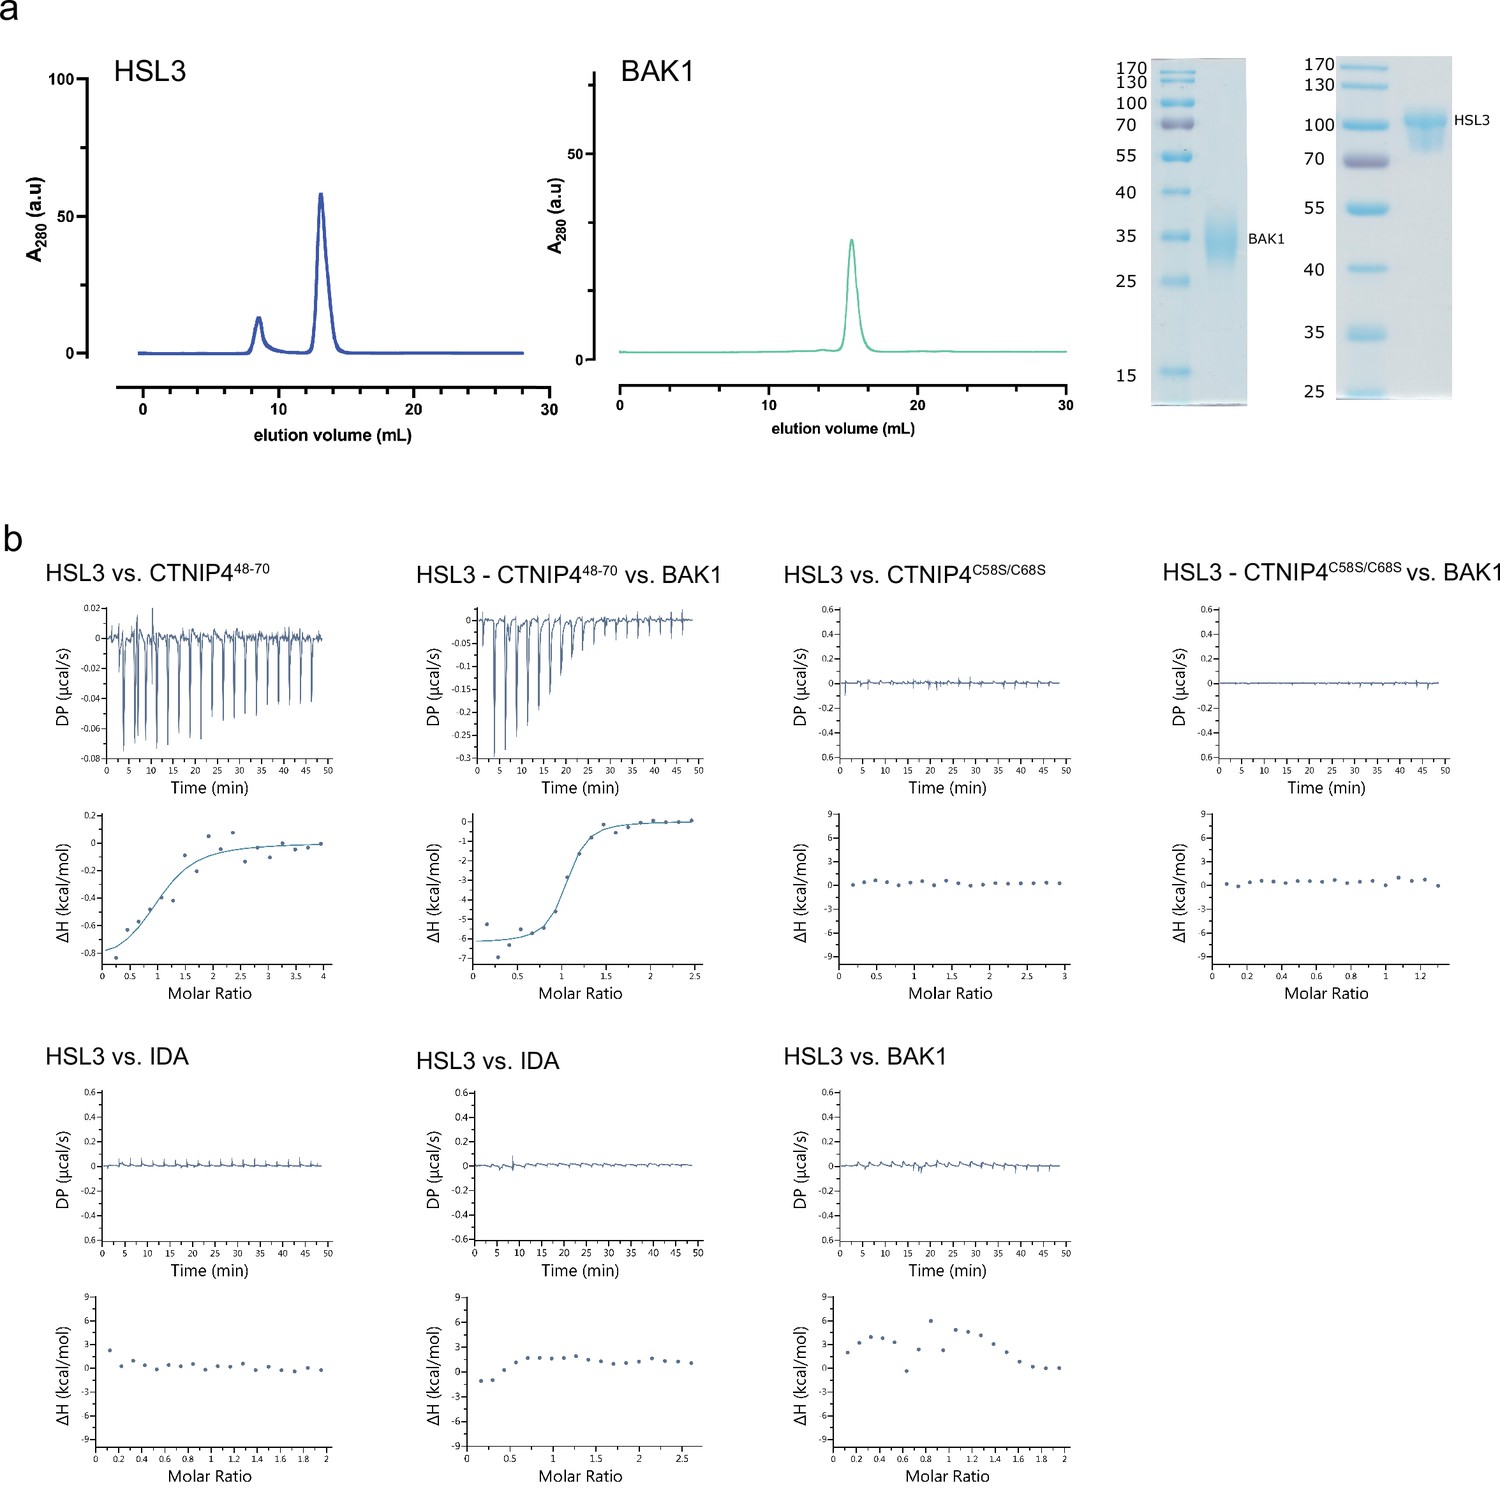
Isothermal titration calorimetry (ITC) independent experiments and purification of HAESA-LIKE 3 (HSL3) and BAK1 used in the binding experiments.
(a) Analytical size exclusion chromatography (SEC) of the ectodomains of HSL3 and BAK1. An SDS-PAGE of the two proteins is shown alongside. (b) ITC raw thermograms of experiments shown in the ITC table summary in Figure 2d.
Figure 2—figure supplement 3
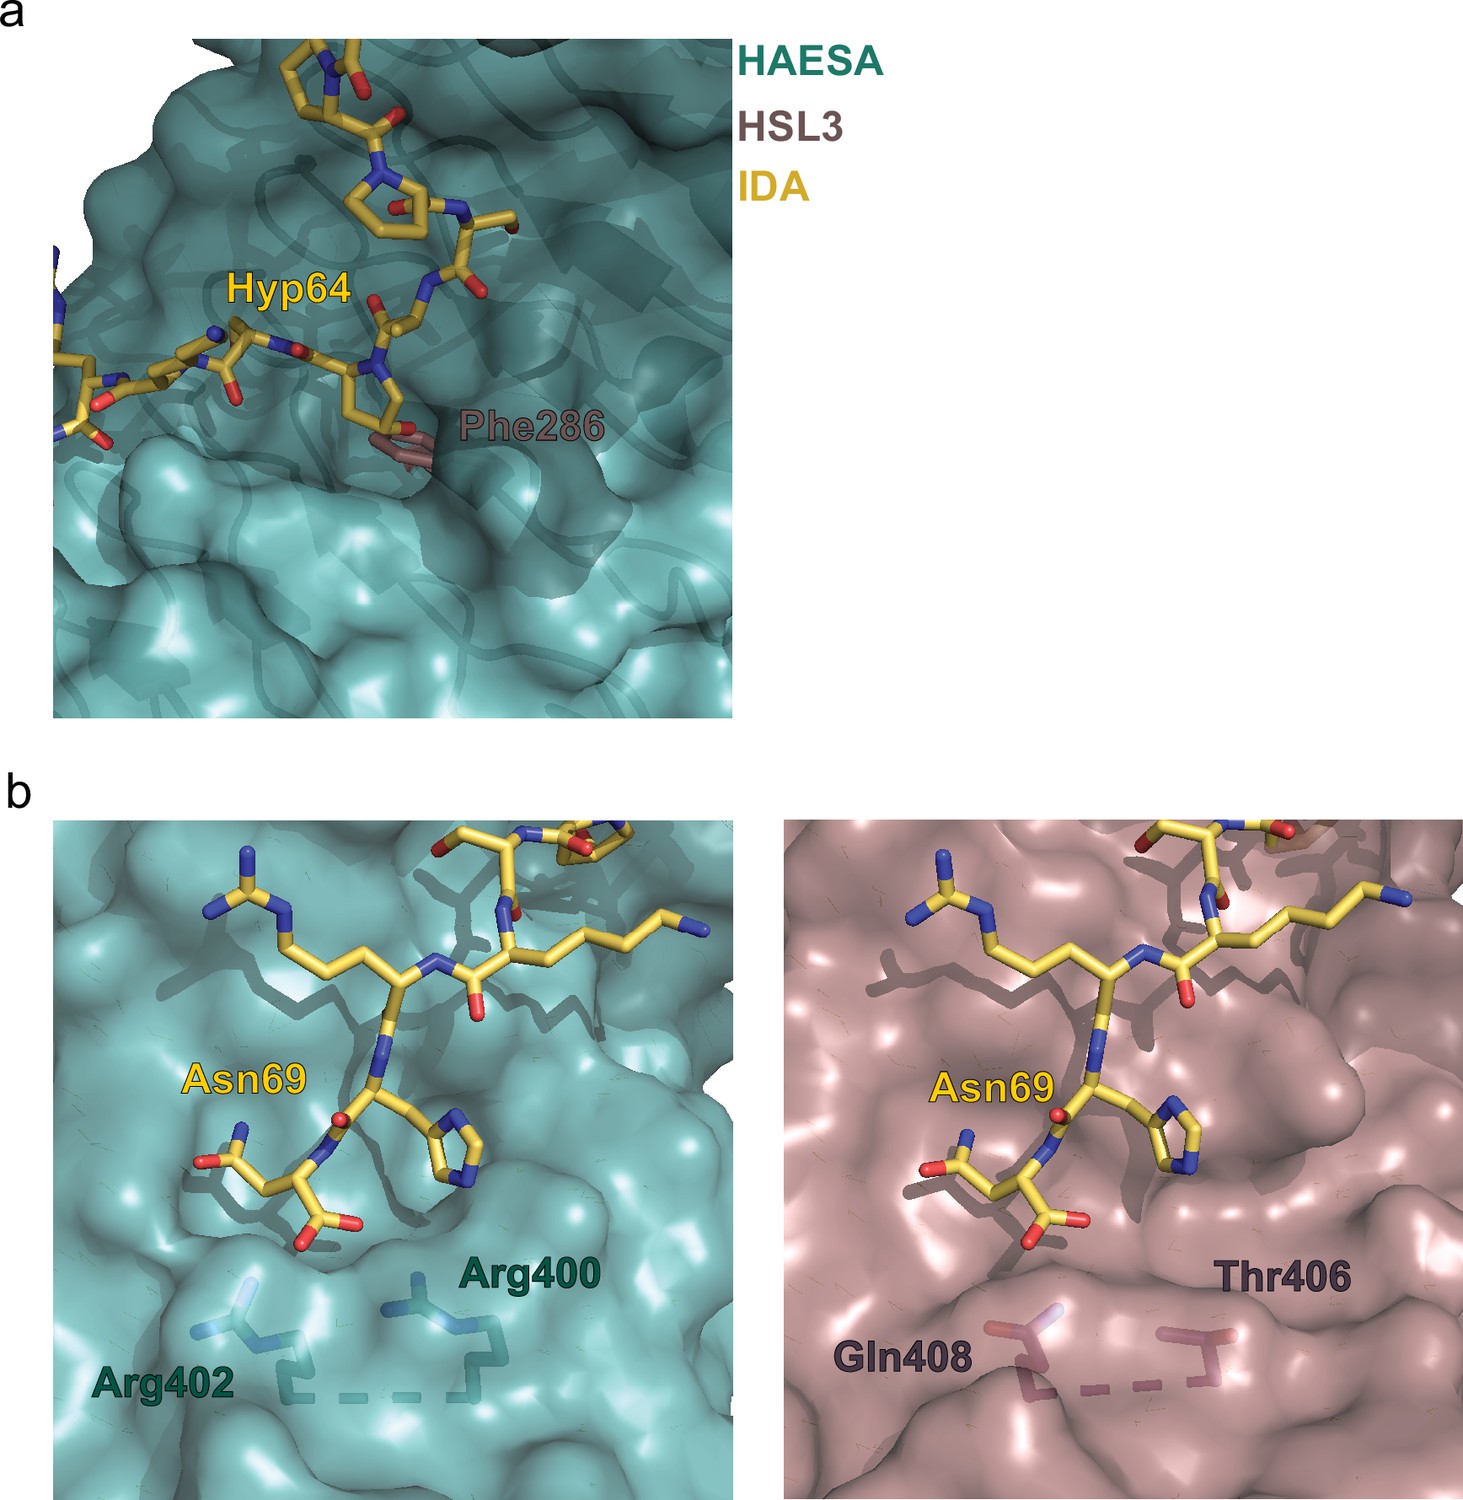
Structural comparison of the binding pockets between the receptors HAESA and HAESA-LIKE 3 (HSL3).
(a) The hydroxyproline pocket required for anchoring the INFLORESCENCE DEFICIENT IN ABSCISSION (IDA) peptide to the HAESA receptor is missing in HSL3. Close view of the binding pocket of the structural superimposition of the HAESA-IDA complex (PDB:5IXQ) and a homology model of HSL3 (AlphaFold: https://alphafold.ebi.ac.uk/). The HAESA receptor is depicted in surface representation in teal blue, IDA in yellow sticks, and HSL3 in magenta cartoon. In HSL3, the hydroxyproline pocket is replaced by the bulky residue Phe286, colliding with the potential anchoring of the IDA peptide to the receptor. (b) The conserved RxR motif necessary for the coordination of the COO- group the last Asn in IDA is not present in the HSL3 receptor. Zoom in of the C-terminal region of the peptide-binding surface of HAESA (teal blue) (left panel) and HSL3 (magenta) (right panel). In HAESA the motif RxR closes the binding pocket allowing for the coordination of the C-terminal of IDA. In HSL3 this structural motif is substituted by the residues Thr406 and Gln408, leaving the binding surface open to potentially accommodate a longer peptide ligand. Figures were done using the PyMOL Molecular Graphics System, Version 2.0 Schrödinger, LLC.
Figure 3 with 5 supplements
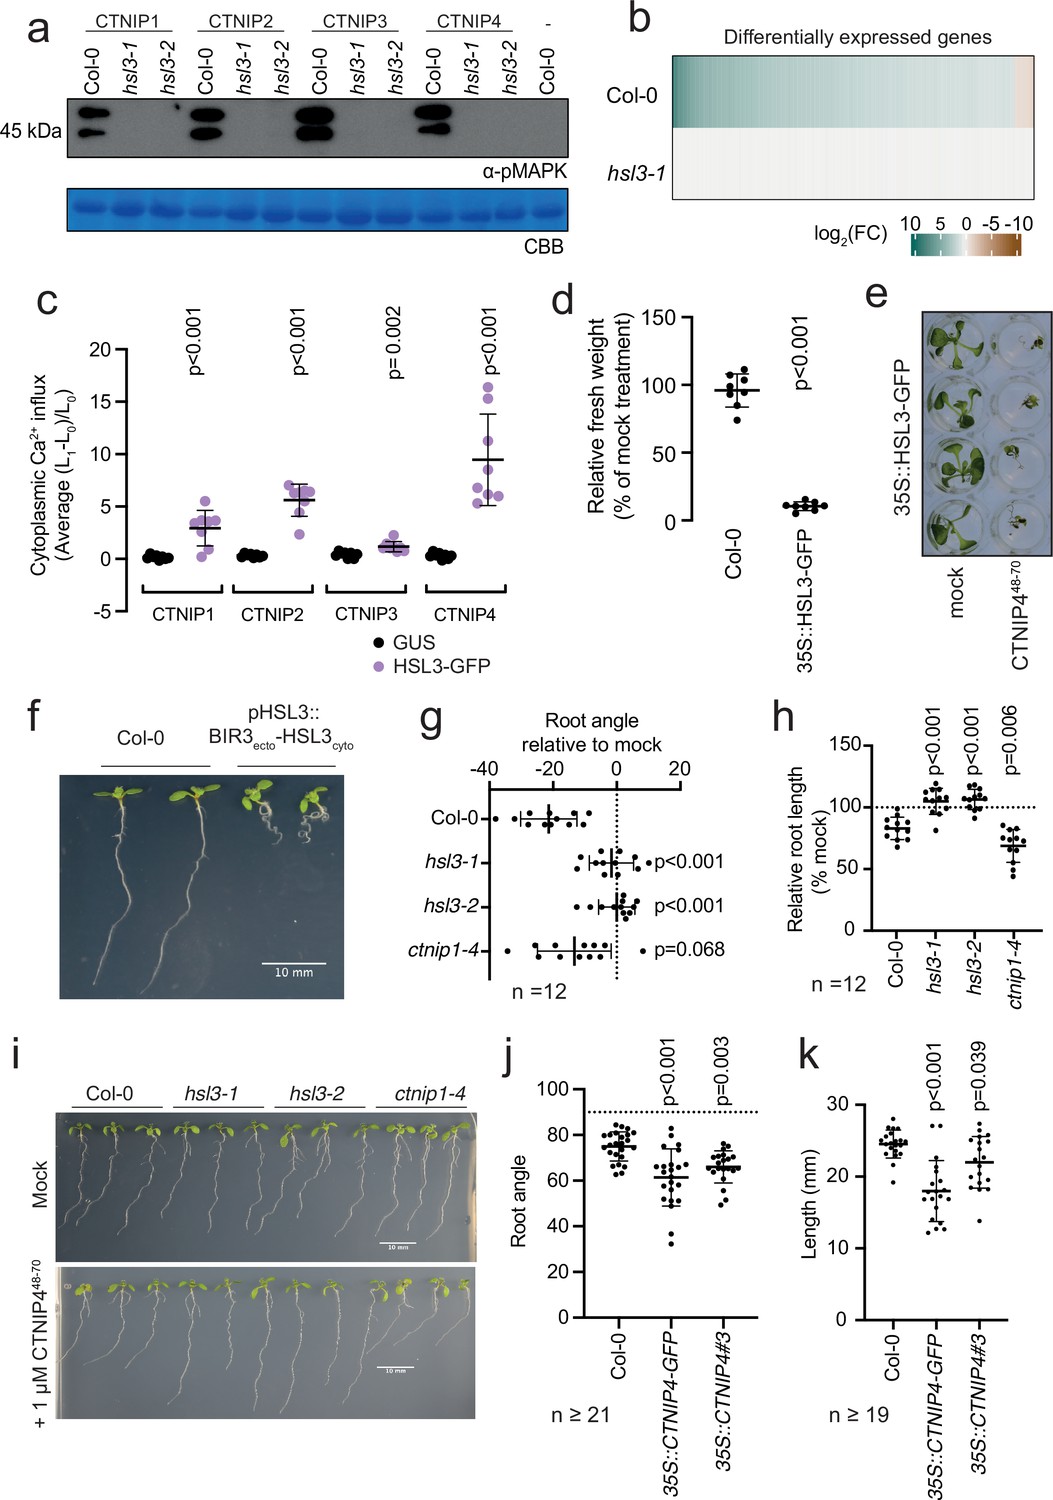
HAESA-LIKE 3 (HSL3) is strictly required for CTNIP perception and growth regulation.
(a) Western blot using α-p42/p44-ERK recognising phosphorylated MAP kinases in seedlings treated with 100 nM CTNIPs or mock for 15 min. The membrane was stained with Coomassie brilliant blue (CBB), as a loading control. (b) Heat map showing all significantly differentially expressed genes (p<0.05, |log2(FC)|>1) in Arabidopsis wild-type (WT) or hsl3-1 seedlings treated with or without 100 nM CTNIP448-70 for 30 min relative to a mock control. (c) Mean relative cytoplasmic Ca2+ influx in leaf disks of Nicotiana benthamiana transiently expressing the defined constructs induced by 1 μM CTNIP or mock application (n = 8 leaf disks). A line represents mean; error bars represent SD. p-Values indicate significance relative to the GUS-transformed control in a Dunnett’s multiple comparison test following one-way ANOVA. (d) Fresh weight of 14-day-old seedlings grown in the presence of 500 nM CTNIP448-70 for 10 days relative to mock (n = 8 seedlings). A line represents mean; error bars represent SD. p-Values indicate significance relative to the WT control in a two-tailed t-test. (e) Representative images of (d). (f,i) Nine-day-old vertically grown Arabidopsis seedlings on 1/2 Murashige and Skoog (MS) agar medium with 1% sucrose. Pictures were taken from the front of the plate. (g–h,j–k) Root parameters were quantified from the base of the hypocotyl to the root tip using ImageJ. (g) Root angle is shown relative to mock. Negative values indicate leftward root skewing. (j) Absolute root angle with 90° representing the gravity vector. Angles < 90° represent skewing to the left. A line represents mean; error bars represent SD. p-Values indicate significance relative to the WT control in a Dunnett’s multiple comparison test following one-way ANOVA. All experiments were repeated and analysed three times with similar results.
-
Figure 3—source data 1
HSL3 is strictly required for CTNIP perception and growth regulation.
- https://cdn.elifesciences.org/articles/74687/elife-74687-fig3-data1-v2.xlsx
-
Figure 3—source data 2
HSL3-dependency of CTNIP-induced MAPK phosphorylation.
- https://cdn.elifesciences.org/articles/74687/elife-74687-fig3-data2-v2.pdf
Figure 3—figure supplement 1
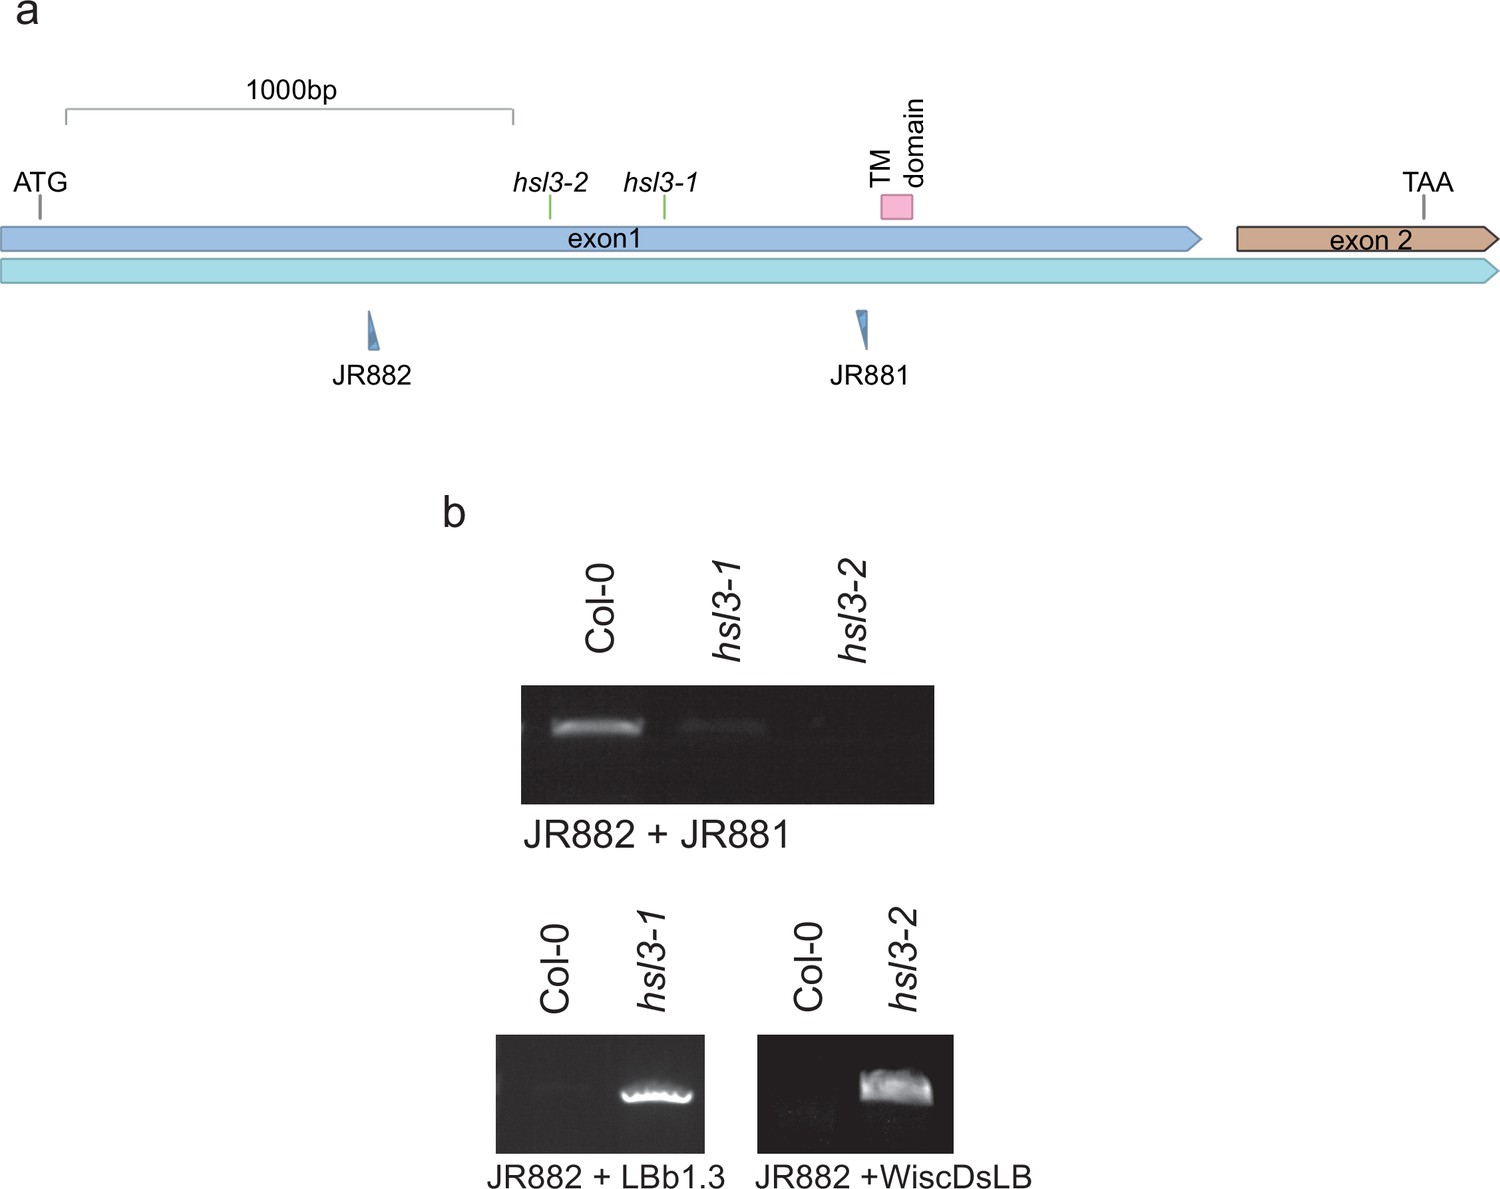
Genetic characterisation of hsl3 mutants.
(a) Gene model showing the location of T-DNA inserts. (b) PCR confirming T-DNA insertion and mutant homozygosity.
-
Figure 3—figure supplement 1—source data 1
Genetic characterisation of hsl3 mutants.
- https://cdn.elifesciences.org/articles/74687/elife-74687-fig3-figsupp1-data1-v2.pdf
Figure 3—figure supplement 2
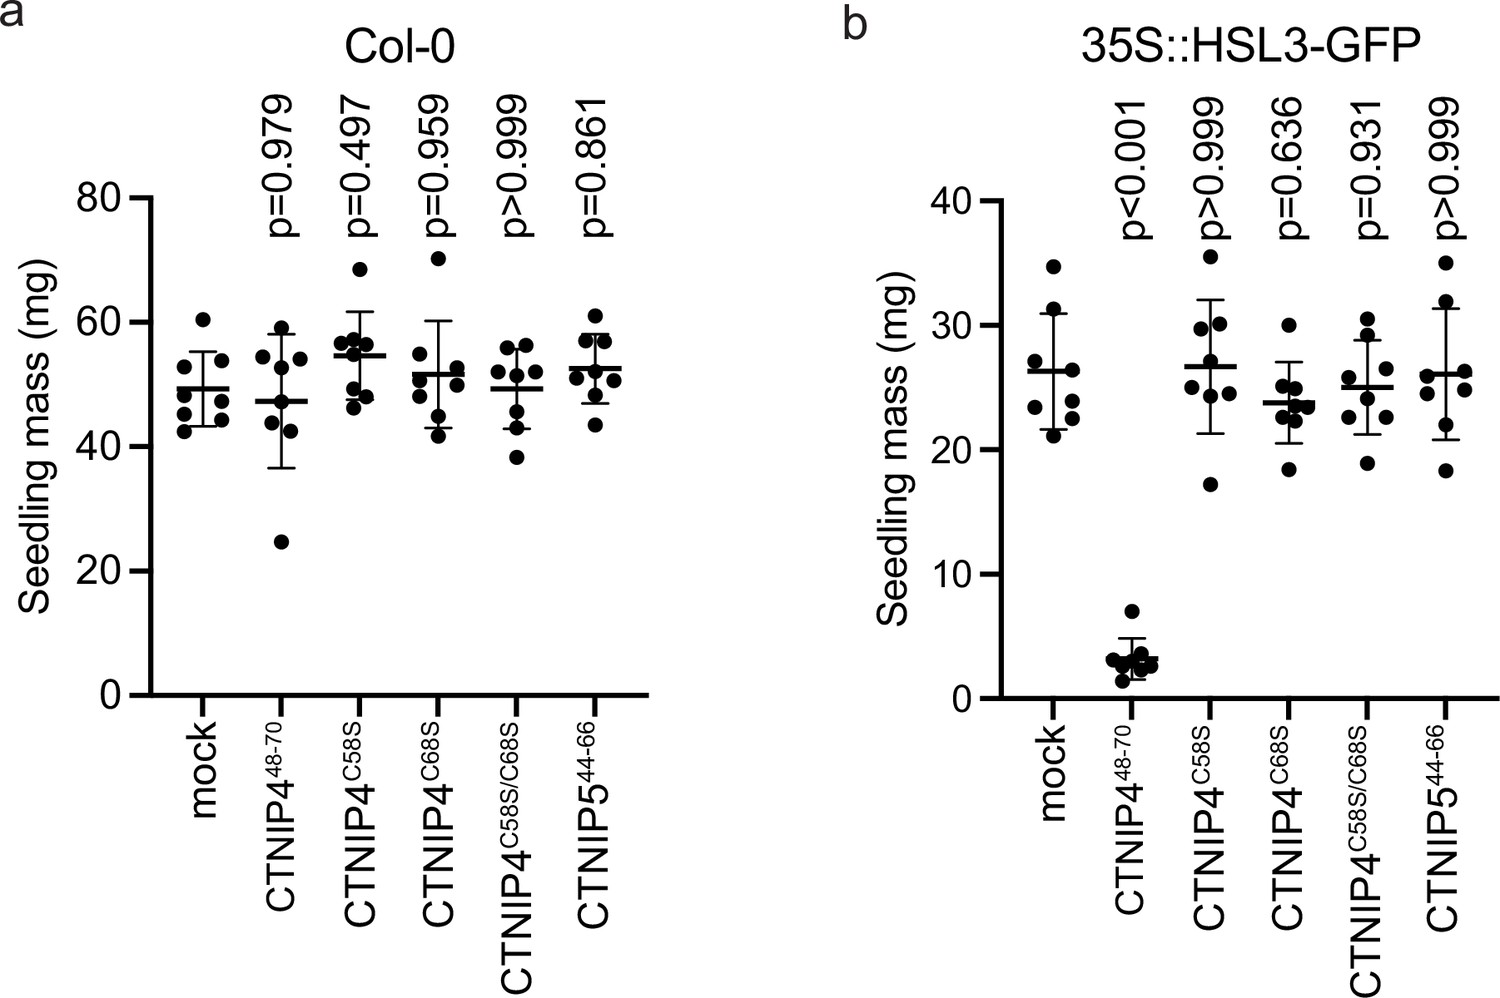
CTNIP-induced seedling growth inhibition.
(a–b) Fresh weight of 14-day-old seedlings grown in the presence of 500 nM CTNIPs for 10 days relative to mock (n = 8 seedlings). A line represents mean; error bars represent SD. p-Values indicate significance relative to the wild-type (WT) control in a Dunnett’s multiple comparison test following one-way ANOVA.
-
Figure 3—figure supplement 2—source data 1
CTNIP-induced seedling growth inhibition.
- https://cdn.elifesciences.org/articles/74687/elife-74687-fig3-figsupp2-data1-v2.xlsx
Figure 3—figure supplement 3
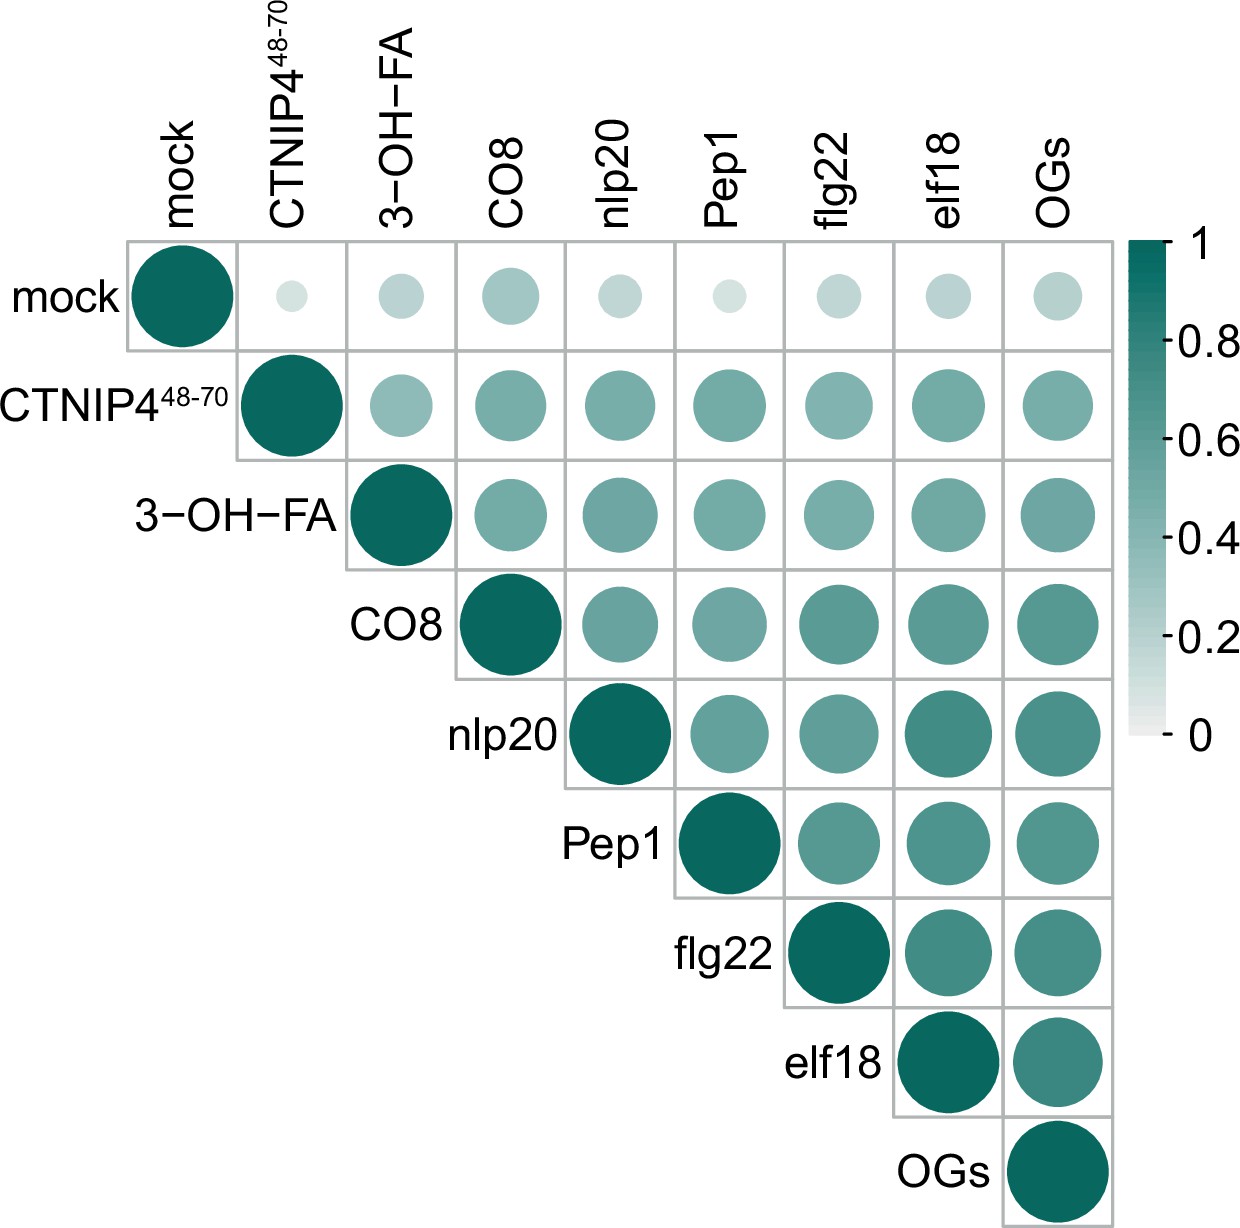
Correlation of CTNIP4-induced transcriptomic response with that of elicitors at 30min.
CTINP4-induced gene expression is well correlated with elicitor-induced gene expression from Bjornson et al., 2021. Circle colour and size are proportional to the Spearman correlation coefficient (R-squared value) of each pairwise comparison of log2(fold changes).
-
Figure 3—figure supplement 3—source data 1
Correlation of CTNIP4-induced transcriptomic response with that of elicitors at 30min.
- https://cdn.elifesciences.org/articles/74687/elife-74687-fig3-figsupp3-data1-v2.csv
Figure 3—figure supplement 4
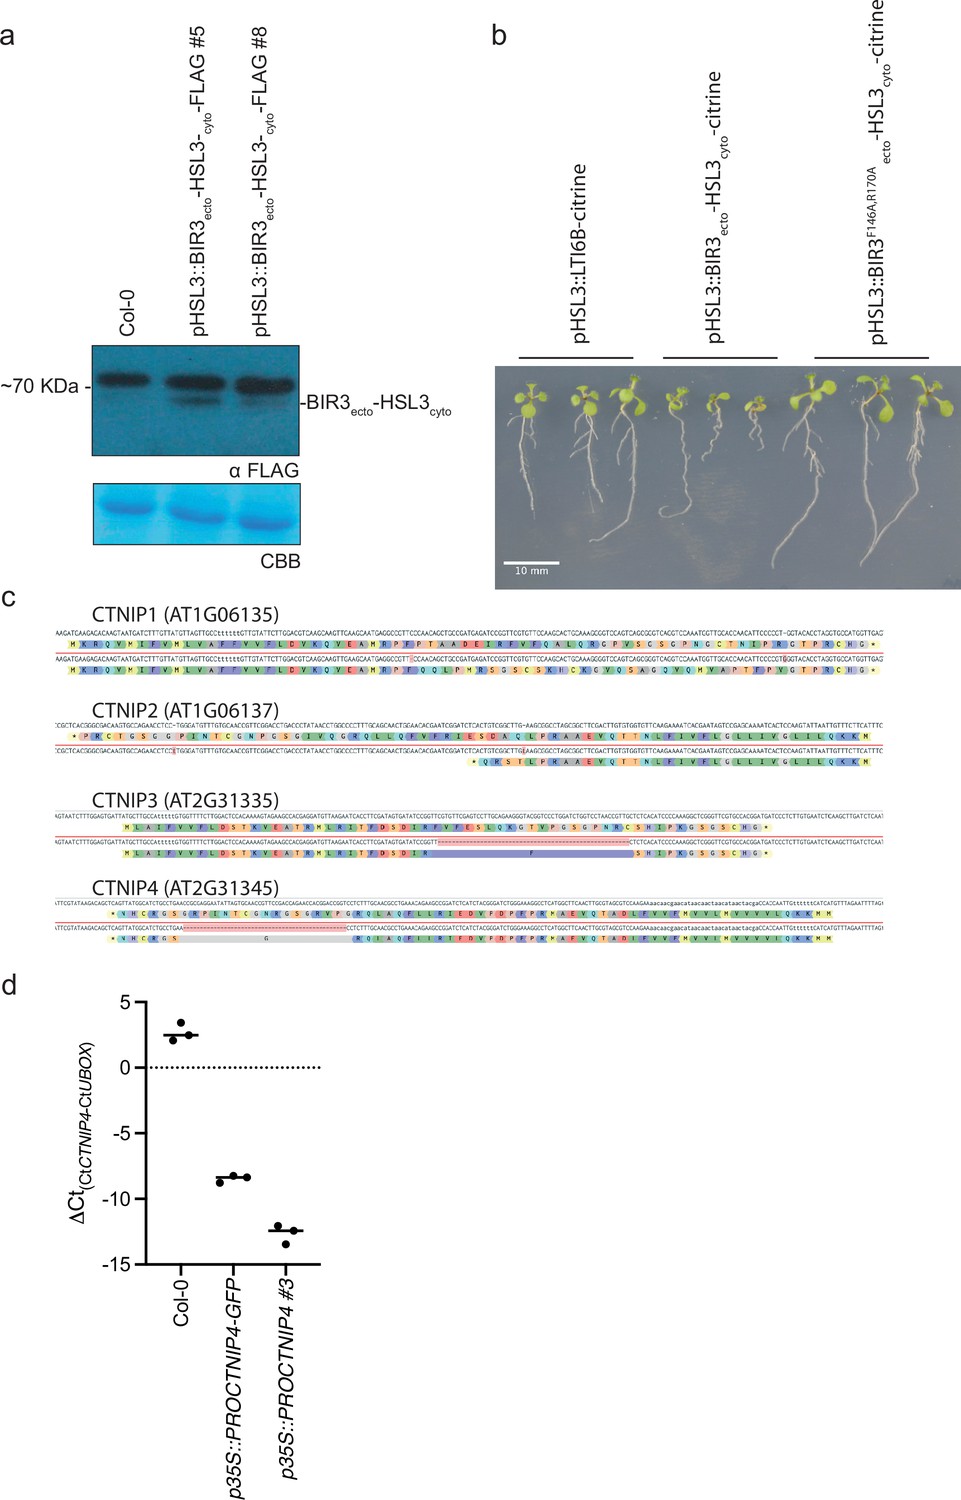
Characterisation of CTNIP and chimeric receptor lines.
(a) Western blot using α-FLAG recognising BIR3ecto-HSL3cyto-FLAG in seedlings to confirm expression. The membrane was stained with Coomassie brilliant blue (CBB), as a loading control. (b) Ten-day-old vertically grown Arabidopsis seedlings on 1/2 Murashige and Skoog (MS) agar medium with 1% sucrose. Pictures were taken from the front of the plate. All seedlings are T1 transgenics and were initially selected upon plates containing glufosinate-ammonium and carbenicillin plates for 5 days before being transferred to fresh plates and grown for a further 5 days. (c) Documentation of the Cas9-induced mutations observed within the ctnip1-4 polymutant and their predicted effects on protein products. (d) qRT-PCR documenting the overexpression of CTNIP lines. Expression of CTNIP4 is shown relative to U-Box (At5g15400). Points represent independent biological replicates each comprising two technical replicates. Lines represent the mean of biological replicates.
-
Figure 3—figure supplement 4—source data 1
Characterisation of CTNIP and chimeric receptor lines.
- https://cdn.elifesciences.org/articles/74687/elife-74687-fig3-figsupp4-data1-v2.pdf
Figure 3—figure supplement 5

HSL3-CTNIP mutants do not show altered resistance to Pseudomonas syringae pv tomato DC3000 ΔAvrPto/ΔAvrPtoB.
Four-week-old plants were spray inoculated with P. syringae pv tomato DC3000 ΔAvrPto/ΔAvrPtoB (OD600=0.2). Data points represent individual plants (n=8). Red bars represent medians. Dashed lines represent the Col-0 median (black) and 95% confidence intervals of the median (grey). p-Values indicate significance relative to the wild-type (WT) control in a Dunnett’s multiple comparison test following one-way ANOVA.
-
Figure 3—figure supplement 5—source data 1
HSL3-CTNIP mutants do not show altered resistance to Pseudomonas syringae pv tomato DC3000 ΔAvrPto/ΔAvrPtoB.
- https://cdn.elifesciences.org/articles/74687/elife-74687-fig3-figsupp5-data1-v2.xlsx
Figure 4 with 1 supplement

The HSL3-CTNIP signalling module predates extant angiosperms.
(a) Phylogeny of the full-length amino acid sequences of HAE/HSL/CEPR/RLK7/IKU2 clade of receptor kinases. Eudicot sequences are indicated in blue, monocot sequences in green, and Amborella sequences in red. Clades are named based upon the Arabidopsis genes. Alignment shown in Supplementary file 14. Further details of species, sequence identification, alignment, and phylogeny generation are described in the Materials and methods. (b) Species tree with number of CTNIP and HSL3 orthologs identified. Annotated CTNIPs are shown in grey whilst unannotated CTNIPs are shown in black. Sequences are shown in Supplementary files 10 and 16. (c) Phylogeny of the full-length amino acid sequences of CTNIPs. Eudicot sequences are indicated in blue, monocot sequences in green, and Amborella sequences in red. Sequences shown in Supplementary file 10. Further details of species, sequence identification, alignment, and phylogeny generation are described in the Materials and methods. (d) Sequence logo generated from CTNIP alignment from (c) using the R-package ggseqlogo. Amino acids are coloured based on their biochemical properties: red = acidic; blue = basic; black = hydrophobic; purple = neutral, and green = polar. (e) Cytoplasmic calcium influx measured after treatment with 1 μM CTNIP in p35S::AEQUORIN Nicotiana benthamiana leaf disks transiently expressing the defined construct, relative to pre-treatment (n = 8 leaf disks). Points represent mean; error bars represent SEM. Experiments were repeated and analysed three times with similar results. HSL3, HAESA-LIKE 3.
-
Figure 4—source data 1
The HSL3-CTNIP signalling module predates extant angiosperms.
- https://cdn.elifesciences.org/articles/74687/elife-74687-fig4-data1-v2.xlsx
Figure 4—figure supplement 1

HAE/HSL/CEPR/RLK7/IKU2 clade phylogenies.
Phylogenies of HAE/HSL/CEPR/RLK7/IKU2 clade LRR domains and kinase domains. Eudicot sequences are indicated in blue, monocot sequences in green, and Amborella sequences in red. Corresponding alignments and Newick files can be found in Supplementary file 16,Supplementary file 17, Supplementary file 18, Supplementary file 19, Supplementary file 20.
Tables
Key resources table
| Reagent type (species) or resource | Designation | Source or reference | Identifiers | Additional information |
|---|---|---|---|---|
| Gene (Arabidopsis thaliana) | HSL3 | ARAPORT11 | AT5G25930, Q9XGZ2_ARATH | |
| Gene (Arabidopsis thaliana) | CTNIP1 | ARAPORT11 | AT1G06135, Q8LCX3_ARATH | |
| Gene (Arabidopsis thaliana) | CTNIP2 | ARAPORT11 | AT1G06137, F4IBZ9_ARATH | |
| Gene (Arabidopsis thaliana) | CTNIP3 | ARAPORT11 | AT2G31335, Q1G3B9_ARATH | |
| Gene (Arabidopsis thaliana) | CTNIP4 | ARAPORT11 | AT2G31345, Q8L9Z1_ARATH | |
| Gene (Arabidopsis thaliana) | CTNIP5 | ARAPORT11 | AT2G23123, A0A1I9LM80_ARATH | |
| Gene (Medicago truncatula) | MtHSL3 | Mt4.0 | G7J3I8_MEDTR, MTR_3g110450, MtrunA17_Chr3g0140551 | |
| Gene (Medicago truncatula) | MtCTNIP | Mt4.0 | G7I613_MEDTR, MTR_1g044470, MtrunA17_Chr1g0168241 | |
| Genetic reagent (Arabidopsis thaliana) | hsl3-1 | euNASC | salk_207895 | |
| Genetic reagent (Arabidopsis thaliana) | hsl3-2 | euNASC | wiscdslox450b04 | |
| Genetic reagent (Arabidopsis thaliana) | bak1-4/pBAK1::BAK1-GFP | https://doi.org/10.1105/tpc.111.090779 | bak1-4/pBAK1::BAK1-GFP | |
| Genetic reagent (Arabidopsis thaliana) | bak1-5 | https://doi.org/10.1371/journal.pgen.1002046 | bak1-5 | |
| Genetic reagent (Arabidopsis thaliana) | p35S::AEQUORIN | https://doi.org/10.1038/352524a0 | ||
| Genetic reagent (Nicotiana benthamiana) | p35S::AEQUORIN | https://doi.org/10.1104/pp.110.171249 | ||
| Genetic reagent (Arabidopsis thaliana) | 35S::HSL3-GFP | This paper | Figure 3 and Materials and methods | |
| Genetic reagent (Arabidopsis thaliana) | pHSL3::BIR3-HSL3-FLAG | This paper | Chimera created using the method from https://doi.org/10.1105/tpc.20.00138 | |
| Cell line (Trichoplusia ni) | Tnao38 | https://doi.org/10.1186/1472-6750-12-12 | Cell line maintained in J Santiago lab | |
| Antibody | Anti-BAK1 (rabbit polyclonal) | https://doi.org/10.1105/tpc.111.084301 | WB (1:2000) | |
| Antibody | Anti-GFP (HRP-conjugated mouse monoclonal) | Santa Cruz | sc-9996 | WB (1:5000) |
| Antibody | Anti-pMAPK (rabbit polyclonal) | Cell Signaling | p44/42 MAPK (Erk1/2) antibody #9,102 | WB (1:4000) |
| Recombinant DNA reagent | 35S::HSL3-GFP (plasmid) | This paper | Figure 3 | |
| Recombinant DNA reagent | pHSL3::BIR3-HSL3-FLAG (plasmid) | This paper | Used to generate transgenic plants in Figure 3 | |
| Recombinant DNA reagent | pHSL3::LTI6B-Citrine (plasmid) | This paper | Used to generate transgenic plants in Figure 3—figure supplement 4 | |
| Recombinant DNA reagent | pHSL3::BIR3F146A,R170A -HSL3-Citrine (plasmid) | This paper | Used to generate transgenic plants in Figure 3—figure supplement 4 | |
| Recombinant DNA reagent | pHSL3::BIR3-HSL3-CITRINE (plasmid) | This paper | Used to generate transgenic plants in Figure 3—figure supplement 4 | |
| Commercial assay or kit | GFP-Trap | Chromotek | Cat. #: gta-20 | |
| Software, algorithm | GraphPad | GraphPad software |
Additional files
-
Supplementary file 1
Transcripts predicted to encode proteins <150 amino acids up-regulated following 1 μM flg22 treatment for 90 min (Bjornson et al., 2021).
- https://cdn.elifesciences.org/articles/74687/elife-74687-supp1-v2.xlsx
-
Supplementary file 2
Spectral counts of peptides identified through affinity purification of the BAK1 complex.
- https://cdn.elifesciences.org/articles/74687/elife-74687-supp2-v2.xlsx
-
Supplementary file 3
Differential gene expression induced by 30 min CTNIP448-70 treatment.
- https://cdn.elifesciences.org/articles/74687/elife-74687-supp3-v2.csv
-
Supplementary file 4
Gene ontology enrichment following 30 min CTNIP448-70 treatment.
- https://cdn.elifesciences.org/articles/74687/elife-74687-supp4-v2.csv
-
Supplementary file 5
Primers used in this study.
- https://cdn.elifesciences.org/articles/74687/elife-74687-supp5-v2.xlsx
-
Supplementary file 6
Synthetic peptides used in this study.
- https://cdn.elifesciences.org/articles/74687/elife-74687-supp6-v2.docx
-
Supplementary file 7
Species included in CTNIP and RK search.
- https://cdn.elifesciences.org/articles/74687/elife-74687-supp7-v2.zip
-
Supplementary file 8
Initial CTNIP candidates used for the search.
- https://cdn.elifesciences.org/articles/74687/elife-74687-supp8-v2.fasta
-
Supplementary file 9
Identified CTNIPs relaxed.
- https://cdn.elifesciences.org/articles/74687/elife-74687-supp9-v2.zip
-
Supplementary file 10
Identified CTNIPs confident.
- https://cdn.elifesciences.org/articles/74687/elife-74687-supp10-v2.zip
-
Supplementary file 11
Initial RK candidates used for the search.
- https://cdn.elifesciences.org/articles/74687/elife-74687-supp11-v2.fasta
-
Supplementary file 12
Alignment of RKs identified.
- https://cdn.elifesciences.org/articles/74687/elife-74687-supp12-v2.zip
-
Supplementary file 13
Receptor phylogeny.
- https://cdn.elifesciences.org/articles/74687/elife-74687-supp13-v2.zip
-
Supplementary file 14
Full-length alignment of HAE/HSL/CEPR/RLK7/IKU2 clade.
- https://cdn.elifesciences.org/articles/74687/elife-74687-supp14-v2.zip
-
Supplementary file 15
Full-length HAE/HSL/CEPR/RLK7/IKU2 clade phylogeny.
- https://cdn.elifesciences.org/articles/74687/elife-74687-supp15-v2.zip
-
Supplementary file 16
Leucine-rich repeat (LRR) domain alignment of HAE/HSL/CEPR/RLK7/IKU2 clade.
- https://cdn.elifesciences.org/articles/74687/elife-74687-supp16-v2.zip
-
Supplementary file 17
Leucine-rich repeat (LRR) domain HAE/HSL/CEPR/RLK7/IKU2 clade phylogeny.
- https://cdn.elifesciences.org/articles/74687/elife-74687-supp17-v2.zip
-
Supplementary file 18
Kinase domain alignment of HAE/HSL/CEPR/RLK7/IKU2 clade.
- https://cdn.elifesciences.org/articles/74687/elife-74687-supp18-v2.zip
-
Supplementary file 19
Kinase domain HAE/HSL/CEPR/RLK7/IKU2 clade phylogeny.
- https://cdn.elifesciences.org/articles/74687/elife-74687-supp19-v2.zip
-
Supplementary file 20
Full-length HAESA-LIKE 3 (HSL3) alignment.
- https://cdn.elifesciences.org/articles/74687/elife-74687-supp20-v2.zip
-
Transparent reporting form
- https://cdn.elifesciences.org/articles/74687/elife-74687-transrepform1-v2.docx
Download links
A two-part list of links to download the article, or parts of the article, in various formats.
Downloads (link to download the article as PDF)
Open citations (links to open the citations from this article in various online reference manager services)
Cite this article (links to download the citations from this article in formats compatible with various reference manager tools)
Perception of a conserved family of plant signalling peptides by the receptor kinase HSL3
eLife 11:e74687.
https://doi.org/10.7554/eLife.74687


