Coil-to-α-helix transition at the Nup358-BicD2 interface activates BicD2 for dynein recruitment
- Department of Biological Sciences, Department of Chemistry and Chemical Biology, Center for Biotechnology and Interdisciplinary Studies, Rensselaer Polytechnic Institute, United States
- Department of Chemistry, Binghamton University, United States
- Department of Molecular Physiology and Biophysics, Larner College of Medicine, University of Vermont, United States
- Laboratory of Cell Biology, The Rockefeller University, United States
Figures
Figure 1 with 1 supplement
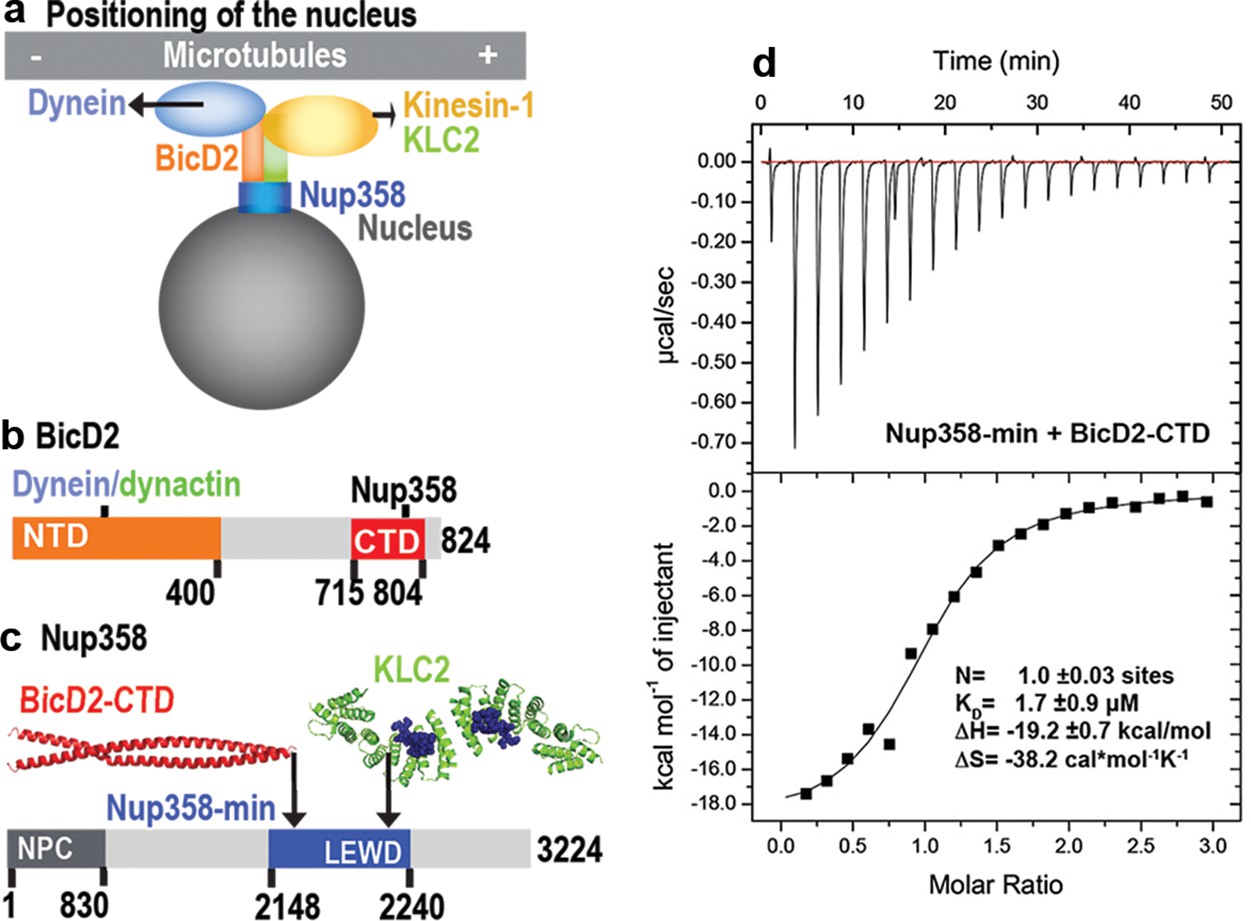
A minimal Nup358 domain interacts with BicD2 with micromolar affinity.
(a) Nup358 interacts with both BicD2/dynein/dynactin and kinesin-1 (via kinesin-1 light chain 2, KLC2) to mediate bidirectional nuclear positioning in G2 phase of the cell cycle (Splinter et al., 2010; Cai et al., 2001; Cui et al., 2019). This pathway is essential for a fundamental process in brain development that is required for radial glial progenitor cells to differentiate to the majority of neurons and glia cells of the neocortex (Hu et al., 2013). (b, c) Schematic representation of the expression constructs BicD2-CTD (b, red) and Nup358-min (c, blue), in the context of the full-length proteins (gray). (c) KLC2 is recruited to Nup358-min via a W-acidic motif with the sequence LEWD (Cui et al., 2019). The X-ray structures of the TPR domain of the KLC2 (green, referred to as KLC2 hereafter), fused to a LEWD motif (purple) (Pernigo et al., 2013), and the X-ray structure of the BicD2-CTD (red) (Noell et al., 2019) are shown in cartoon representation in (c). The α-helical N-terminal domain of Nup358 (dark gray) promotes anchorage to the nuclear pore complex (NPC). (d) A representative isothermal titration calorimetry (ITC) thermogram of Nup358-min and BicD2-CTD is shown, from which the affinity (dissociation constant KD) was determined to be 1.7 ± 0.9 μM. N: number of sites; ∆S: the change in entropy; ∆H: the change in enthalpy. The experiment was repeated three times. The error of KD was calculated as the standard deviation from three experiments. In Figure 1—figure supplement 1, the affinity of Nup358-min-GST (i.e., with the GST-tag intact) and BicD2-CTD was determined by ITC to be 1.6 ± 1.0 μM. See also Figure 1—source data 1–4.
-
Figure 1—source data 1
ITC thermogram of BicD2-CTD and Nup358-min.
- https://cdn.elifesciences.org/articles/74714/elife-74714-fig1-data1-v3.zip
-
Figure 1—source data 2
ITC thermogram of BicD2-CTD and Nup358-min-GST (i.e., with the GST-tag intact).
- https://cdn.elifesciences.org/articles/74714/elife-74714-fig1-data2-v3.zip
-
Figure 1—source data 3
ITC thermogram of Nup358-min into buffer.
- https://cdn.elifesciences.org/articles/74714/elife-74714-fig1-data3-v3.zip
-
Figure 1—source data 4
ITC thermogram of Nup358-min-GST into buffer.
- https://cdn.elifesciences.org/articles/74714/elife-74714-fig1-data4-v3.zip
Figure 1—figure supplement 1
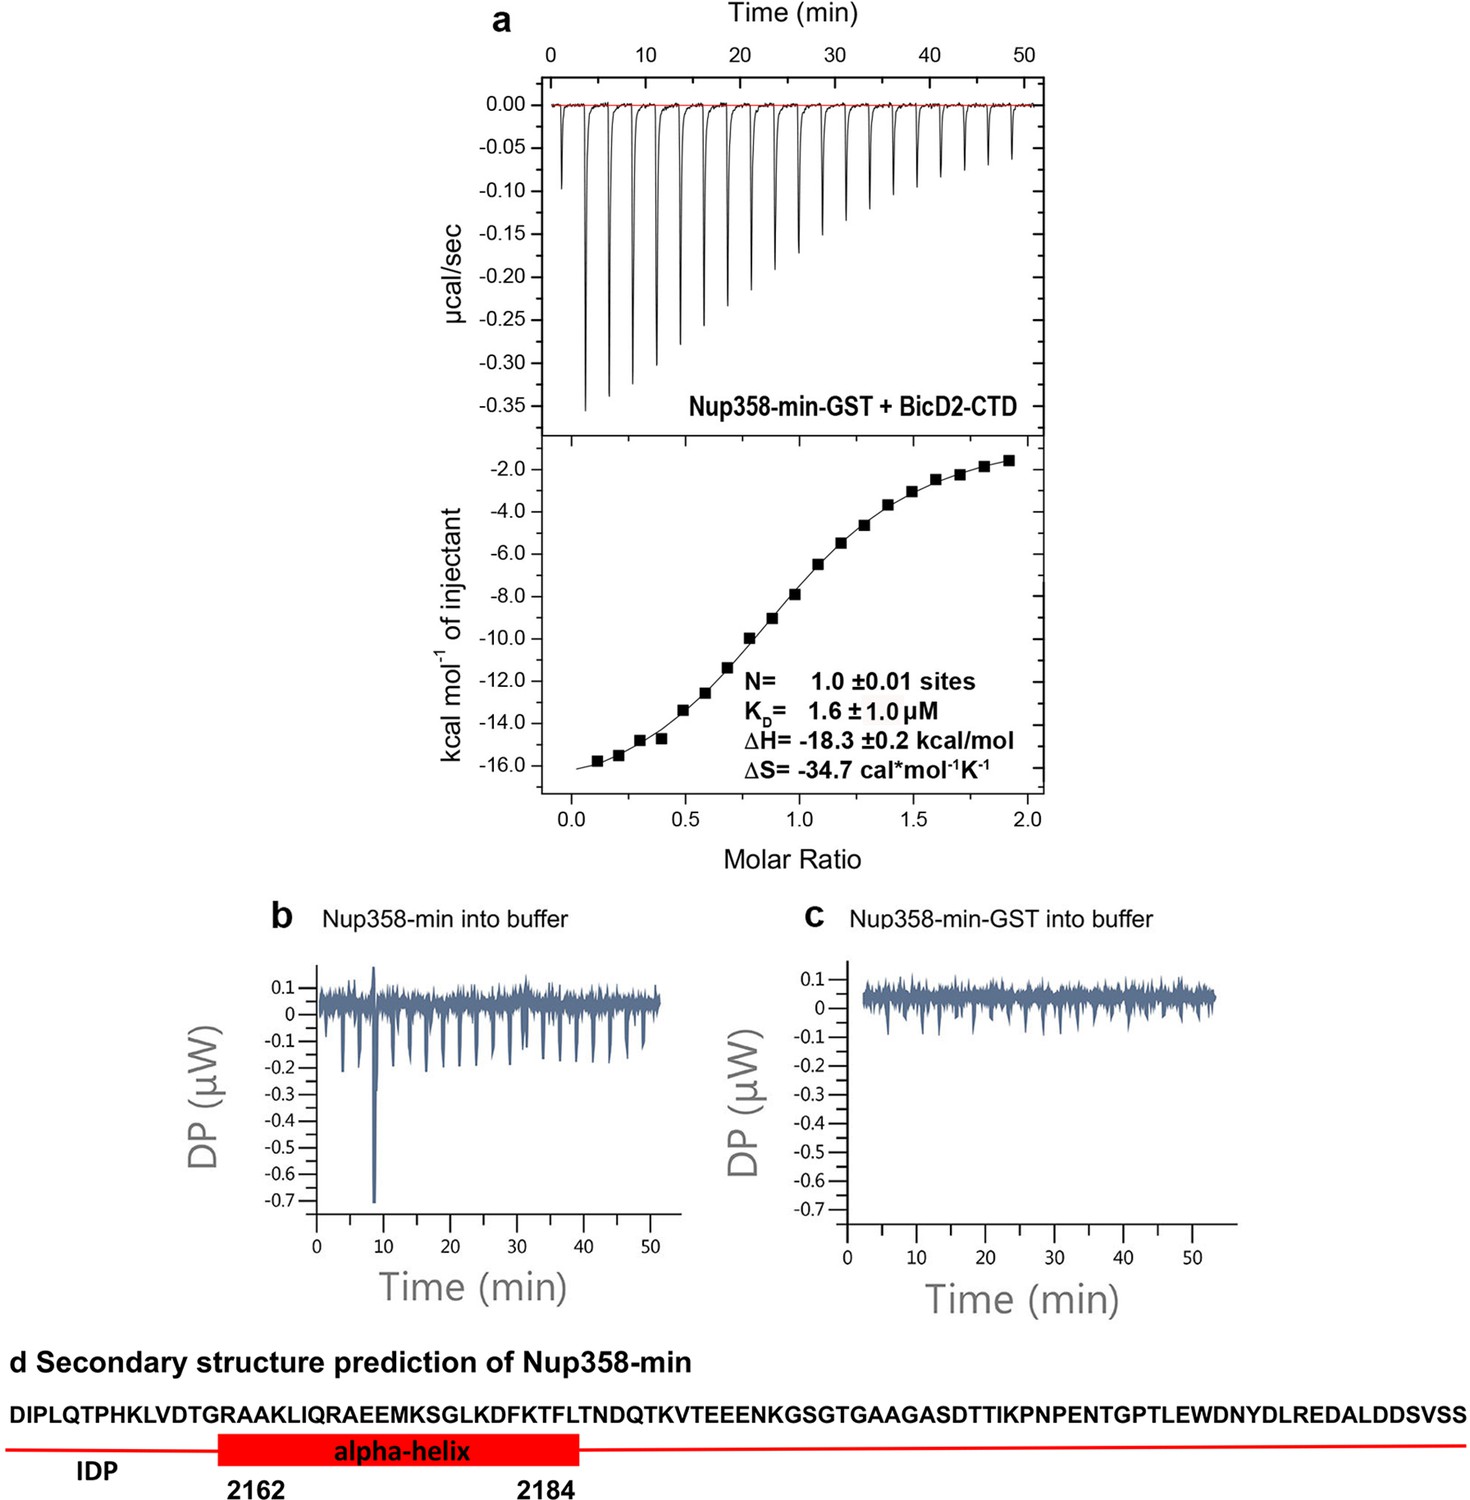
The GST-fusion has a neglible effect on the interaction between BicD2-CTD and Nup358-min.
(a) The isothermal titration calorimetry (ITC) thermogram of BicD2-CTD with Nup358-min-GST (i.e., with the GST-tag intact) is shown, from which the affinity was determined to be 1.6 ± 1.0 μM, demonstrating that the GST fusion has a negligible effect on binding. (b) The control ITC thermogram for Figure 1 of Nup358-min (syringe) into the buffer (cell) is shown. Since the titration resulted in a flat line, thermodynamic parameters were not determined. Note that a brief spike is caused by an air bubble. (c) The control ITC thermogram of Nup358-min-GST (syringe) into buffer (cell) is shown. Since the titration resulted in a flat line, thermodynamic parameters were not determined. (d) Secondary structure prediction of Nup358-min created with the PredictProtein Server (Bernhofer et al., 2021; Yachdav et al., 2014). However, this prediction is not accurate for apo Nup358-min as shown by subsequent chemical shift analysis. IDP: intrinsically ordered protein domain.
Figure 2 with 16 supplements
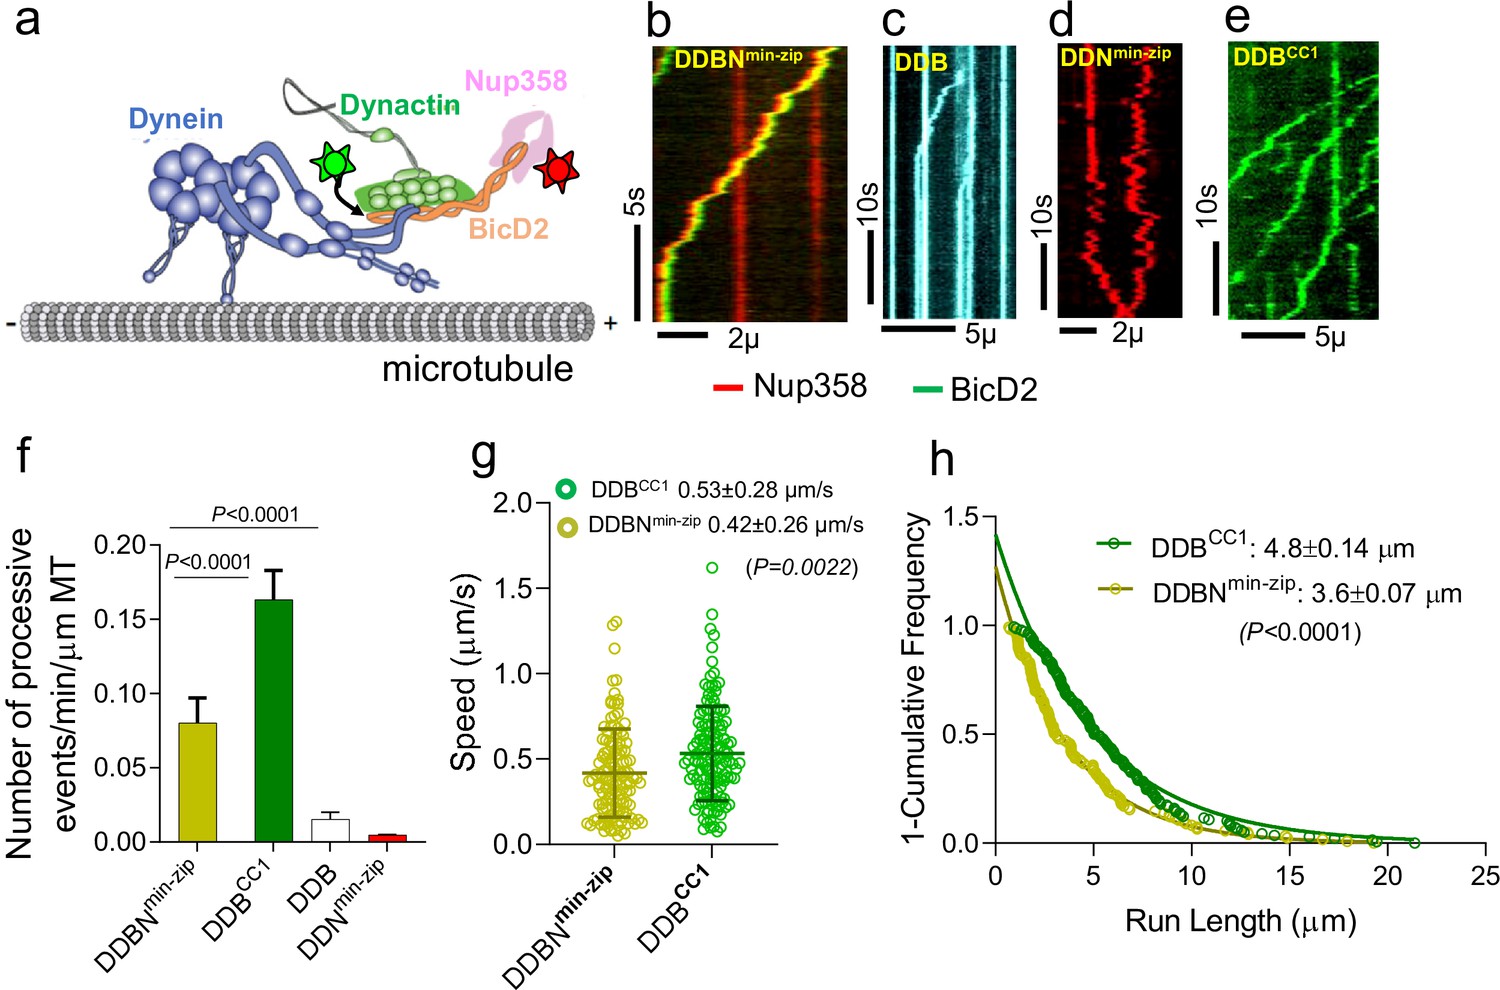
Nup358min-zip is capable of forming a dynein-dynactin-BicD2-Nup358min-zip complex (DDBNmin-zip) that is activated for processive motility.
(a) Schematic of a DDBNmin-zip complex bound to a microtubule. BicD2 and Nup358 are shown labeled with two different color quantum dots (Qdot; stars). (b) Representative kymograph of the DDBNmin-zip complex moving processively on microtubules. Nup358min-zip was labeled with a 655 nm Qdot and BicD2 with a 525 nm Qdot. (c) Dynein-dynactin-BicD2 (DDB) complexes bind to microtubules but show very little processive motion. (d) Dynein-dynactin-Nup358min-zip complexes (DDNmin-zip) showed diffusive movement on microtubules. Nup358min-zip was labeled with a 655 nm Qdot. (e) As a control, processive motion of dynein-dynactin in the presence of the N-terminal domain of BicD2 (DDBCC1), with BicD2CC1 labeled with a 525 nm Qdot. (f) Bar graph showing the number of processive events of DDBNmin-zip per min per micrometer microtubule (MT) length. As controls, number of processive events are shown for active DDBCC1, DDB, and DDNmin-zip (g, h) Speed and run length of DDBNmin-zip (yellow) were compared with the constitutively active complex DDBCC1 (green). Speeds for the two complexes are significantly different (p<0.0022, unpaired t-test with Kolmogorov–Smirnov test), as are the run lengths (p<0.0001, Kolmogorov–Smirnov test). See also Figure 2—figure supplement 1. For each panel, data were obtained from three independent experiments and two protein preparations.
-
Figure 2—source data 1
The number of processive events of DDBNmin-zip compared with DDBCC1, DDB, and DDNmin-zip.
- https://cdn.elifesciences.org/articles/74714/elife-74714-fig2-data1-v3.xlsx
-
Figure 2—source data 2
Speed of DDBNmin-zip compared with the constitutively active complex DDBCC1.
- https://cdn.elifesciences.org/articles/74714/elife-74714-fig2-data2-v3.xlsx
-
Figure 2—source data 3
Run length of DDBNmin-zip compared with the constitutively active complex DDBCC1.
- https://cdn.elifesciences.org/articles/74714/elife-74714-fig2-data3-v3.xlsx
Figure 2—figure supplement 1
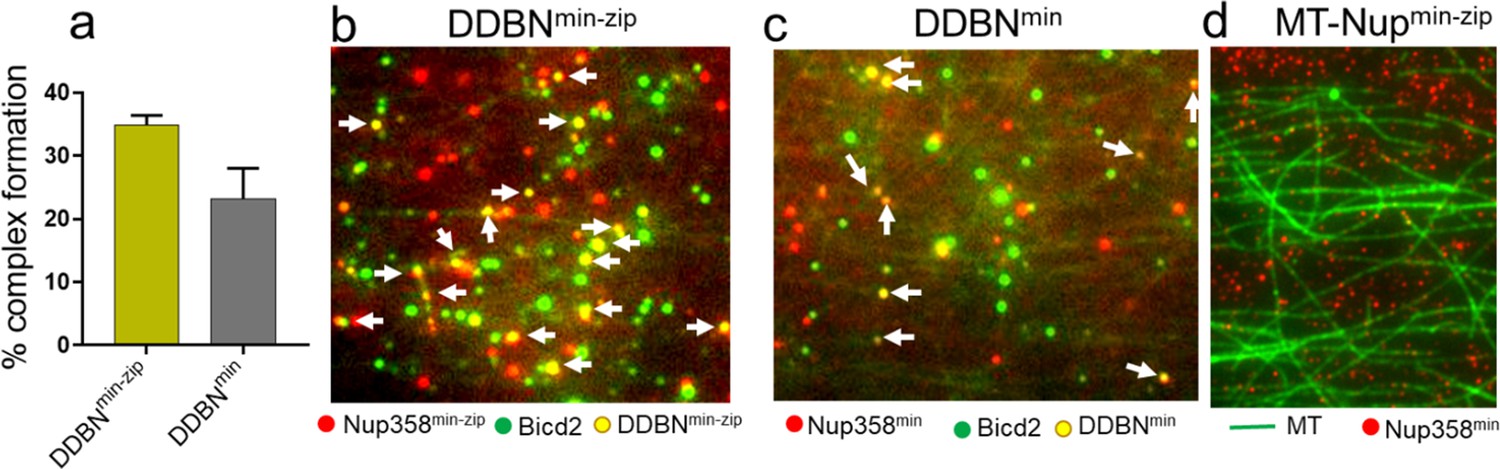
Dimerization of Nup358min increases the formation of DDBNmin-zip complexes.
(a) A leucine-zippered Nup358 (Nup358min-zip) forms DDBN complex (yellow) at a higher frequency than that of Nup358 monomer (Nup358min) (gray). The percent formation of DDBNmin-zip complex was 35% (n = 945), 50% higher than that of DDBNmin complexes (23%, n = 514). (b, c) Visualization of complex formation of DDBN formed with a dimerized Nup358min-zip versus a monomeric Nup358min. Yellow dots (indicated by white arrows) show the formation of the DDBN complex. Single color green quantum dot (Qdot) indicates BicD2, and red indicates Nup358min-zip. (d) Nup358 min-zip alone does not bind to MTs. Concentration of Nup358min-zip was the same as (b, c).
Figure 2—video 1
Dynein-dynactin-BicD2-Nup358min-zip (DDBNmin-zip) is indicated by dual-color quantum dot (Qdot) (yellow) moving on microtubule tracks (not always seen due to photobleaching) at 2 mM MgATP.
Nup358 min-zip is labeled with a 655 nm Qdot (red), BicD2 is labeled with a 525 nm Qdot (green), and dynein-dynactin is unlabeled. Some single-color Qdots are moving long distances, presumably because both Nup358 and BicD2 are present but only one of them is labeled. Movie is displayed at 12× real speed. Scale bar 5 µm.
Figure 2—video 2
Fewer dynein-dynactin-BicD2 (DDB) complexes (green) show processive events compared to DDBNmin-zip (see Figure 2f).
BicD2 was labeled with a 525nm Qdot (green), and dynein-dynactin was unlabeled. Movie is displayed 12X real speed. Scale bar 5µm.
Figure 2—video 3
Dynein-dynactin-BicD2CC1 (DDBCC1) complex (green) moving on microtubule tracks at 2mM MgATP at 2mM MgATP.
BicD2 was labeled with a 525nm Qdot (green) and dynein-dynactin was unlabeled. Movie is displayed 12X real speed. Scale bar 5µm.
Figure 2—video 4
Source video (replicate of Figure 2—video 1).
DDBNmin-zip (yellow) moving on microtubule tracks at 6X real speed.
Figure 2—video 5
Source video (replicate of Figure 2—video 1).
DDBNmin-zip (yellow) moving on microtubule tracks at 6X real speed.
Figure 2—video 6
Source video (replicate of Figure 2—video 1).
DDBNmin-zip (yellow) moving on microtubule tracks at 6X real speed.
Figure 2—video 7
Source video (replicate of Figure 2—video 2).
Fewer dynein-dynactin-BicD2 (DDB) complexes (green) show processive events compared to DDBNmin-zip (displayed at 6X real speed).
Figure 2—video 8
Source video (replicate of Figure 2—video 2).
Fewer dynein-dynactin-BicD2 (DDB) complexes (green) show processive events compared to DDBNmin-zip (displayed at 6X real speed).
Figure 2—video 9
Source video (replicate of Figure 2—video 2).
Fewer dynein-dynactin-BicD2 (DDB) complexes (green) show processive events compared to DDBNmin-zip (displayed at 6X real speed).
Figure 2—video 10
Source video (replicate of Figure 2—video 3).
Dynein-dynactin-BicD2CC1 (DDBCC1) complex moving on microtubule tracks, displayed at 6X real speed.
Figure 2—video 11
Source video (replicate of Figure 2—video 3).
Dynein-dynactin-BicD2CC1 (DDBCC1) complex moving on microtubule tracks, displayed at 6X real speed.
Figure 2—video 12
Source video (replicate of Figure 2—video 3).
Dynein-dynactin-BicD2CC1 (DDBCC1) complex moving on microtubule tracks, displayed at 6X real speed.
Figure 2—video 13
Source video.
Dynein-dynactin-Nup358min-zip (DDNmin-zip) complexes (red) do not show processive motion on microtubule tracks. Nup358min-zip was labeled with a 655nm Qdot (red), and dynein-dynactin was unlabeled. Data were captured at 200 ms intervals (five frames/s) and the length per pixel was calibrated as 110 nm. Movie is displayed 6X real speed.
Figure 2—video 14
Source video (replicate of Figure 2—video 13).
Dynein-dynactin-Nup358min-zip (DDNmin-zip) complexes do not show processive motion on microtubule tracks. Movie displayed at 6X real speed.
Figure 2—video 15
Source video (replicate of Figure 2—video 13).
Dynein-dynactin-Nup358min-zip (DDNmin-zip) complexes do not show processive motion on microtubule tracks. Movie displayed at 6X real speed.
Figure 3 with 3 supplements
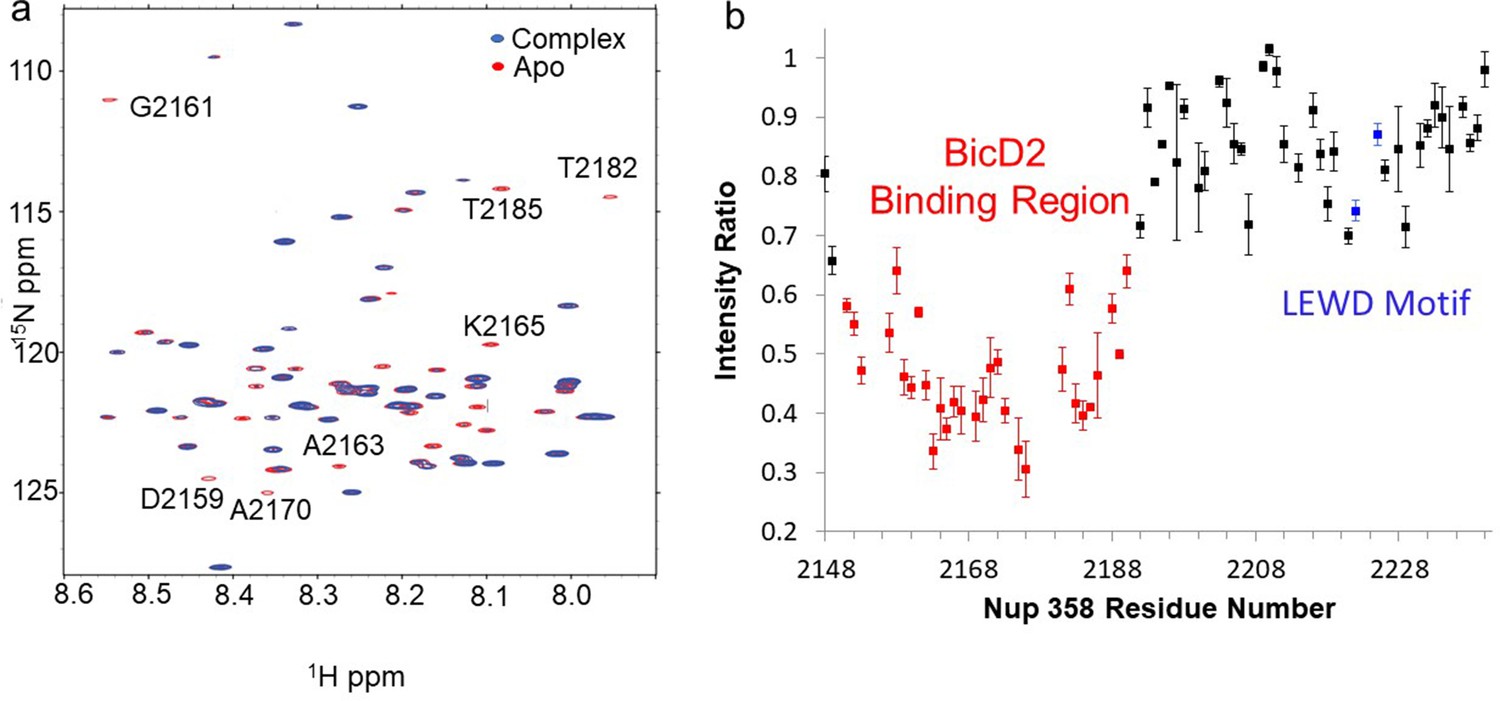
Nuclear magnetic resonance (NMR) titration mapped the BicD2-binding site to the N-terminal half of Nup358-min.
NMR mapping of Nup358 regions involved in BicD2-CTD binding was performed by titration of 15N-labeled Nup358-min with BicD2-CTD. (a) The HSQC spectrum of a 1:1 Nup358-min/BicD2-CTD complex (blue) is overlaid on that of apo-Nup358-min (red). The full HSQC assignment is shown in Figure 3—figure supplement 1. Many peaks disappeared in the complex spectrum (selected peaks labeled by residue name and number), indicating that BicD2 binding causes slow to intermediate chemical exchange on the NMR time scale. (b) Plot of the peak intensity change vs. the residue number of Nup358. The peak intensities I, as determined by peak heights, of the 1:1 BicD2-CTD/Nup358-min complex spectrum were divided by the peak intensities of the apo-Nup358 spectrum (I0) to obtain I/I0. Data points with an I/I0 of 0.65 or lower are colored red. This plot shows that the N-terminal half of Nup358-min is largely responsible for BicD2 binding. The peak intensities corresponding to the LEWD sequence motif (colored blue) in Nup358, which mediates binding of KLC2, are not affected by BicD2 binding. For the full titration results, please see Figure 3—figure supplement 2.
-
Figure 3—source data 1
Source data for NMR titration plot.
- https://cdn.elifesciences.org/articles/74714/elife-74714-fig3-data1-v3.xlsx
Figure 3—figure supplement 1
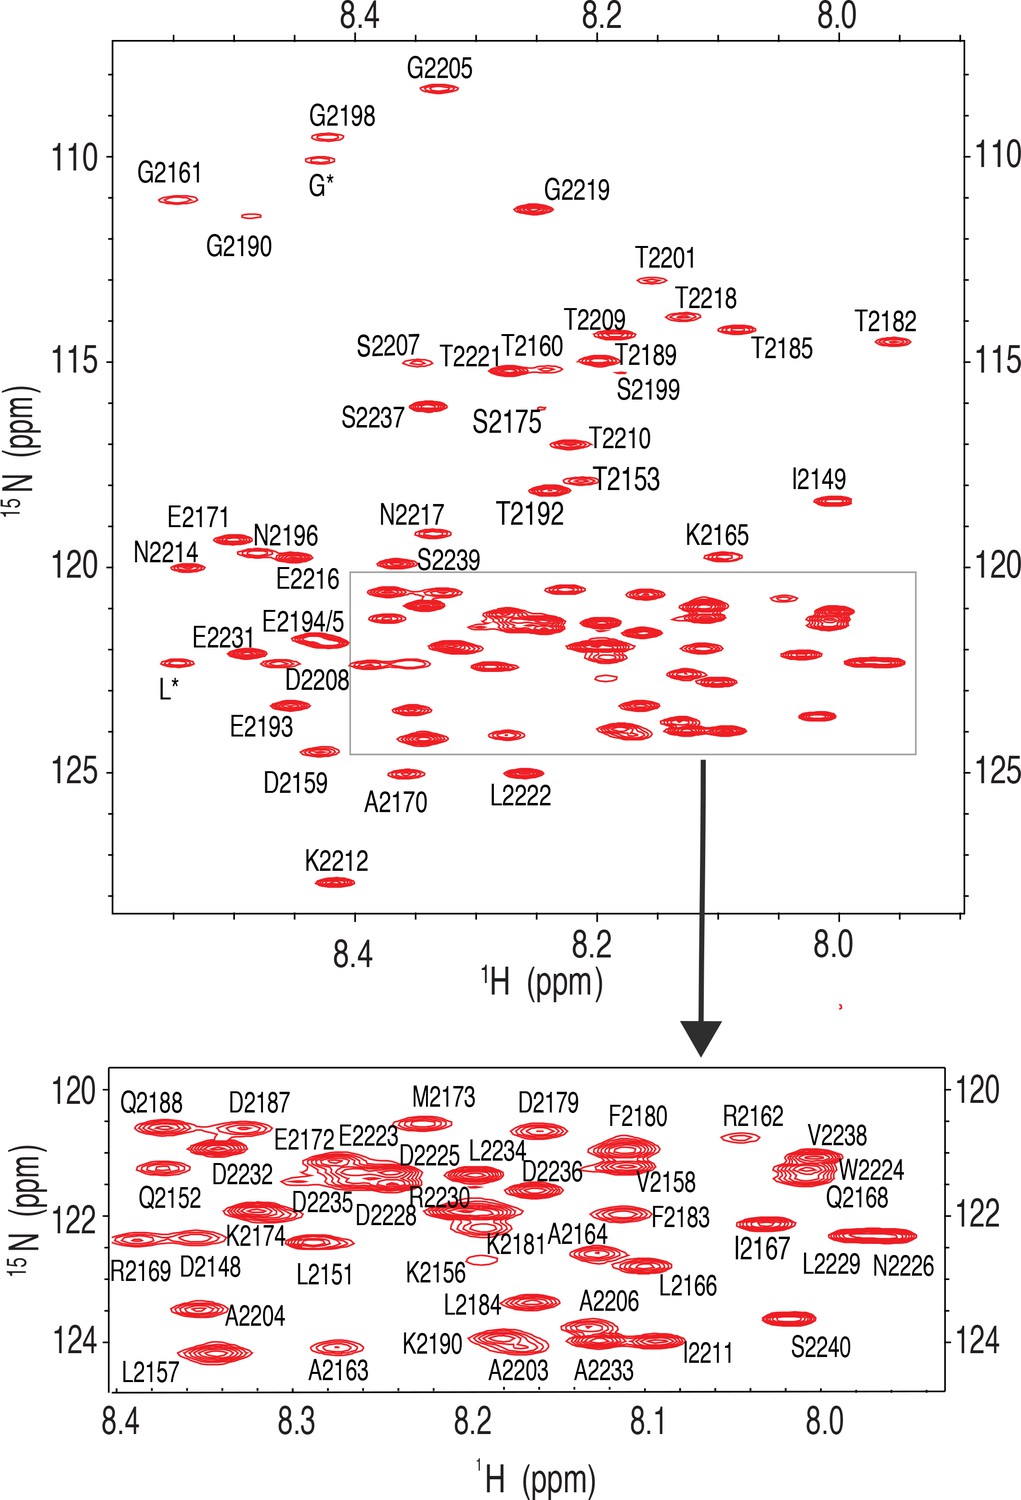
Fully assigned 15 N-1H HSQC nuclear magnetic resonance (NMR) spectrum for Nup358-min.
Inset shows the assignment of peaks in a crowded region.
Figure 3—figure supplement 2
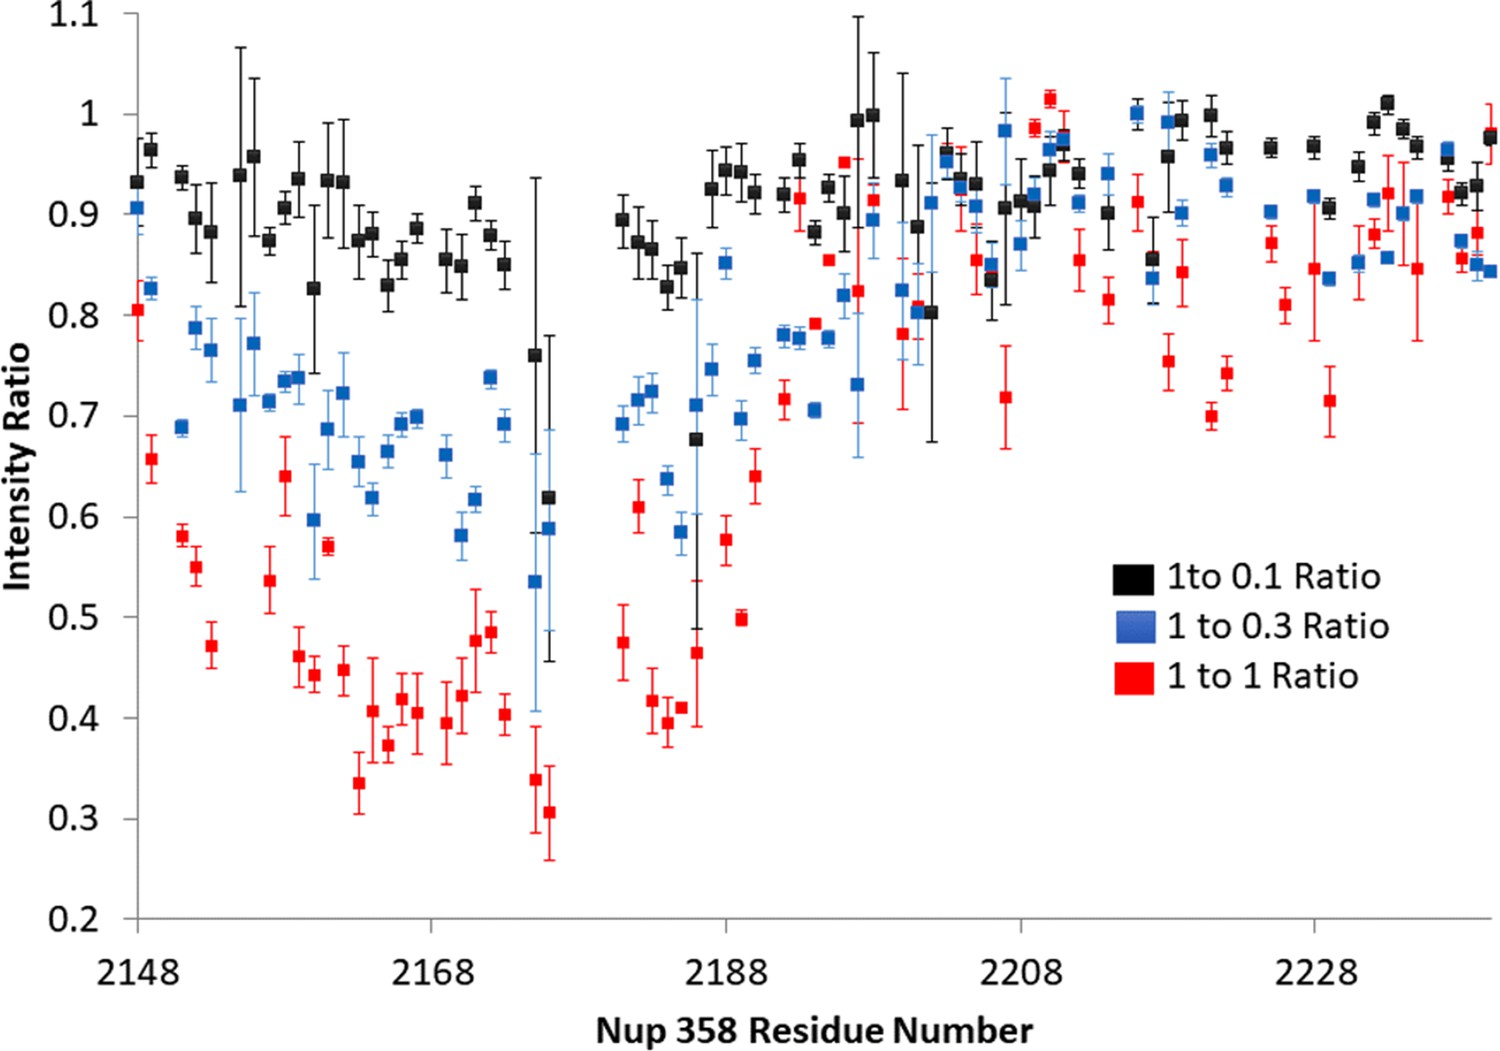
Three points of Nup358:BicD2 titration.
The titration clearly shows a consistent drop in intensity of the peaks in Nup358 that are in the BicD2-binding region. The Nup358 concentration was held constant at 1, and unlabeled BicD2 was added. The intensity ratio is determined dividing the height of the titrated peak by the height of the Apo peak. Error was estimated based on signal/noise for the first two titration points and based on three repeat measurements for the 1:1 complex.
Figure 3—figure supplement 3
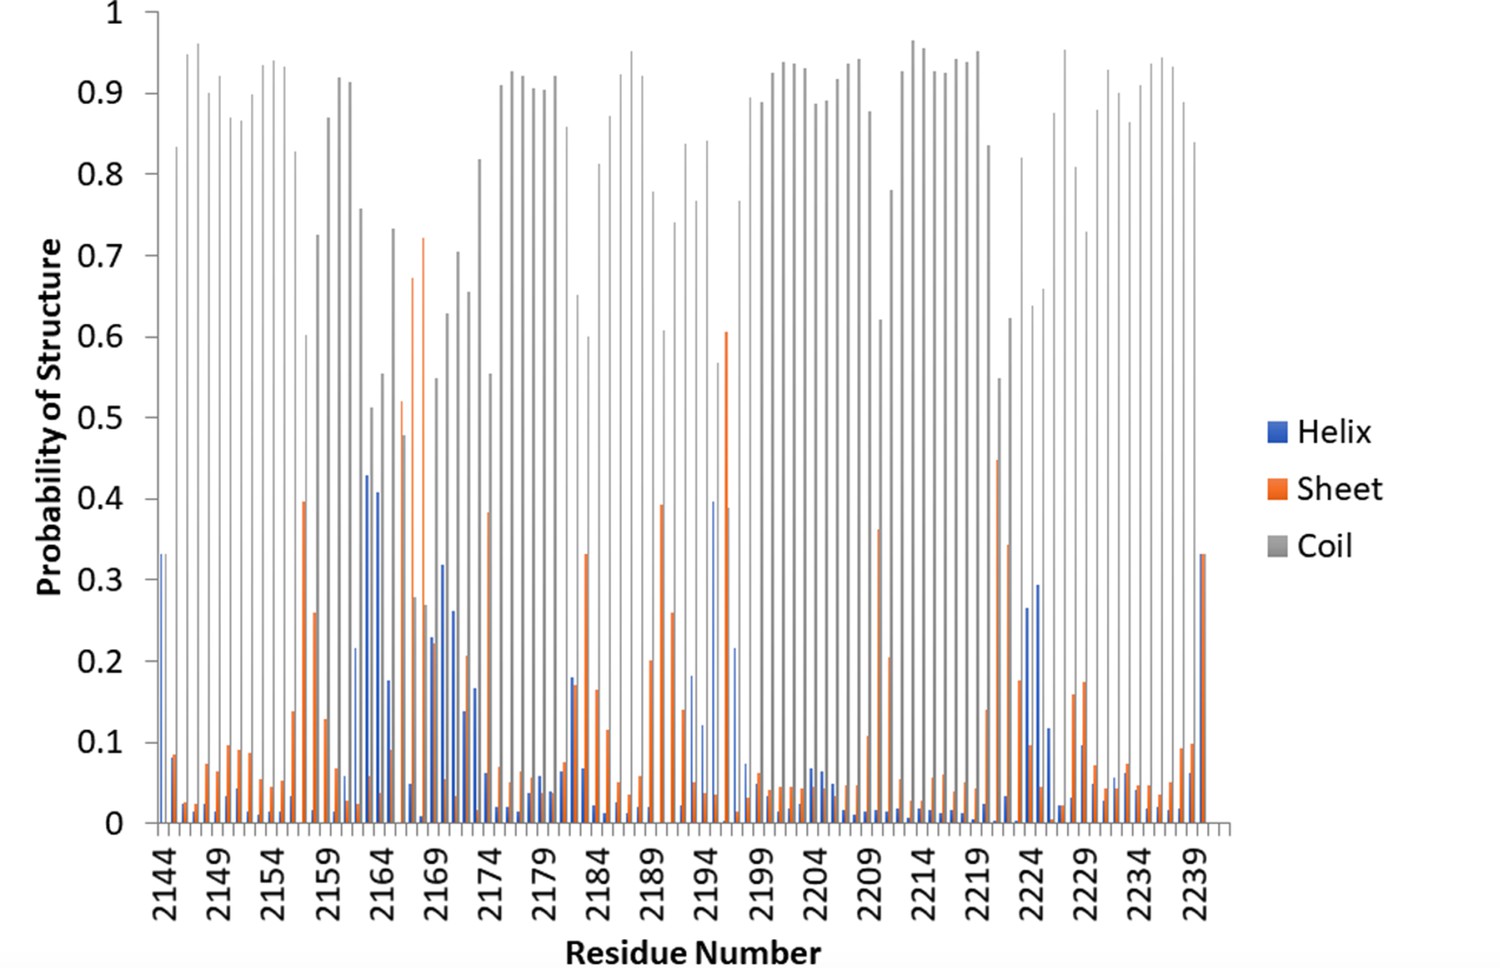
TALOS-N demonstrates random coil for Nup358-min.
TALOS-N, a highly accurate program for determining secondary structure based on chemical shifts, was used to determine the secondary structure of the apo protein. The majority of the protein heavily favors random coil.
Figure 4 with 4 supplements
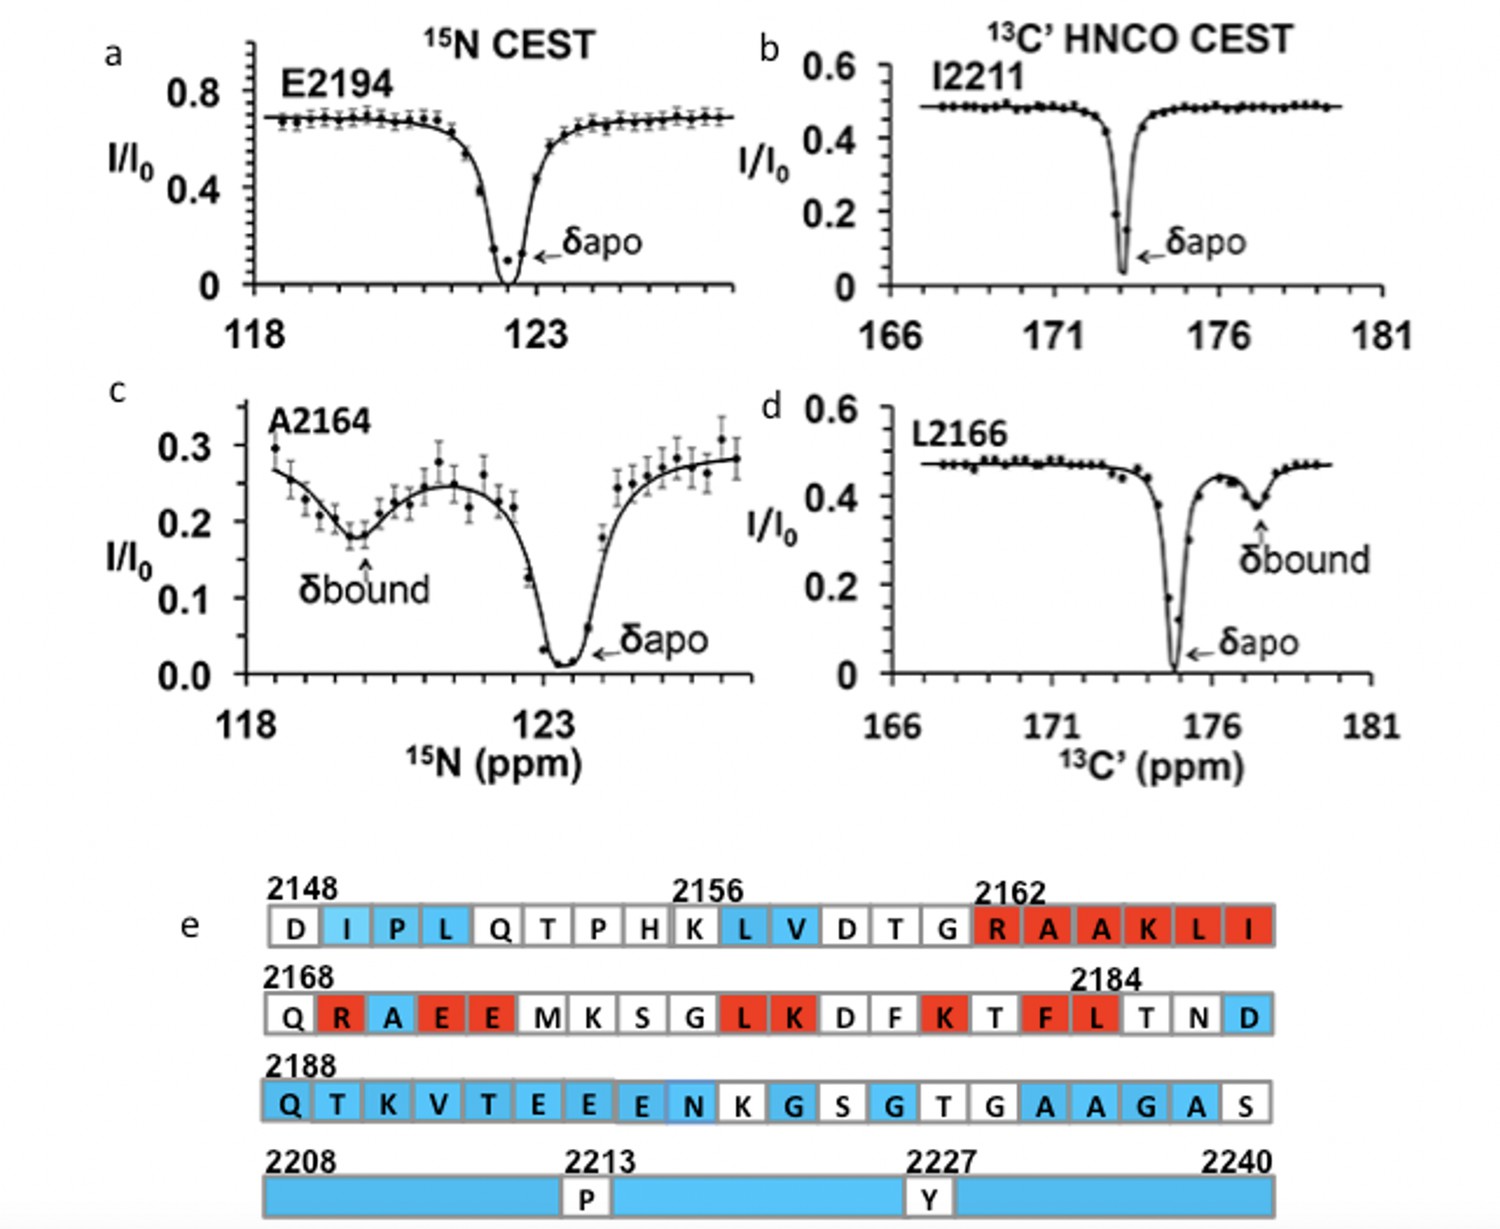
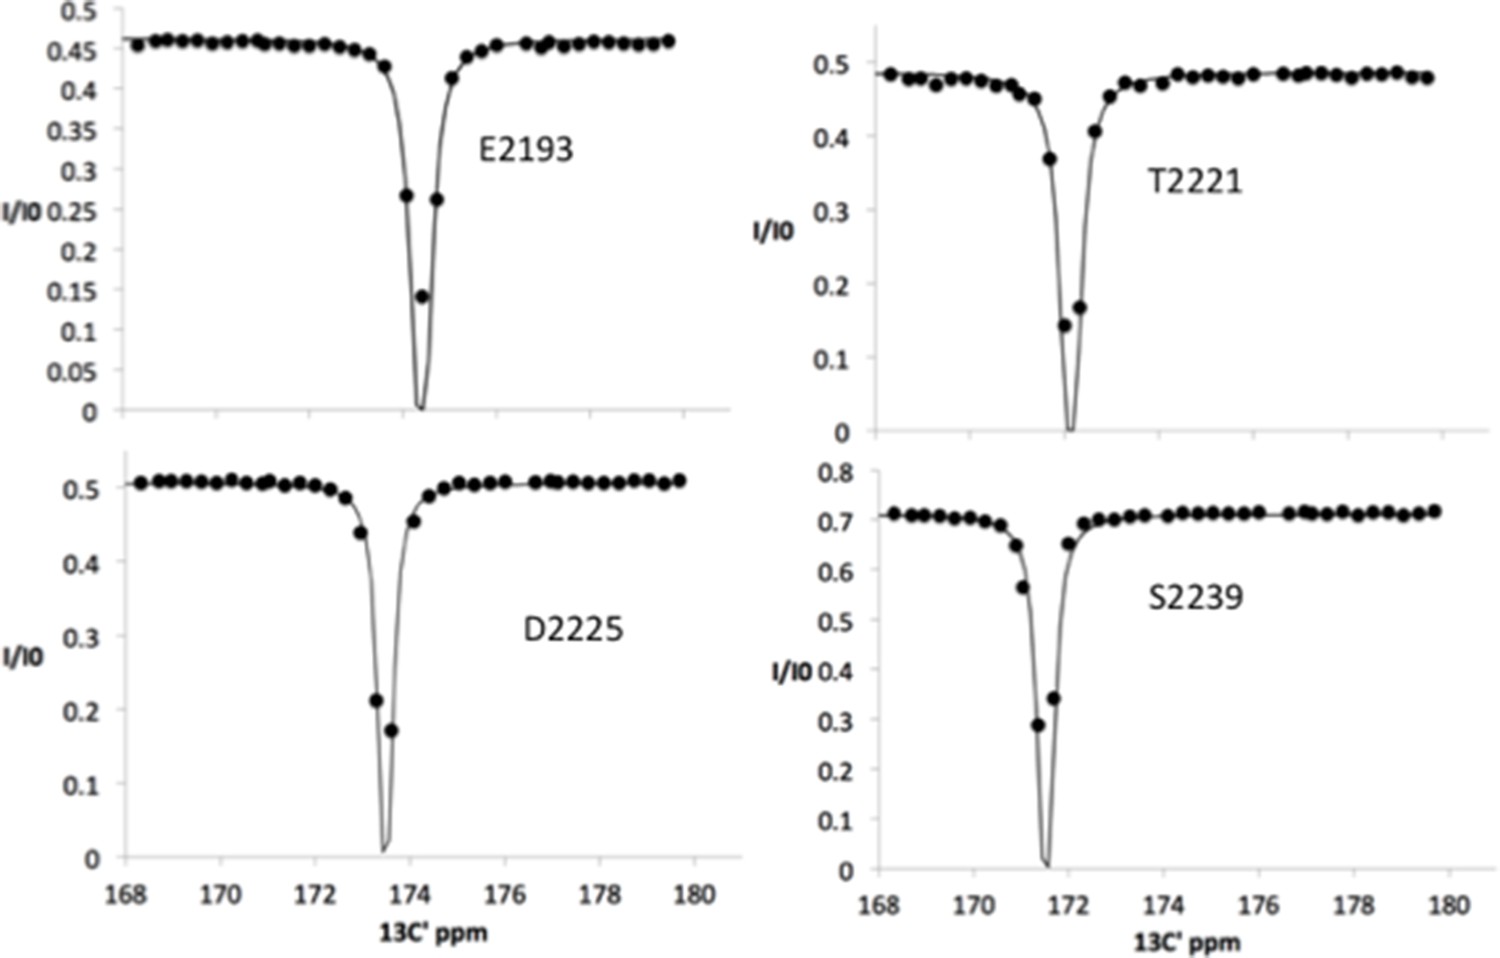
Chemical exchange saturation transfer (CEST) maps chemical shifts of nuclear magnetic resonance (NMR)-invisible, BicD2-bound state of Nup358.
In the CEST profile curve, E2194 and I2211 have only a single dip in 15N-CEST (a) and 13C′-CEST (b), respectively, due to little chemical shift perturbation upon BicD2-CTD binding. This suggests that E2194 is not at the binding interface and does not undergo conformational transition upon BicD2-CTD binding. In contrast, A2164 shows not only a dip at the chemical shift of the apo HSQC assignment, but also a smaller dip at about 3 ppm to the left in 15N-CEST (c), indicating that A2164 is in the binding region and/or experiences a conformational transition upon complex formation. (d) L2166 has a major peak and then a minor peak about 2.5 ppm to the right. The magnitude and direction of the chemical shift difference suggest a transition from a random coil to an α-helix (see Table 1). (e) Summary of the CEST data obtained across the entire Nup358-min region. Red squares show residues with double dip in CEST profile. Their chemical shift changes from the apo to the bound state indicate that these red residues are part of the α-helical region at the Nup358/BicD2 interface. Blue-colored residues show a single dip in CEST profile, suggesting that these remain in random coil conformation. White represents the residues where data were not obtained due to low signal-to-noise ratio or resonance overlap. All the curves with double dips and a sampling of curves with only single dip fits are shown in Figure 4—figure supplements 1–4.
-
Figure 4—source data 1
Source Data for CEST Curves.
- https://cdn.elifesciences.org/articles/74714/elife-74714-fig4-data1-v3.xlsx
Figure 4—figure supplement 1
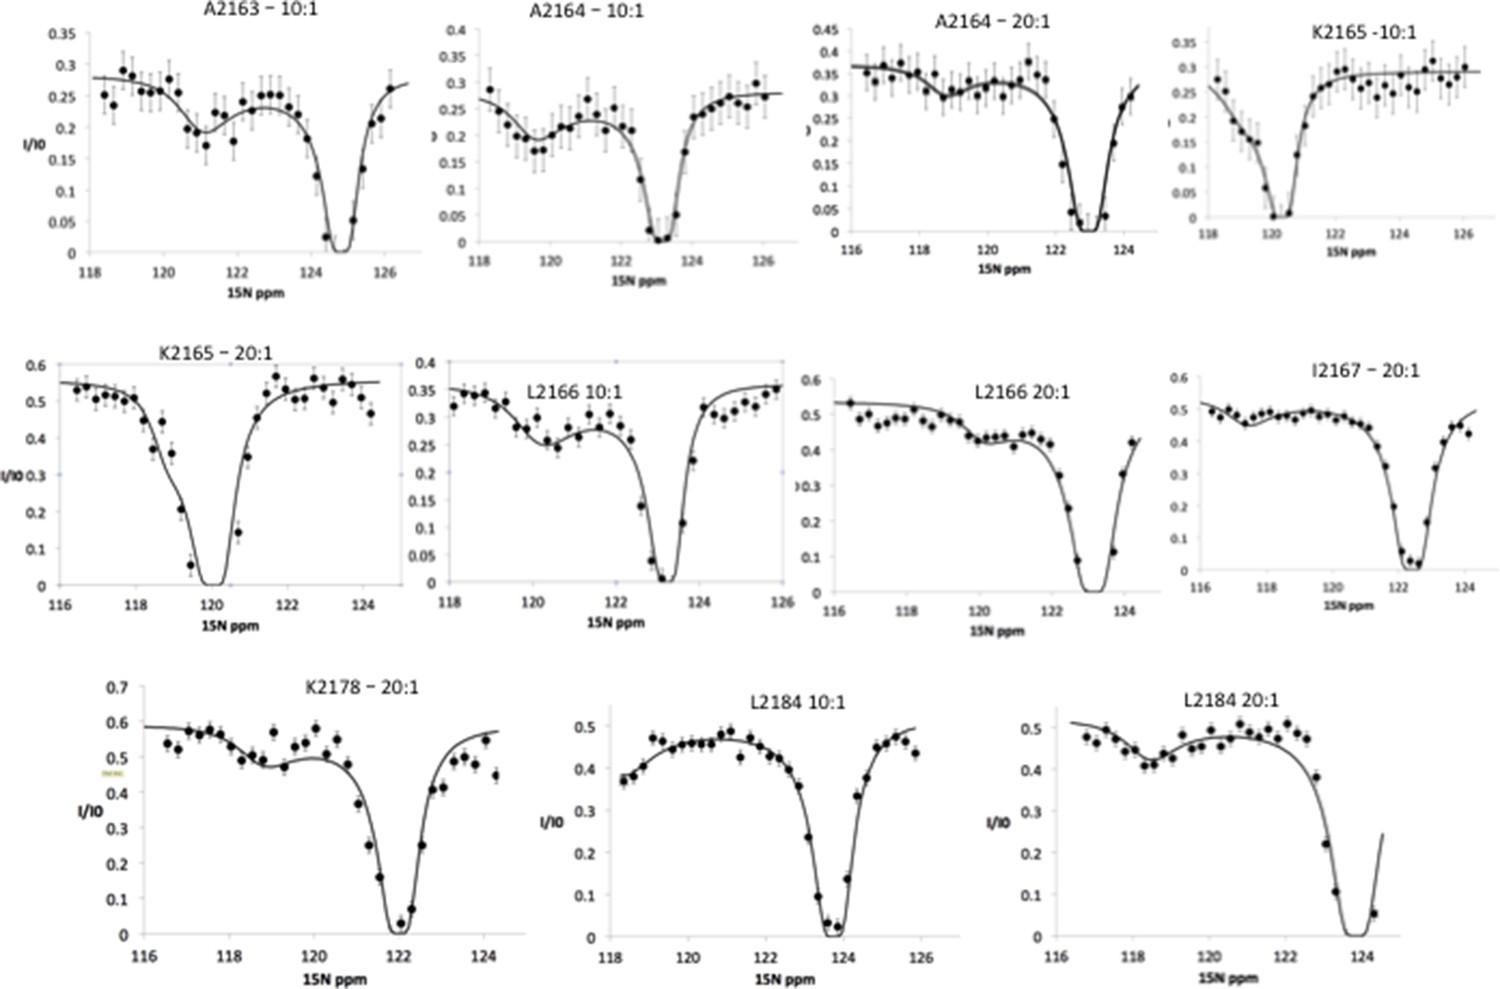
15N chemical exchange saturation transfer (CEST) profiles for Nup358 residues showing exchange between random coil state and an α-helical state.
These CEST profiles have a double-dip appearance, showing the bound state, represented by the minor dip as well as the free state, represented by the major dip. This experiment was repeated under slightly different conditions, one with a molar ratio 10:1 Nup358-min to BicD2-CTD and another one with a ratio of 20:1 Nup358-min to BicD2-CTD. The chemical shift range was also shifted by 2 ppm when the 20:1 ratio experimental was run. For example, one can see the presence of both the minor and major dips in L2184 in the ‘10:1’ experiment as well as the ‘20:1’ experiment, although the major dip do not return to baseline. This truncation was due to limited NMR time, necessitated by the stability of the sample. The 15N CEST curves resulted in the following residues being assigned as part of the α-helical region in bound state: A2163, A2164, K2165, L2166, I2167, K2178, and L2184.
Figure 4—figure supplement 2
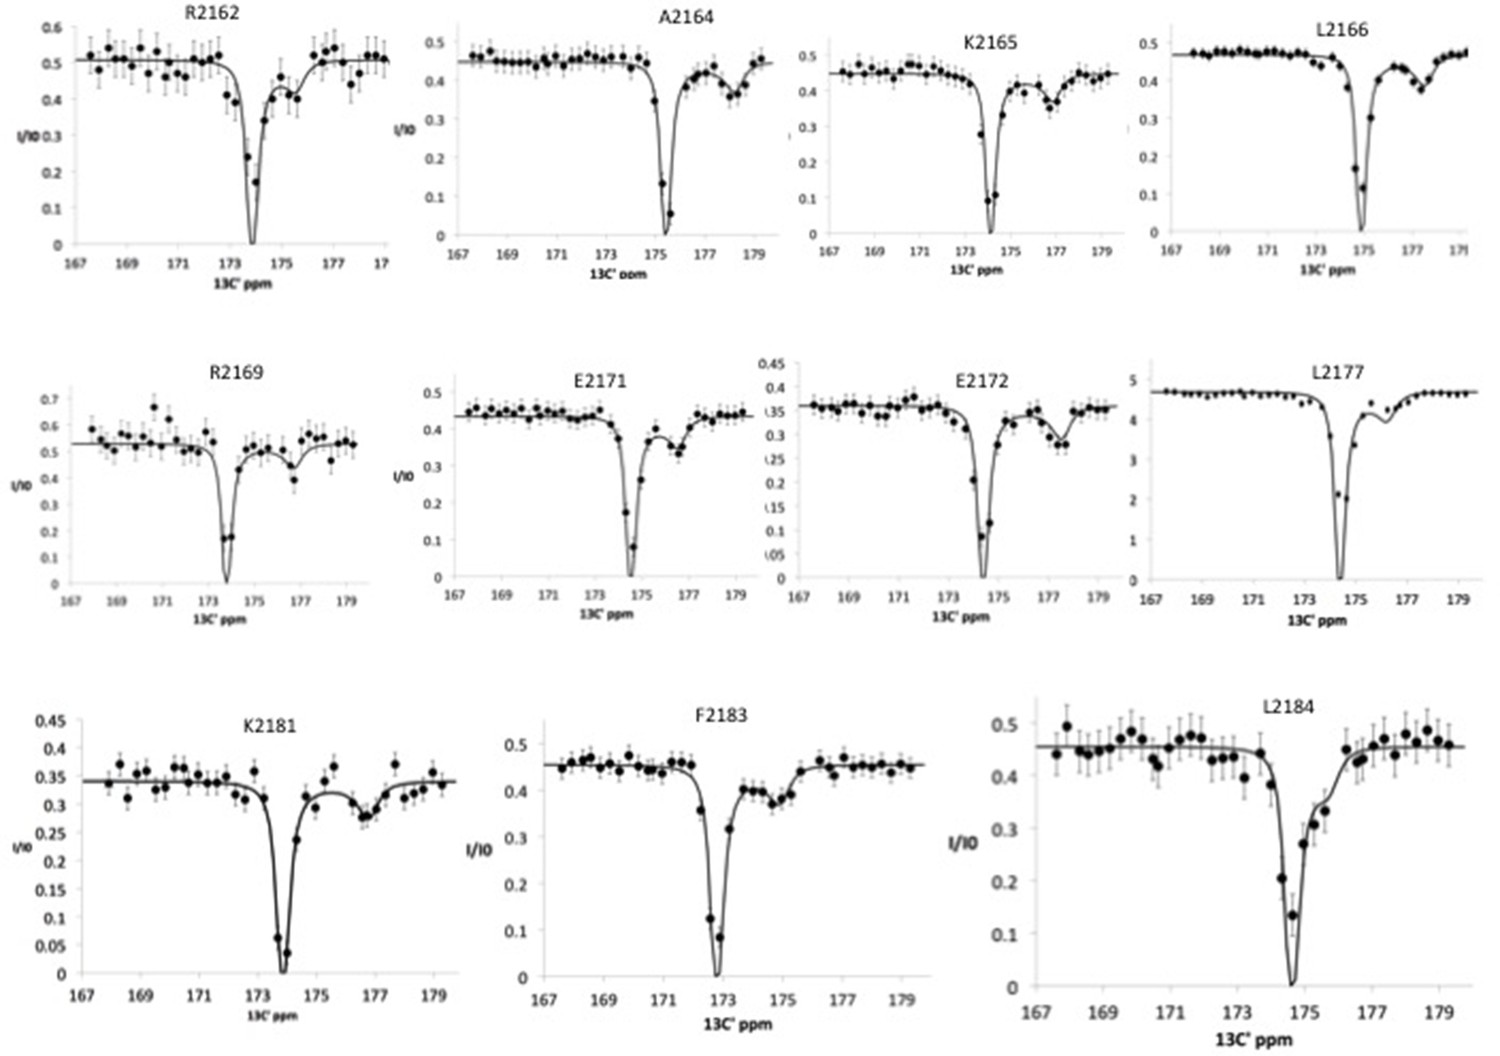
13C′ chemical exchange saturation transfer (CEST) profiles for Nup358 residues showing exchange between random coil state and an α-helical state, showing the minor dip as well as the major dip, representing the chemical shift of the bound state.
This experiment was performed using a 20:1 molar ratio of Nup358-min to BicD2-CTD. The following residues, already identified as α-helical residues, using the 15N CEST experiments, were confirmed with 13C′ CEST experiments: A2164, K2165, and L2166. Additionally, the following residues were added to the list of α-helical residues: R2162, R2169, E2171, E2172, L2177, K2181, F2183, and L2184. To fit the global exchange rate, only curves with sufficient signal/noise, significant resolution between the major and minor dips, and curves with sufficient resolution between the minor dip and the end of the curve were used.
Figure 4—figure supplement 3
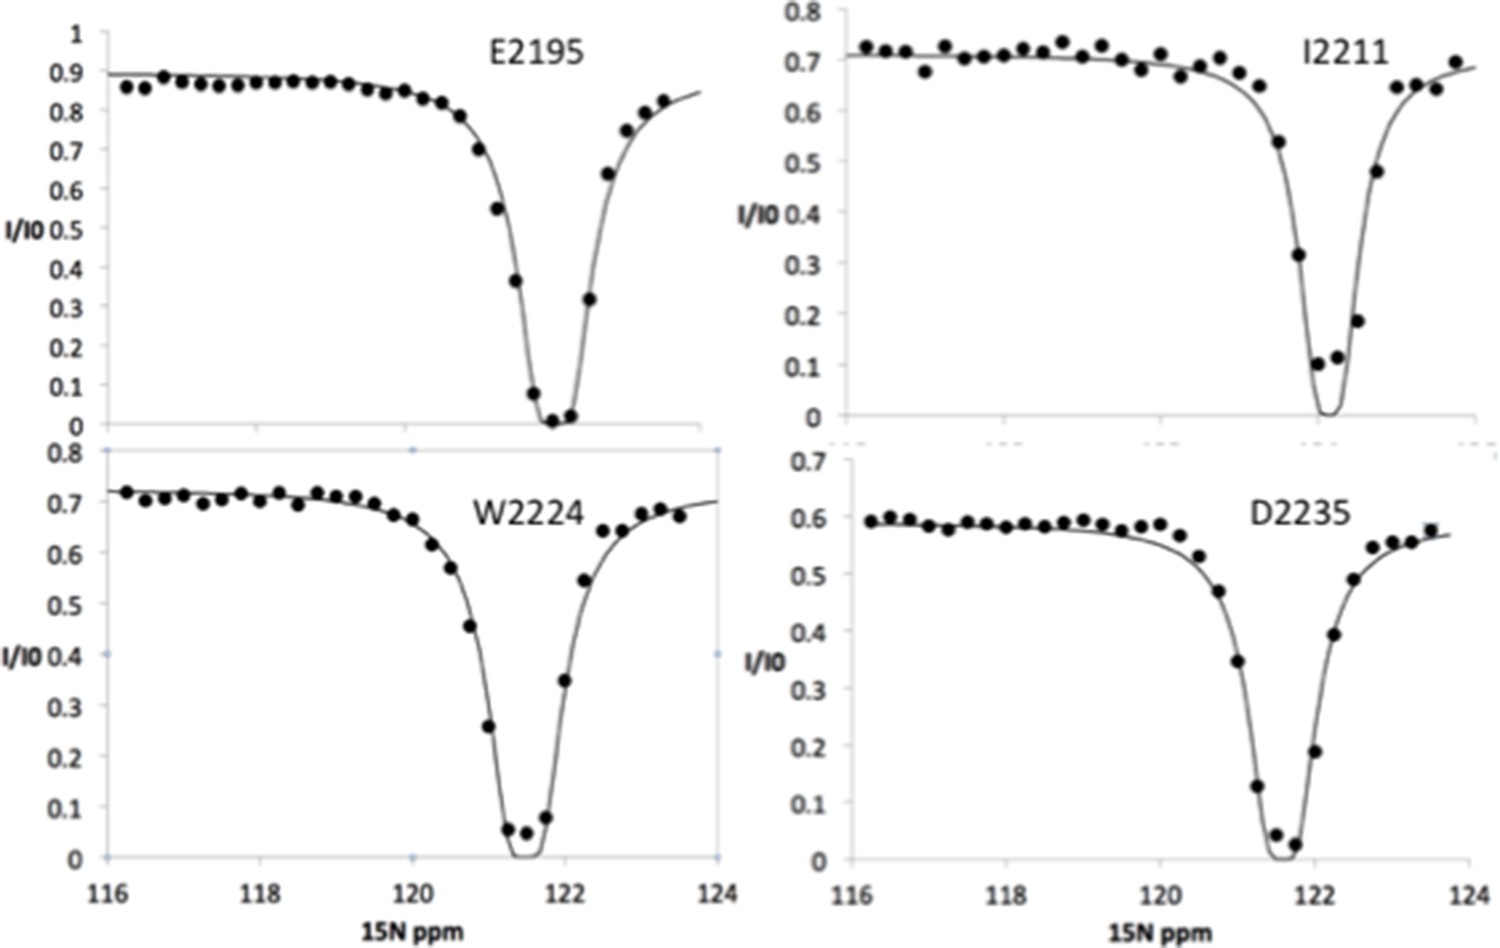
15N chemical exchange saturation transfer (CEST) profiles for Nup358 residues showing NO exchange between the random coil state and an α-helical state.
These 15N CEST curves show only a single dip at the major chemical shift, indicating that these sites do not undergo chemical exchange to a bound state. Note that these sites include residues around the LEWD motif as well as sites all the way to the C-terminus of Nup358-min.
Figure 4—figure supplement 4
13C chemical exchange saturation transfer (CEST) profiles for Nup358 residues showing NO exchange between a random coil state and an α-helical state, showing only a single dip at the major chemical shift.
Note that these sites include residues around the LEWD motif as well as sites at the C-terminus half of Nup358-min (see Figure 4).
Figure 5 with 1 supplement
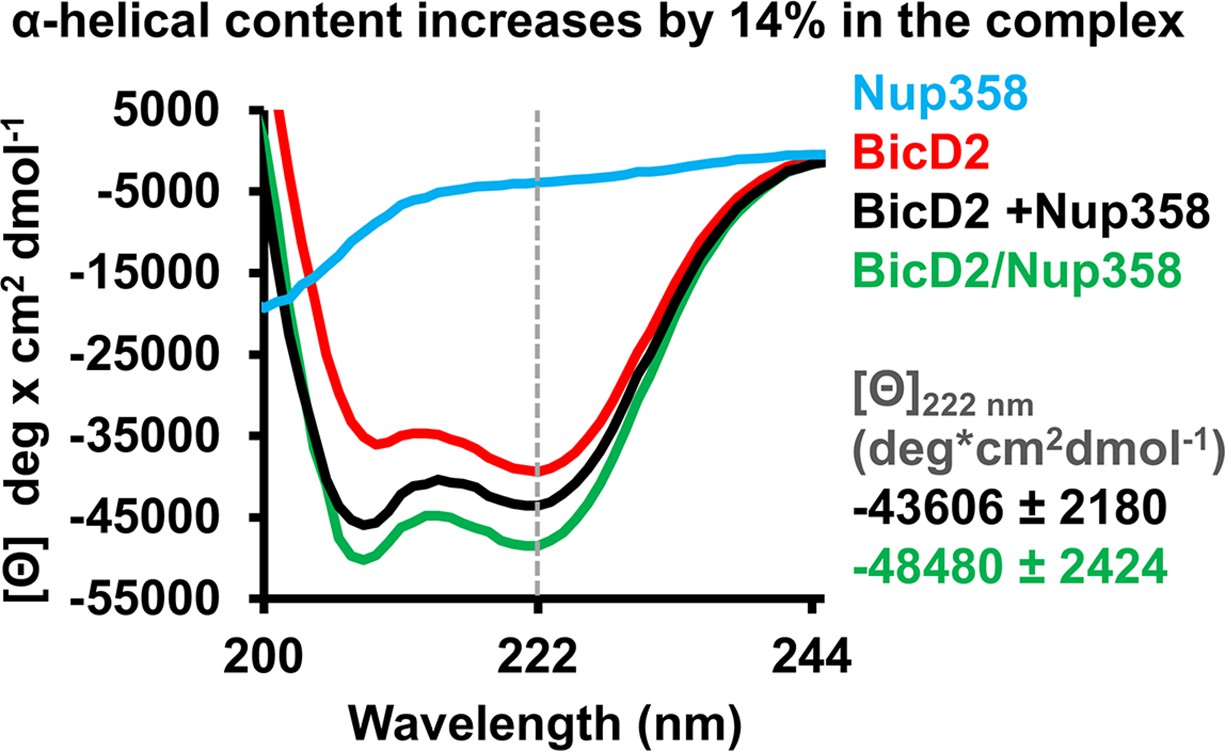
Circular dichroism (CD) spectroscopy confirms formation of an α-helix in the Nup358/BicD2 complex.
CD wavelength scans of BicD2-CTD (red), Nup358-min (blue), and the Nup358-min/BicD2 complex (green) at 4°C are shown. The sum of the individual wavelength scans of Nup358-min and BicD2-CTD is shown in black. The mean residue molar ellipticity [Θ] versus the wavelength is shown. Experiments were repeated two or three times, and representative scans are shown. A characteristic feature of α-helical structures is a local minimum at 222 nm (dashed line). Based on the values for [Θ] at 222 nm (shown on the right) and based on our calibration curve (Figure 5—figure supplement 1), the Nup358/BicD2 complex has a 14% ± 5% increase in α-helical content compared to the sum of the spectra of BicD2 and Nup358. See Figure 5—figure supplement 1 and Figure 5—source data 1.
-
Figure 5—source data 1
CD spectra.
- https://cdn.elifesciences.org/articles/74714/elife-74714-fig5-data1-v3.xlsx
Figure 5—figure supplement 1
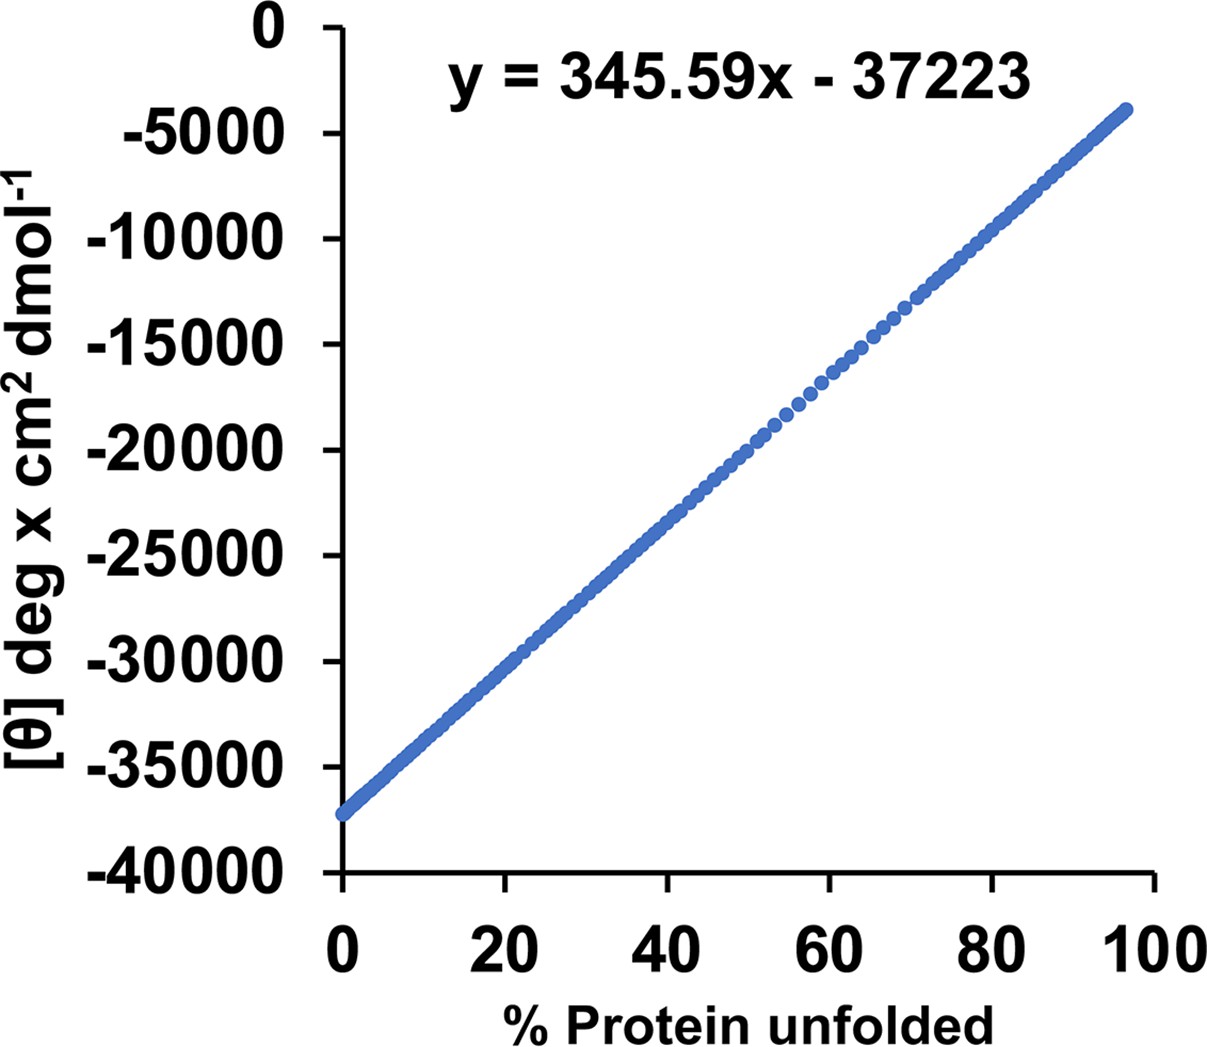
Calibration curve for the circular dichroism (CD) signal, based on a published melting curve of BicD2-CTD.
We previously published the thermal unfolding curve of wild-type BicD2-CTD that was recorded by CD spectroscopy at 222 nm (Figure 4E in reference Noell et al., 2019). Here, this curve was replotted as mean residue molar ellipticity [Θ] versus % protein unfolded to obtain a calibration curve for the α-helical content. 0% and 100% protein unfolded represent the values of [Θ]min and [Θ]max from the melting curve, respectively. At the apparent melting temperature TM, the protein is 50% unfolded. For purposes of calibration, we assume that native, 0% unfolded BicD2-CTD has an α-helical content of 96% as observed in the crystal structure 303030. We also used this method recently to assess changes in α-helical content in the Drosophila homolog BicD (Cui et al., 2020).
Figure 6 with 4 supplements
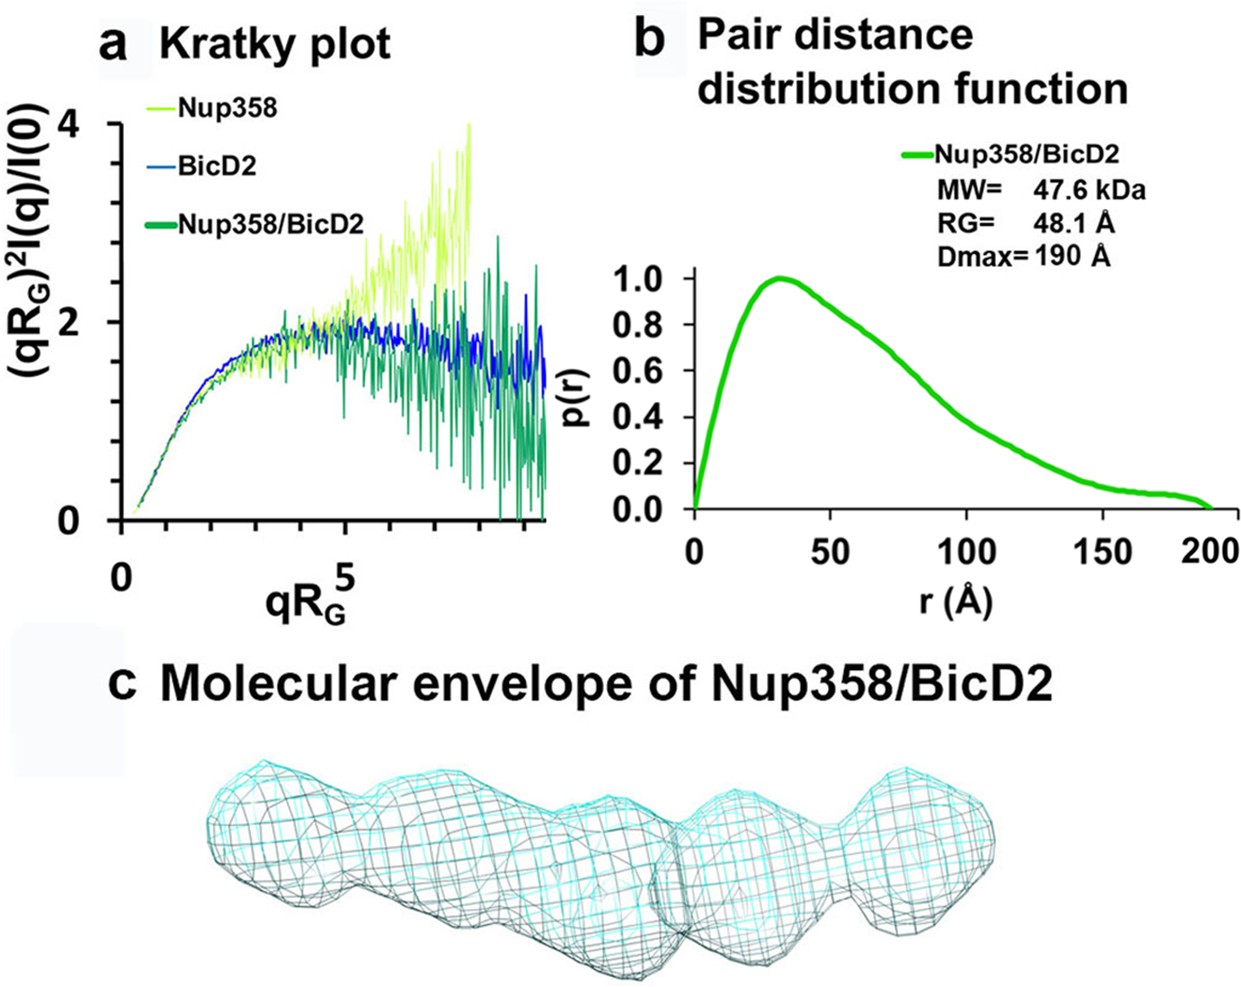
Low-resolution structures determined by small-angle X-ray scattering (SAXS) confirm that the complex has a rod-like shape that is more compact than the individual proteins.
(a) Dimensionless Kratky plots of the SAXS data collected from the minimal Nup358/BicD2 complex, from Nup358-min and BicD2-CTD (q: scattering vector; RG: radius of gyration; I(q): scattering intensity). (b) The pair distance distribution function p(r) of the Nup358-min/BicD2-CTD complex was derived from the scattering intensity profile (Figure 6—figure supplement 1). The molecular weight MW (Rambo and Tainer, 2013), the radius of gyration RG from the Guinier plot, and the largest dimension of the particle Dmax are shown. (c) Refined bead model 3D reconstruction of the Nup358-min/BicD2-CTD complex (cyan mesh). The statistical analysis and supporting SAXS data are summarized in Figure 6—figure supplement 1–4 and Appendix 2. See also Figure 6—source data 1.
-
Figure 6—source data 1
Small-angle X-ray scattering (SAXS) data.
- https://cdn.elifesciences.org/articles/74714/elife-74714-fig6-data1-v3.zip
Figure 6—figure supplement 1
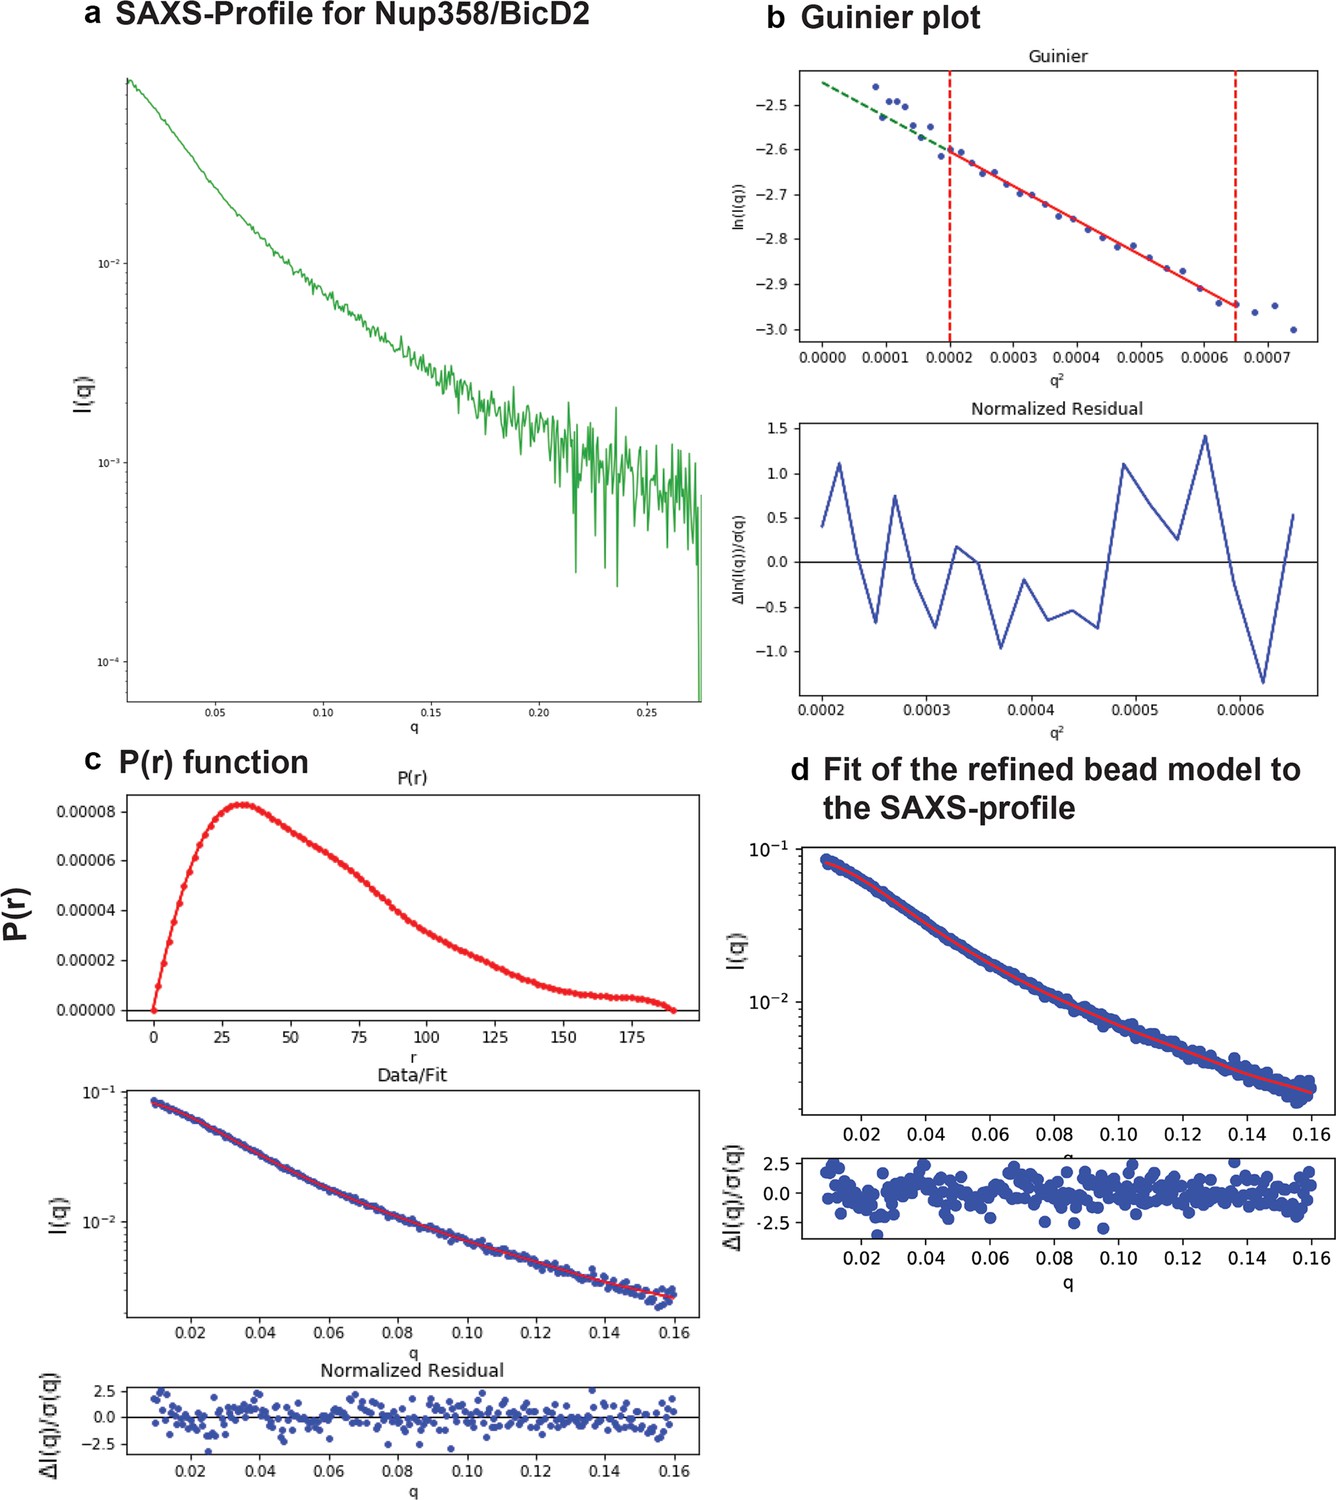
SAXS plots for Nup358-min/BicD2-CTD complex.
(a) The scattering intensity profile I(q) is shown as a function of the scattering vector (q). (b) The Guinier plot (top panel) is shown together with the normalized residual of the Guinier fit (bottom panel). (c) The pair distance distribution function p(r) is shown (top panel). The middle panel shows the scattering intensity profile calculated from the p(r) function (red) overlaid with the scattering intensity profile of the actual data (blue). The bottom panel shows the normalized residual of the fit. (d) The ‘data’ scattering intensity profile (blue) is overlaid with the ‘model’ scattering intensity profile that was calculated from the refined bead model 3D reconstruction (red, top panel). The bottom panel shows the normalized residual of the fit.
Figure 6—figure supplement 2
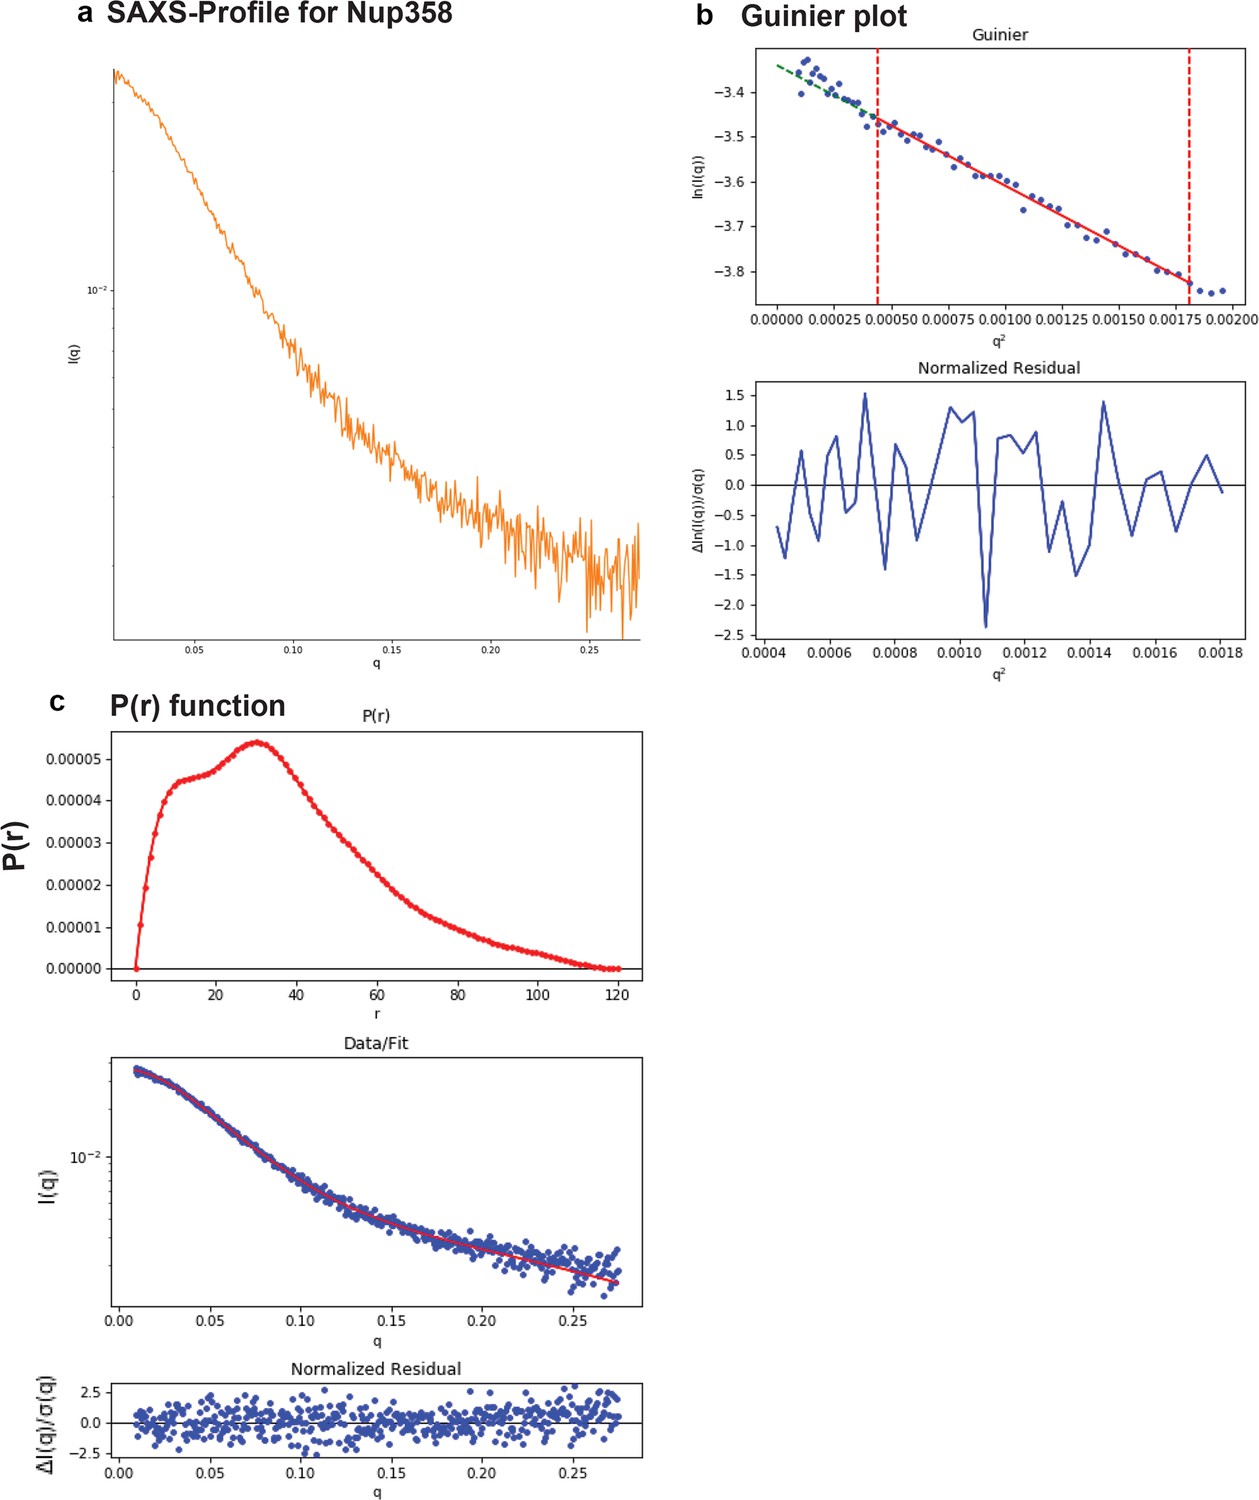
SAXS plots for Nup358-min.
(a) The scattering intensity profile I(q) is shown as a function of the scattering vector (q). (b) The Guinier plot (top panel) is shown together with the normalized residual of the Guinier fit (bottom panel). (c) The pair distance distribution function p(r) is shown (top panel). The middle panel shows the scattering intensity profile calculated from the p(r) function (red) overlaid with the scattering intensity profile of the actual data (blue). The bottom panel shows the normalized residual of the fit.
Figure 6—figure supplement 3
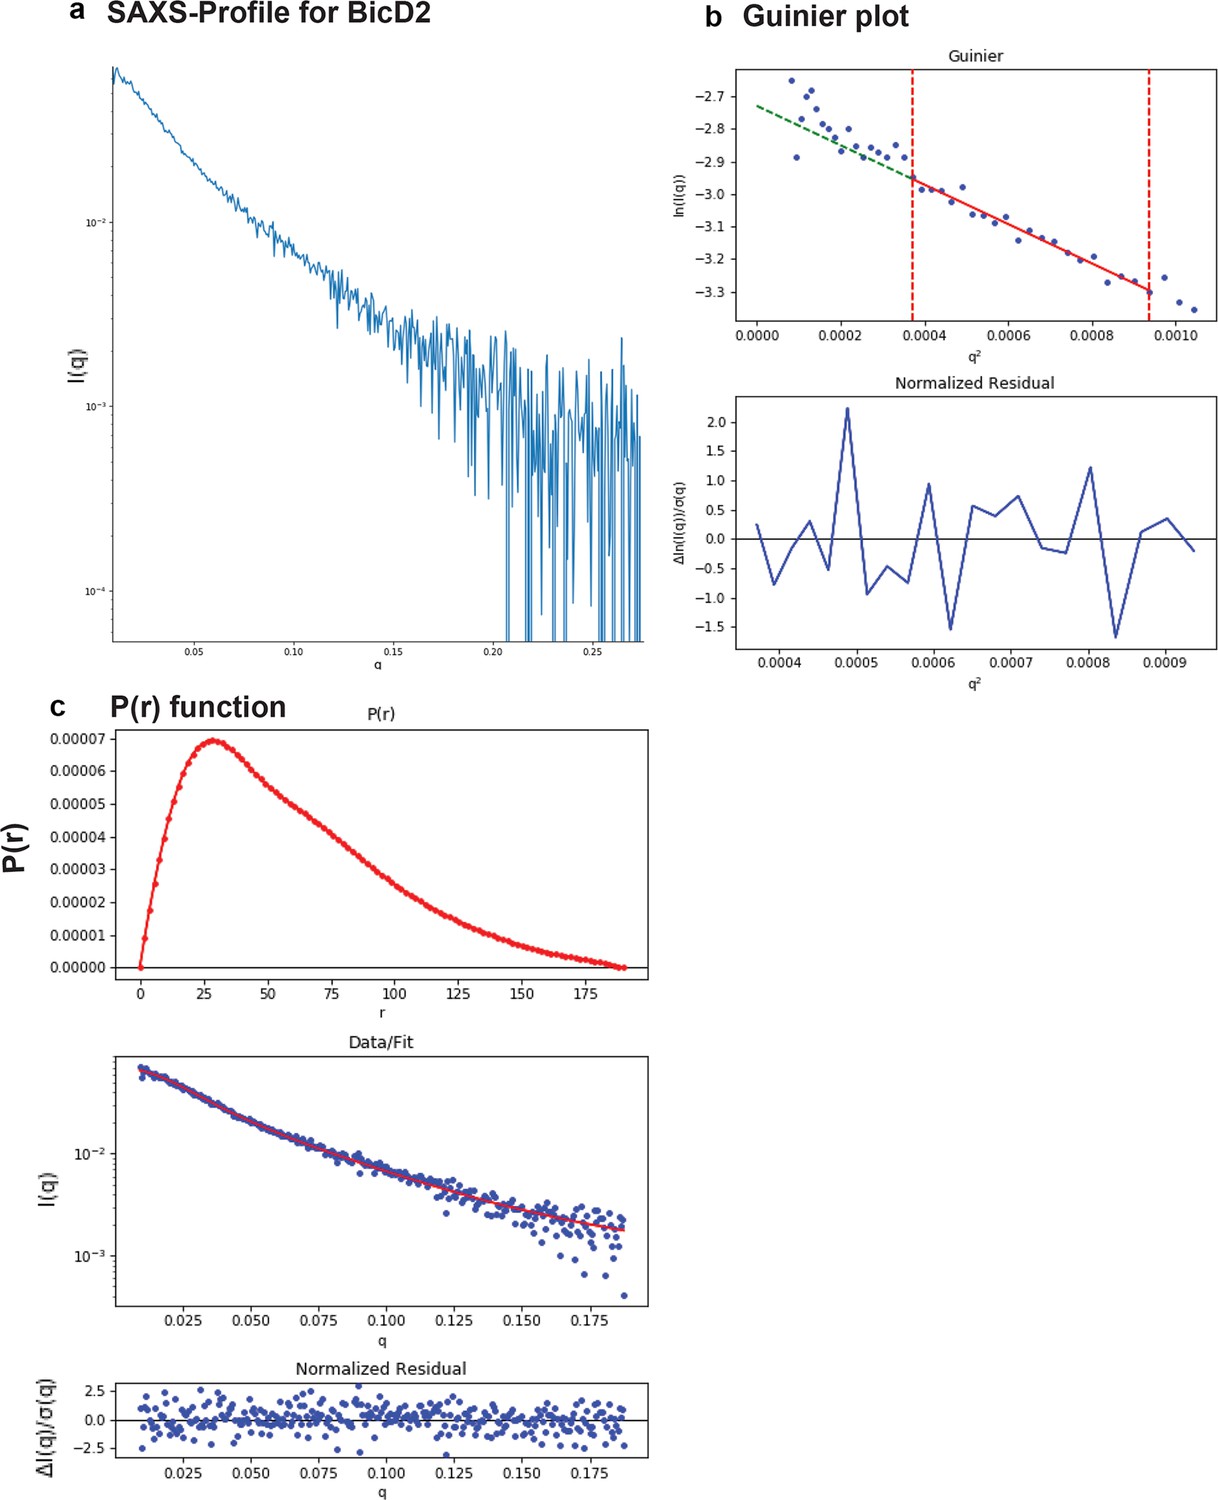
SAXS plots for BicD2-CTD.
(a) The scattering intensity profile I(q) is shown as a function of the scattering vector (q). (b) The Guinier plot (top panel) is shown together with the normalized residual of the Guinier fit (bottom panel). (c) The pair distance distribution function p(r) is shown (top panel). The middle panel shows the scattering intensity profile calculated from the p(r) function (red) overlaid with the scattering intensity profile of the actual data (blue). The bottom panel shows the normalized residual of the fit.
Figure 6—figure supplement 4
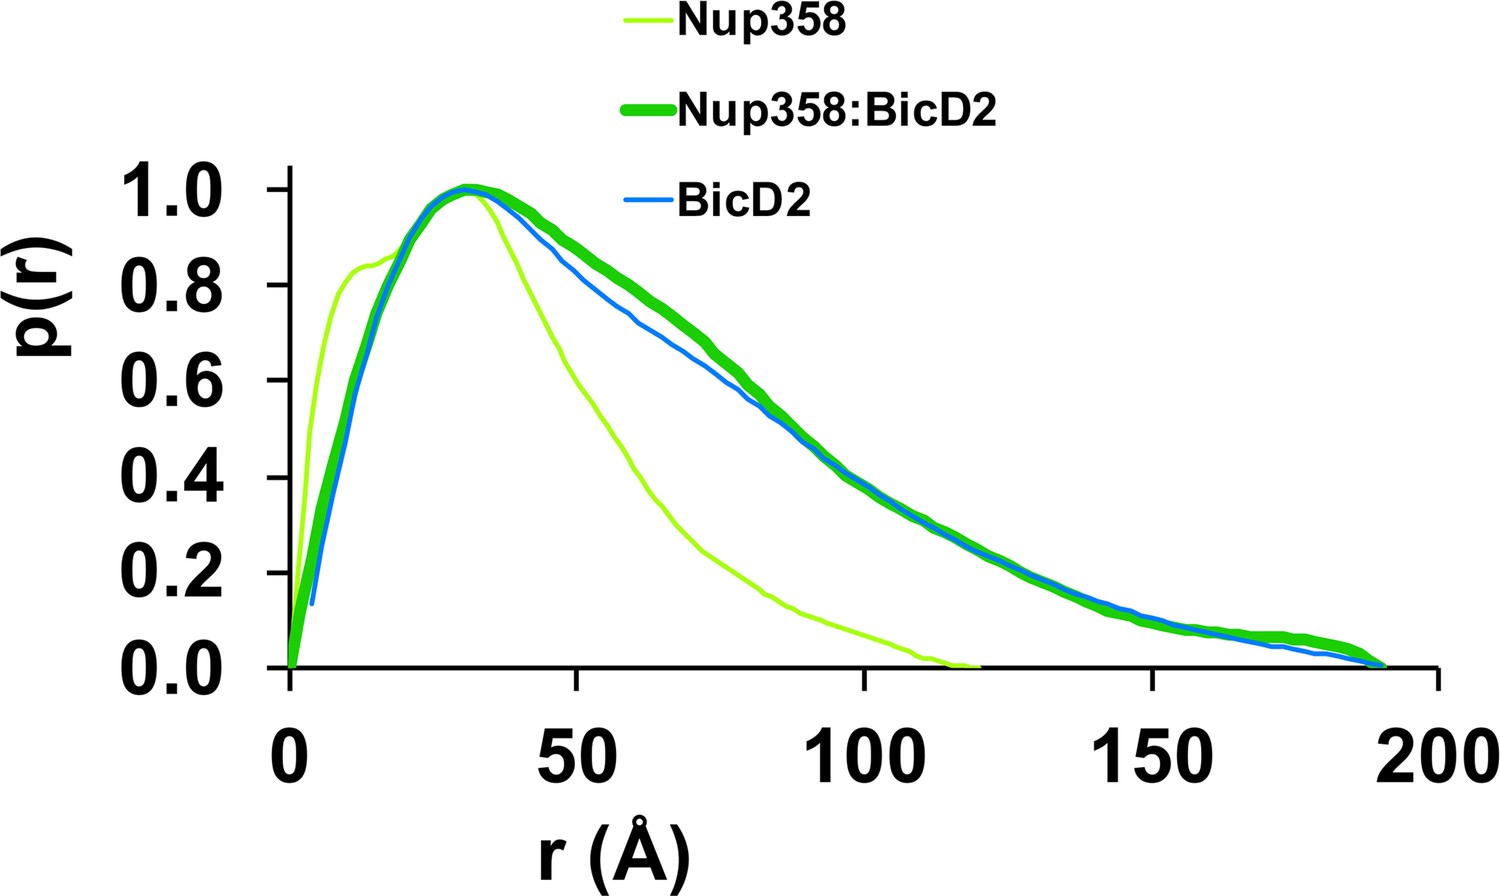
The pair distance distribution p(r) functions of the Nup358-min/BicD2-CTD complex, Nup358-min, and BicD2-CTD.
The p(r) functions were derived from the SAXS profiles (Figure 6—figure supplements 1–3) and normalized towards the highest signal.
Figure 7 with 1 supplement
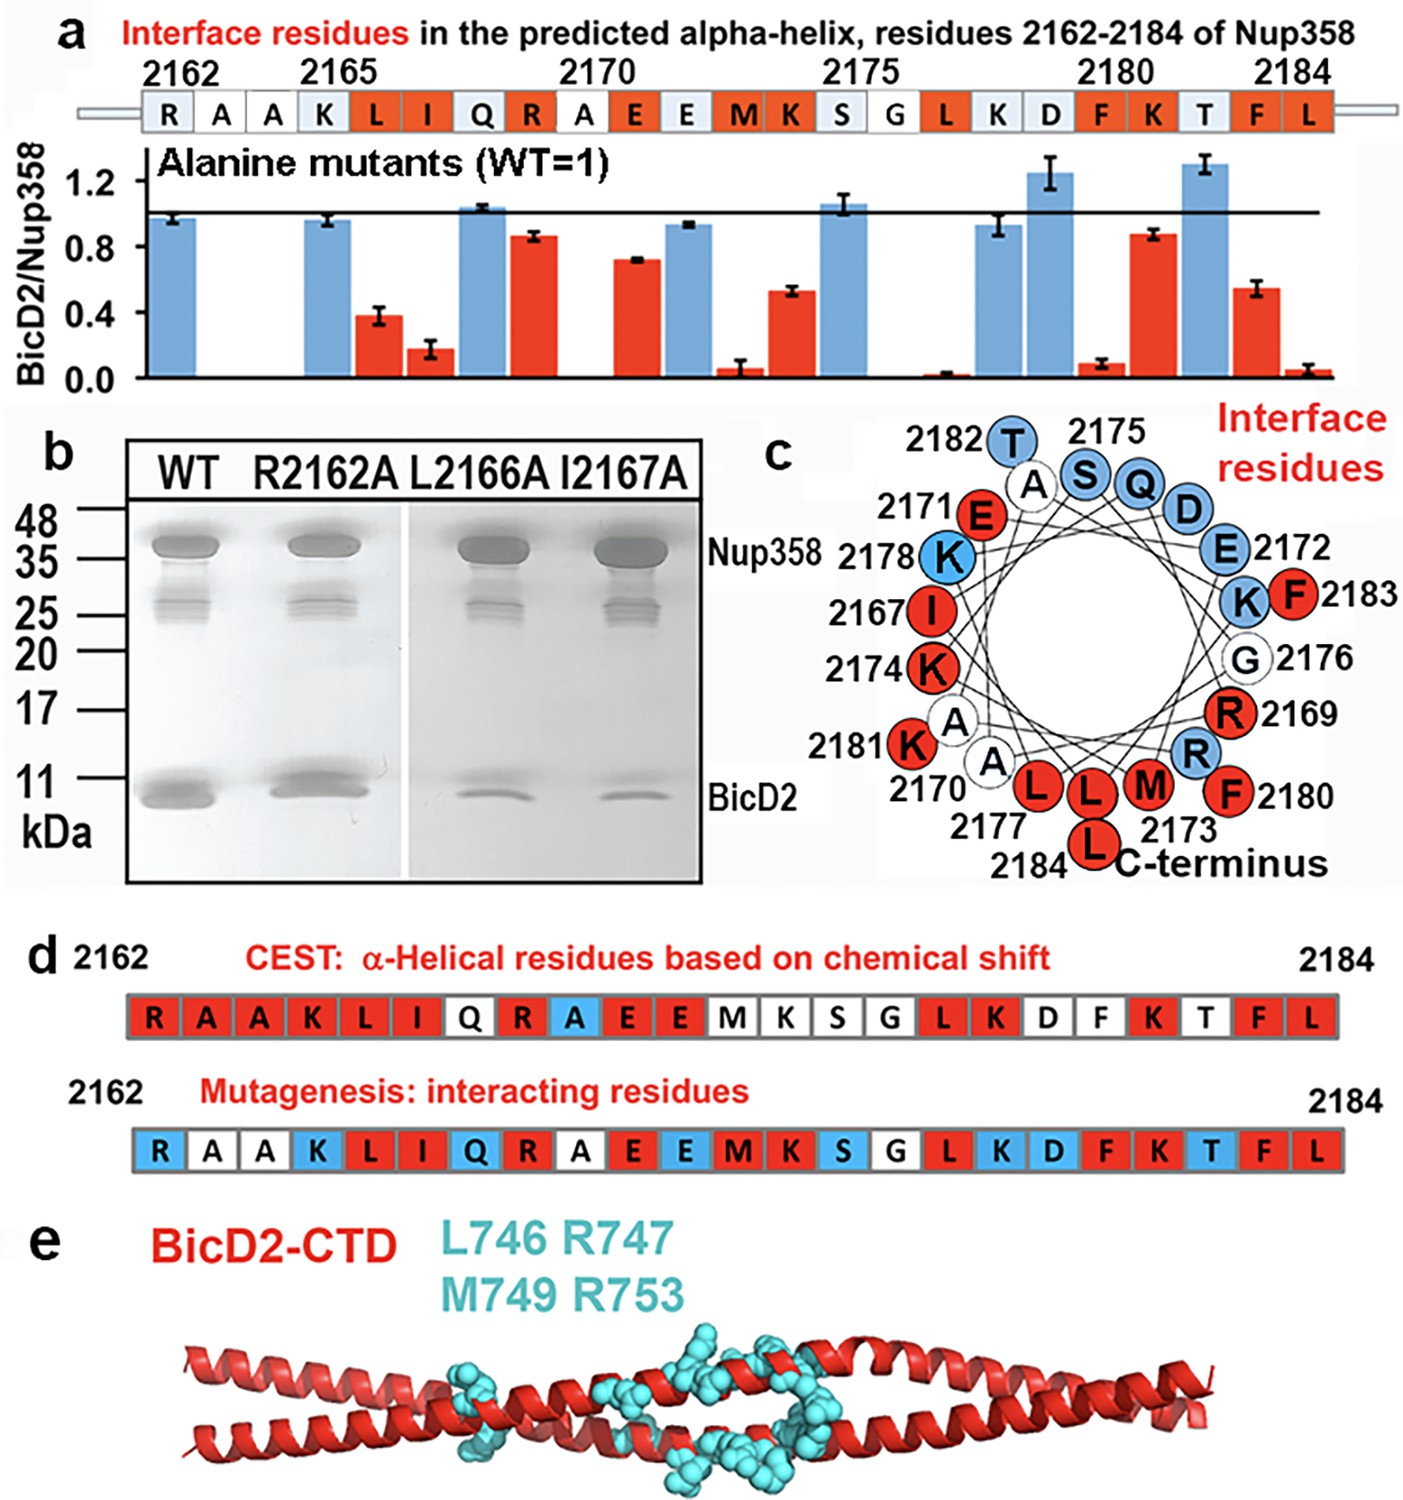
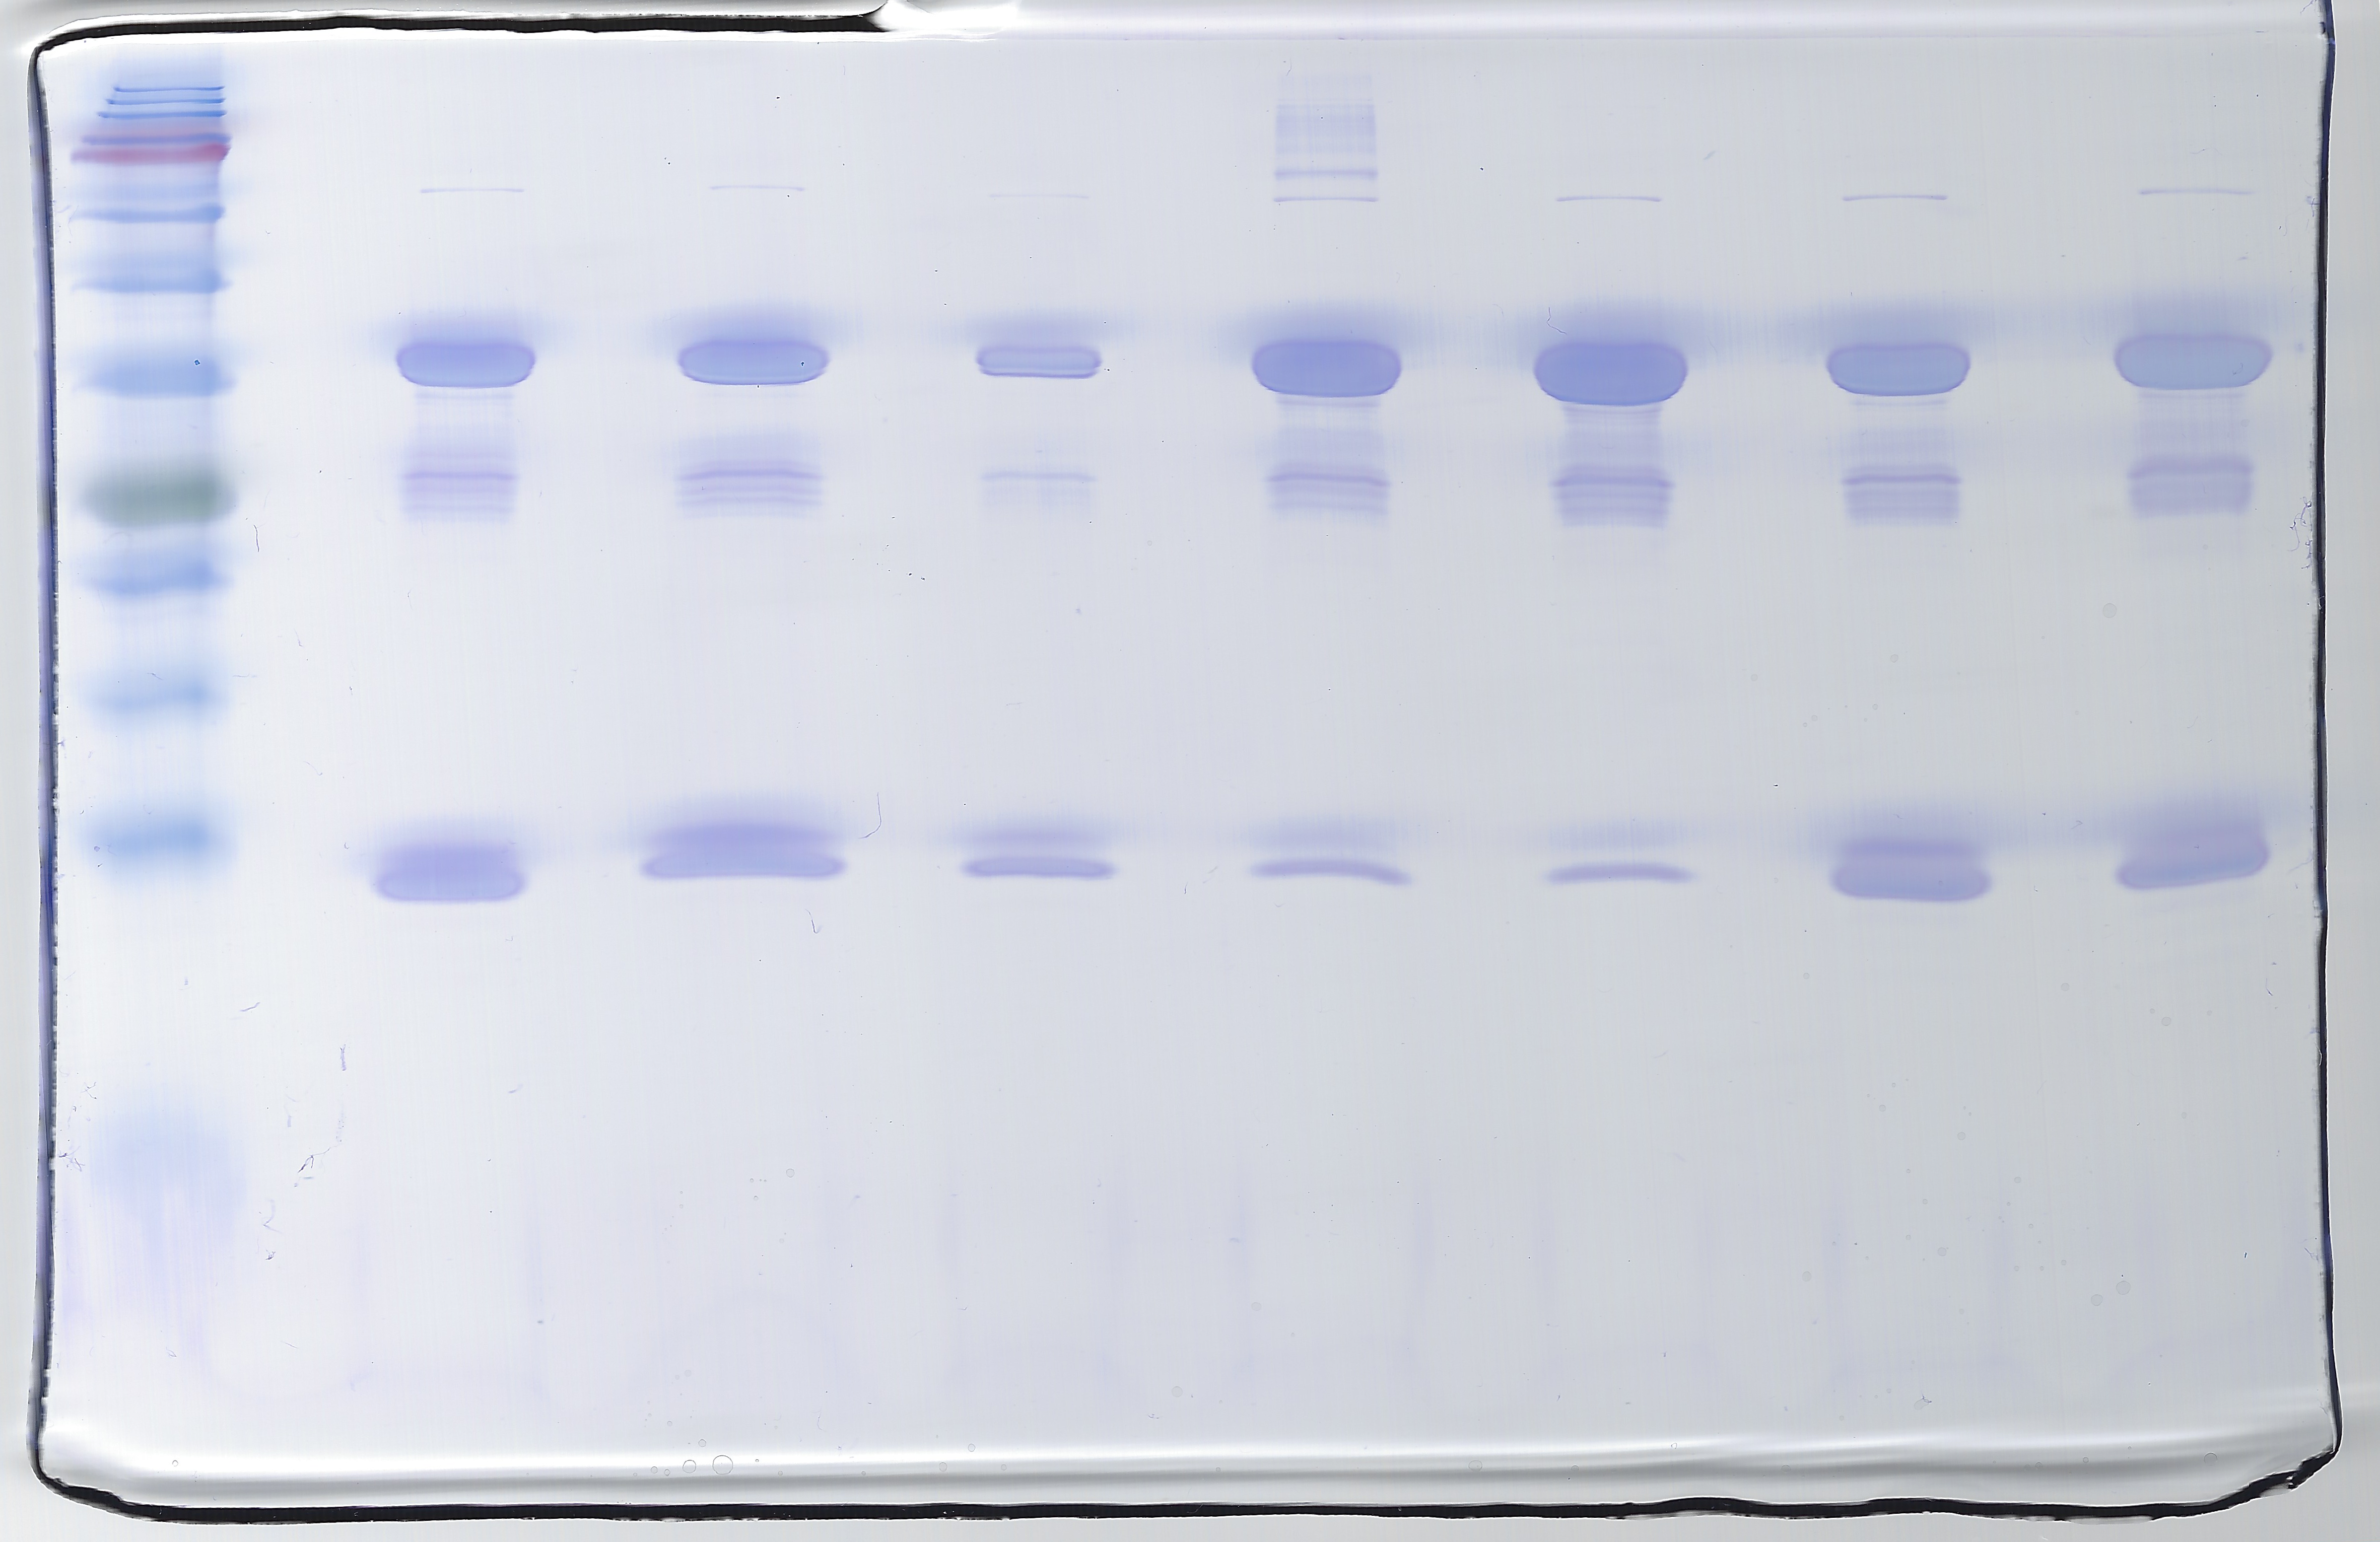
Mutagenesis of the Nup358 cargo recognition helix.
All residues of the Nup358 α-helix were mutated to alanine, and binding was assessed by GST-pull-down assays with purified Nup358-min-GST followed and BicD2-CTD. The elution fractions were analyzed by SDS-PAGE, and the intensities of the gel bands were quantified to obtain the ratio of bound BicD2-CTD/Nup358-min, normalized respective to the wild-type (Figure 7—figure supplement 1). The binding ratio was averaged from three independent experiments, and the error was calculated as the standard deviation. Eleven interface residues were identified, which are colored red and show a reduction of the binding ratio upon mutation by at least three times the standard deviation. In addition, interface residues were required to have a binding ratio that was reduced by 13% or more compared to the wild-type. Alanine and glycine residues were not assessed and are colored white. Residues for which mutations do not affect binding are colored light blue. (a) The sequence of the predicted Nup358 α–helix is shown above a bar graph of the ratios of bound BicD2 to Nup358 from the alanine mutant pull-down assays (WT = 1, indicated by the horizontal black line). (b) Representative SDS-PAGEs of elution fractions of the pull-down assays. A representative full dataset is shown in Figure 7—figure supplement 1. Note that a small gel band at 25 kDa represents GST. (c) Helical wheel representation for (a). (d) Comparison of helical residues in Nup358-BicD2 complex identified by chemical exchange saturation transfer (CEST) and results from pull-down assay of mutants. Red: CEST-positive (double dip in CEST profile) or strong reduction in binding from the pull-down assay with alanine mutation at this residue; blue: CEST-negative (single dip in CEST profile) or no effect in mutagenesis; white: data not available. (e) The structure of the Hs BicD2-CTD (Noell et al., 2019) is shown in red cartoon representation. Four Nup358/BicD2 interface residues that were previously identified by mutagenesis are shown in cyan spheres representation (Terawaki et al., 2015). See also Figure 7—figure supplement 1 and Figure 7—source data 1–3.
-
Figure 7—source data 1
Quantification of the pull-down assay.
- https://cdn.elifesciences.org/articles/74714/elife-74714-fig7-data1-v3.xlsx
-
Figure 7—source data 2
SDS-PAGE shown in Figure 7.
- https://cdn.elifesciences.org/articles/74714/elife-74714-fig7-data2-v3.png
-
Figure 7—source data 3
SDS-PAGEs shown in Figure 7—figure supplement 1 and SDS-PAGEs that were used for the quantification shown in Figure 7.
- https://cdn.elifesciences.org/articles/74714/elife-74714-fig7-data3-v3.zip
Figure 7—figure supplement 1
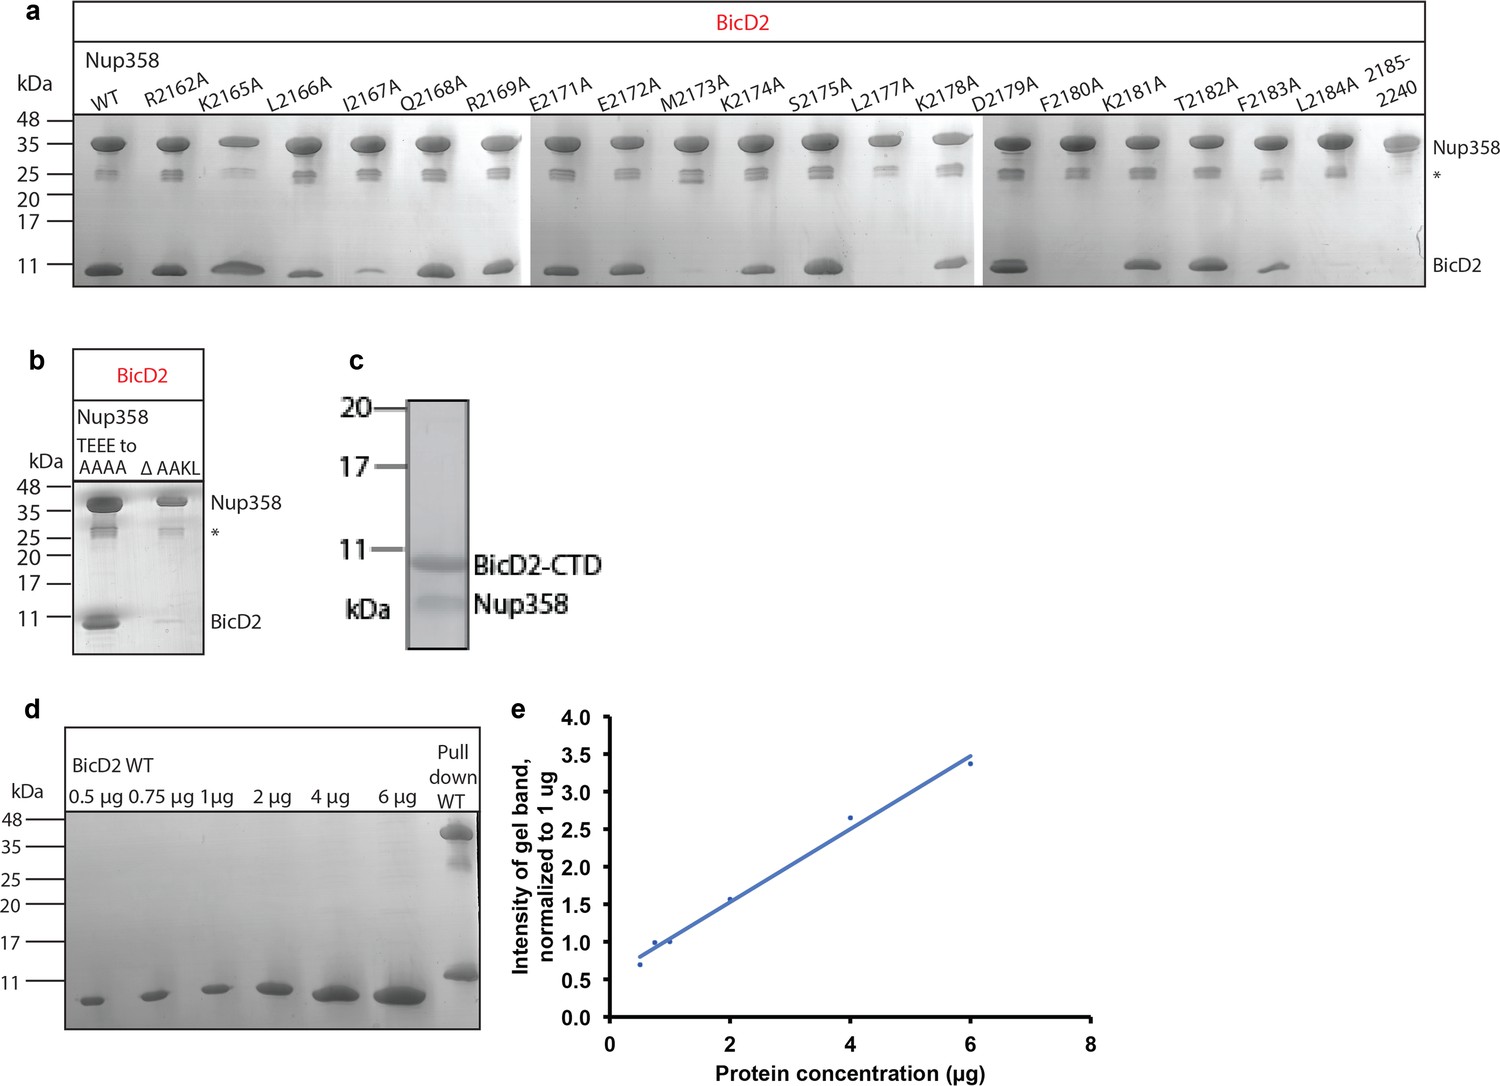
Interface residues of BicD2 and Nup358 were identified by mutagenesis.
SDS-PAGE analyses of elution fractions of the pull-down assays (see Figure 7) to probe the effect of Nup358 mutants on the interaction with BicD2. The molecular weights and band position of standard proteins are indicated on the left. (a) A representative result is shown for all mutants that were quantified. Experiments were repeated three times. Note that a small gel band at 25 kDa represents GST. (b) Pull-down of BicD2-CTD and mutants of Nup358-min. Left panel: the linear sequence motif TEEE, which is located outside of the cargo recognition helix, was mutated to AAAA, to exclude the possibility that it engages in the interaction. Right panel: the sequence motif AAKL was removed to assess the role of the two alanines for the interaction. All four residues showed large structural changes in CEST. (c) SDS-PAGE analysis of the purified Nup358 (residues 2158–2199)/BicD2-CTD complex. The individually purified proteins were mixed, and the complex was isolated by gel filtration chromatography. (d) SDS-PAGE analyses of purified BicD2-CTD at known protein concentrations. (e) The signals of the protein bands from (c) were quantified, and the intensities of the gel bands were normalized to the 1 mg gel band. The normalized intensities are plotted versus the protein concentration. Note that the curve is linear.
-
Figure 7—figure supplement 1—source data 1
BicD2-CTD calibration curve for quantification.
- https://cdn.elifesciences.org/articles/74714/elife-74714-fig7-figsupp1-data1-v3.xlsx
Figure 8 with 1 supplement
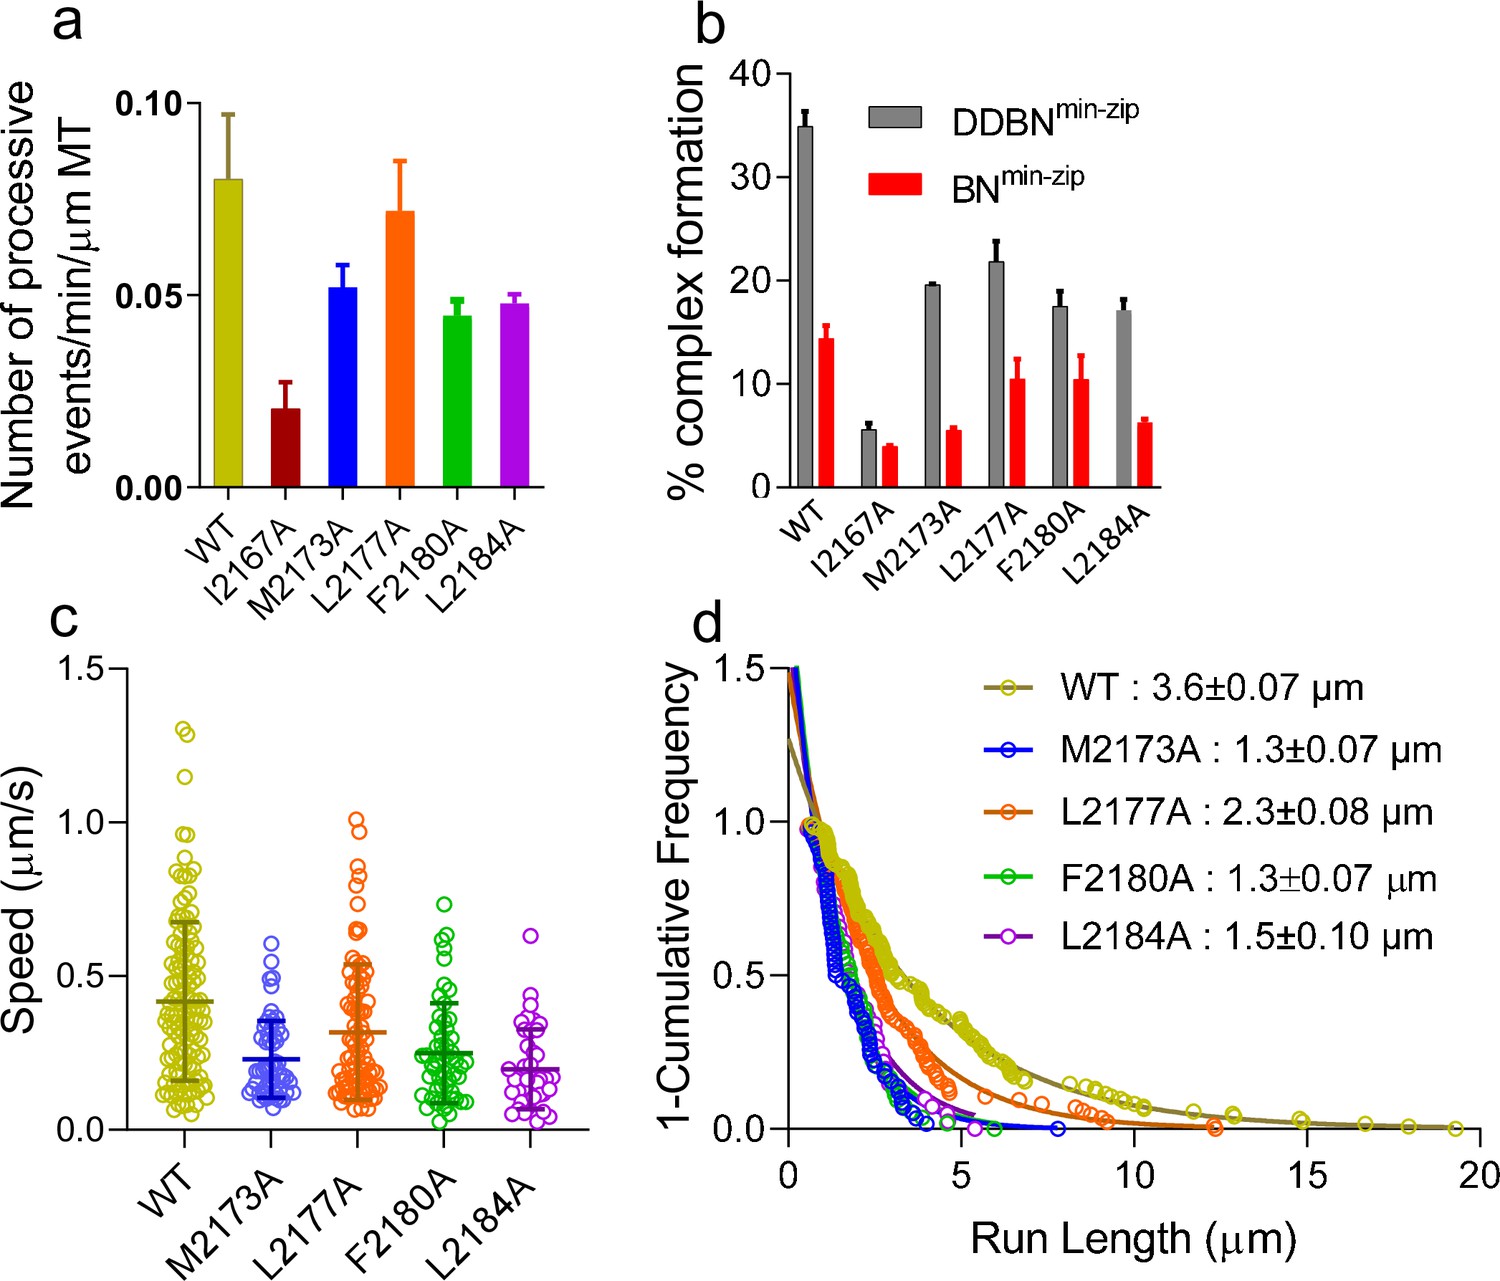
Nup358 point mutations that diminish the interaction with BicD2-CTD also diminish the formation of the DDBN complex.
(a) Bar graph of the processive events of DDBNmin-zip complexes per min per micrometer MT length. The number of processive events of DDBNmin-zip complexes formed with WT-Nup358min-zip is significantly higher (p<0.0001) than those formed with the Nup358min-zip mutants I2167A, M2173A, F2180A, and L2184A but the same as with mutant L2177A (orange, p=0.09). The number of processive events of DDBNmin-zip formed with WT-Nup358min-zip was 0.080 ± 0.0017/min/µm MT (n = 3, with n being the number of experiments). In contrast, these values for DDBNmin-zip formed with the Nup358min-zip mutants I2167A, M2173A, L2177A, F2180A, and L2184A were 0.020 ± 0.007/min/µm (n = 2), 0.052 ± 0.006/min/µm (n = 2), 0.072 ± 0.013min/µm (n = 3), 0.044 ± 0.005/min/µm (n = 2), 0.048 ± 0.0023/min/µm (n = 2) respectively. (b) The presence of dynein-dynactin (gray) increases the formation of BicD2-Nup358min-zip complexes (red). The percent formation of BNmin-zip was 14.41% (n = 580) for WT, 3.96% (n = 1142) for I2167A, 5.54% (n = 1877) for M2173A, 10.49% (n = 948) for L2177A, 10.47% (n = 412) for F2180A, and 6.31% (n = 1032) for L2184A Nup358min-zip. N is the total number of quantum dots (Qdots) counted. In contrast, these values for DDBNmin-zip complexes were 34.92% (n = 945), 5.62% (n = 986), 19.61% (n = 347), 21.87% (n = 778), 17.52% (n = 890), and 17.13% (n = 372), respectively. (c) Comparison of the speeds of DDBN complexes formed with WT-Nup358min-zip and mutant Nup358min-zip constructs. The speed of DDBN formed with Nup358min-zip mutants M2173A (0.23 ± 0.13 µm/s, n = 58; blue), L2177A (0.32 ± 0.22 µm/s; n = 86; orange), F2180A (0.25 ± 0.16 µm/s, n = 54; green), and L2184A (0.20 ± 0.13 µm/s, n = 41; purple) are significantly slower than that of DDBN-WT (p<0.0001 for mutants M2173A, F2180A, L2184A and p=0.0058 for L2177A), one-way ANOVA followed by Tukey’s test. (d). The run length of DDBNmin-zip formed with Nup358min-zip-M2173A (1.3 ± 0.07 µm, n = 58), L2177A (2.3 ± 0.08 µm, n = 86), F2180A (1.3 ± 0.07 µm, n = 54), and L2184A (1.5 ± 0.10 µm, n = 41) are significantly shorter than that formed with WT-Nup358min-zip (3.6 ± 0.07 µm; n = 123; data taken from 2 hr) (with p<0.0001 for mutants M2173A, F2180A, L2184A and p=0.0036 for L2177A; one-way ANOVA followed by Tukey’s test). See also Figure 8—figure supplement 1.
-
Figure 8—source data 1
The number of processive events of DDBNmin-zip complexes formed with WT-NUP358min-zip compared with DDBNmin-zip formed with NUP 358min-zip mutants I2167A, M2173A, F2180A, and L2184A.
- https://cdn.elifesciences.org/articles/74714/elife-74714-fig8-data1-v3.xlsx
-
Figure 8—source data 2
The presence of dynein-dynactin increases the formation of BicD2-NUP358min-zip complexes.
- https://cdn.elifesciences.org/articles/74714/elife-74714-fig8-data2-v3.xlsx
-
Figure 8—source data 3
Comparison of the speeds of DDBN complexes formed with WT-NUP358min-zip and mutant NUP358min-zip constructs.
- https://cdn.elifesciences.org/articles/74714/elife-74714-fig8-data3-v3.xlsx
-
Figure 8—source data 4
Comparison of the run lengths of DDBN complexes formed with WT-NUP358min-zip and mutant NUP358min-zip.
- https://cdn.elifesciences.org/articles/74714/elife-74714-fig8-data4-v3.xlsx
Figure 8—figure supplement 1
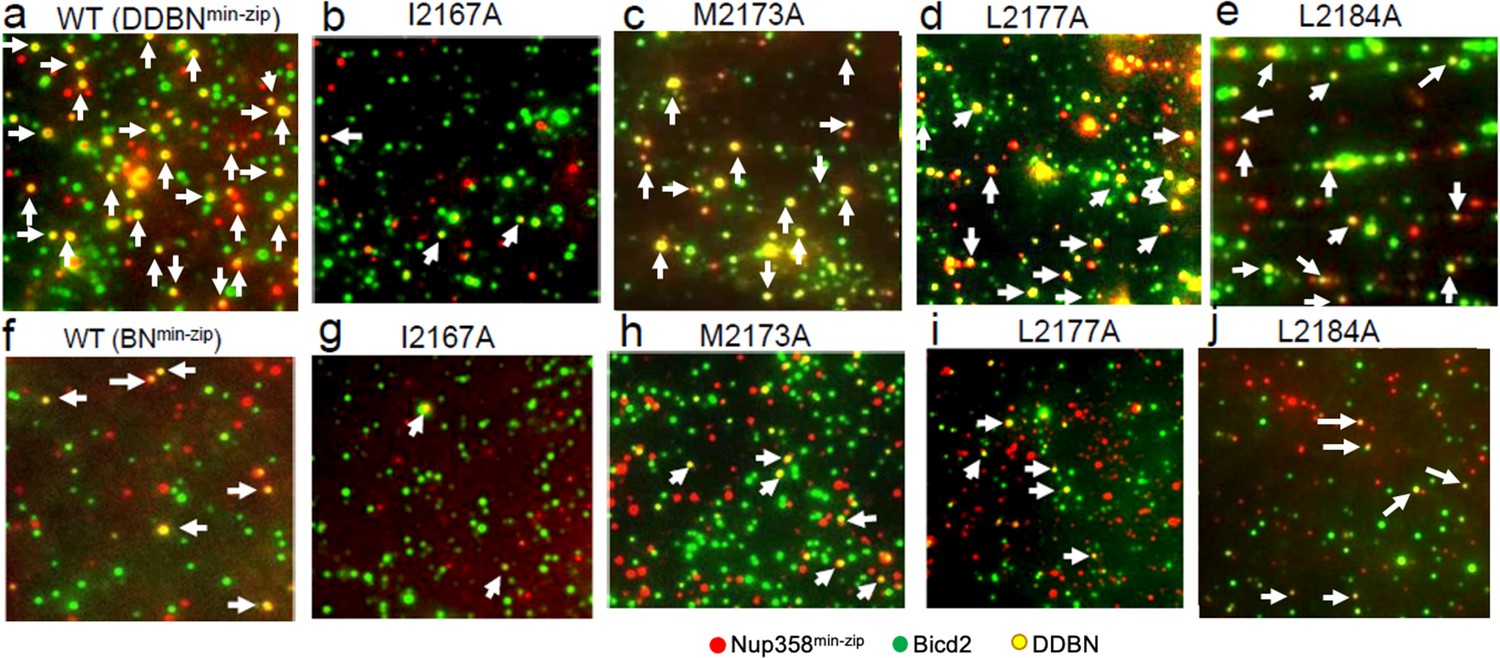
Nup358 point mutations that diminish the interaction with BicD2-CTD also diminish the formation of the DDBNmin-zip complex.
(a–e) Visualization of complex formation of DDBNmin-zip, formed with WT Nup358min-zip and Nup358min-zip mutants I2167A, M2173A, L2177A, and L2184. DDBNmin-zip formed with mutant F2180A is not shown because of its similarity to L2184. Yellow dots (some indicated by arrows) indicate the formation of the DDBNmin-zip complex, but single-color (green or red) quantum dots (Qdots) show individual uncomplexed BicD2 and Nup358min-zip molecules, respectively. (f–j). Visualization of complex formation of BNmin-zip formed with WT Nup358min-zip and Nup358min-zip mutants I2167A, M2173A, L2177A, and L2184.
Figure 9
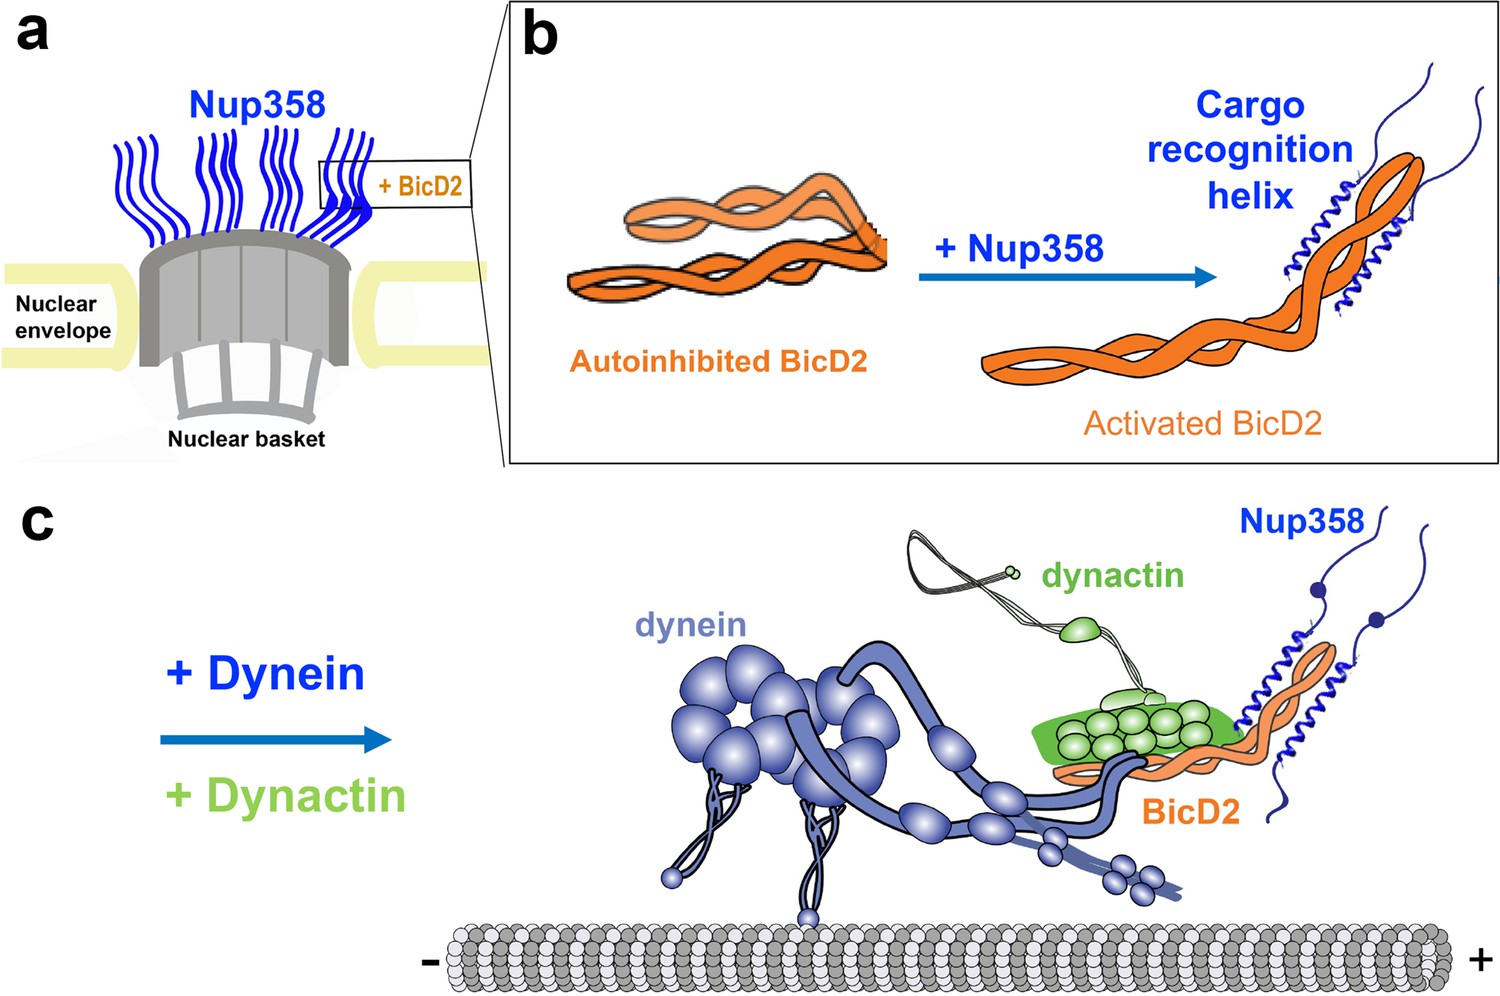
We propose that BicD2 recognizes its cargo through a short ‘cargo recognition α-helix,’ which may also be a structural feature that stabilizes the activated state of BicD2 for the recruitment of dynein and dynactin.
(a) Cutaway view of half of an NPC. Each of the eight spokes of the NPC contains four molecules of Nup358 on the cytoplasmic side (i.e., 32 in total), which provide binding sites for dynein (via BicD2) and kinesin-1 (via KLC2). Nup358 makes up most of the mass of the cytoplasmic filaments of the NPC (von Appen et al., 2015; Ori et al., 2013). (b) Left panel: schematic representation of the looped, autoinhibited conformation of BicD2 that is formed in the absence of cargoes such as Nup358. Apo-Nup358 contains many intrinsically disordered regions (IDR), including the BicD2-binding region. Upon binding of Nup358 to BicD2, a short α-helix is formed at the Nup358/BicD2 interface, which is a structural feature that stabilizes BicD2 in the active state. Binding of Nup358 to BicD2 likely promotes loop opening, which activates BicD2 for dynein/dynactin recruitment (Sladewski et al., 2018). (c) Schematic representation of the proposed dynein/dynactin/BicD2/Nup358 complex (DDBN) bound to microtubules for processive motility for nuclear positioning. Nup358 has a LEWD motif that recruits kinesin-1 via KLC2. The binding sites for the opposite polarity motor kinesin-1 on Nup358 are indicated by the small blue sphere. The location of the LEWD motif that recruits kinesin-1 via KLC2 is indicated. We propose that BicD2 and KLC2 interact simultaneously with Nup358 for precise control of nuclear positioning.
Tables
Table 1
Chemical shift differences from chemical exchange saturation transfer (CEST) of Nup358/BicD2 and apo-Nup358 (Δδbound-apo) match closely to Δδ for coil-to-α-helix transition (Δδhelix-coil)‡.
| Residue | Δδbound-apo | Δδhelix-coil |
|---|---|---|
| A2163* | –3.6 | –2.2 |
| A2164* | –3.6 | –2.2 |
| K2165* | –0.8 | –1.3 |
| L2166* | –3.8 | –1.9 |
| I2167* | –5.7 | –1.2 |
| K2178* | –3.6 | –1.3 |
| L2184* | –5.5 | –1.9 |
| R2162† | 1.7 | 2.3 |
| A2164† | 2.8 | 1.7 |
| K2165† | 2.7 | 2.1 |
| L2166† | 2.6 | 1.6 |
| R2169† | 2.9 | 2.3 |
| E2171† | 2.2 | 2.2 |
| E2172† | 3.0 | 2.2 |
| L2177† | 0.9 | 1.6 |
| K2181† | 3.0 | 2.1 |
| F2183† | 3.3 | 1.5 |
| L2184† | 1.0 | 1.6 |
-
See also Appendix 1—table 1.
-
CD spectroscopy confirms formation of an α-helix in Nup358 upon binding to BicD2.
-
*
Change in chemical shifts of amide 15N.
-
†
Change in chemical shifts of carbonyl 13C.
-
‡
Values taken from Wishart, 2011.
Key resources table
| Reagent type (species) or resource | Designation | Source or reference | Identifiers | Additional information |
|---|---|---|---|---|
| Strain, strain background (Escherichia coli) | Rosetta 2(DE3)-pLysS | Fisher Scientific | Cat# 714033 | |
| Strain, strain background (E. coli) | BL21-DE3-CodonPlus-RIL | Fisher scientific | Cat#50-125-350 | |
| Recombinant DNA reagent | Human BicD2-CTD pet28a | GenScript Reference Noell et al., 2019 doi:10.1021/acs.jpclett.9b01865 | Sequence encoding residues 715–804 of human BicD2 cloned into a pet28a vector via the NdeI and XhoI restriction sites | For the protein sequence expressed from this vector, see ‘Supplementary methods’ |
| Recombinant DNA reagent | Human Nup358-min pGEX-6P-1 | GenScript Reference Noell et al., 2019doi:10.1021/acs.jpclett.9b01865 | Sequence encoding residues 2148–2240 of human Nup358 cloned into a pGEX-6P-1 vector via the BamHI and XhoI restriction sites | For the protein sequence expressed from this vector, see ‘Supplementary methods’ |
| Recombinant DNA reagent | Nup358-min-pGEX-6P-1 | GenScriptThis paper | Modified Nup358-min pGEX-6P-1 vector that includes a SNAP-tag at its C-terminal domain | For the protein sequence expressed from this vector, see ‘Supplementary methods’This vector can be obtained from Dr. Solmaz’s lab |
| Recombinant DNA reagent | Nup358-min-zip pGEX-6P-1 | GenScriptThis paper | Modified Nup358-min-pGEX-6P-1 vector that includes a leucine zipper that was added at the C-terminus before the snap-tag | For the protein sequence expressed from this vector, see ‘Supplementary methods’This vector can be obtained from Dr. Solmaz’s lab |
| Recombinant DNA reagent | Human Nup358 (residues 2158–2199) pGEX-6P-1 | GenScriptThis paper | Sequence encoding residues 2158–2199 of human Nup358 cloned into a pGEX-6P-1 vector via the BamHI and XhoI restriction sites | Protein overexpression plasmid, which can be obtained from Dr. Solmaz’s lab |
| Peptide, recombinant protein | PreScission protease | Cytiva | Cat# 27084301 | |
| Peptide, Recombinant protein | Thrombin, human plasma | Fisher Scientific | Cat# 6051951000U | |
| Chemical compound, drug | 13C D-Glucose (U-13C6) | Cambridge Isotope Laboratories | Cat# CLM-1396-PK | |
| Chemical compound, drug | 15NH4Cl | Cambridge Isotope Laboratories | Cat# NLM-467-10 | |
| Chemical compound, drug | cOmplete EDTA-free Protease Inhibitor Cocktail tablets | Roche | Cat# 45-5056489001-EA | |
| Software, algorithm | Origin Student 2018 | OriginLab | CD spectroscopy | |
| Software, algorithm | Origin GE Microcal ITC200 | OriginLab | ITC | |
| Software, algorithm | BioXTAS RAW software suite (version 2.0.3). | Reference Hopkins et al., 2017 | ||
| Software, algorithm | ImageJ 1.52v | Reference Schneider et al., 2012 | ||
| Software, algorithm | UCSF Chimera (version 1.14) | Resource for Biocomputing, Visualization, and Informatics at the University of California, San FranciscoReference Pettersen et al., 2004 | ||
| Chemical compound, drug | Coomassie brilliant blue R-250 | VWR | Cat# VWRV0472-25G | |
| Chemical compound, drug | RNase Inhibitor | Promega | N261B | |
| Chemical compound, drug | Q-dot 525 streptavidin conjugate | Invitrogen | Q10141MP | |
| Chemical compound, drug | Q-dot 565 streptavidin conjugate | Invitrogen | Q10131MP | |
| Chemical compound, drug | Q-dot 655 streptavidin conjugate | Invitrogen | Q10121MP | |
| Chemical compound, drug | SNAP-Biotin | New England BioLabs | S9110S | |
| Chemical compound, drug | Tubulin protein (X-rhodamine): bovine brain | Cytoskeleton, Inc | TL620M-A | |
| Chemical compound, drug | Paclitaxel | Cytoskeleton, Inc | TXD01 | |
| Recombinant DNA reagent | Bicaudal D homolog 2 isoform 2 (Homo sapiens) | This paper | NCBI:NP_056065.1 | Protein overexpression plasmid, which can be obtained from Dr. Solmaz’s lab |
| Biological sample (Bos taurus) | Dynein-dynactin | Bovine brain | ||
| Biological sample(B. taurus) | Tubulin | Bovine brain | ||
| Software, algorithm | Nikon ECLIPSE Ti microscope | Nikon | ||
| Software, algorithm | Nikon NIS Elements | Nikon | ||
| Software, algorithm | Andor EMCCD Camera | Andor Technology USA | ||
| Software, algorithm | Prism | GraphPad | v7; RRID:SCR_002798 | |
| Chemical compound, drug | 2-[Methoxy(polyethyleneoxy)propyl]trimethoxysilane | J&K Scientific | 967192 | |
| Chemical compound, drug | n-Butylamine | Acros Organics | A0344582 | |
| Software, algorithm | ImageJ Fiji | NIH | 1.53c | |
| Software, algorithm | NMRPipe | NIH, reference Delaglio et al., 1995 | ||
| Software, algorithm | NMRFAM_SPARKY | Reference Lee et al., 2015 |
Appendix 1—table 1
Summary of the 15N CEST Curve Fits.
| (a) Summary of 15N CEST curve fits at 20:1 molar ratio of BicD2:15N-Nup358 | |||
| Residue | kex (s–1) | Pb | Δδ (ppm) |
| A2164 | 704 ± 211 | 0.07 ± 0.02 | –4.3 ± 0.4 |
| K2165 | 139 ± 162 | 0.25 ± 0.08 | –0.8 ± 0.3 |
| L2166 | 381 ± 182 | 0.07 ± 0.03 | –3.8 ± 0.3 |
| I2167 | 975 ± 624 | 0.02 ± 0.04 | –5.7 ± 0.2 |
| K2178 | 31 ± 35 | 0.01 ± 0.01 | –3.6 ± 0.2 |
| L2184 | 160 ± 92 | 0.07 ± 0.03 | –5.5 ± 0.2 |
| (b) Summary of 15N CEST curve fits at 10:1 molar ratio of BicD2:15N-Nup358 | |||
| Residue | kex (s–1) | Pb | Δδ (ppm) |
| A2163 | 12 ± 73 | 0.07 ± 0.05 | –3.6 ± 0.2 |
| A2164 | 228 ± 72 | 0.09 ± 0.02 | –3.6 ± 0.2 |
| K2165 | 757 ± 273 | 0.13 ± 0.07 | –3.6 ± 0.2 |
| L2166 | 297 ± 195 | 0.05 ± 0.02 | –3.6 ± 0.2 |
-
The change in chemical shift in Table 1 was taken from Table S1b for the alanine residues due to a clearer minor peak. For the others, the change in chemical shift in Table 1 was taken from Table S1a. The values used in the weighted averages for kex and Pb were taken from Table S1a, excluding the K2165 and K2178 with abnormal Pb and significant noise in their CEST curves. Including the K2165 and K2178 values, the weighted average kex value would be 80 ± 30 s–1, and the Pb value would be 0.03 ± 0.01.
-
CEST: chemical exchange saturation transfer.
Appendix 1—table 2
Summary of 13C′ CEST curve fits at 20:1 molar ratio of [BicD2]:[Nup358].
| Residue | kex (s–1) | Pb | Δδ (ppm) | ||||||
|---|---|---|---|---|---|---|---|---|---|
| R2162 | 313 ± 328 | 0.05 ± 0.03 | 1.7 ± 0.3 | ||||||
| A2164 | 474 ± 304 | 0.07 ± 0.03 | 2.8 ± 0.2 | ||||||
| K2165 | 208 ± 179 | 0.05 ± 0.07 | 2.7 ± 0.1 | ||||||
| L2166 | 391 ± 170 | 0.04 ± 0.03 | 2.6 ± 0.2 | ||||||
| R2169 | 140 ± 125 | 0.06 ± 0.01 | 2.9 ± 0.2 | ||||||
| E2171 | 359 ± 175 | 0.07 ± 0.03 | 2.2 ± 0.2 | ||||||
| E2172 | 8 ± 98 | 0.22 ± 0.07 | 3.0 ± 0.1 | ||||||
| L2177 | 540 ± 241 | 0.03 ± 0.02 | 0.9 ± 0.3 | ||||||
| K2181 | 316 ± 155 | 0.06 ± 0.02 | 3.0 ± 0.1 | ||||||
| F2183 | 464 ± 98 | 0.06 ± 0.01 | 3.3 ± 0.3 | ||||||
| L2184 | 238 ± 165 | 0.08 ± 0.04 | 1.0 ± 0.2 | ||||||
Appendix 2—table 1
Summary of SAXS data.
| Sample | RG (Å)Guinier plot | RG (Å) p(r) function | I(0) p(r) function/I(0) Guinier plot | TE /χ2p(r) function | DMax p(r) function | MW*† ‡(kDa) |
|---|---|---|---|---|---|---|
| Nup358/BicD2 | 48.1 ± 0.6 | 55.5 ± 0.2 | 0.086/0.086 | 0.61/1.04 | 190 | 47.7/46.0/47.6 |
| Nup358-min | 28.4 ± 0.3 | 30.6 ± 0.4 | 0.035/0.036 | 0.69/1.05 | 120 | 12.7/12.3/na |
| BicD2-CTD | 42.6 ± 1.0 | 49.7 ± 0.9 | 0.066/0.070 | 0.67/1.10 | 190 | na/na/38.7 |
-
Note that not all methods can be applied to all samples (na). The error of molar masses determined by SAXS is 10%. The calculated MWs are 10.9 kDa for BicD2-CTD and 10.6 kDa for Nup358-min.
-
RG: radius of gyration; I(0): scattering intensity at zero angle; TE: total estimate; DMAX: maximum particle diameter; MW: molar mass; SAXS: small-angle X-ray scattering.
-
*
MWs were determined from I(0), using glucose isomerase as a standard (Konarev et al., 2003).
-
†
MWs were determined from I(0) without a molar mass standard (Konarev et al., 2003).
-
‡
MWs were determined from the volume of correlation as described by Rambo and Tainer, 2013.
Appendix 2—table 2
Statistics of SAXS bead model 3D reconstruction.
| Sample | Mean normalized spatial discrepancy score (NSD) | χ2 (refined model)/χ2 (representative model) | Resolution (Å) | Ambimeter score | |
|---|---|---|---|---|---|
| Nup358-min/BicD2-CTD | 0.70 ± 0.05 | 1.08/1.05 | 41 ± 3 | 1.23 | |
Author response table 1
| Binding ratio | Standard deviation | 3x Standard deviation | Interface residue? | |
|---|---|---|---|---|
| WT | 1.00 | n/a | n/a | n/a |
| 2169 | 0.86 | 0.03 | 0.09 | Yes |
| 2172 | 0.93 | 0.01 | 0.03 | No |
| 2181 | 0.87 | 0.03 | 0.09 | Yes |
Additional files
Download links
A two-part list of links to download the article, or parts of the article, in various formats.
Downloads (link to download the article as PDF)
Open citations (links to open the citations from this article in various online reference manager services)
Cite this article (links to download the citations from this article in formats compatible with various reference manager tools)
Coil-to-α-helix transition at the Nup358-BicD2 interface activates BicD2 for dynein recruitment
eLife 11:e74714.
https://doi.org/10.7554/eLife.74714


