Plexins promote Hedgehog signaling through their cytoplasmic GAP activity
- Department of Cell and Developmental Biology, University of Michigan, United States
- Department of Neurology, University of Michigan, United States
Figures
Figure 1 with 1 supplement
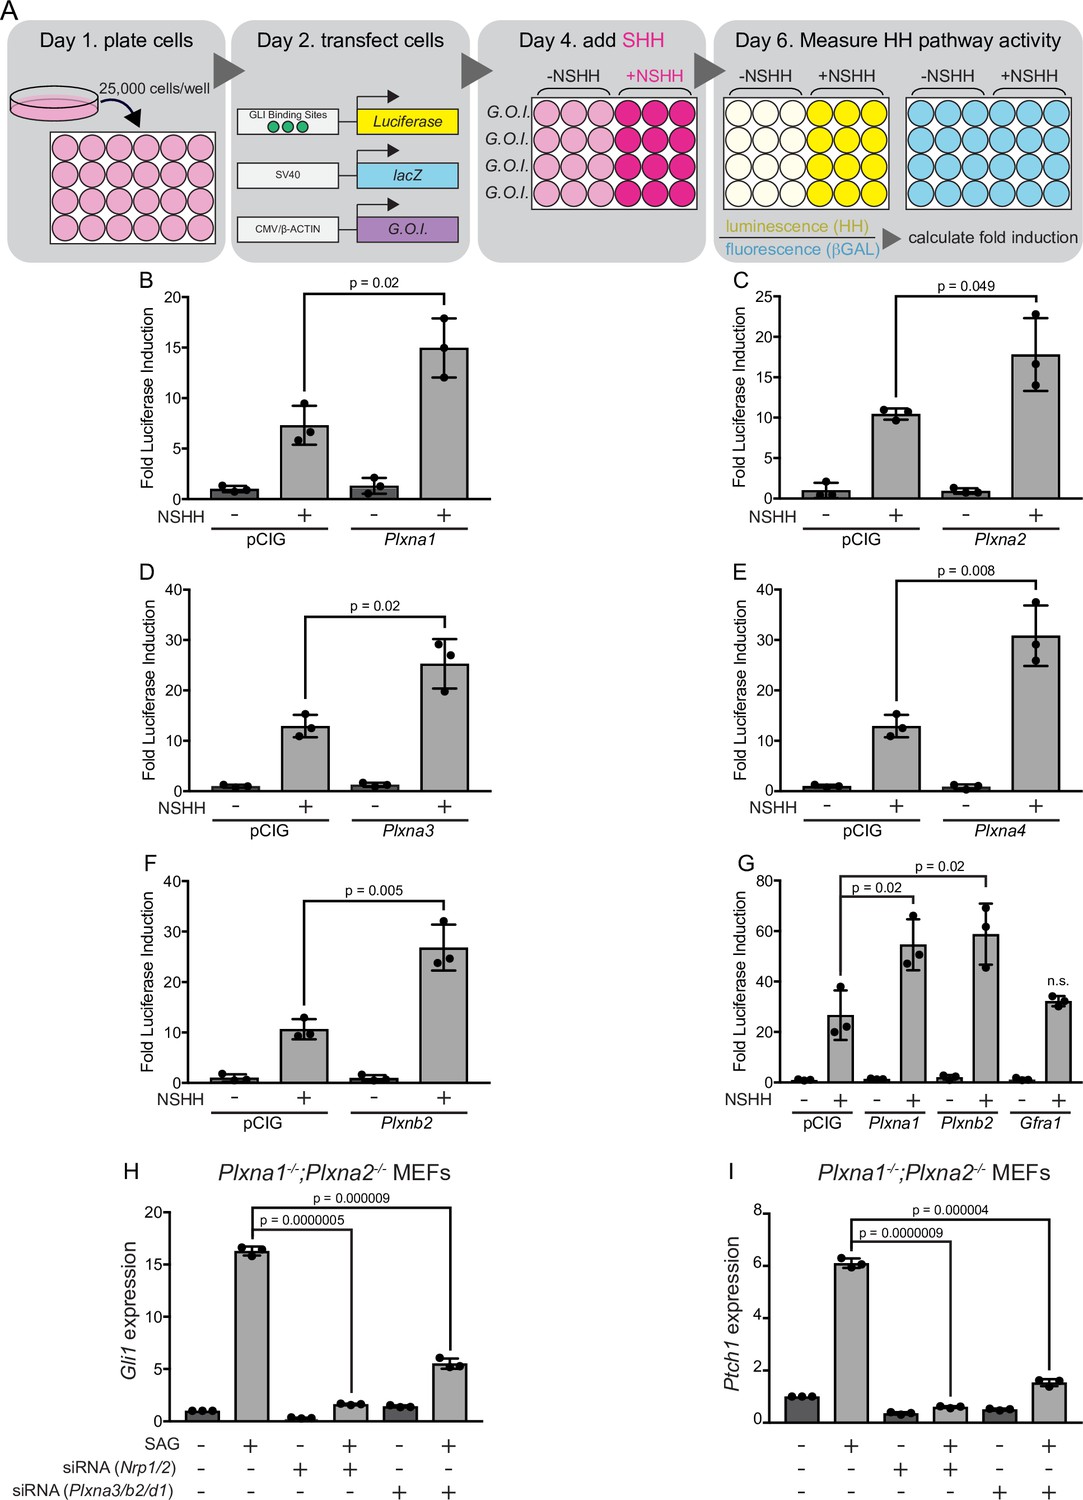
Multiple plexins (PLXNs) promote Hedgehog (HH) signaling.
(A) Schematic of HH-responsive NIH/3T3 luciferase assays. G.O.I., gene of interest. (B–F) HH-dependent luciferase reporter activity was measured in NIH/3T3 cells transfected with the indicated constructs or empty vector control (pCIG) and stimulated with control (-NSHH) or NSHH-conditioned media (+NSHH). (G) Direct analysis of PLXNA1- and PLXNB2-mediated HH pathway promotion, compared with the unrelated cell surface protein GFRα1. (H, I) qRT-PCR analysis of Gli1 and Ptch1 in response to HH pathway activation via the Smoothened agonist, SAG. Plxna1-/-;Plxna2-/- mouse embryonic fibroblasts (MEFs) were treated with siRNA oligos for either Nrp1 and Nrp2 or Plxna3, Plxnb2, and Plxnd1, as indicated. Data points indicate technical replicates. Fold changes were determined using the ΔΔCT method. Data are reported as mean fold induction ± SD, with p-values calculated using two-tailed Student’s t-tests. n.s., not significant.
-
Figure 1—source data 1
Raw data for Figure 1B–I.
- https://cdn.elifesciences.org/articles/74750/elife-74750-fig1-data1-v2.xlsx
Figure 1—figure supplement 1
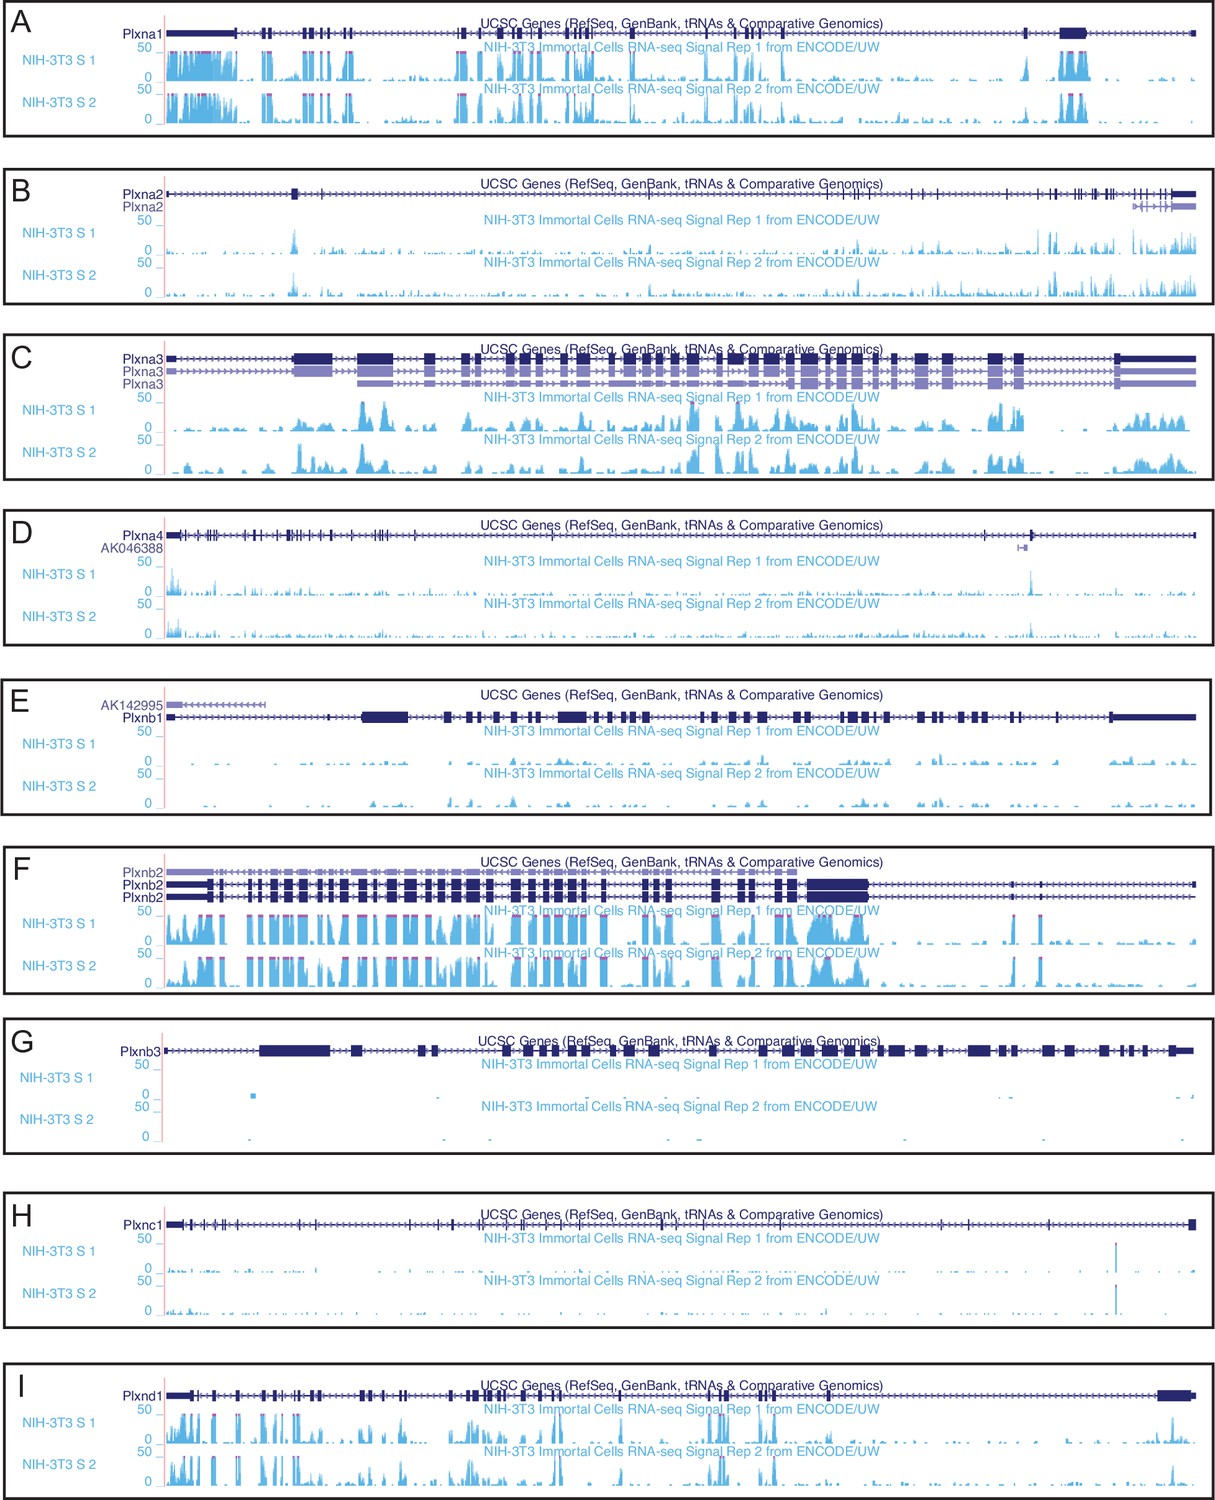
Plxn expression in NIH/3T3 fibroblasts.
(A-I) RNA sequencing data from the ENCODE project indicating Plxn expression in NIH/3T3 cells. Data were aligned to the mouse GRCm38/mm10 assembly using the UCSC Genome Browser (https://genome.ucsc.edu).
Figure 2

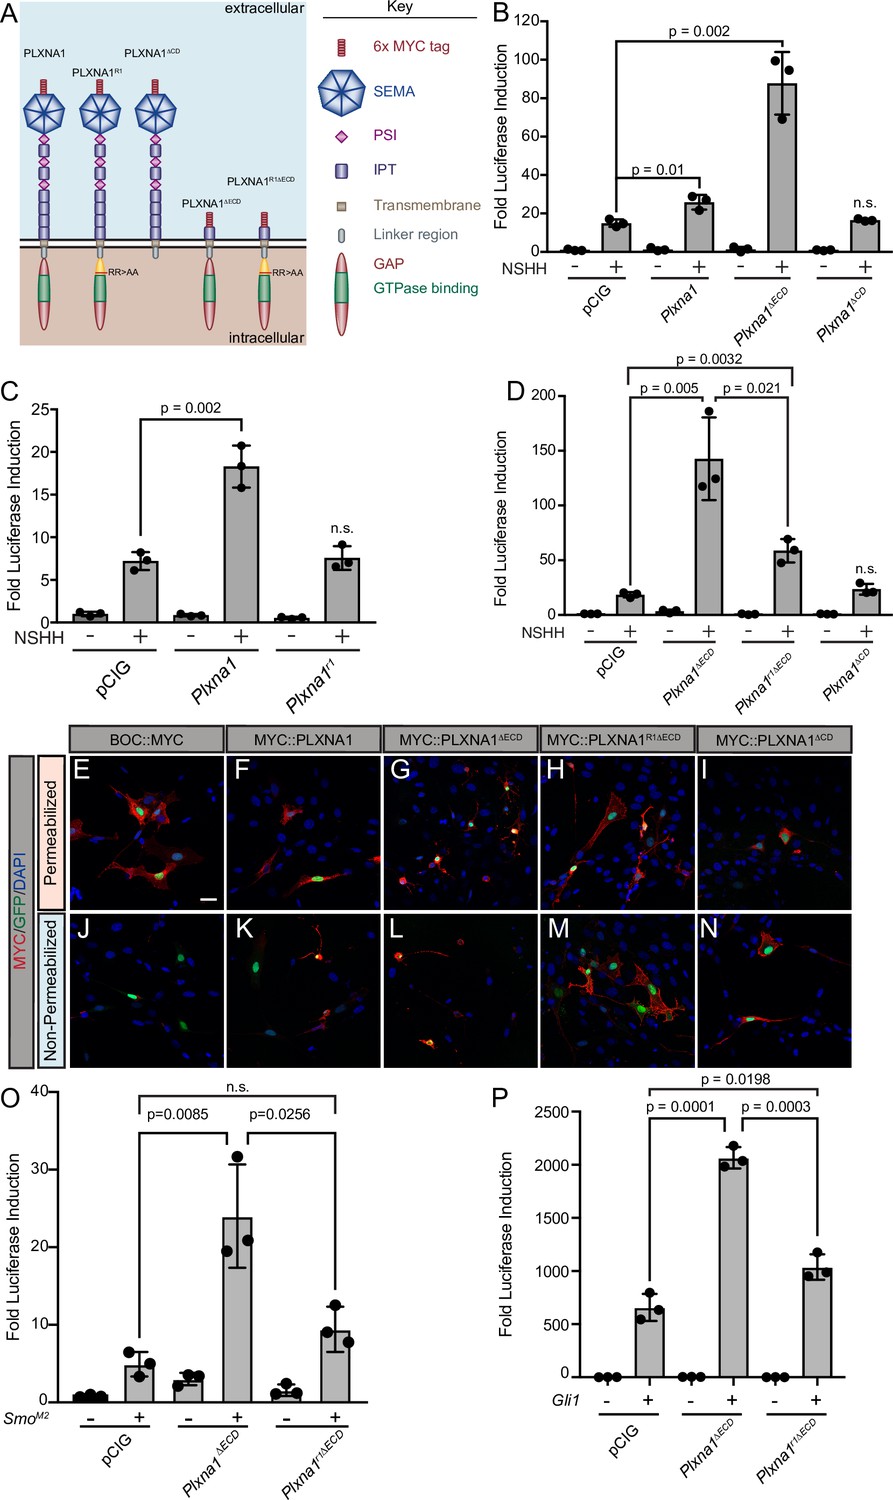
The PLXNA1 cytoplasmic and transmembrane domains are required for Hedgehog (HH) pathway promotion.
(A) Schematic of different PLXNA1 proteins. (B) HH-dependent luciferase reporter activity was measured in NIH/3T3 cells transfected with the indicated constructs and stimulated with control (-NSHH) or NSHH-conditioned media (+NSHH). Data are reported as mean fold induction ± SD, with p-values calculated using two-tailed Student’s t-tests. n.s., not significant. (C) Western blot analysis confirming expression of MYC-tagged PLXNA1 proteins in NIH/3T3 cells. Note that MYC::PLXNA1ΔTMCD is detected in the supernatant, consistent with its predicted secretion. Anti-beta-tubulin (α-β-Tub) was used as a loading control. (D–K) Antibody detection of MYC (red) in permeabilized (left panels) and non-permeabilized (right panels) NIH/3T3 cells to assess cell surface localization of the indicated MYC-tagged proteins. Note that BOC, which contains a C-terminal MYC tag, is only detected under permeabilized conditions, while PLXNA1ΔTMCD, which is secreted, is also largely undetected under non-permeabilized conditions. Nuclear GFP (green) indicates transfected cells, whereas DAPI (blue) stains all nuclei. Diagrams (right) describe each construct, with brackets indicating antibody-binding sites. Scale bar = 10 μm.
-
Figure 2—source data 1
Raw data for Figure 2B.
- https://cdn.elifesciences.org/articles/74750/elife-74750-fig2-data1-v2.xlsx
-
Figure 2—source data 2
Raw, unedited blot from Figure 2C.
- https://cdn.elifesciences.org/articles/74750/elife-74750-fig2-data2-v2.pdf
-
Figure 2—source data 3
Raw, unedited blot from Figure 2C.
- https://cdn.elifesciences.org/articles/74750/elife-74750-fig2-data3-v2.pdf
-
Figure 2—source data 4
Raw, unedited blot from Figure 2C.
- https://cdn.elifesciences.org/articles/74750/elife-74750-fig2-data4-v2.pdf
-
Figure 2—source data 5
Raw, labeled blot from Figure 2C.
- https://cdn.elifesciences.org/articles/74750/elife-74750-fig2-data5-v2.pdf
-
Figure 2—source data 6
Raw, labeled blot from Figure 2C.
- https://cdn.elifesciences.org/articles/74750/elife-74750-fig2-data6-v2.pdf
-
Figure 2—source data 7
Raw, labeled blot from Figure 2C.
- https://cdn.elifesciences.org/articles/74750/elife-74750-fig2-data7-v2.pdf
Figure 3 with 3 supplements
The plexin (PLXN) GTPase-activating protein (GAP) domain is required to promote Hedgehog (HH) signaling at the level of GLI transcription factors.
(A) Schematic of different PLXNA1 proteins. (B–D) HH-dependent luciferase reporter activity was measured in NIH/3T3 cells transfected with the indicated constructs and stimulated with control (-NSHH) or NSHH-conditioned media (+NSHH). Data are reported as mean fold induction ± SD, with p-values calculated using two-tailed Student’s t-tests. n.s., not significant. (E–N) Antibody detection of MYC-tagged proteins (red) in permeabilized (top panels) and non-permeabilized (bottom panels) NIH/3T3 cells to assess cell surface localization of the indicated constructs. Nuclear GFP (green) indicates transfected cells, whereas DAPI (blue) stains all nuclei. Note that constitutive PLXN GAP activity leads to cell collapse, as is observed with PLXNA1ΔECD and, to some extent, PLXNA1. For PLXNA1R1 localization, please see Figure 3—figure supplement 1D and E. Scale bar = 10 μm. (O, P) HH-dependent luciferase reporter activity was measured in NIH/3T3 cells transfected with the indicated constructs and stimulated by co-transfecting cells with pCIG, SmoM2 (O), or Gli1 (P). Data are reported as mean fold induction ± SD, with p-values calculated using two-tailed Student’s t-tests. n.s., not significant.
-
Figure 3—source data 1
Raw data for Figure 3B–D and Figure 3O and P.
- https://cdn.elifesciences.org/articles/74750/elife-74750-fig3-data1-v2.xlsx
Figure 3—figure supplement 1
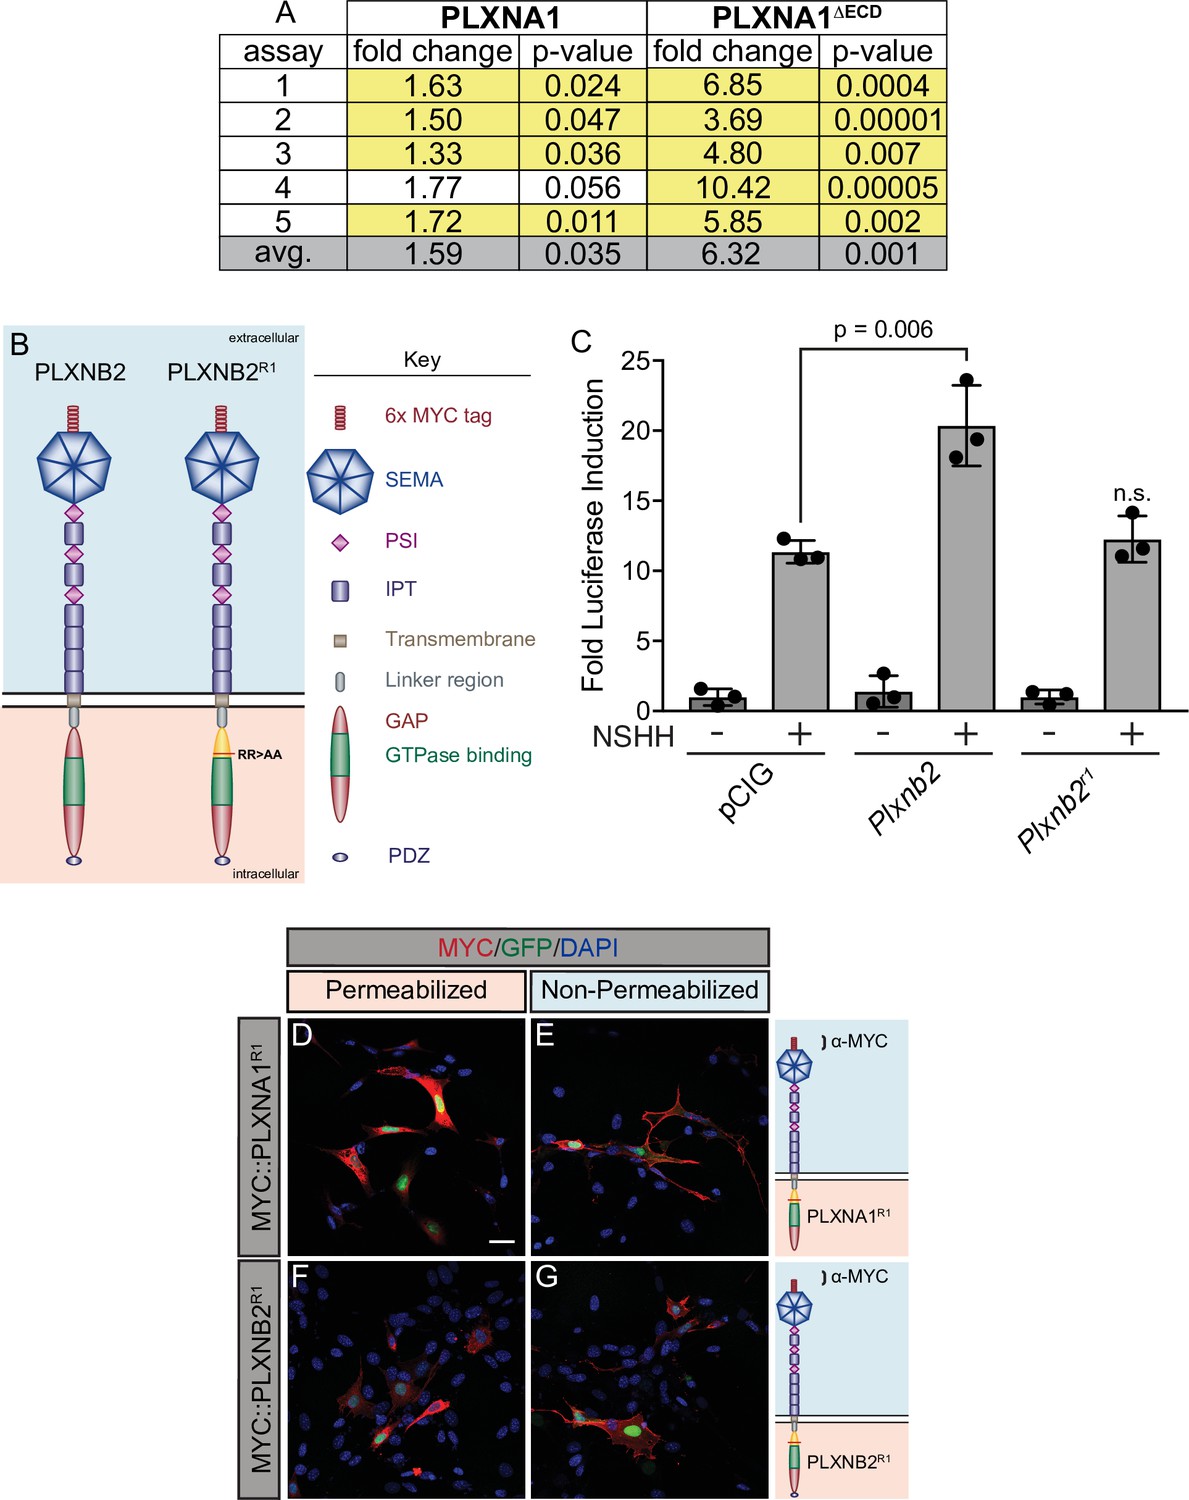
Constitutively active PLXNA1 reproducibly increases Hedgehog (HH) pathway activity.
(A) Summary of luciferase assay data in which PLXNA1 and PLXNA1ΔECD were directly compared in five independent assays. Fold change reported between ligand-stimulated vector only (pCIG) triplicate wells and ligand-stimulated Plxna1- or Plxna1ΔECD - transfected triplicate wells. Yellow highlight denotes statistical significance (p<0.05). (B) Schematic of different PLXNB2 proteins. (C) HH-dependent luciferase reporter activity was measured in NIH/3T3 cells transfected with the indicated constructs and stimulated with control (-NSHH) or NSHH-conditioned media (+NSHH). Data are reported as mean fold induction ± SD, with p-values calculated using two-tailed Student’s t-tests. n.s., not significant. (D–G) Antibody detection of MYC (red) in permeabilized (left panels) and non-permeabilized (right panels) NIH/3T3 cells to assess cell surface localization of the indicated MYC-tagged proteins. Nuclear GFP (green) indicates transfected cells, whereas DAPI (blue) stains all nuclei. Diagrams (right) describe each construct, with brackets indicating antibody binding sites. Scale bar = 10 μm.
-
Figure 3—figure supplement 1—source data 1
Raw data for Figure 3—figure supplement 1C.
- https://cdn.elifesciences.org/articles/74750/elife-74750-fig3-figsupp1-data1-v2.xlsx
Figure 3—figure supplement 2

The plexin (PLXN) GTPase-activating protein (GAP) domain and a FYN kinase phosphorylation site contribute to PLXN-mediated promotion of Hedgehog (HH) signaling.
(A) Schematic of different PLXNA1 proteins. (B, C) HH-dependent luciferase reporter activity was measured in NIH/3T3 cells transfected with pCIG or SmoM2 and co-transfected with indicated constructs. Data are reported as mean fold induction ± SD, with p-values calculated using two-tailed Student’s t-tests. n.s., not significant.
-
Figure 3—figure supplement 2—source data 1
Raw data for Figure 3—figure supplement 2B.
- https://cdn.elifesciences.org/articles/74750/elife-74750-fig3-figsupp2-data1-v2.xlsx
Figure 3—figure supplement 3
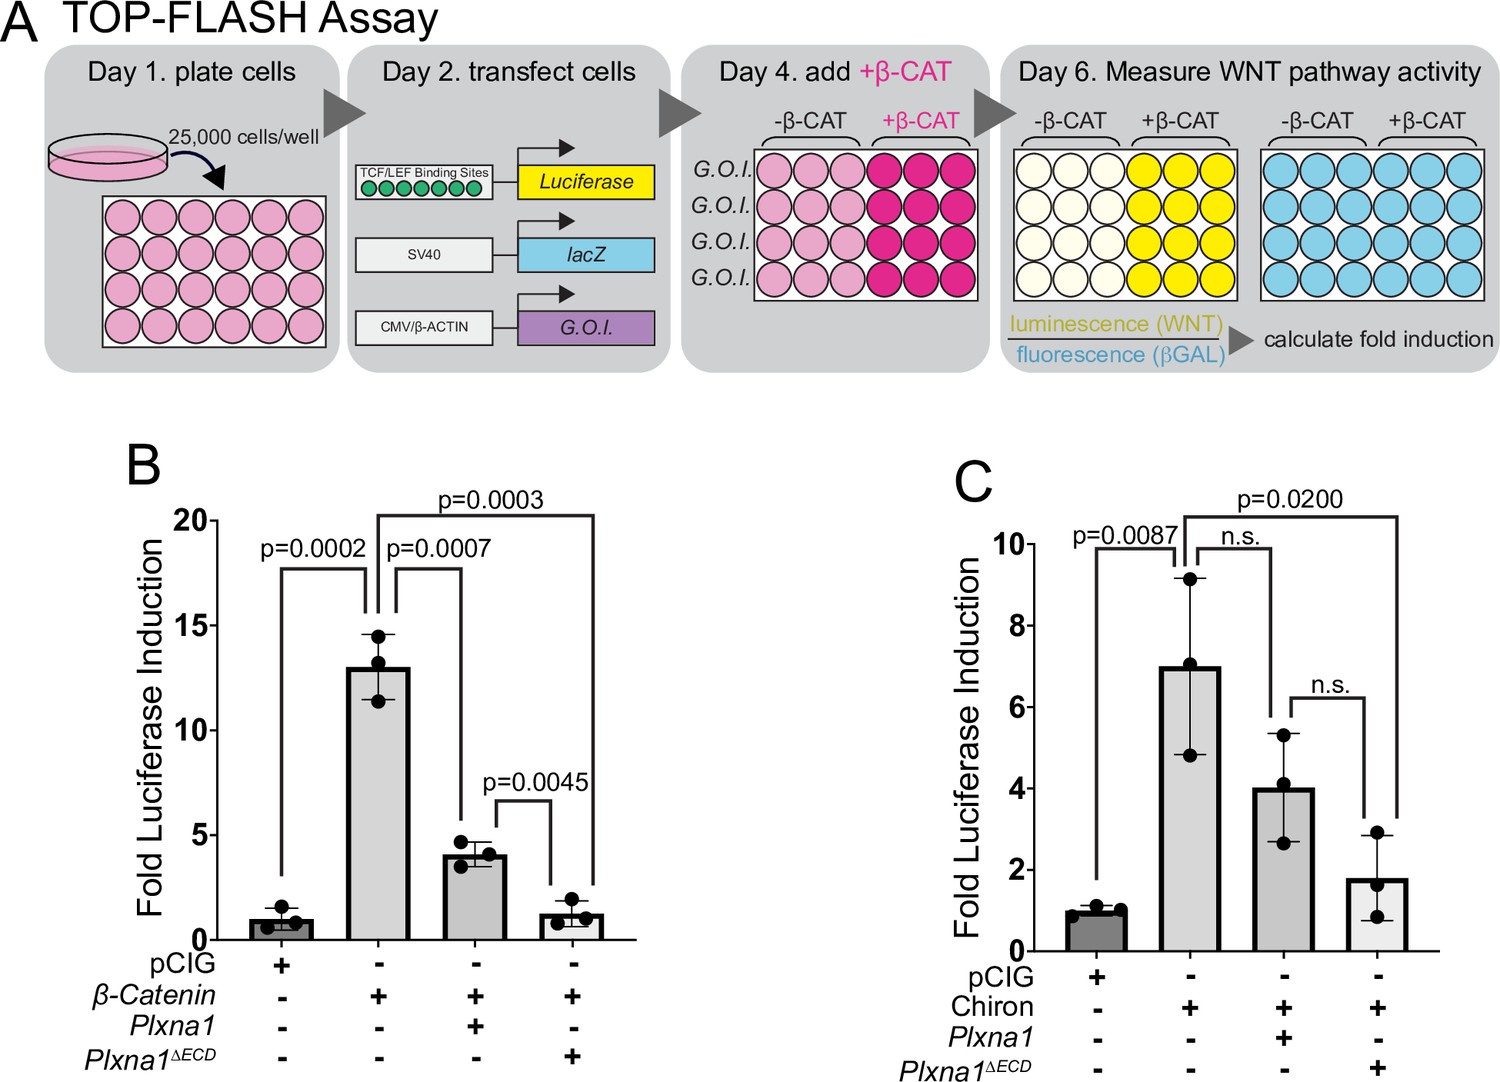
Plexins (PLXNs) inhibit WNT signaling.
(A) Schematic of WNT-responsive NIH/3T3 TOP-FLASH luciferase assays. G.O.I., gene of interest. (B, C) WNT-dependent luciferase reporter activity was measured in NIH/3T3 cells transfected with the indicated constructs or empty vector control (pCIG) and stimulated by co-transfection of β-catenin (B) or treatment with Chiron (C). Data are reported as mean fold induction ± SD, with p-values calculated using two-tailed Student’s t-tests. n.s., not significant.
-
Figure 3—figure supplement 3—source data 1
Raw data for Figure 3—figure supplement 3B and C.
- https://cdn.elifesciences.org/articles/74750/elife-74750-fig3-figsupp3-data1-v2.xlsx
Figure 4 with 1 supplement
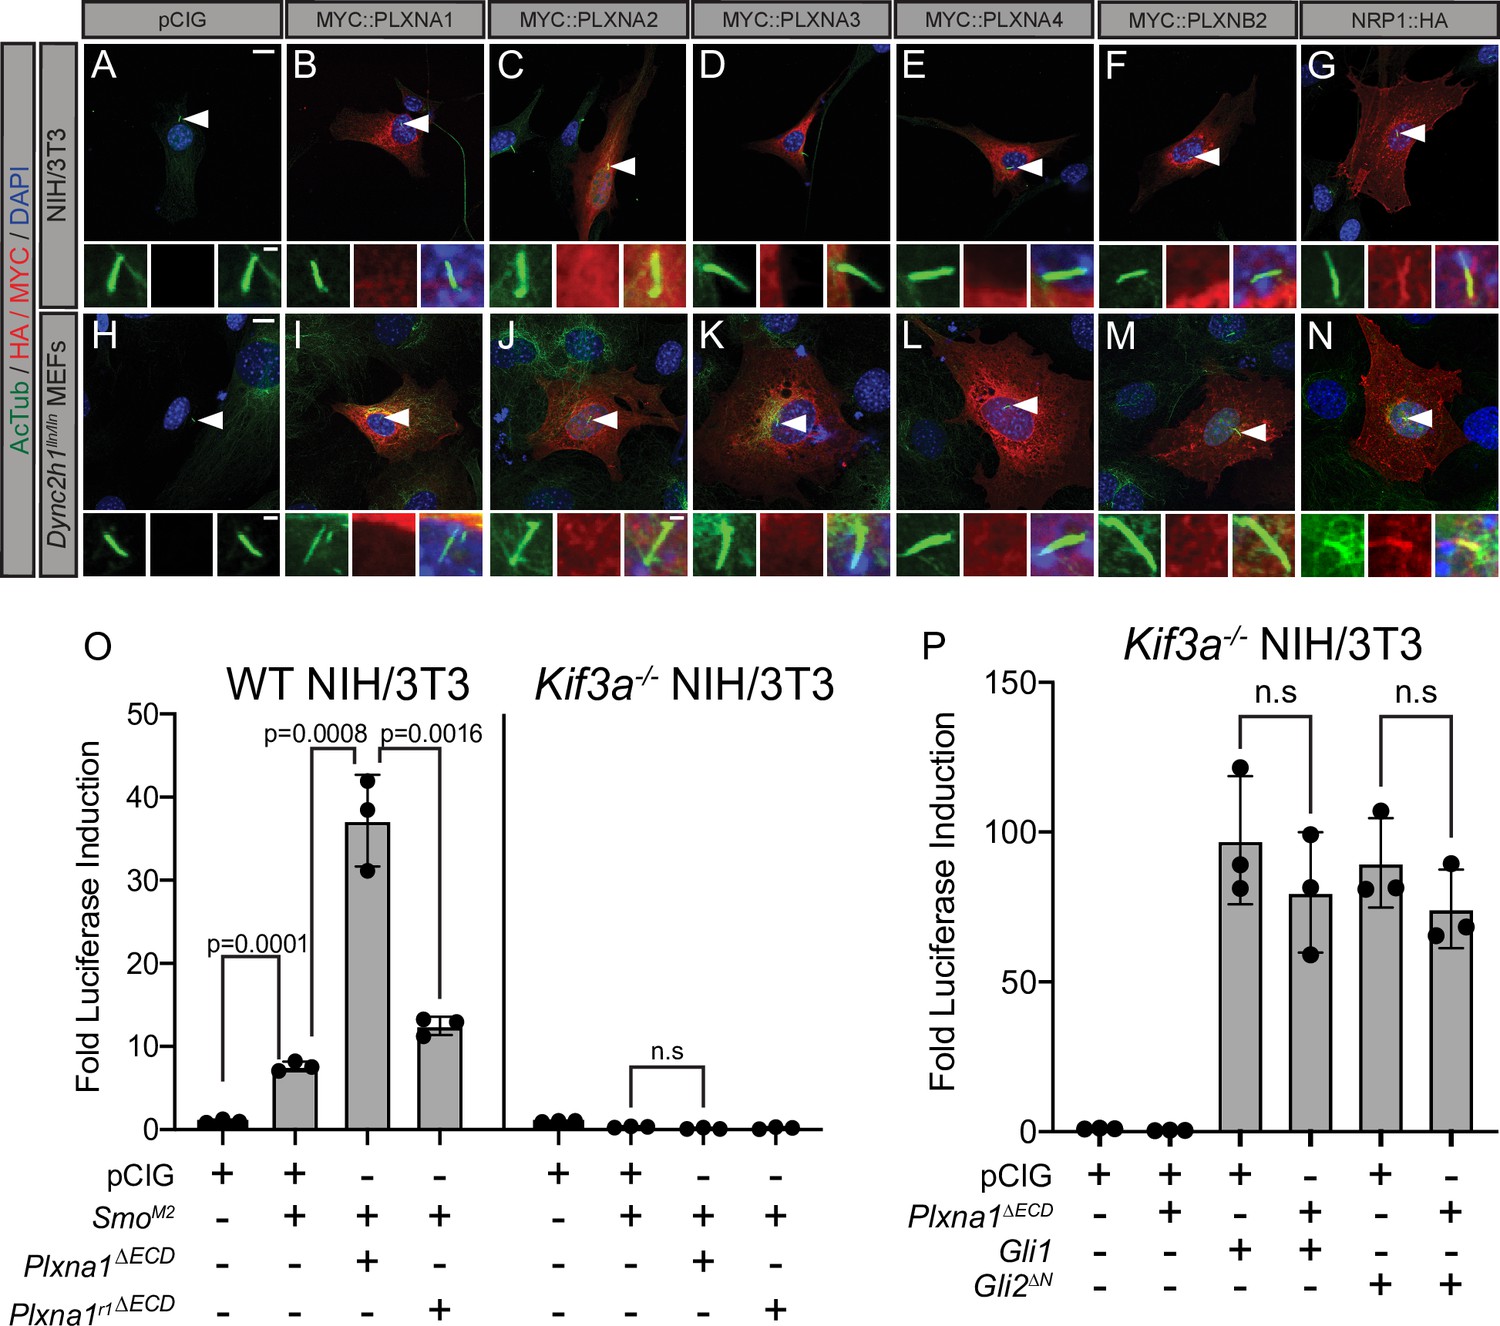
Plexins (PLXNs) do not localize to primary cilia, but do require primary cilia to promote Hedgehog (HH) pathway activity.
(A–N) Antibody detection of MYC and HA-tagged constructs (red) in NIH/3T3 cells (A–G) and Dync2h1lln/lln mouse embryonic fibroblasts (MEFs) (H–N). Acetylated tubulin (AcTub, green) indicates the primary cilium and DAPI (blue) stains nuclei. Compared to NRP1, PLXNs are not enriched in primary cilia. Scale bar = 10 μm. Inset scale bar = 1 μm. (O) WT NIH/3T3 cells or Kif3a-/- NIH/3T3 cells were co-transfected with SmoM2 and Plxna1∆ECD or Plxna1r1∆ECD. (P) Kif3a-/- NIH/3T3 were transfected with Gli1 or Gli2∆N and co-transfected with Plxna1∆ECD. Data are reported as mean fold induction ± SD, with p-values calculated using two-tailed Student’s t-tests. n.s., not significant.
-
Figure 4—source data 1
Raw data for Figure 4O and P.
- https://cdn.elifesciences.org/articles/74750/elife-74750-fig4-data1-v2.xlsx
Figure 4—figure supplement 1
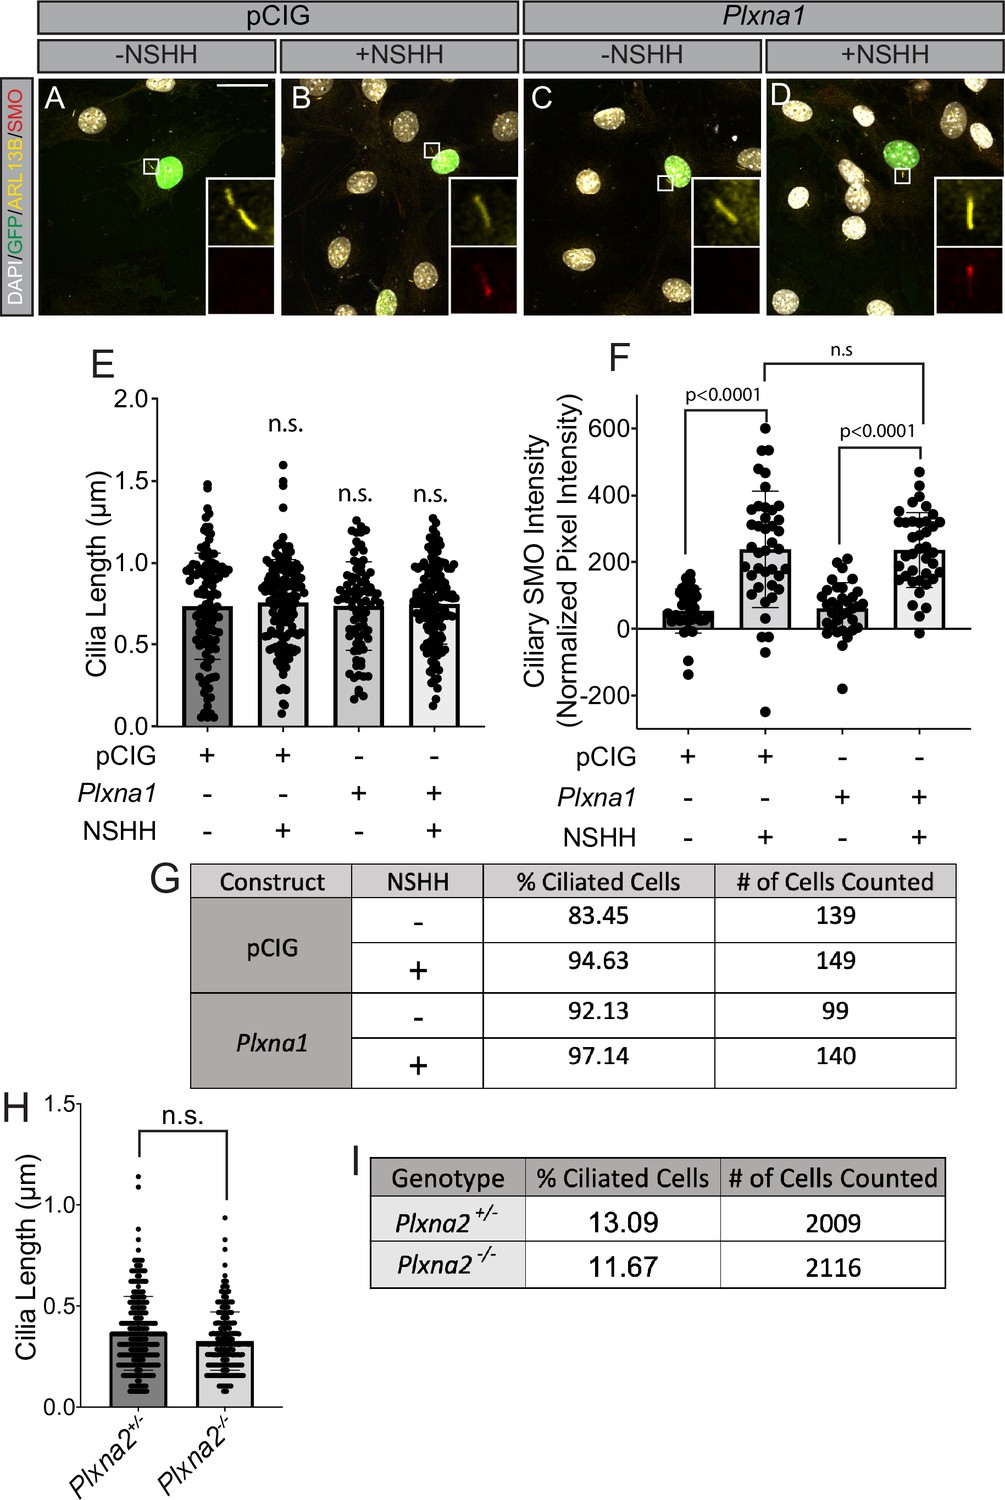
Plexins (PLXNs) do not affect Smoothened (SMO) accumulation in primary cilia, ciliary length, or ciliation frequency.
(A–D) Antibody detection of ARL13B (yellow) and SMO (red) in NIH/3T3 cells transfected with pCIG or Plxna1. Nuclear GFP (green) indicates transfected cells and DAPI (gray) stains nuclei. Average cilia length (E), normalized intensity of SMO staining within cilia (F), and rate of ciliation (G) of cells transfected with pCIG or Plxna1 and treated with control (-NSHH) or NSHH-conditioned media (+NSHH) were measured. No significant differences in ciliation frequency were observed between pCIG and Plxna1 expressing cells in the absence (χ2 = 3.658, p=0.0558) or presence (χ2 = 1.144, p=0.2847) of NSHH (E). Average ciliary length (H) and rate of ciliation (I) were measured using microscope images of sections from the hippocampus of postnatal day 7 (P7) Plxna2-/- mice (n = 4) compared to heterozygous littermates (n = 4) stained with antibodies directed against ARL13B in order to visualize cilia. Ciliation frequency between Plxna2+/- and Plxna2-/- littermates was not significantly different (χ2 = 1.9128, p=0.1667). Data are reported as average value ± SD, with p-values calculated using two-tailed Student’s t-tests. n.s., not significant.
-
Figure 4—figure supplement 1—source data 1
Raw data for Figure 4—figure supplement 1E–I.
- https://cdn.elifesciences.org/articles/74750/elife-74750-fig4-figsupp1-data1-v2.xlsx
Figure 5 with 1 supplement

Constitutively active PLXNA1 induces ectopic cell migration into the lumen of the developing chicken neural tube.
(A–T) Immunofluorescent analysis of neural patterning in forelimb-level sections from Hamburger–Hamilton stage 21–22 chicken embryos. Embryos were electroporated at Hamburger–Hamilton stage 11–13 with pCIG (A–D, n = 6 embryos), SmoM2 (E–H, n = 7 embryos), Gli1 (I–L, n = 4 embryos), MYC::Plxna1∆ECD (M–P, n = 17 embryos), or MYC::Plxna1r1∆ECD (Q–T, n = 6 embryos). Transverse sections were stained with GFP, MYC, and NKX6.1 antibodies. DAPI stain labels nuclei (gray). Electroporated cells are labeled with GFP. Asterisks denote the presence (yellow) or absence (white) of ectopic cells within the lumen of the neural tube. Arrowheads denote the presence (yellow) or absence (white) of ectopic NKX6.1. Scale bar = 50 μm.
Figure 5—figure supplement 1

Constitutively active PLXNA1 does not significantly alter Hedgehog-dependent neural tube patterning in the developing chicken embryo.
(A–M) Immunofluorescent analysis of neural patterning in forelimb-level sections from Hamburger–Hamilton stage 21–22 chicken embryos. Embryos were electroporated at Hamburger–Hamilton stage 11–13 with pCIG (A–C), Gli1 (D–F, J), or Plxna1∆ECD (G–I, K, L). Transverse sections were stained with antibodies directed against GFP (green), PAX7 (blue), and NKX6.1 (red). DAPI stain labels nuclei (gray). Electroporated cells are labeled with GFP. Asterisks denote the loss of PAX7. Scale bar = 50 µm. Yellow arrowheads indicate the presence of ectopic NKX6.1. White arrowheads (K, L) denote the absence of ectopic NKX6.1 in Plxna1∆ECD-electroporated embryos as compared to Gli1 (J). Quantitation of NKX6.1 domain size normalizing electroporated and unelectroporated sides of developing chicken neural tubes electroporated with pCIG, Gli1, or Plxna1∆ECD. Values are reported as mean ± SD, with p-values calculated using two-tailed Student’s t-test.
-
Figure 5—figure supplement 1—source data 1
Raw data for Figure 5—figure supplement 1M.
- https://cdn.elifesciences.org/articles/74750/elife-74750-fig5-figsupp1-data1-v2.xlsx
Figure 6
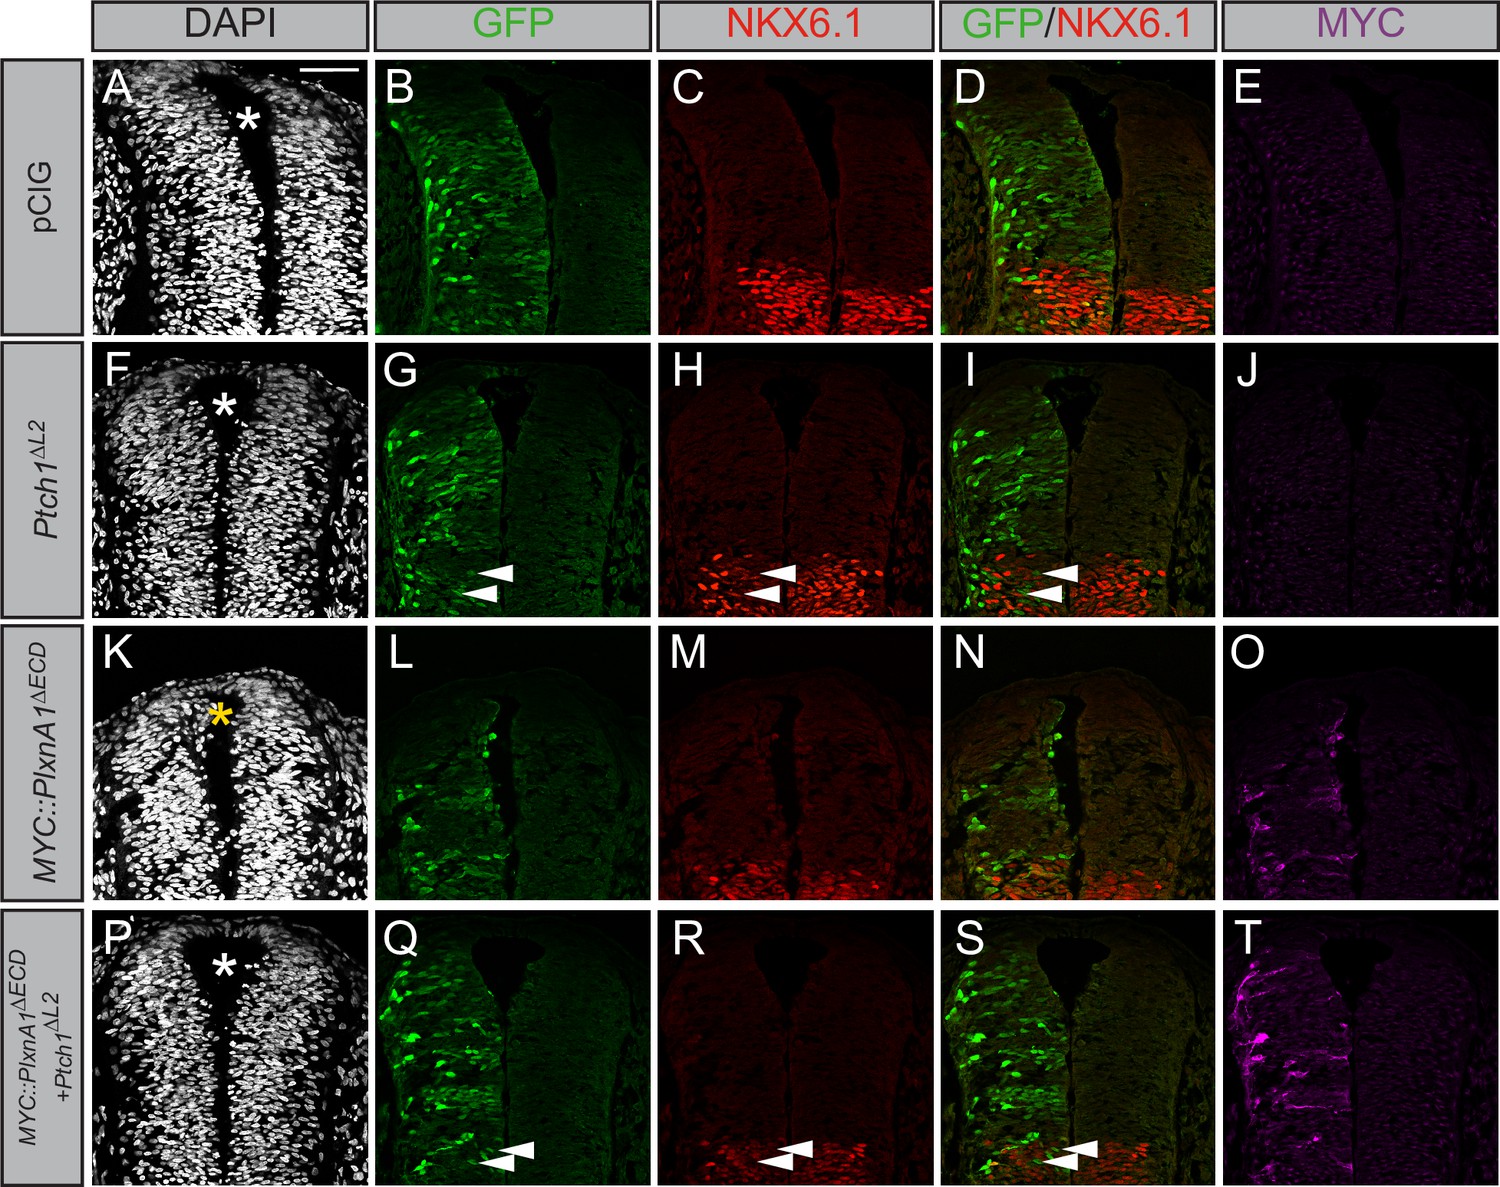
Plexin (PLXN)-mediated ectopic cell migration is Hedgehog (HH)-dependent.
(A–T) Immunofluorescent analysis of neural patterning in forelimb-level sections from Hamburger–Hamilton stage 21–22 chicken embryos. Embryos were electroporated at Hamburger–Hamilton stage 11–13 with pCIG (A–E, n = 6 embryos), MYC::Plxna1∆ECD (F–J, n = 7 embryos), Ptch1∆L2 (K–O, n = 5 embryos), or MYC::Plxna1∆ECD and Ptch1∆L2 (P–T, n = 8 embryos). Transverse sections were stained with GFP, MYC, and NKX6.1 antibodies. DAPI stain labels nuclei (gray). Electroporated cells are labeled with GFP. Asterisks denote the presence (yellow) or absence (white) of ectopic cells within the lumen of the neural tube. Arrowheads denote absence of NKX6.1 in electroporated cells. Scale bar = 50 μm.
Figure 7 with 2 supplements
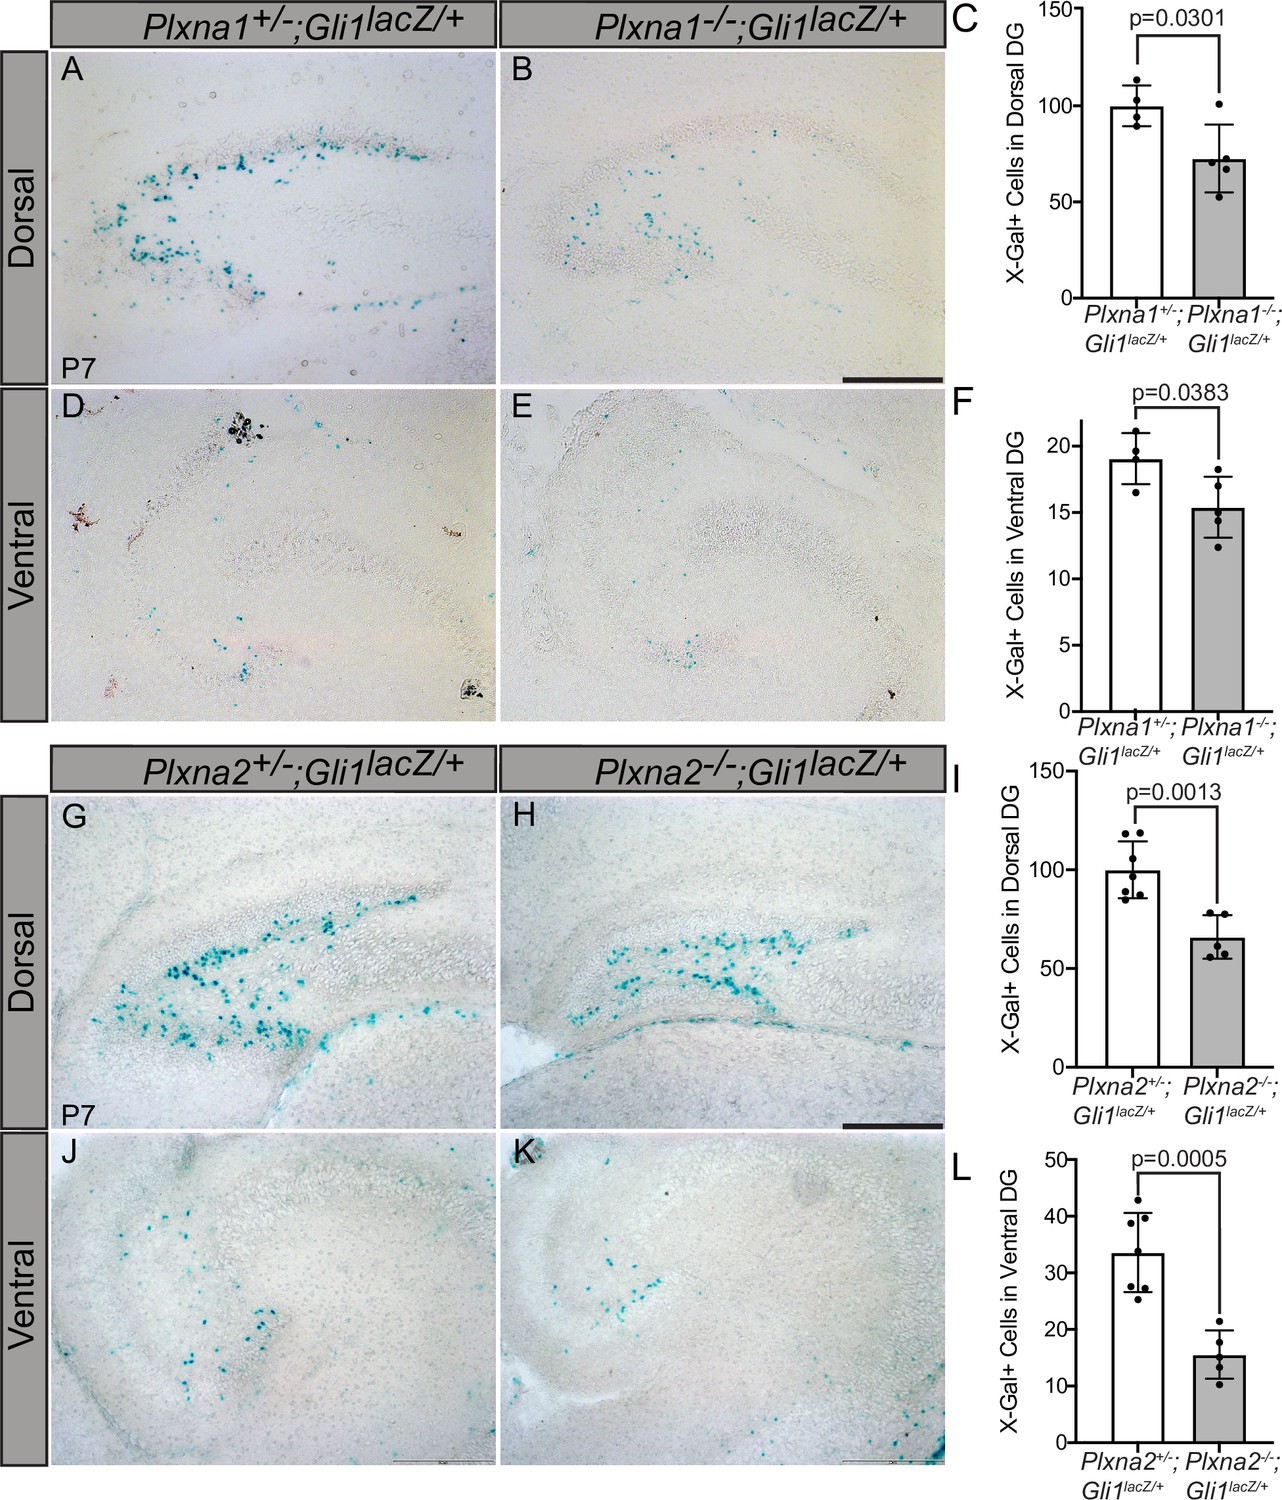
Reduced Gli1lacZ expression in the dentate gyrus (DG) of mice lacking either Plxna1 or Plxna2.
X-Gal staining in coronal sections through the dorsal (A, B, G, H) and ventral (D, E, J, K) hippocampus of postnatal day 7 (P7) mice. The following numbers of pups were analyzed: Plxna1+/-;Gli1lacZ/+ (n = 4); Plxna1-/-;Gli1lacZ/+ (n = 5); Plxna2+/-;Gli1lacZ/+ (n = 7); Plxna2-/-;Gli1lacZ/+ (n = 5). Quantitation of Gli1lacZ-positive cells (C, F, I, L) reported as mean ± SD, with p-values calculated using two-tailed Student’s t-test. Scale bar = 200 μm.
-
Figure 7—source data 1
Raw data for Figure 7C, F, I and L.
- https://cdn.elifesciences.org/articles/74750/elife-74750-fig7-data1-v2.xlsx
Figure 7—figure supplement 1
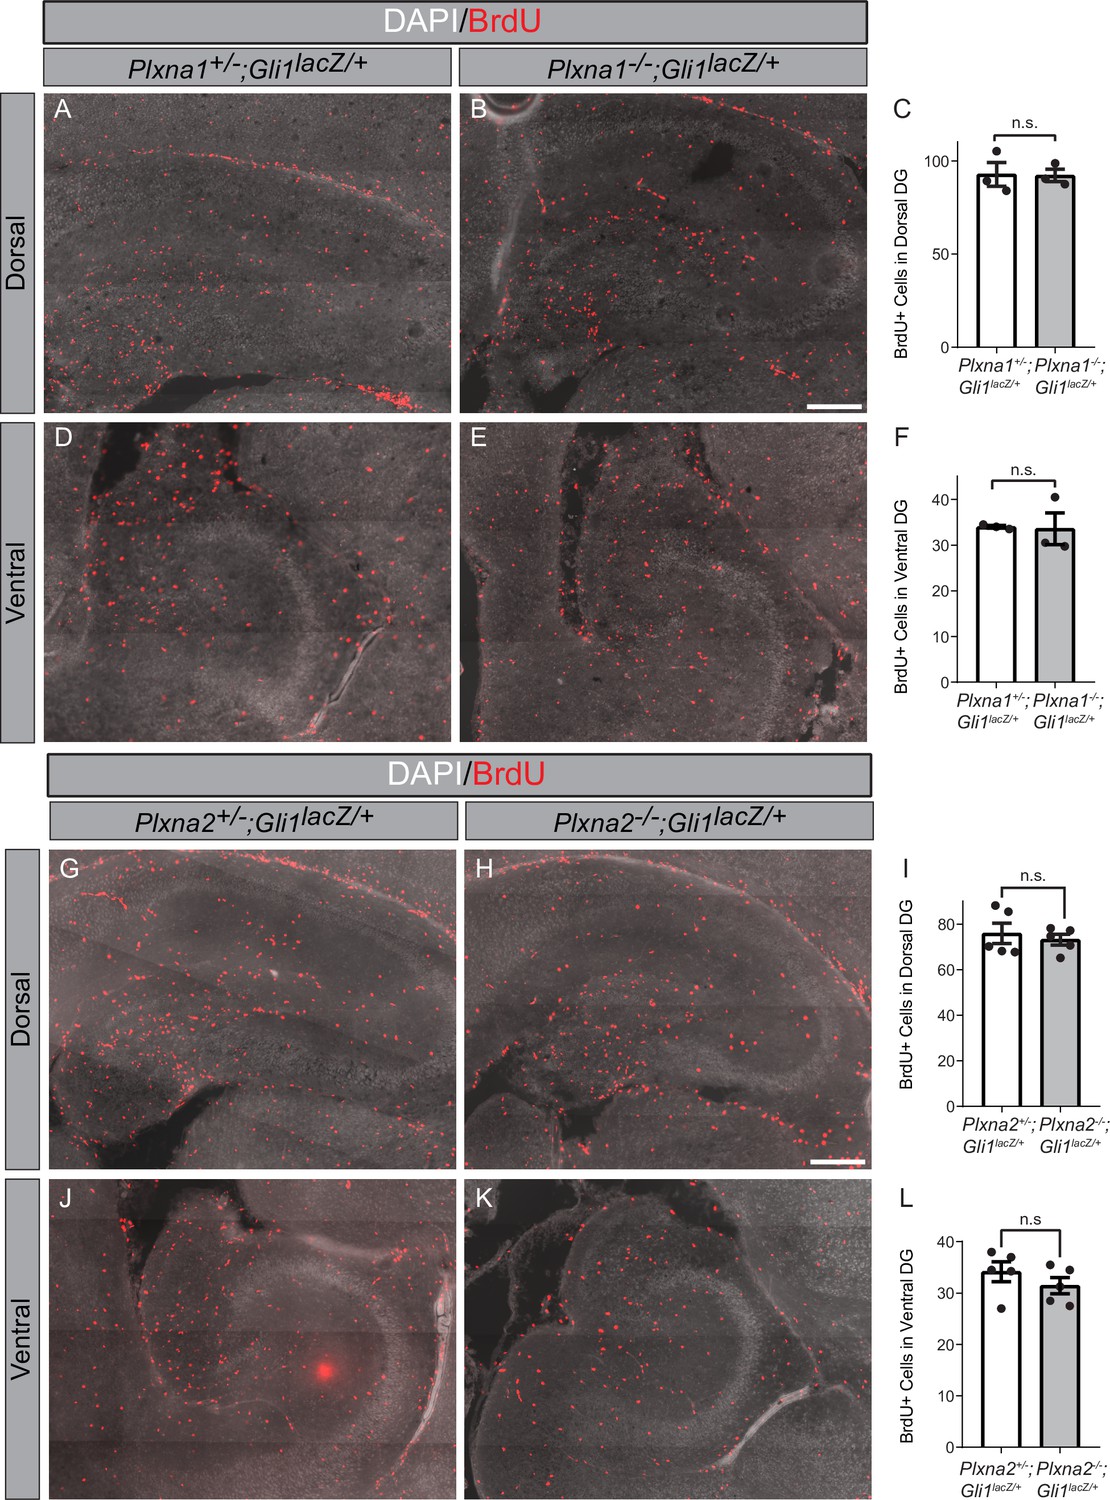
Plxna1 and Plxna2 deletion do not alter cell proliferation in the hippocampus.
BrdU staining in coronal sections through the dorsal (A, B, G, H) and ventral (D, E, J, K) hippocampus of postnatal day 7 (P7) mice. The following numbers of pups were analyzed: Plxna1+/-;Gli1lacZ/+ (n = 3); Plxna1-/-;Gli1lacZ/+ (n = 3); Plxna2+/-;Gli1lacZ/+ (n = 5); Plxna2-/-;Gli1lacZ/+ (n = 5). Quantitation of BrdU-positive cells (C, F, I, L) reported as mean ± SD, with p-values calculated using two-tailed Student’s t-test. n.s., not significant. DG, dentate gyrus. Scale bar = 200 μm.
-
Figure 7—figure supplement 1—source data 1
Raw data for Figure 7—figure supplement 1C, F, I and L.
- https://cdn.elifesciences.org/articles/74750/elife-74750-fig7-figsupp1-data1-v2.xlsx
Figure 7—figure supplement 2
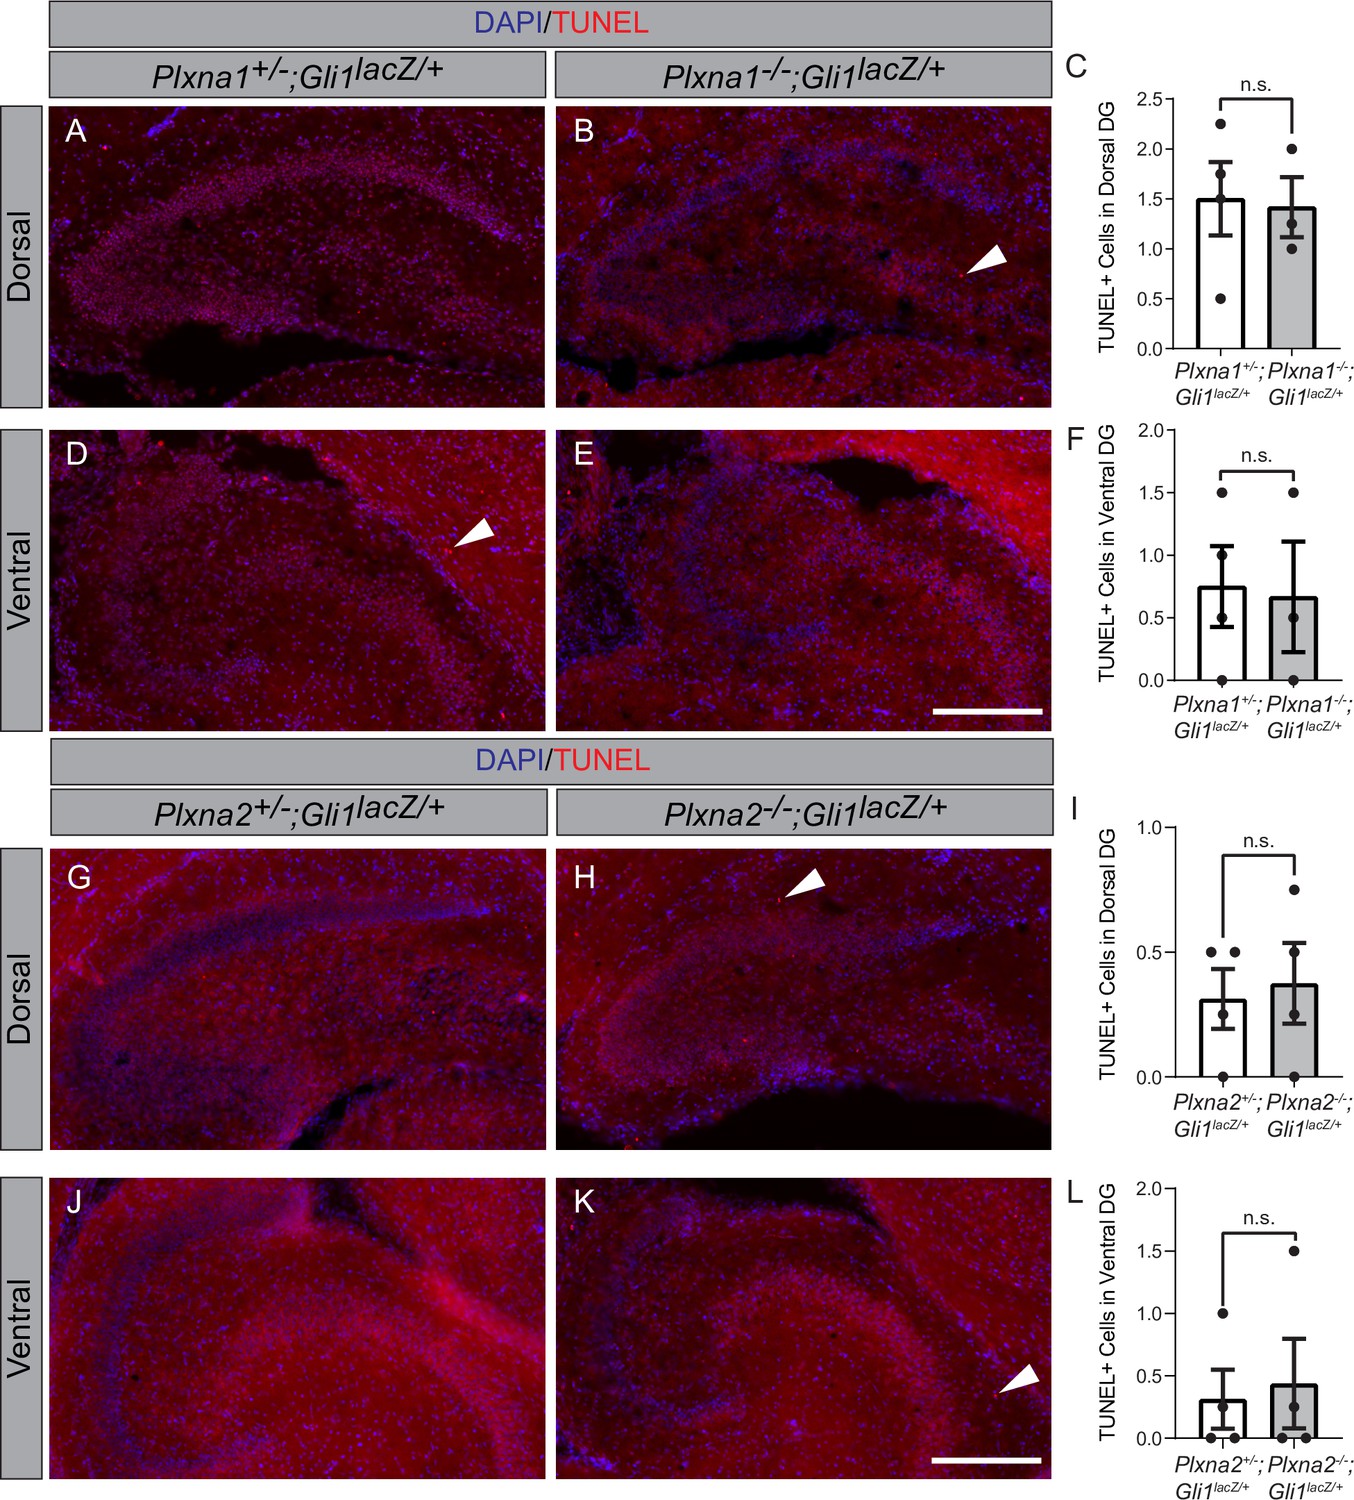
Plxna1 and Plxna2 deletion does not alter apoptosis in the hippocampus.
TUNEL staining in coronal sections through the dorsal (A, B, G, H) and ventral (D, E, J, K) hippocampus of postnatal day 7 (P7) mice. The following numbers of pups were analyzed: Plxna1+/-;Gli1lacZ/+ (n = 4); Plxna1-/-;Gli1lacZ/+ (n = 3); Plxna2+/-;Gli1lacZ/+ (n = 4); Plxna2-/-;Gli1lacZ/+ (n = 4). Quantitation of TUNEL-positive cells (C, F, I, L, arrowheads) reported as mean ± SD, with p-values calculated using two-tailed Student’s t-test. n.s., not significant. DG, dentate gyrus. Scale bar = 200 μm.
-
Figure 7—figure supplement 2—source data 1
Raw data for Figure 7—figure supplement 2C, F, I and L.
- https://cdn.elifesciences.org/articles/74750/elife-74750-fig7-figsupp2-data1-v2.xlsx
Figure 8
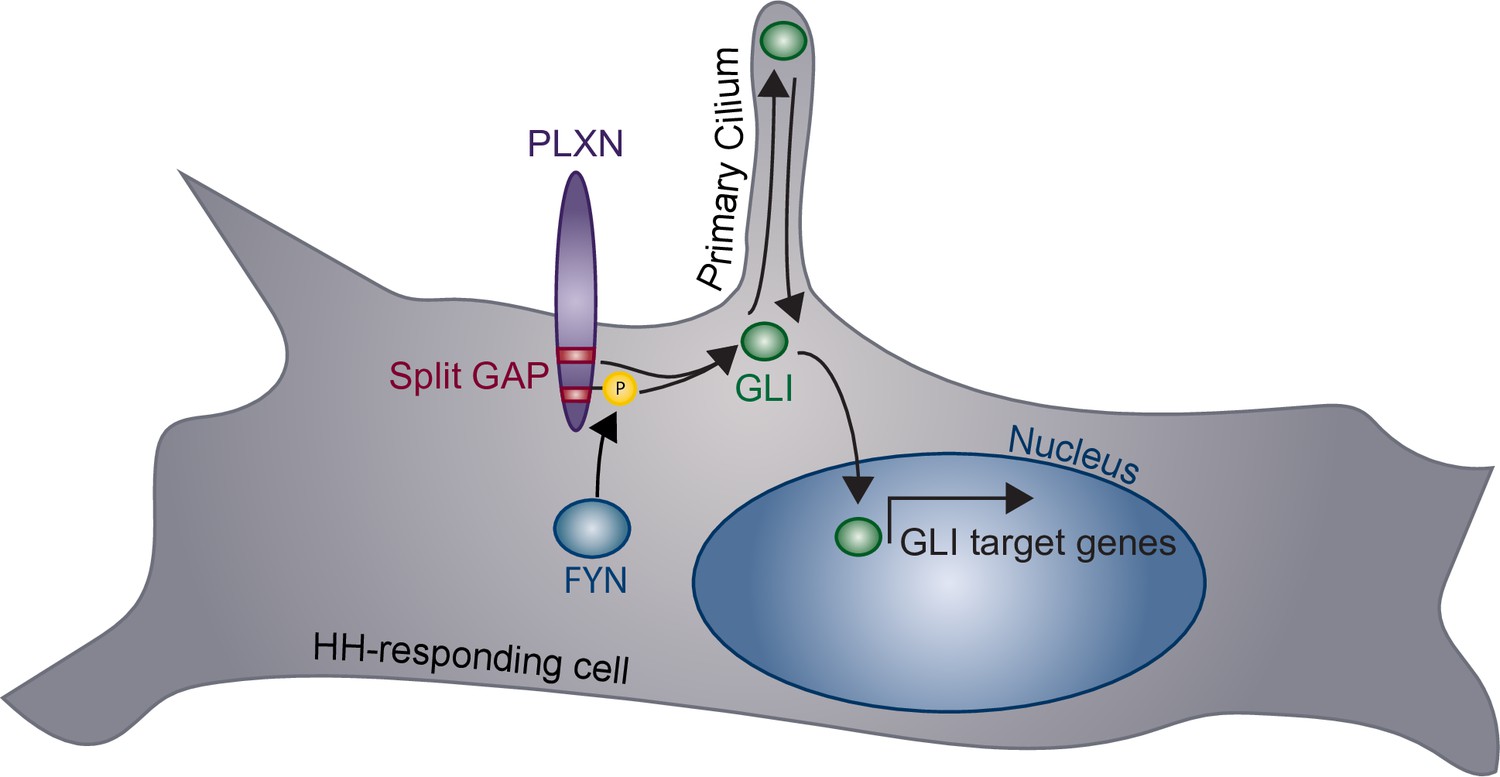
Model of plexin (PLXN)-mediated promotion of Hedgehog (HH) pathway activity.
PLXNs (purple) at the cell surface promote HH signaling through GLI transcription factor (green) activation, mediated by their cytoplasmic GTPase-activating protein (GAP) activity (red) and FYN kinase phosphorylation (yellow). Notably, this PLXN-dependent promotion requires primary cilia to induce GLI target gene expression in the nucleus.
Additional files
Download links
A two-part list of links to download the article, or parts of the article, in various formats.
Downloads (link to download the article as PDF)
Open citations (links to open the citations from this article in various online reference manager services)
Cite this article (links to download the citations from this article in formats compatible with various reference manager tools)
Plexins promote Hedgehog signaling through their cytoplasmic GAP activity
eLife 11:e74750.
https://doi.org/10.7554/eLife.74750


