Single-molecule analysis of the entire perfringolysin O pore formation pathway
- EMBL Australia Node in Single Molecule Science, School of Biomedical Sciences, University of New South Wales, Australia
- Biomedicine Discovery Institute, Department of Biochemistry and Molecular Biology, Monash University, Australia
- Department of Biochemistry and Pharmacology, Bio21 Molecular Science and Biotechnology Institute, University of Melbourne, Australia
- Structural Biology Unit, St. Vincent’s Institute of Medical Research, Australia
Figures
Figure 1 with 4 supplements
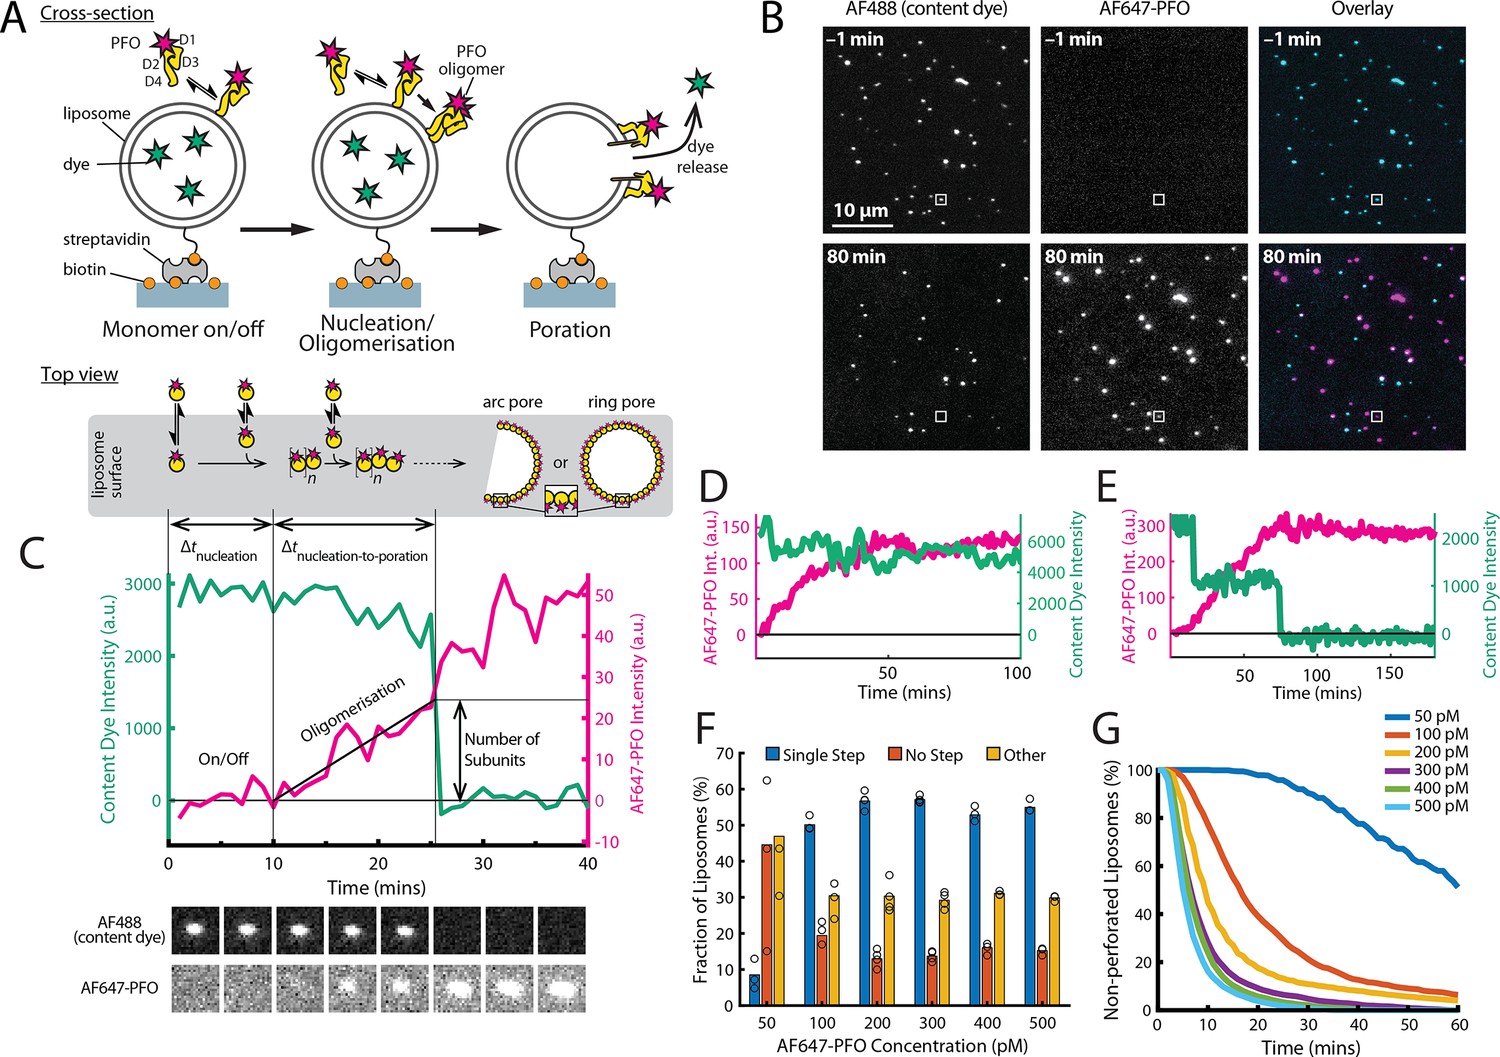
PFO pore formation assay.
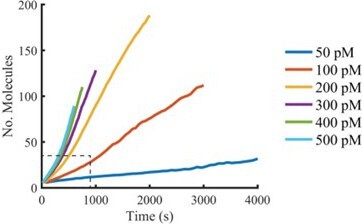
(A) Schematic of the TIRF assay to measure the PFO assembly and membrane pore formation. Liposomes loaded with AF488 as a content marker are bound to a coated glass coverslip at the bottom of a microfluidic device. AF647-labelled PFO injected into the flow channel reversibly binds to the liposome, assembles into an oligomer and ultimately forms an open arc or ring pore releasing the encapsulated dye. (B) TIRF images (400×400 pixel region) from a pore formation time series before (–1 min) and after (80 min) addition of 100 pM AF647-PFO to immobilised liposomes showing the AF488 channel (left), the AF647-PFO channel (middle) and an overlay of both channels (right; AF488 in cyan and AF647-PFO in magenta). (C) Example fluorescence intensity traces recorded at the location of the single liposome (marked with the white box in panel B) in the content dye (blue-green) and AF647-PFO (magenta) channels. Dye release pinpoints the time of membrane permeabilisation. Snapshots (1.7 μm×1.7 μm) of the corresponding liposome in both channels are shown below the traces. Additional example traces are shown in Figure 1—figure supplement 3. (D) Example “No Step” trace where the content dye intensity (green) remains constant throughout the experiment (E) Example ‘Other’ trace where the dye content dye intensity (green) decreases in multiple steps. (F) Fraction of liposomes with content dye traces classified on the basis of step fitting as (1) single step, (2) no dye loss (<25% decrease in intensity) or (3) other release profiles (includes traces with multiple steps or incomplete dye loss). Example traces for each of these classes are shown in Figure 1—figure supplement 3. (G) Distributions of single-step dye release times from liposomes at AF647-PFO concentrations between 50–500 pM. Number of replicates in (F) and (G): 3 experiments for 50 pM, 100 pM, 400 pM, 500 pM; 4 experiments for 200 pM, 300 pM. All experiments were conducted at room temperature using a 20 mM HEPES buffer (pH 7) containing 100 mM NaCl and 0.01 mg/mL BSA.
Figure 1—figure supplement 1
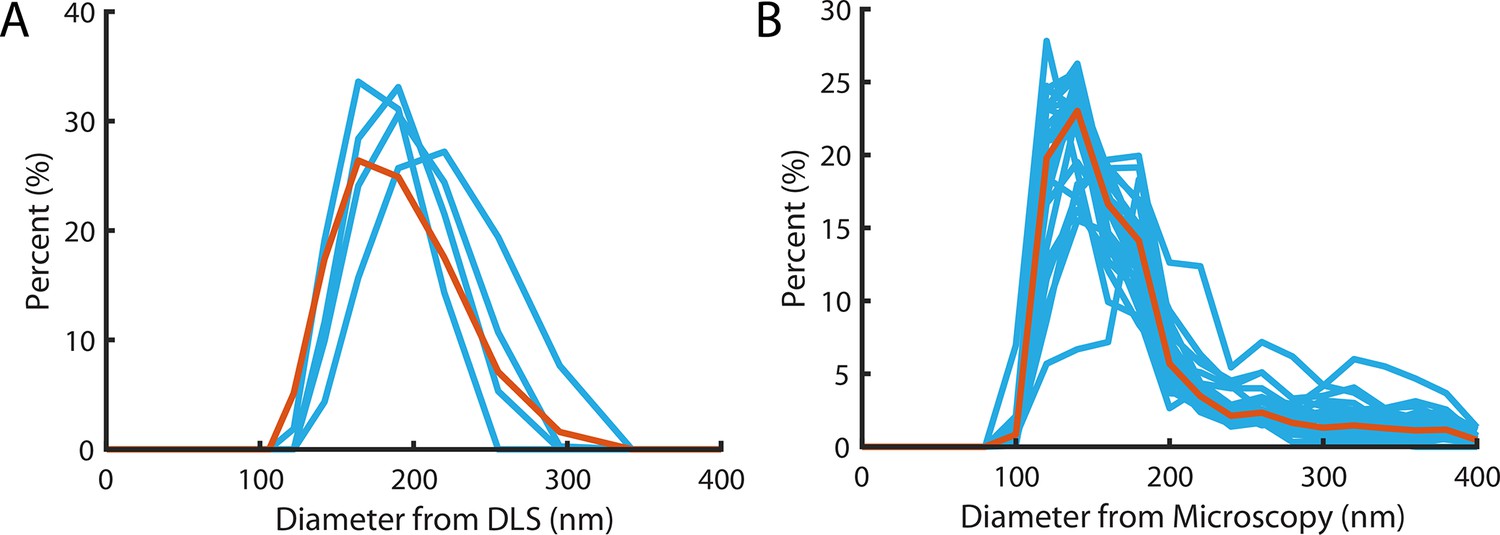
Liposome size distribution.
(A) Size distribution measured using dynamic light scattering with a mean and standard deviation of 183±37 nm. Blue lines denote the four repeats, red line is the pooled distribution. (B) Size distribution measured from diameters of particles in super-resolution reconstructions (Figure 2G). Light Blue lines denote the distribution of independent experiments, the red line is the pooled distribution with a mean and standard deviation of 172±18 nm.
Figure 1—figure supplement 2
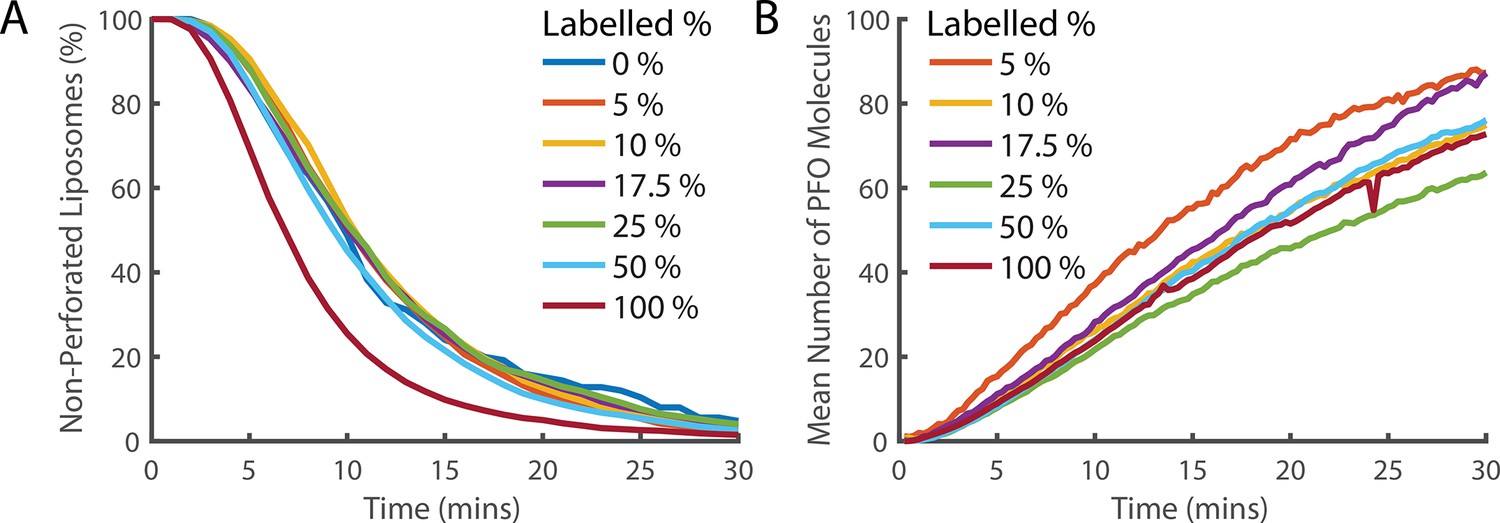
Fluorescence labelling of PFO does not impair pore formation activity.
(A) Distributions of single-step dye release times from liposomes in the presence of different ratios of labelled and unlabelled PFO (combined concentration of 400 pM). The percentage denotes the percent of the 400 pM PFO that is fluorescently labelled by AF647. Concentrations of labelled and unlabelled protein were independently measured by gel densitometry. The slight increase in the rate of poration in the 100% labelled sample (maroon curve) in comparison to lower labelled percentage samples suggests that the actual concentration of the labelled sample may be slightly higher than the unlabelled sample. Alternatively, this could be the result of fluorescent labelling increasing the activity of PFO. Regardless, the activity of all samples is reasonably similar and we conclude that the labelled PFO is functional. (B) The average across all liposomes of the PFO intensity over time. The intensity is corrected for the partial labelling of PFO by dividing by the labelling percent. If PFO does not experience fluorescence quenching when it forms an oligomer, then all traces should overlay. The relatively small deviation between traces and absence of a clear trend with concentration suggests that the degree of quenching is small.
Figure 1—figure supplement 3
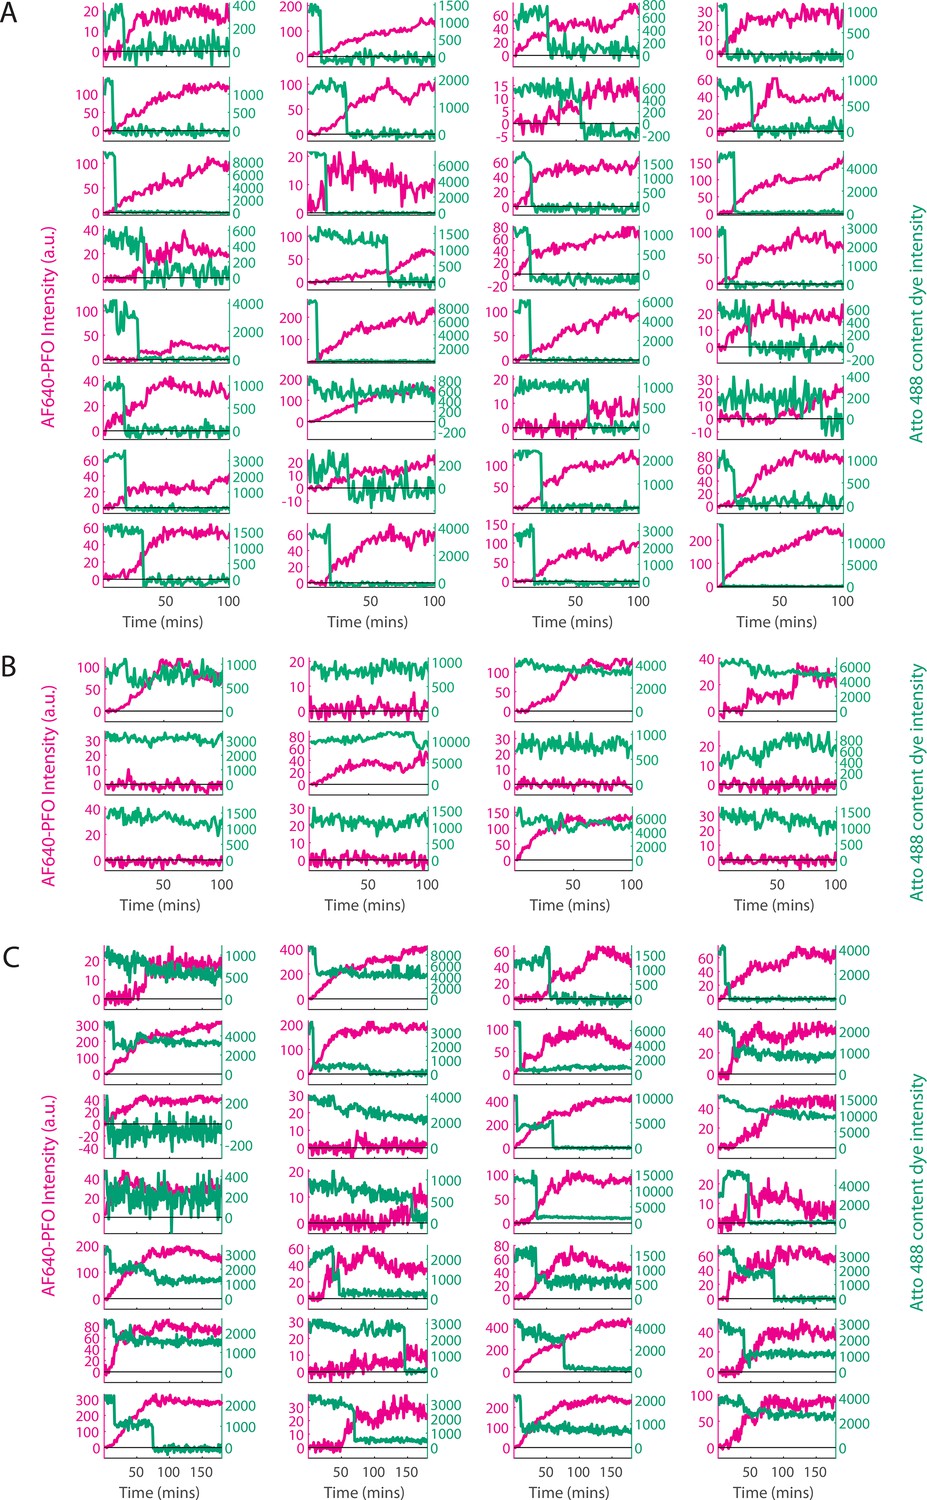
Classification of single-liposome traces on the basis of the content dye release profile.
Content dye (blue-green) and corresponding AF647-PFO (magenta) binding traces from a dual colour TIRF pore formation experiment recorded in the presence of 100 pM AF647-PFO. The traces were classified on the basis of step-fitting of content dye traces as (A) single-step dye release, (B) no dye release (defined as less than 25% decay in content dye intensity over the course of the experiment), (C) other dye release profiles (includes multi-step, partial dye and gradual dye release). Categories B and C were excluded from analysis. After poration, liposomes continue to bind AF647-PFO to levels greater than the value expected for a single ring-shaped pore (~35 subunits), suggesting that eventually multiple pores form on a single liposome. The example traces shown here represent the first 32 out of 457, 12 out of 195 and 28 out of 280 traces in category A, B, and C, respectively for this experiment (i.e. these traces were not hand-picked).
Figure 1—figure supplement 4
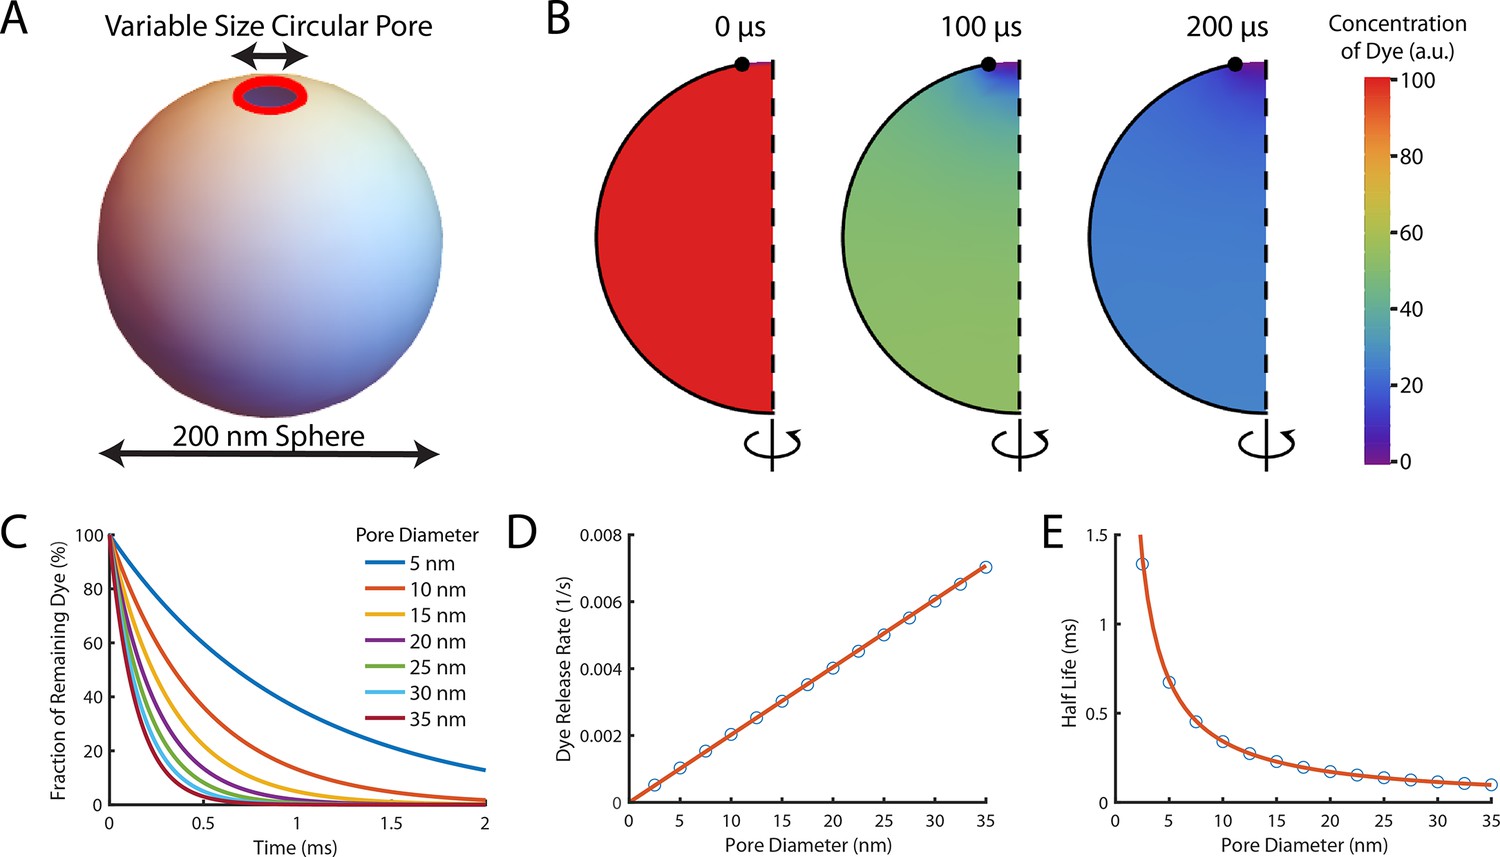
Theoretical computation of the dye release rate following pore opening.
Pore formation on liposomes was modelled in FlexPDE v7 as a circular pore on a spherical liposome. Encapsulated dye was initially homogeneously distributed in the liposome before being allowed to diffuse out through the pore at a rate of 435 μm2/s (Petrásek and Schwille, 2008). (A) Schematic of the simulated system. The liposome was modelled as a sphere with a diameter of 200 nm, and the pore (shown in red) was assumed to be a ring with a variable diameter to model different size pores (B) A montage of the distribution of dye inside a liposome with a 35 nm pore. Each semicircle is a cross-section of the liposome at a given time point which would be rotated around the z-axis to give the three-dimensional model. The pore is at the top of the liposome (the lack of black outline at the top of the semicircle). Initially (left-hand panel), the concentration is homogeneously at 100%. After 100 μs (middle panel) approximately half the dye has left the liposome. The concentration is lowest near the pore (indicated by the blue colour at the top). After 200 μs (right panel) little dye remains in the liposome. (C) The fraction of dye remaining in liposomes with various pore sizes as a function of time. Concentrations exponentially decay, with dye escaping faster from liposomes with larger pores (the maroon line tends to zero faster than the dark blue line). (D) The rate of dye release, calculated by exponentially fitting curves from (C), increases linearly with pore size. The linear fit of the rate of dye release distribution (orange line) gives a dye release rate constant of 2.02 nm–1 s–1. (E) Plot of the corresponding half-lives of dye release.
Figure 2 with 5 supplements
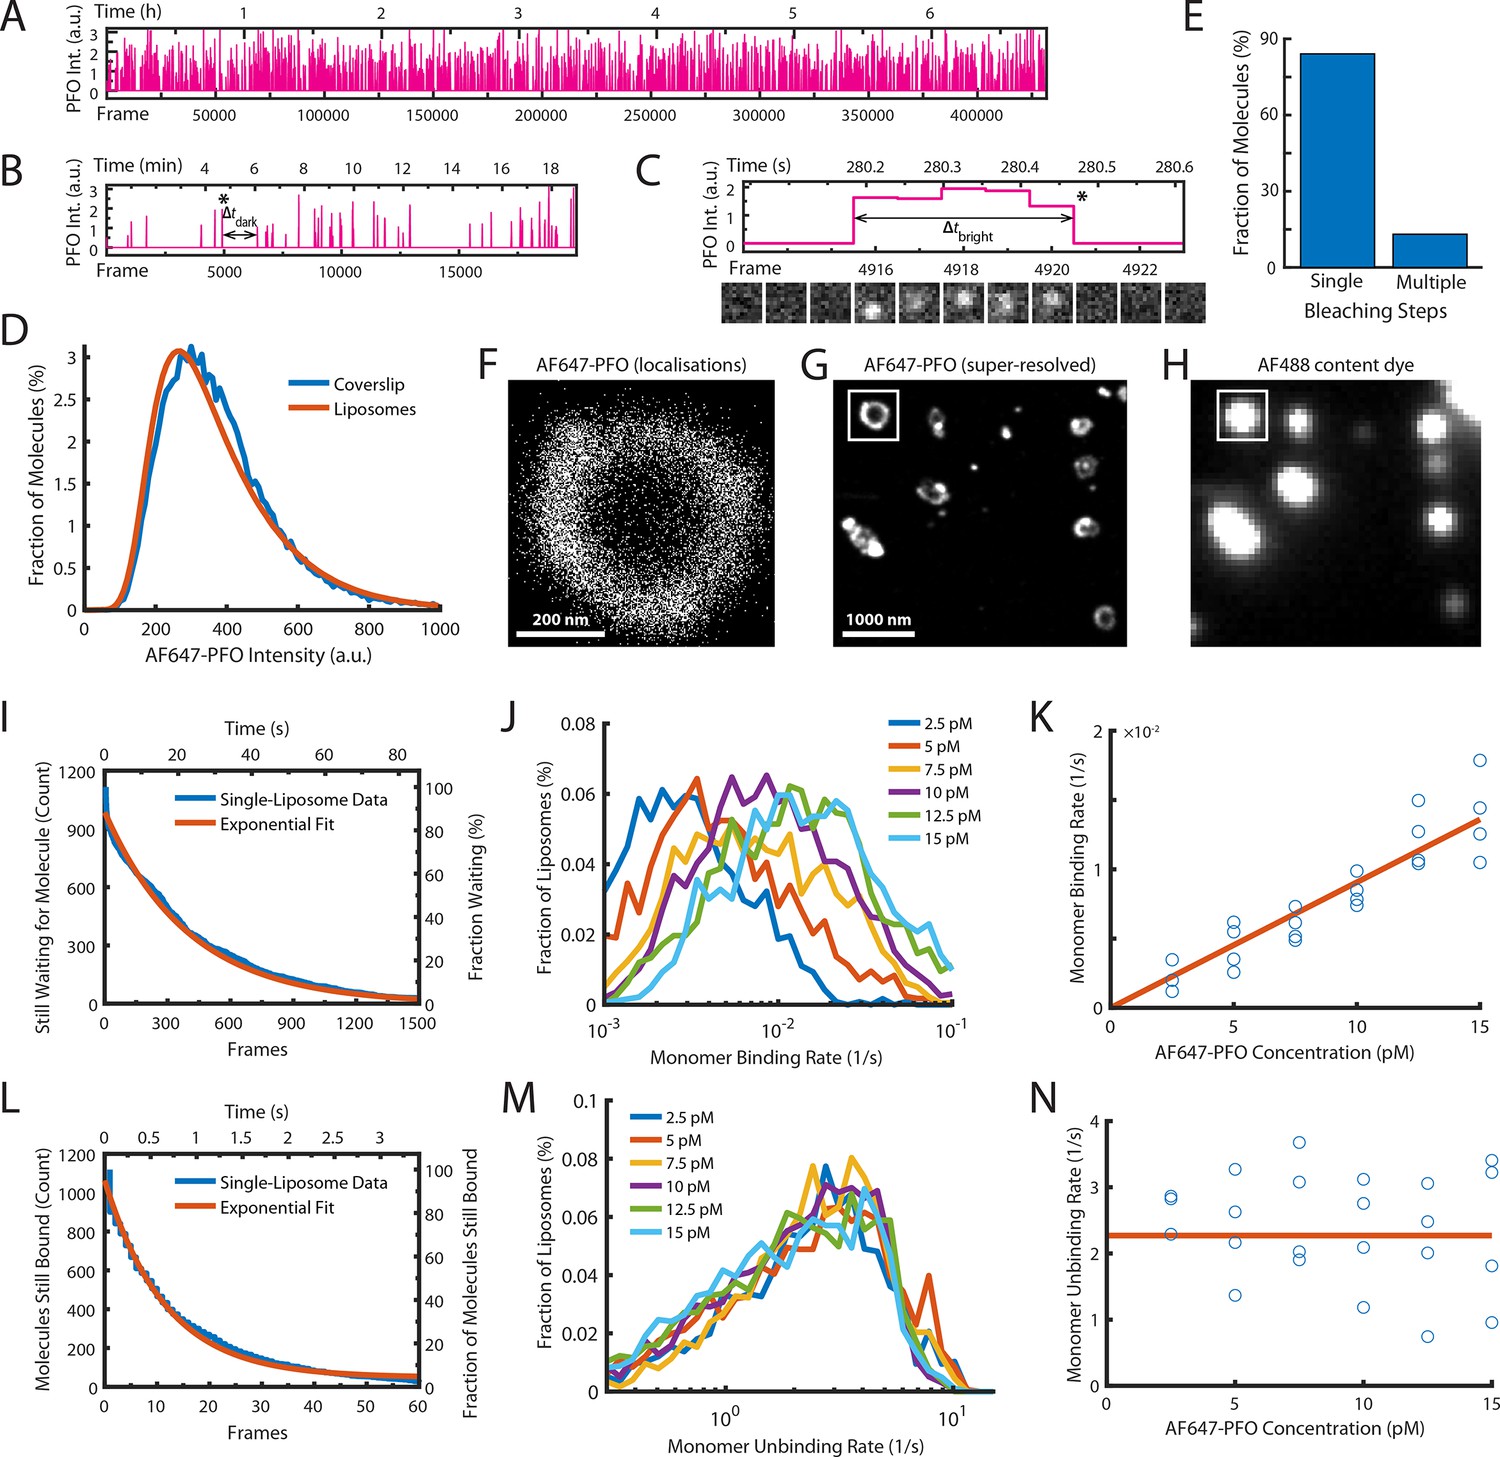
Single-molecule PFO binding to liposomes is short-lived.
(A–C) Trace of single AF647-PFO molecules detected at the location of a single liposome from a time series (432000 frames at 17.5 frames per second) acquired in the presence of 10 pM AF647-PFO. (A) Entire trace (6.8 hr). (B) Expanded view of the first 20 min. The double arrow indicates the waiting time (Δtdark) between the peak marked with an asterisk and the subsequent peak. (C) Expanded view of the peak marked with an asterisk in B. The double arrow indicates the duration (Δtbright) of a AF647-PFO molecule on the liposome. Snapshots (1.2 μm × 1.2 μm) of the molecule detected in 5 successive frames are shown below the trace. (D) Intensity distribution of AF647-PFO molecules bound to liposomes (orange line) or immobilised directly on a glass coverslip (blue). Intensities were determined from single frames using Picasso. (E) Photobleaching analysis of AF647-PFO molecules immobilised on a glass coverslip. The majority (84%) of AF647-PFO bleached in a single step confirming that they are monomeric. (D) and (E) show the pooled data from 40 fields of view. (F) Map of x/y-localisations determined by point-spread function fitting of single AF647-PFO molecules transiently binding to the same single liposome as in A-C. (G) Super-resolved image showing liposome outlines reconstructed from single AF647-PFO localisations. The reconstruction inside the box corresponds to the localisations shown in C. (H) Diffraction-limited TIRF image of the AF488 content dye of the same area as shown in D. An overlay of a larger region of the field of view in both channels is shown in Figure 2—figure supplement 1. (I–K) Analysis of AF647-PFO monomer binding. (I) Distribution of dwell times in the bound state (blue line) extracted from the trace shown in A. An exponential fit of the curve is shown in orange. The exponent of this fit (0.0025 frames–1) provides the monomer binding rate for this liposome. (J) Distributions of binding rates from all liposomes in the field of view measured at different AF647-PFO concentrations. (K) Monomer binding rates increase linearly with AF647-PFO concentration. Each data point represents the median binding rate determined from the corresponding distribution recorded in an independent TIRF image stack (3 experiments at 2.5 pM, 4 experiments per concentration between 5–15 pM). The orange line represents a linear fit of the data, whereby the slope of the line provides an estimate of the monomer binding rate constant. (L–N) Analysis of AF647-PFO monomer unbinding. (L) Distribution of waiting times between molecules (blue line) extracted from the trace shown in A. An exponential fit of the curve is shown in orange. The exponent of this fit (0.086 frames–1) is corrected for photobleaching (0.0517 frames–1) and then taken as the monomer unbinding rate (0.0343 frames–1, 0.6 s–1) for this liposome. The photobleaching correction is validated in Figure 2—figure supplement 3. (M) Distribution of unbinding rates from all liposomes in the field of view measured at different AF647-PFO concentrations. (N) Monomer unbinding is independent of concentration. Each data point represents the median unbinding rate determined from the corresponding distribution recorded in the same 23 experiments as in K. The orange line represents the median of all experiments.
Figure 2—figure supplement 1
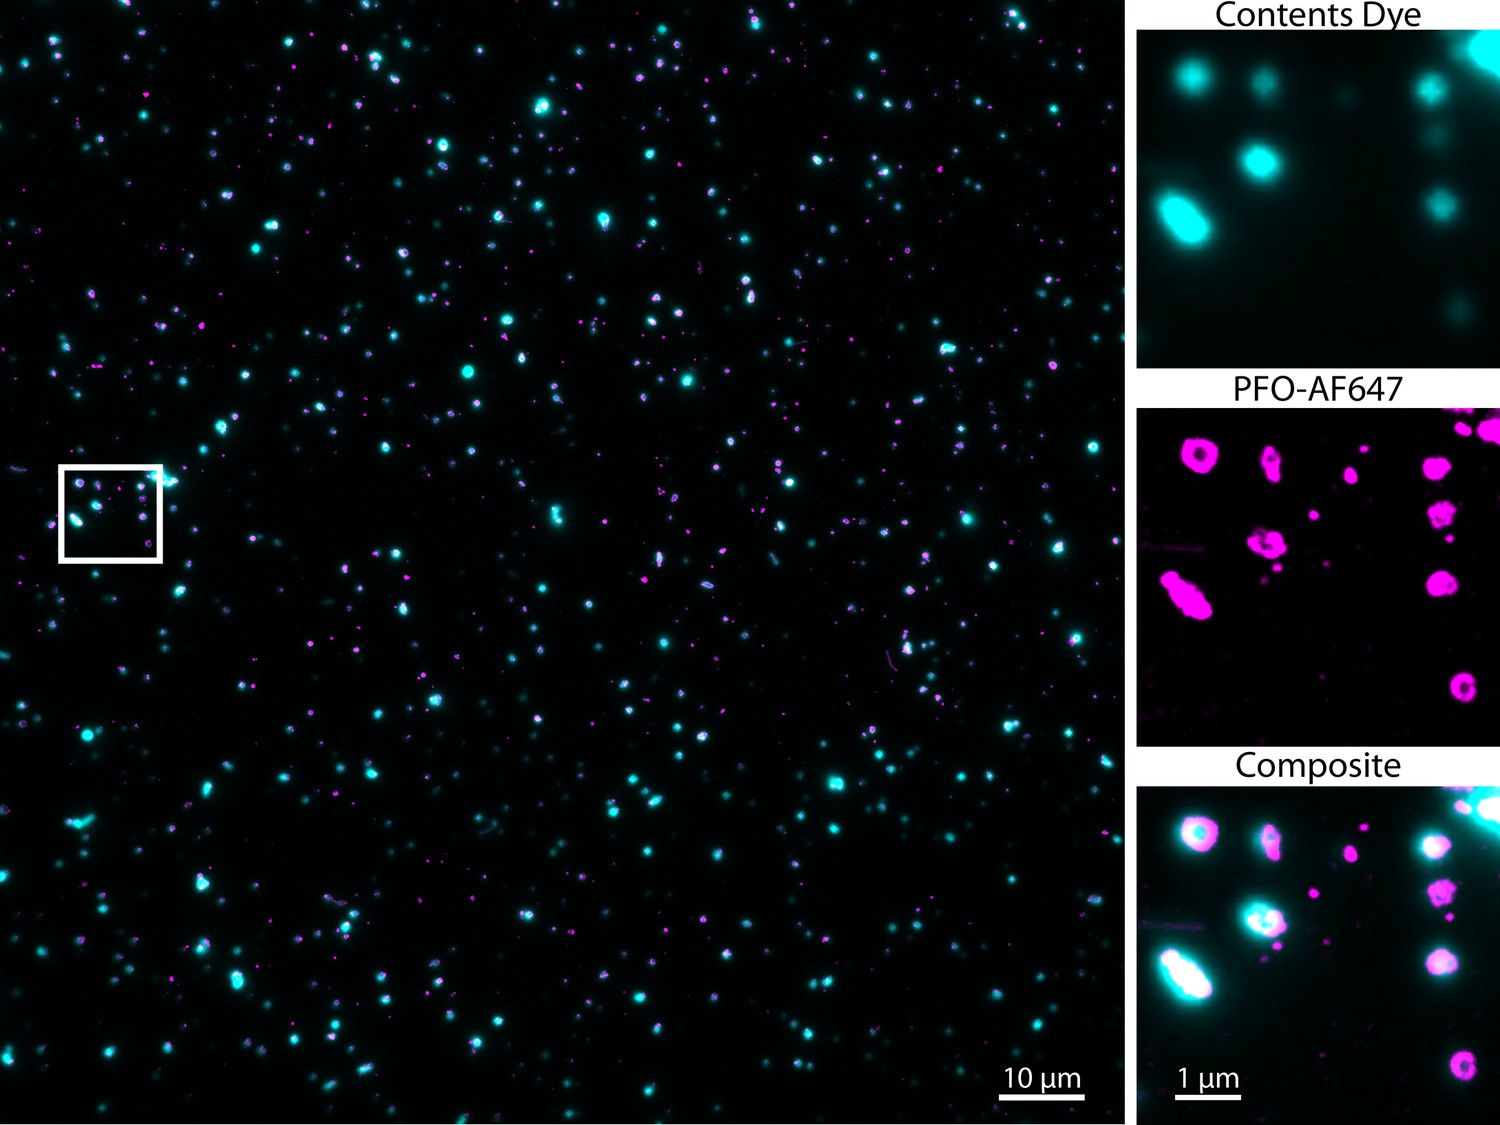
Single-molecule AF647-PFO binding events co-localise with Alexa Fluor 488-loaded liposomes.
Overlay of a super-resolved AF647-PFO image reconstructed from single-molecule localisations (magenta) and the corresponding TIRF image of Alexa Fluor 488-loaded liposomes (cyan); full field of view (left) and zoomed-in region (right) contained within the white box (corresponding to the region in Figure 2G/H). Localisations are determined by point-spread function fitting of AF647-PFO spots in each frame of a TIRF stack with 432000 frames acquired at a frame rate of ~17.5 frames/s in the presence of 10 pM AF647-PFO.
Figure 2—figure supplement 2
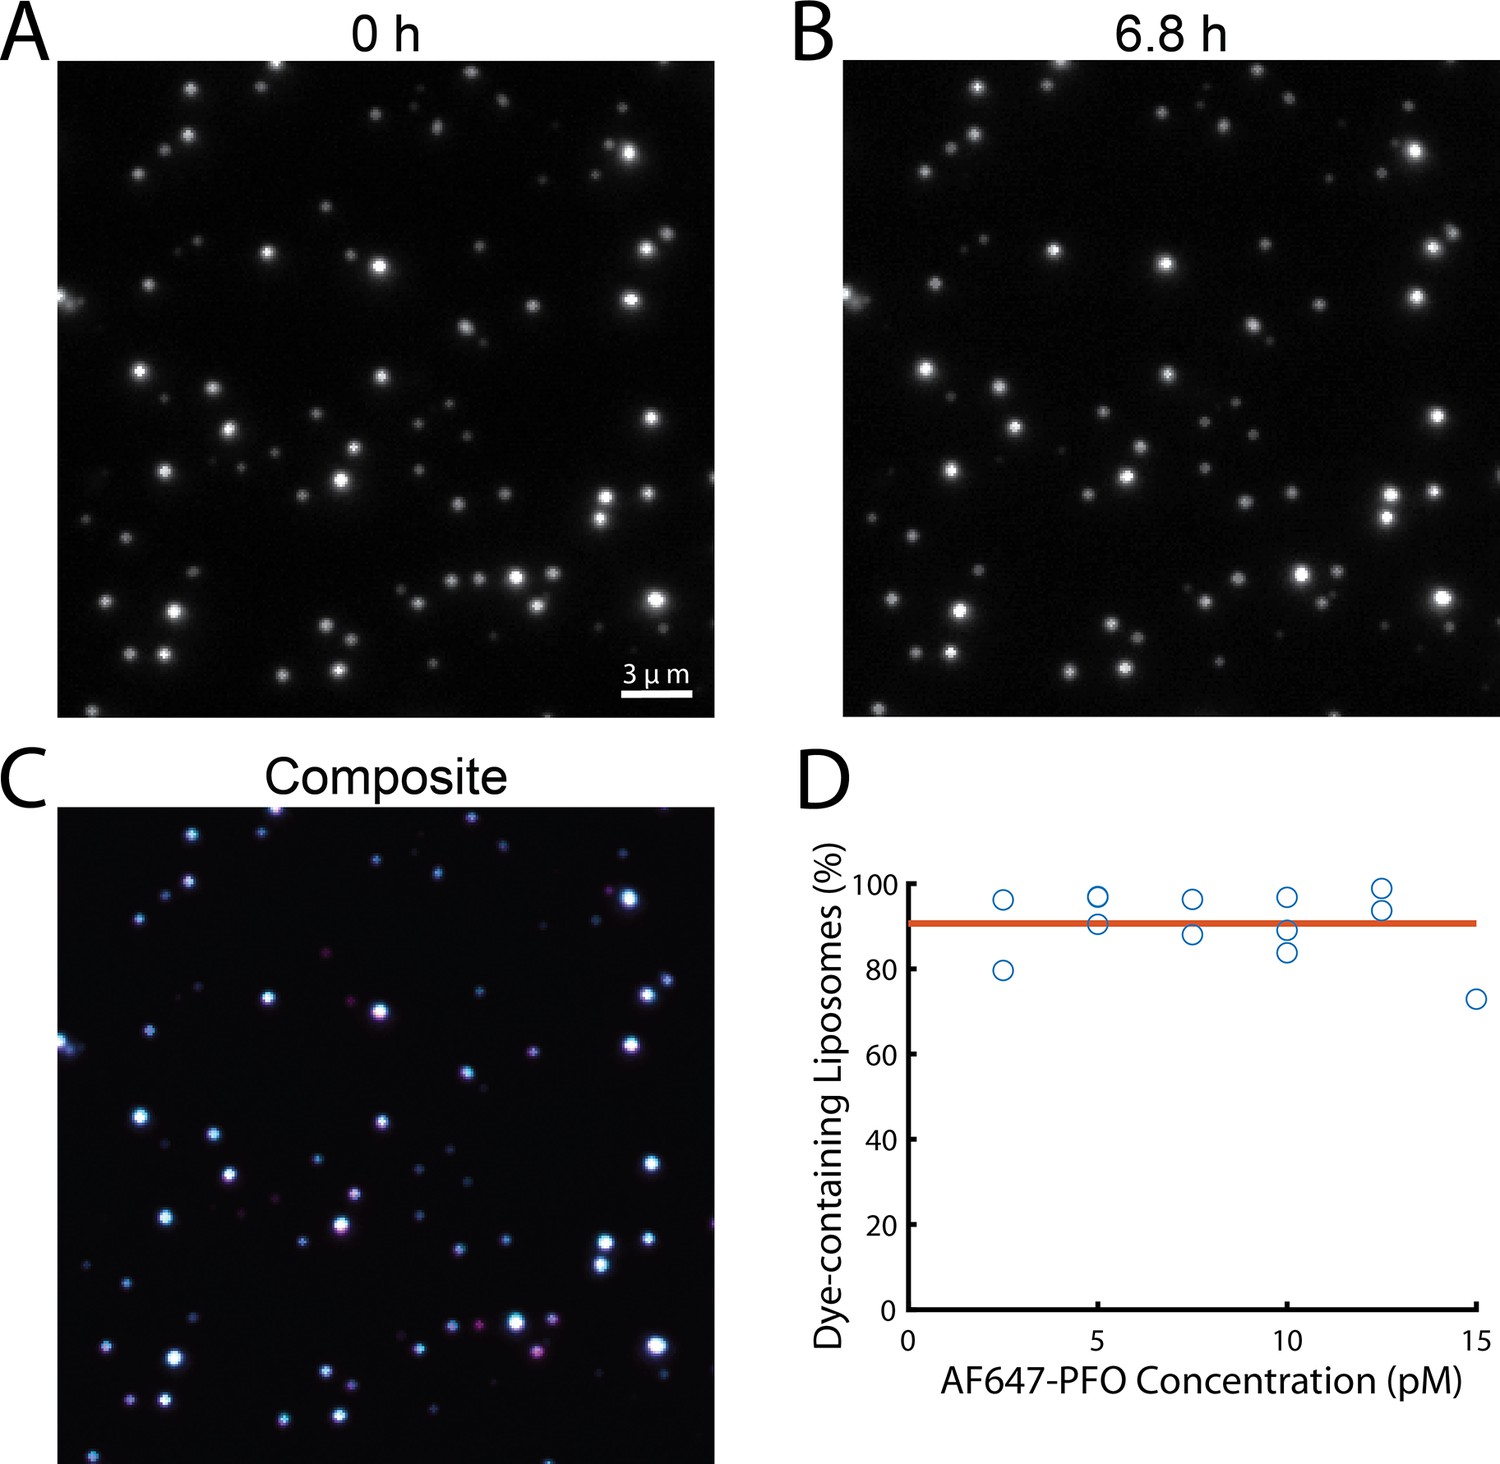
Liposomes retain their content dye during single-molecule PFO binding experiments.
(A–C) TIRF images from a time series recorded in the presence of 20 pM AF647-PFO at the beginning (A, 0 hr) and the end (B, 6.8 hr) of a single-molecule PFO binding experiment. The overlay (C) of both images shows that most liposomes retained the content dye during exposure to low concentrations of PFO for 6.8 hr. (D) Plot of the fraction of dye-containing liposomes remaining at the end of the single-molecule PFO binding experiments (2.5–15 pM AF647-PFO) with fit line (orange) showing that on average 91% of liposomes remain unperforated over the course of the experiment.
Figure 2—figure supplement 3
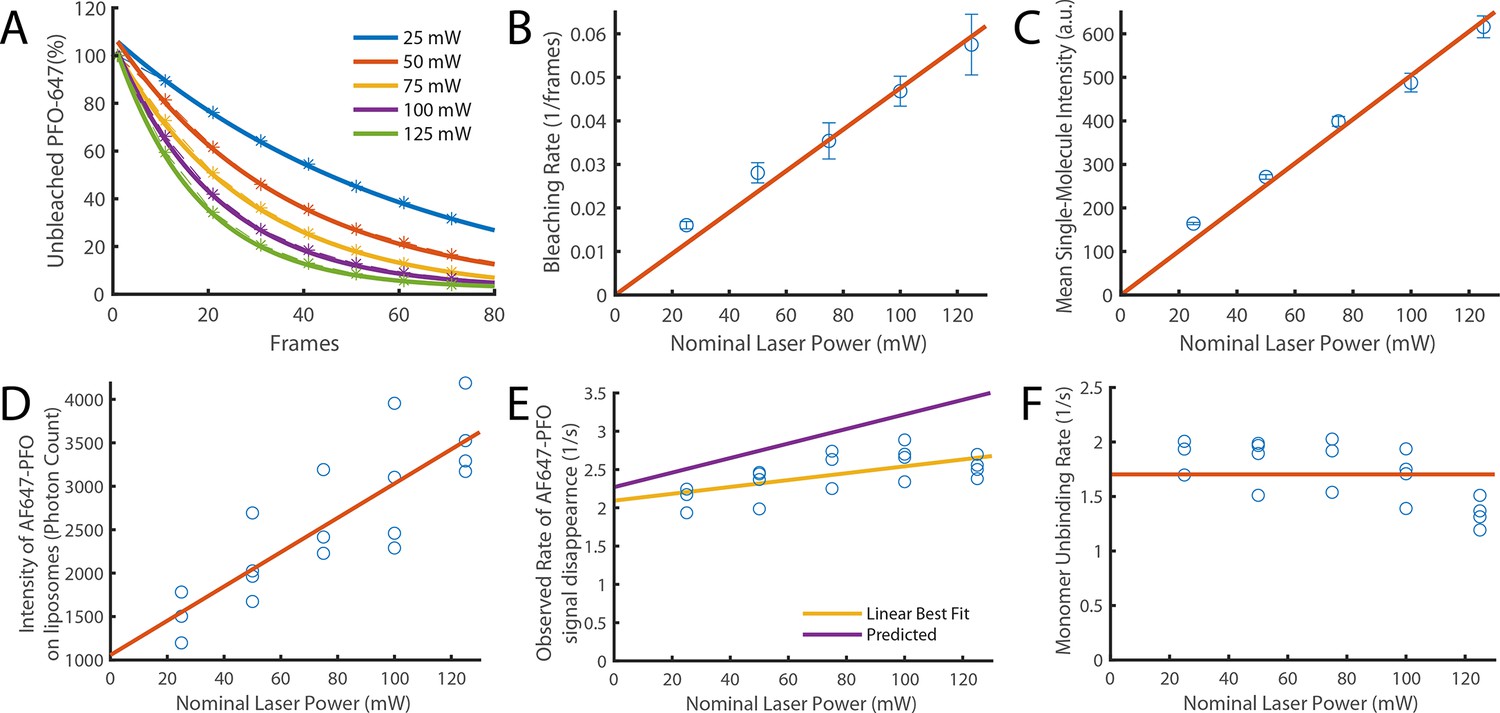
Validation of photobleaching correction of single-molecule unbinding rates.
(A–C) Single-molecule photobleaching experiments of AF647-PFO adsorbed onto the surface of a glass coverslip were performed at nominal laser powers between 25 and 125 mW and analysed using JIM. (A) AF647-PFO photobleaching curves with exponential fits to determine the bleaching rate at each laser power. (B) The bleaching rate increases linearly with laser power. The linear fit gives a bleaching rate constant of 4.75±0.8 x 10⁻⁴ mW–1 frame–1. (C) The intensity of molecules also increases linearly with laser power. Together these results confirm that the light dose for excitation of molecules increases linearly with nominal laser power. (D–F) Single-molecule binding experiments in the presence of 20 pM AF647-PFO were performed across the same range of laser powers. (D) The mean intensity of AF647-PFO signals on liposomes quantified using Picasso (expressed in photon counts) increases linearly with laser power. (E) The observed rate of signal disappearance of liposome-bound AF647 monomers is the combination of monomer unbinding and photobleaching and, as expected, increases linearly with the nominal laser power. The yellow line denotes the linear best fit, whereby the y-intercept is the monomer unbinding rate (2.1±0.2 s–1) and the gradient is the bleaching rate (4.5±3.7 x 10⁻³ mW–1 s–1 or 2.25±1.9 x 10⁻⁴ mW–1 frame–1). The purple line represents the predicted power dependence based on the monomer unbinding rate from Figure 2N (2.27 s–1) and the photobleaching rate calculated in panel B. (F) Data points from panel E after applying a photobleaching correction using the rate from panel B. The monomer unbinding rate is expected to be independent of the laser power. The red line denotes the mean of 1.7±0.3 s–1.
Figure 2—figure supplement 4
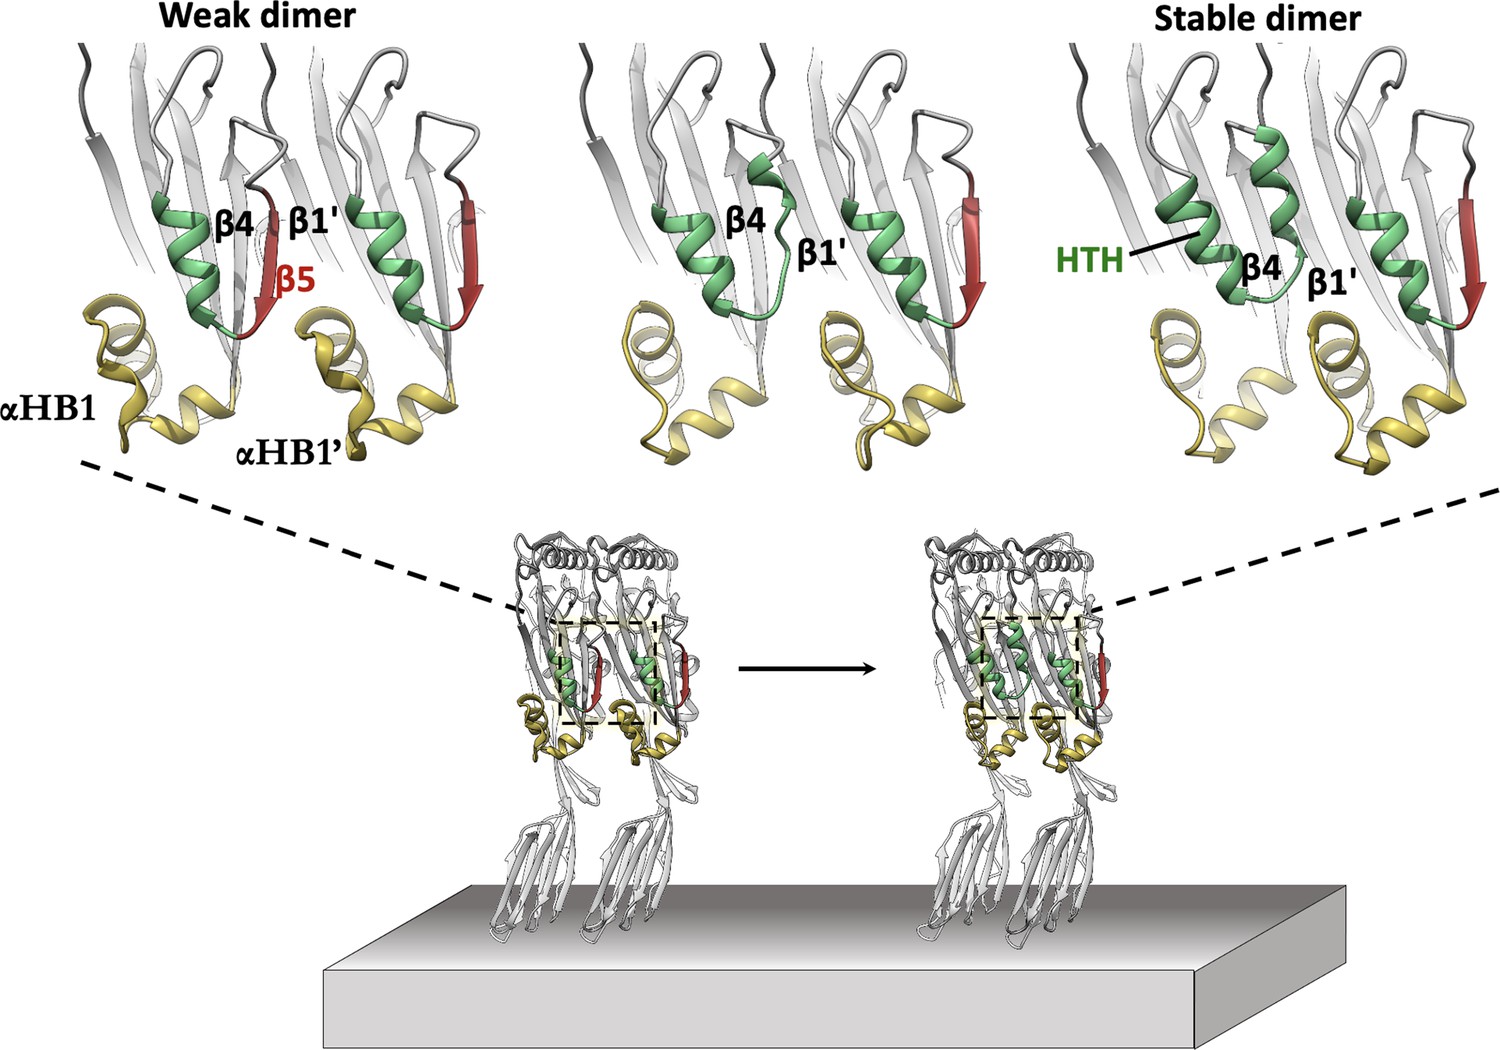
In silico modelling of early-stage PFO assembly and conversion to irreversible dimer (nucleation).
AlphaFold predictions of the PFO dimer interface suggest two conformational states exist. These are consistent with a weak transient dimer which ultimately causes strand β5 to move upon binding. The dimer transitions into a stable irreversible dimer where β5 has interconverted into the HTH motif and β4-β1’ hydrogen bonding defines the upper region of the nascent MACPF/CDC giant β-barrel. The predicted transient dimer formed before movement of strand β5 is reminiscent of the CDC dimers proposed on the basis of linear CDC oligomers (Lawrence et al., 2016; Lawrence et al., 2015).
Figure 2—video 1
Morphing movie of the two dimer conformational states predicted by AlphaFold.
Figure 3 with 1 supplement

AF647-PFO dimers can stably bind to liposomes.
(A,B) Trace containing a long-lived state detected at the location of a single liposome from a time series (2000 frames at 3 frames per minute) acquired in the presence of 10 pM AF647-PFO. Under these conditions, detection of short-lived monomers is rare. (B) Expanded view of the peak in A, with the corresponding snapshots (1.76 μm × 1.76 μm, average of 5 consecutive frames) shown below. (C,D) Diffraction-limited TIRF image of the AF488 content dye (C) and corresponding map of all x/y-localisations over time of the single AF647-PFO species (D) that remains bound to the liposome for the duration of the peak in panel A. The scatter of localisations reflects the diffusion of the species on the liposome surface. (E) Intensity distributions of long-lived states on liposomes (blue) and of immobilised AF647-PFO monomers on a glass (orange). The yellow dashed line is the theoretical distribution for AF647-PFO dimers calculated from the monomer intensity distribution. (F) Distribution of dwell times in the long-lived bound state (blue line) extracted from 1063 events acquired in five experiments. An exponential fit with a decay constant of 0.03 frame–1 is shown in orange. After correction for photobleaching (0.0133 frame–1), this analysis gives a dimer disappearance rate of Doff = 0.052 min–1.
Figure 3—figure supplement 1
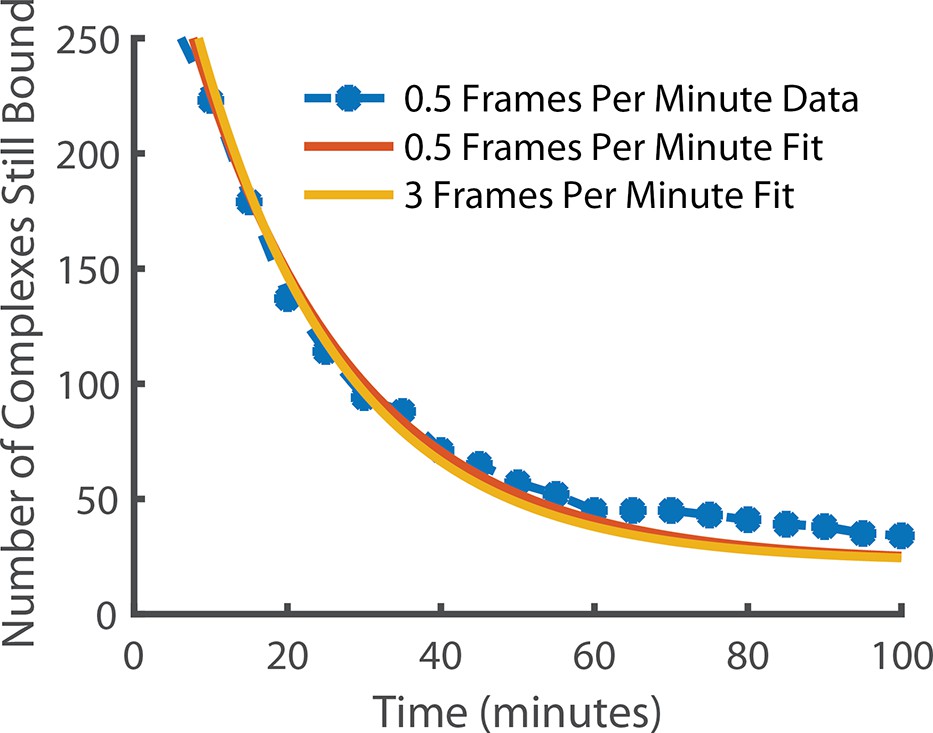
Comparison of state lifetimes for experiments run at 3 frames per minute and 0.5 frames per minute.
Decreasing the frame rate further to 0.5 frames per minute gave a release rate of 0.048 min–1 for the observed complex. For comparison, the 3 frames per minute release rate after photobleaching correction (0.052 min–1) is also shown. The exponential fit had a positive offset suggesting the existence of an even longer-lived state but it is incredibly rare (~6.4% of long-lived localisations) and so was in too few numbers to be meaningfully quantified.
Figure 4 with 3 supplements
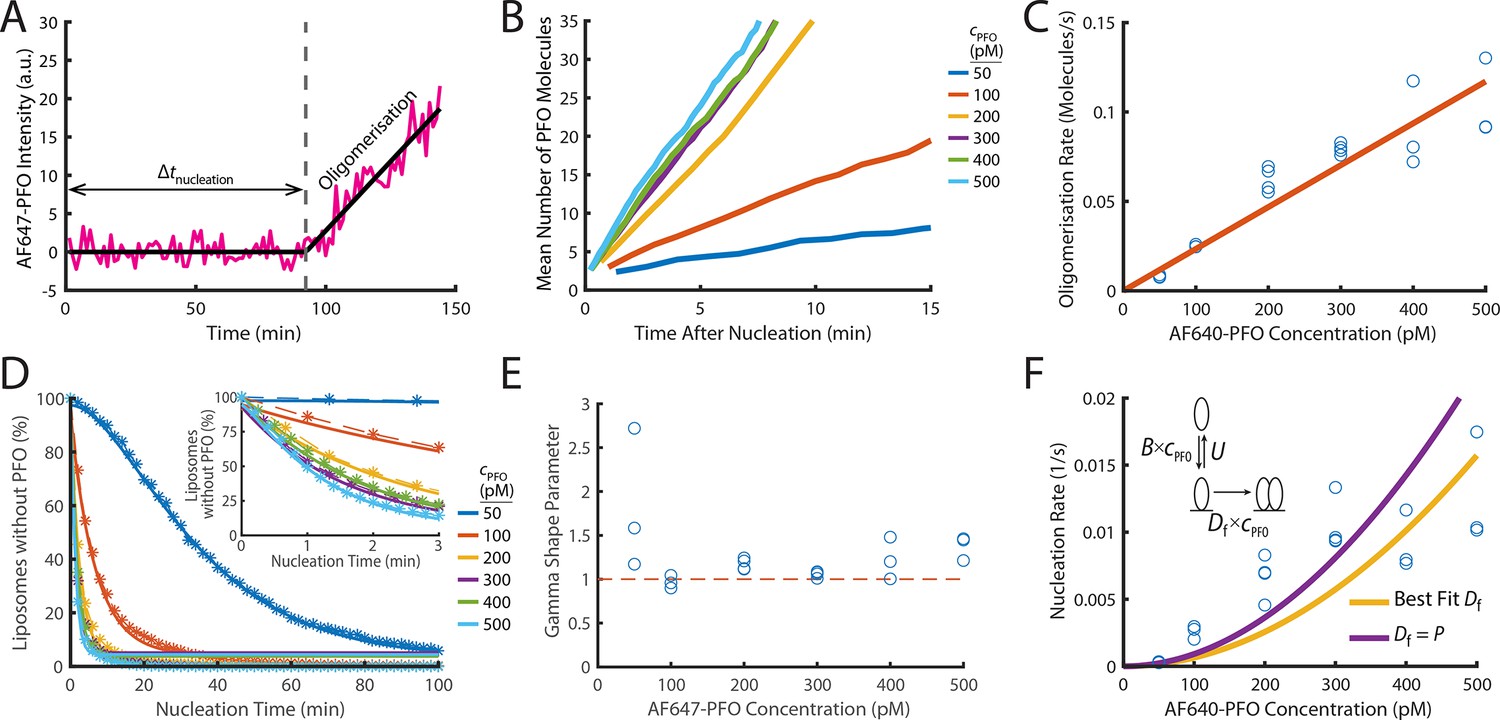
PFO nucleation and oligomerisation.
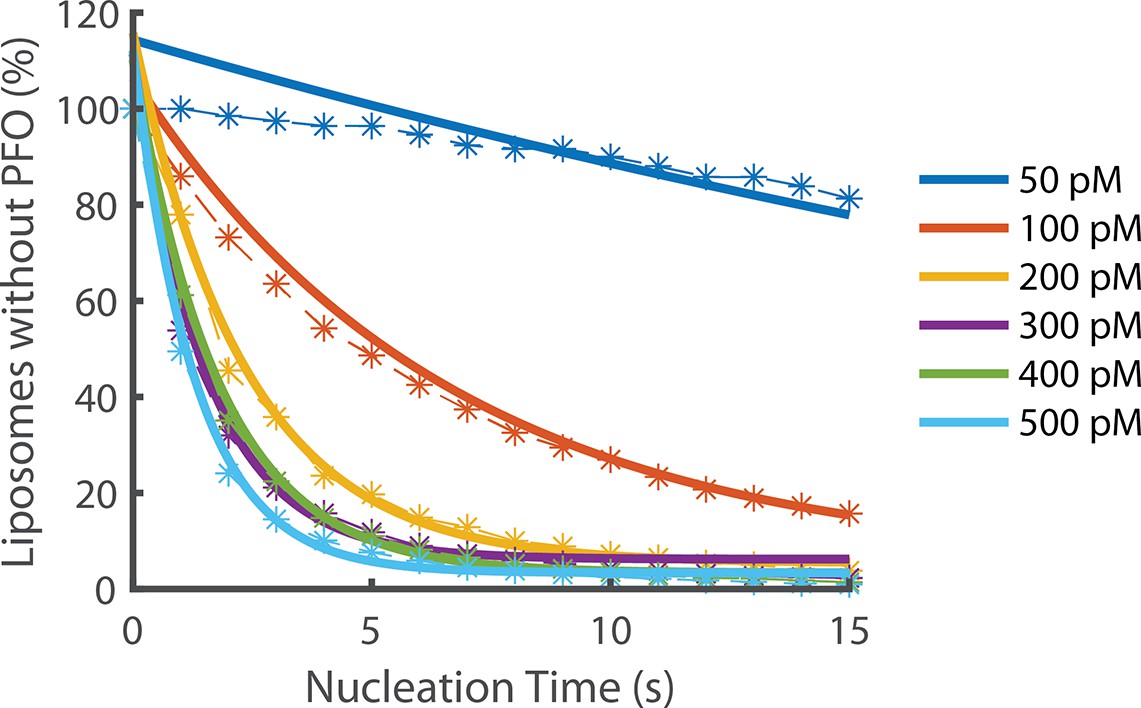
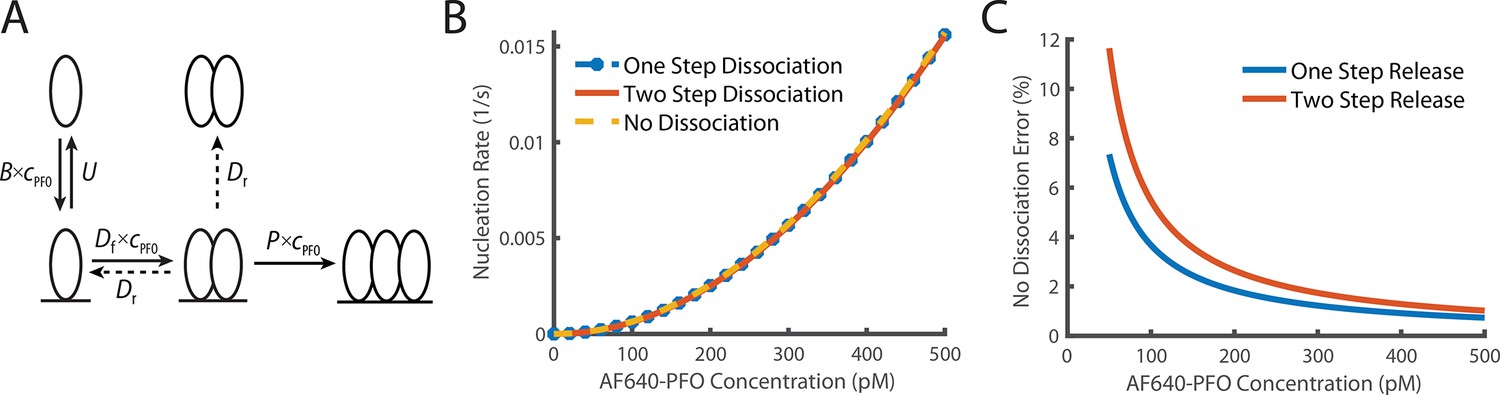
(A) AF647-PFO intensity trace of the early stages of PFO assembly showing fluctuations around the baseline (before nucleation) and signal increase due to oligomerisation (after nucleation). The slope of the linear fit line provides the oligomerisation rate. The nucleation time (Δtnucleation) is defined at the time where the oligomerisation fit line intersects the baseline. (B) The mean of all traces after they have been aligned to their time of nucleation displays a linear increase in intensity resulting from oligomerisation. (C) Oligomerisation rate as a function of AF647-PFO concentration; each data point represents the median oligomerisation rate determined in an independent PFO pore formation experiment (3 experiments for 50 pM, 100 pM, 400 pM, 500 pM; 4 experiments for 200 pM, 300 pM). The slope of the linear fit (orange line) provides the oligomerisation rate constant p=0.23 nM–1 s–1. (D) Experimental nucleation time distributions measured at different concentrations are represented by dashed lines with stars. Each distribution is an average of at least three experiments. Gamma distributions fitted to the experimental data are represented by solid lines. Inset shows a zoom in of the first 3 minutes (E) Gamma shape parameter vs. AF647-PFO concentration determined from the fits of the nucleation time distributions in (D). The gamma distribution fit to the nucleation times for 100–500 pM yielded a shape parameter of approximately 1 (mean of 1.09), consistent with a single rate-limiting step. A shape parameter of 1 is the equivalent to an exponential fit. In contrast, fitting the pooled 50 pM data required a shape parameter of 2.02, suggesting an additional step becomes rate-limiting at this concentration. (F) Nucleation rate as a function of AF647-PFO concentration. The value for Df was obtained by fitting (“Best fit”, yellow line), giving a value of 0.16 nM–1 s–1. Alternatively, the value for Df was assumed to be identical to the oligomerisation rate constant P=0.16 nM–1 s–1 (purple line). Inset: Kinetic model for predicting the concentration dependence of the nucleation rate, where B is the monomer binding rate constant, U is the monomer unbinding rate, Df is the dimerisation rate constant and cPFO is the PFO concentration. The values for B and U were obtained from the single-molecule binding experiments in Figure 2.
Figure 4—figure supplement 1
Exponential fits of nucleation rates.
Exponential decay functions (solid lines) were fitted to the experimental data to determine the nucleation rate at each concentration.
Figure 4—figure supplement 2
Comparison of dimer release models.
(A) Schematic demonstrating the two potential methods of dimer dissociation, the dimer falling directly off the membrane in one step, or a two-step process, where the dimer falls apart into two membrane monomers which can then individually dissociate. (B) Overlay of the predicted nucleation rate based on whether it is assumed that the dimer can dissociate as a one-step, two-step process or if it is assumed that the dimer does not dissociate. (C) The percentage difference between no dimer dissociation and the two other models. The difference is always less than 5% for values above 100 pM.
Figure 4—figure supplement 3
Direct measurement of PFO monomer addition using step fitting.
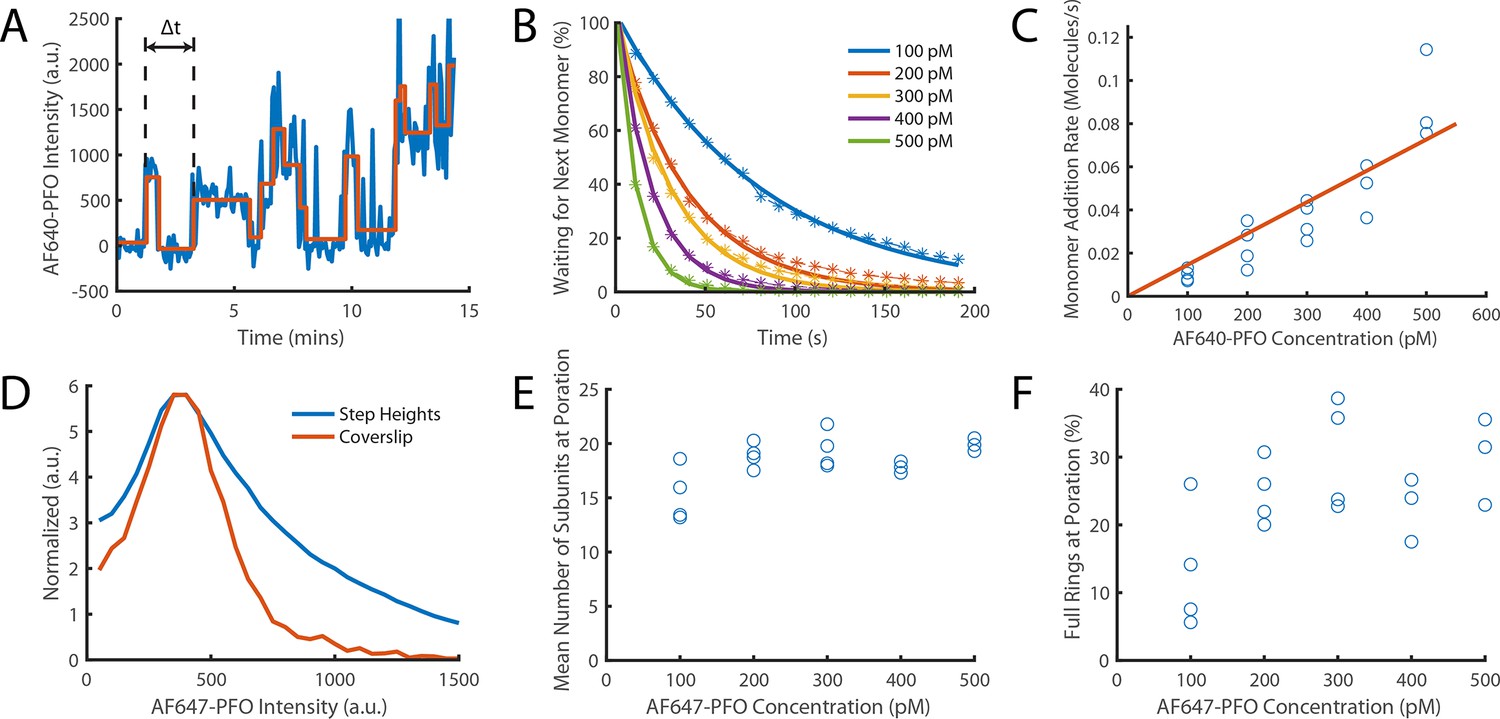
The PFO assembly and pore formation (dye release) dual colour TIRF microscopy assay using dye-loaded liposomes was carried out in the presence of 100–500 pM AF647-PFO at high temporal resolution (frame rate; exposure time 50ms) and with high 640 nm laser power (75 mW) to directly image the addition of AF647-PFO monomers to a membrane-bound oligomer on liposomes. (A) Example AF647-PFO intensity trace (blue) up to the time of dye release (dye intensity trace not shown). The addition of an AF647-PFO monomer to the membrane-bound oligomer is observed as a stepwise increase in intensity. The higher light dose (high laser power and high temporal resolution) required for single-molecule detection leads to photobleaching, observed as negative steps in the trace. The step fit of the trace using change point analysis is shown in orange. The waiting times between monomer addition events are determined as the time differences between successive positive steps (the first waiting time in the trace is labelled Δt). (B) Distributions of waiting times between positive steps recorded at AF647-PFO concentrations between 100–500 pM with exponential fits (solid lines). The exponent of each fit gives the rate of monomer addition for that concentration. (C) Plot of the monomer addition rate as a function of AF647-PFO concentration obtained from panel B. The linear fit line (orange) gave a monomer addition rate of 0.15±0.04 nM–1 s–1. The monomer addition rate determined here by step fitting represents an independent measurement of the oligomerisation rate (0.23±0.028, Figure 4C), whereby the lower value (by 35%) may be in part due to undetected short lived steps. (D) Distribution of positive step heights from all experiments compared to the intensity of single molecules bound to a coverslip. Both peaks occur at the same location, however, the step height distribution is broader (reflecting the increase in shot noise from multiple molecules) and has a longer tail in part due to missing short-lived steps. These missing steps are likely to account for the small reduction in oligomerisation rate measured in panel C compared to that measured in Figure 4C. (E) Mean number of positive steps (each corresponding to the addition of a monomer) before contents dye release. This analysis provides an intensity-independent estimate of the number of subunits in the oligomer at the time of membrane insertion (poration). The values plateau at similar values to Figure 6C (here ~18 versus ~21). (F) The percentage of full rings at poration, calculated using the number of liposomes with at least 35 positive steps before contents dye release. At high concentrations (≥200 nM)~25% of oligomers contain the number of PFO molecules required to form a closed ring, similar to the observations in Figure 6D. Four independent repeats were performed for 100 pM, 200 pM and 300 pM and 3 repeats for 400 pM and 500 pM.
Figure 5 with 1 supplement
The energetics of PFO oligomer membrane insertion depends on the number of subunits in the prepore.
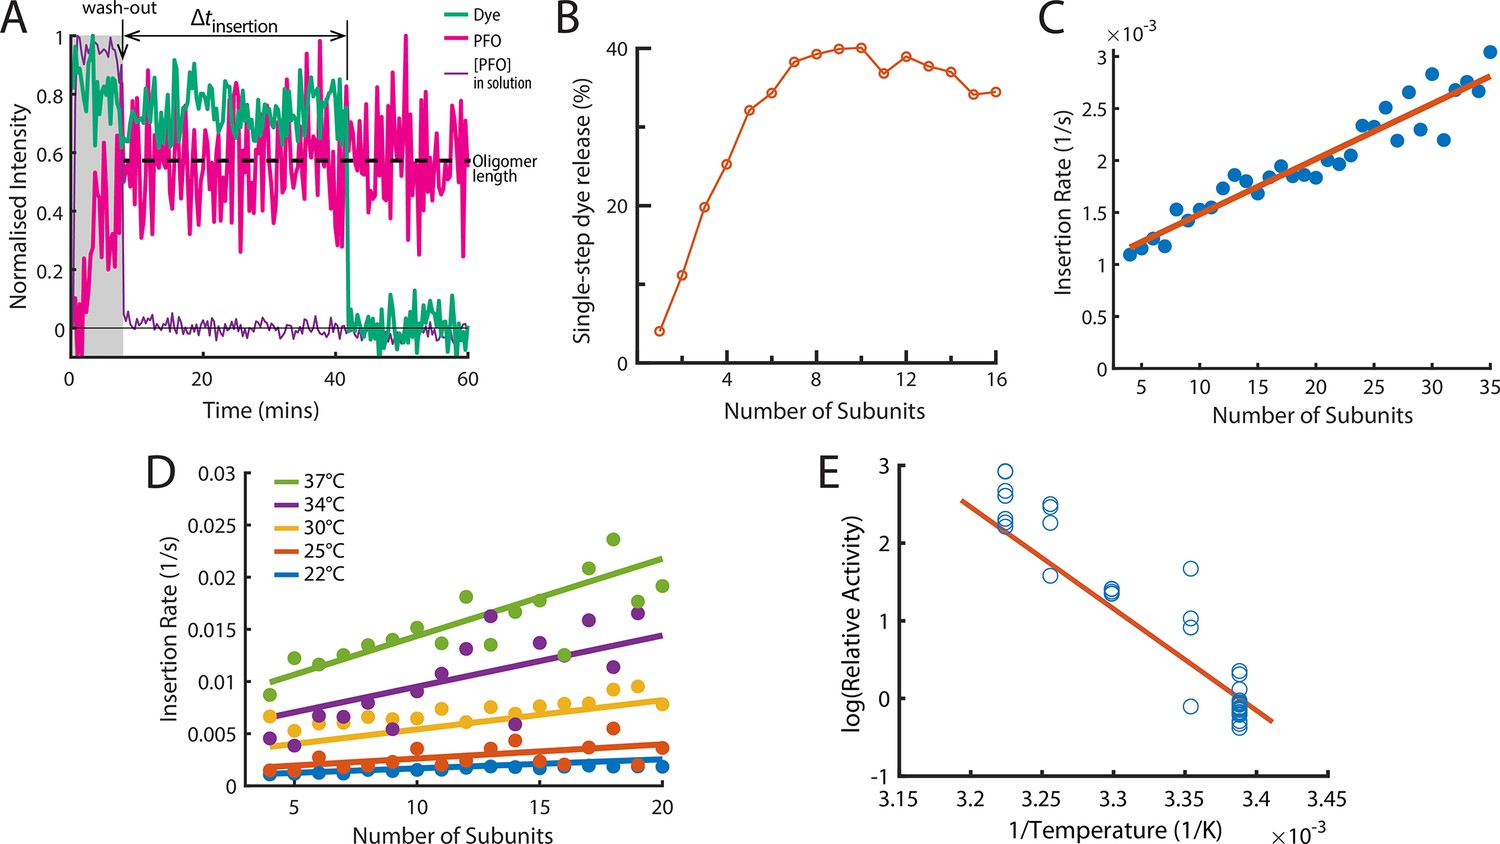
(A) Example trace of the AF647-PFO washout experiment. The purple line represents the background intensity of AF647-PFO in solution; the blue-green line represents the intensity of the AF488 content dye marker; the magenta line represents the AF647-PFO intensity on the liposome. The insertion time is determined as the waiting time between loss of the background signal (wash-out) and loss of content dye signal (pore opening). The AF647-PFO intensity at the time of wash-out (dotted line) was used to determine the number of subunits in the prepore. (B) Pore opening efficiency (determined as the fraction of liposomes that release the content dye in a single step) as a function of the number of subunits. (C) Insertion rate (determined from the exponential fit of the corresponding insertion time distribution) as a function of the number of subunits with a line of best fit. (D) Insertion rate as a function of the number of subunits determined at different temperatures. The fit lines were obtained by a global fit of the data (weighted on the basis of the number of liposome observations), whereby the only free parameter of the fit is proportional to the activation energy. (E) Arrhenius plot of the relative activity of insertion (blue data points) obtained from the slopes of local fits of the data in D. The slope of the orange line is obtained from the parameter value obtained from the global fit in D. Temperature data consists of 18 experiments at 22 °C, 4 experiments at 25 °C, 5 experiments at 30 °C, 4 experiments at 34 °C, and 8 experiments at 37 °C.
Figure 5—figure supplement 1
Number of subunits in the PFO oligomer during washout.
(A) Distribution of the number of liposome-bound PFO molecules determined for all liposomes in the field of view. (B) Distribution of the number of subunits in PFO oligomers that proceed to insert into the membrane after AF647-PFO wash-out from solution. (C) Mean intensity of AF647-PFO oligomers bound to liposomes in the field of view as a function of time after wash-out of AF647-PFO from solution (blue line). The decay over time of the mean AF647-PFO oligomer intensity does not exceed the decay expected for photobleaching (red line).
Figure 6 with 5 supplements

PFO insertion kinetics during continuous growth.
(A) The insertion rate of continuously growing PFO arcs depends on the number of subunits in the arc (n) and the concentration of AF647-PFO in solution (cpfo) and is given by: I(n,cpfo) = I0+n(Ig0 +cpfo × Igc) where I0, Ig0 and Igc are the kinetic parameters for insertion (See Figure 6—figure supplement 1). (B) Kinetic model used to predict the number of subunits in the prepore and the insertion kinetics. Dimerisation is the committed step for continued oligomerisation. Arcs with at least four subunits can insert into the membrane (or continue to grow), whereby the insertion rate increases with the number of subunits in the prepore (A). The parameter values were obtained from experiment and are shown in Table 1. (C) Mean number of subunits at the time of poration as a function of AF647-PFO concentration. Each data point is the mean from an independent experiment. The orange line shows the prediction from the model in B. (D) Fraction of complete rings formed at the time of poration. (E) Mean time from nucleation to poration as a function of AF647-PFO concentration. The orange line shows the prediction from the model in B. (F) Oligomerisation kinetics are the same before (yellow) and after (orange) poration. The fit line of the oligomerisation kinetics measured after nucleation (Figure 3D) is shown as a dashed blue line. The graphs in A, B, C, D, E, F are derived from the same data as Figure 3 (3 experiments for 50 pM, 100 pM, 400 pM, 500 pM; 4 experiments for 200 pM, 300 pM).
Figure 6—figure supplement 1
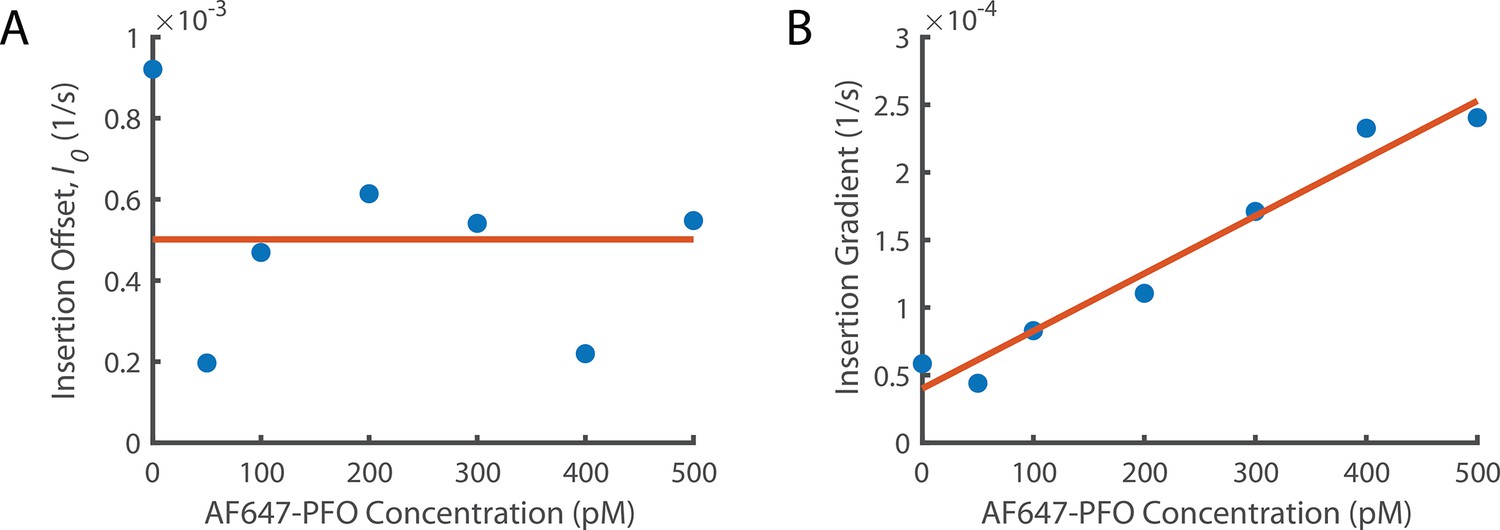
Fitting Concentration Dependence of Insertion.
(A) The insertion offset is the y intercept of all linear fits in Figure 6A. (A) The insertion offset is the y intercept of all linear fits in Figure 6A. The y intercept from the washout experiments (Figure 5C) is included as the point at 0 pM. These data points are fit with a constant since there is no obvious trend. (B) The change in gradient for the lines of best fit from Figure 6A as a function of concentration. We observe that the gradient increases linearly suggesting that the rate of increase of insertion with the number of subunits in the prepore increases with PFO concentration. The y-intercept of the linear fit (orange line at 0 pM concentration) gives the insertion constant (Ig0) the rate of increase in insertion rate with the number of subunits in the prepore in the absence of PFO. The gradient of this fit (Igc) is the increase of the dependence on the number of subunits in the prepore with PFO concentration.
Figure 6—figure supplement 2
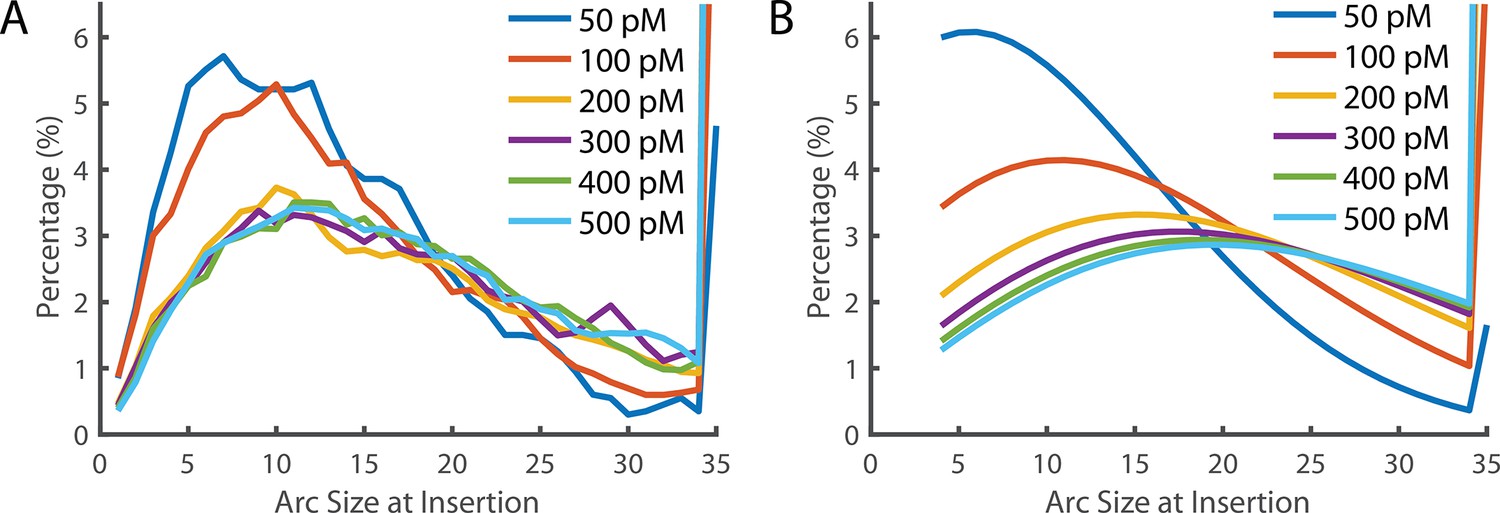
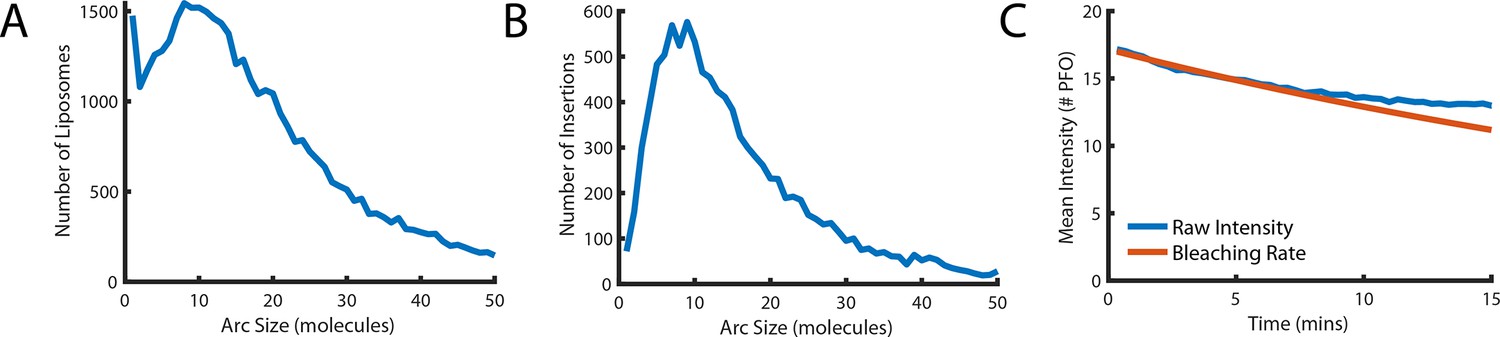
Arc size distribution at the time of Insertion.
(A) The experimentally measured distribution of arc sizes at the time of insertion. (B) The theoretical prediction of arc size distribution. At low concentrations, the distribution closely reflects the experimental observation. However, at higher concentrations, a greater number of subunits in the prepore were predicted than observed. A 35-mer is considered to be a full ring that cannot add additional subunits (hence these species accumulate). See also Figure 6D for the fraction of complete rings formed at different PFO concentrations.
Figure 6—figure supplement 3
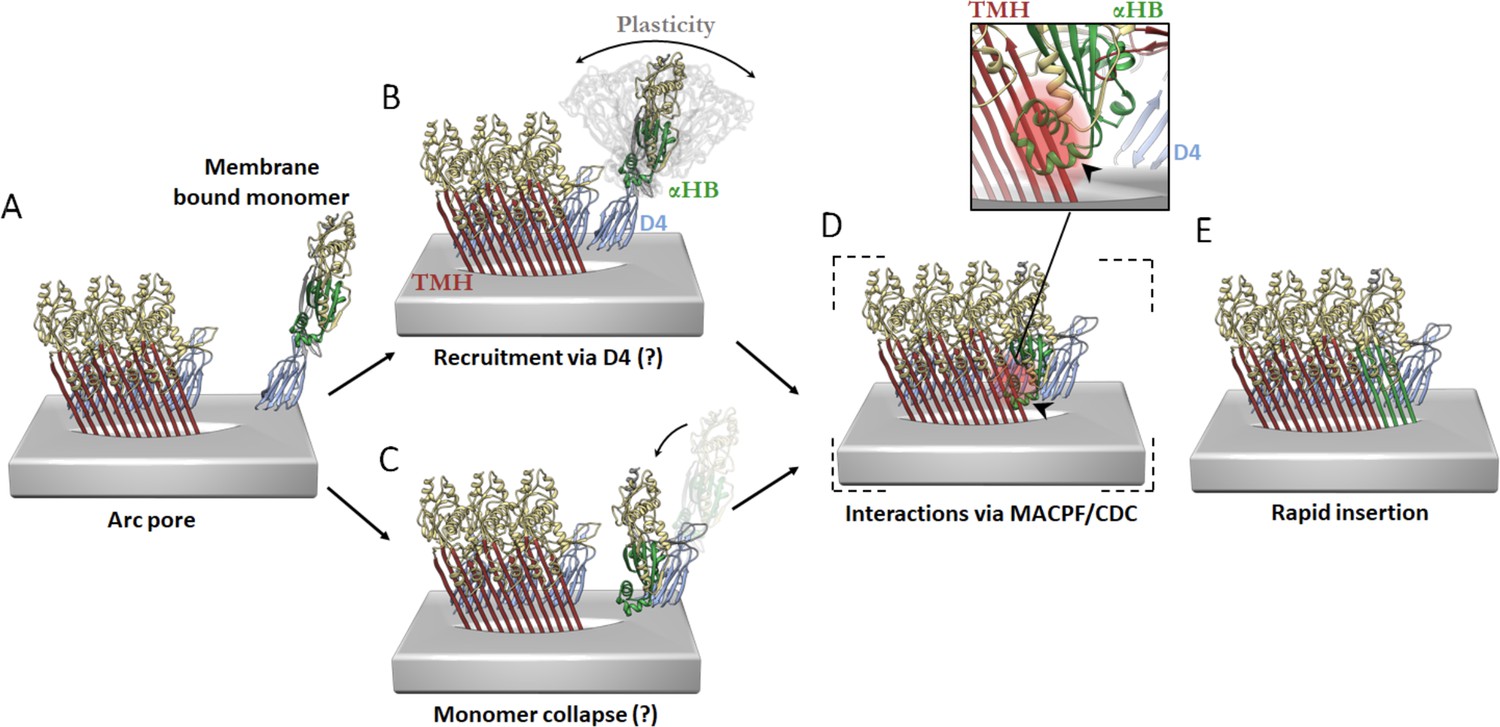
Hypothetical models of PFO pore growth for an inserted arc pore.
(A) An arc of inserted PFO (trans-membrane hairpin (TMH), red; D4, blue; D1/D2/D3, yellow; three PFO molecules shown for simplicity) recruits a monomeric PFO. In order for the β-barrel to form on a growing arc, the newly recruited monomer must undergo a vertical collapse, release of the α-helical bundles and unfurling of the β-hairpins. In the canonical prepore model (not shown), these processes are thought to be driven by interactions between the MACPF/CDC domains (consisting of D1 and D3) of adjacent subunits. In contrast, the interaction interfaces involved in the recruitment and conformational changes of a membrane-bound monomer for post-insertion arc growth are unknown, but may involve transient D4–D4 interactions, which have been postulated to form early in PFO assembly (van Pee et al., 2017; Wade et al., 2015b) and/or some of the interactions in D1 and D3 as seen in the linear oligomer structures (Lawrence et al., 2016; Lawrence et al., 2015). These possible models are described as follows. (B) Monomeric PFO is flexible about the hinge region between D4 and the rest of the PFO molecule (as shown in molecular dynamics simulations Reboul et al., 2014). This flexibility enables monomer collapse after recruitment. (C) Alternatively, membrane bound monomers are capable of collapse prior to recruitment, thereby positioning the MACPF/CDC domain appropriately for direct interactions at the MACPF/CDC interface. The trigger for PFP collapse in the alternative pathways shown in B and C are unknown, but may involve the local environment of the toroidal pore. (D) Subsequent more substantive interactions may then be mediated by interdomain contacts of the MACPF/CDC interface. Therefore, a putative collapsed intermediate is postulated to exist whereby collapse precedes unfurling of the α-helical bundles (α-HB) required to form transmembrane hairpins (TMH). Simple rigid body fit of the PFO crystal structure (PDB 1PFO) into the cryoEM reconstruction of the pneumolysin pore (EMD-4118) reveals a sterically forbidden clash of α-HB1 (black arrow/red glow) occurs with strand β4 of the adjacent PFO (inset). This model suggests any conformational rearrangement of α-HB1/2 must occur shortly after or during collapse. (E) Full release of α-HB1 and α-HB2 results in the addition of a new inserted PFO monomer.
Figure 6—figure supplement 4
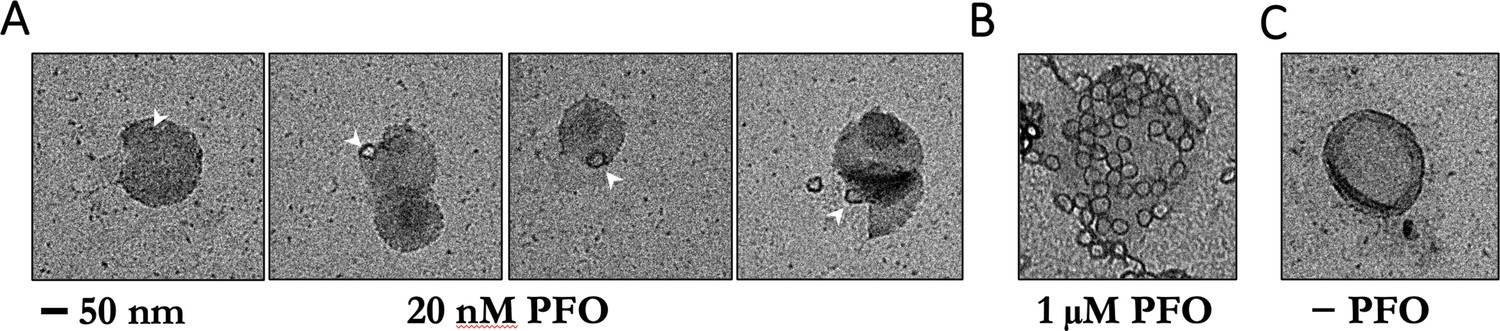
Negative-staining electron microscopy of PFO on POPC/cholesterol liposomes.
(A) Liposomes were incubated with 20 nM PFO for 30 min at room temperature in solution before deposition onto grids. Under these conditions, PFO oligomers were rare and appeared as single complete rings. No structures were observed on liposomes prepared with PFO concentrations in the pM range. PFO assembly on liposomes in solution for EM is likely to require higher concentrations than PFO assembly on surface-bound liposomes in the TIRF assay because of PFO depletion from solution in the former but not the latter experiment. We note that even though PFO is constantly resupplied by the microfluidic flow in our TIRF assay, measurements in the pM range require careful passivation of surfaces to prevent PFO loss due to non-specific adsorption, which can lead to failure of PFO assembly. (B) Liposomes incubated with 1 μM PFO show numerous rings per liposome. (C) Negative control, no PFO added. Scale bar; 50 nm.
Figure 6—figure supplement 5
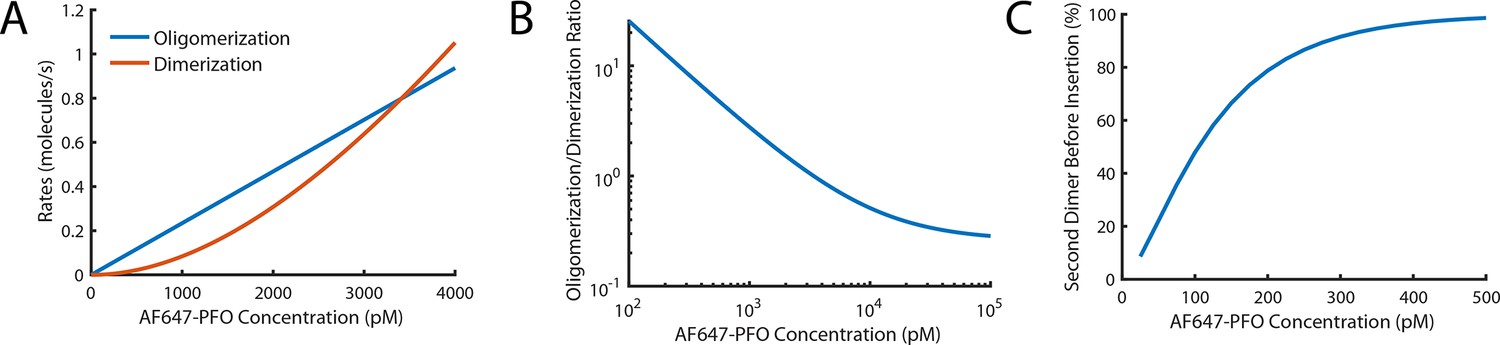
Probability of nucleating a second PFO oligomer on the liposome before the first oligomer has inserted into the membrane.
(A,B) Fits for oligomerisation and dimerisation rates extrapolated out to a PFO concentration of 4 nM (A) and log-log plot of the ratio of the oligomerisation rate to the dimerisation rate over a range from 100 pM to 100 nM (B). The plots show that monomer addition via oligomerisation is >20 fold faster than dimer formation at 100 pM, rates for both processes are equal at 3.4 nM and oligomerisation is fivefold slower than dimerisation at 100 nM. (C) Probability of forming a second PFO dimer (as a nucleus for an independently growing oligomer) on the liposome before the first oligomer has inserted into the membrane. This probability is calculated using the dimerisation rate and the nucleation to insertion time (calculated in Figure 6E). In the low concentration range used in this study (≤100 pM), the majority of liposomes have a single PFO oligomer at the time of insertion and pore opening. It is important to stress that the formation of a second PFO dimer on the membrane does not necessarily lead to two independent pores as it could in principle join the end of the existing oligomer before membrane insertion. As such, this calculation should be taken as an upper limit for the probability of observing two independently growing structures on the liposome membrane.
Figure 7 with 1 supplement
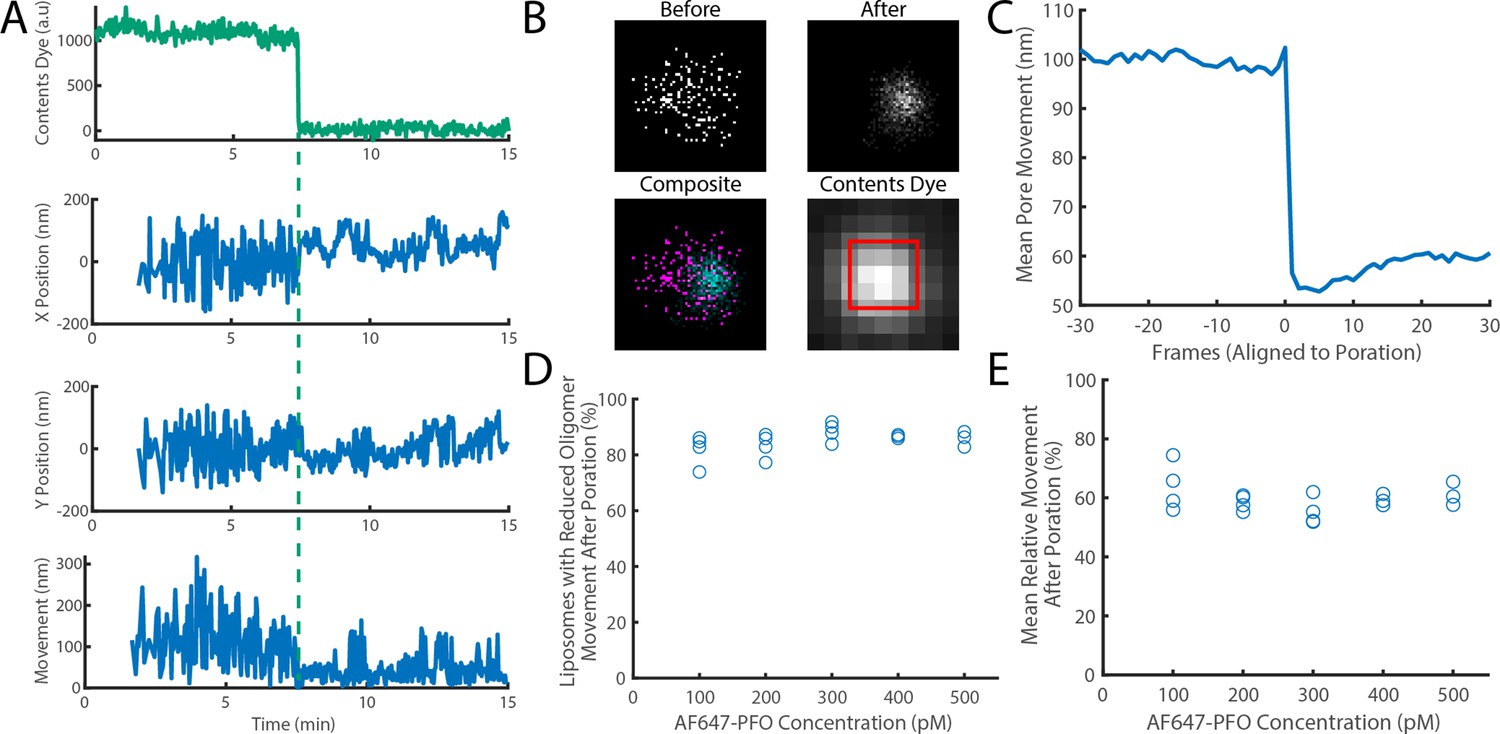
The movement of a PFO oligomer on the membrane decreases upon pore opening.
Dye-loaded liposomes were imaged in the presence of 500 pM AF647-PFO by dual-colour TIRF microscopy (1 frame every 2 s, 50ms exposure time). Pore opening was detected by release of the content dye while the x/y-localisations of the PFO oligomer assembling on the liposome were tracked by point-spread function fitting. (A) Example traces recorded at a single liposome showing (from top to bottom) content dye intensity, x-position, y-position and movement between frames. The positions in x and y were calculated relative to the centre of the bounding box of localizations. The movement was calculated as the Cartesian distance between x/y-positions in subsequent frames. Additional examples are shown in Figure 7—figure supplement 1. (B) Maps (440 nm × 440 nm) of PFO oligomer x/y-positions acquired before (top left) and after (top right) content dye release. The overlay of both maps (bottom left) shows localisations before and after content dye release in magenta and cyan, respectively. The diffraction-limited content dye signal (bottom right) colocalises with the x/y-position maps (map area indicated by the red square). (C) Trace of mean PFO oligomer movement obtained from all 11905 traces in this data set aligned to the frame of dye release (poration). (D) The fraction of liposomes that display a reduction in their average pore movement after contents dye release as a function of concentration. (E) The mean change in diffusion rate at different concentrations. Four independent experiments were performed at 100, 200, and 300 pM and three experiments at 400 and 500 pM.
Figure 7—figure supplement 1
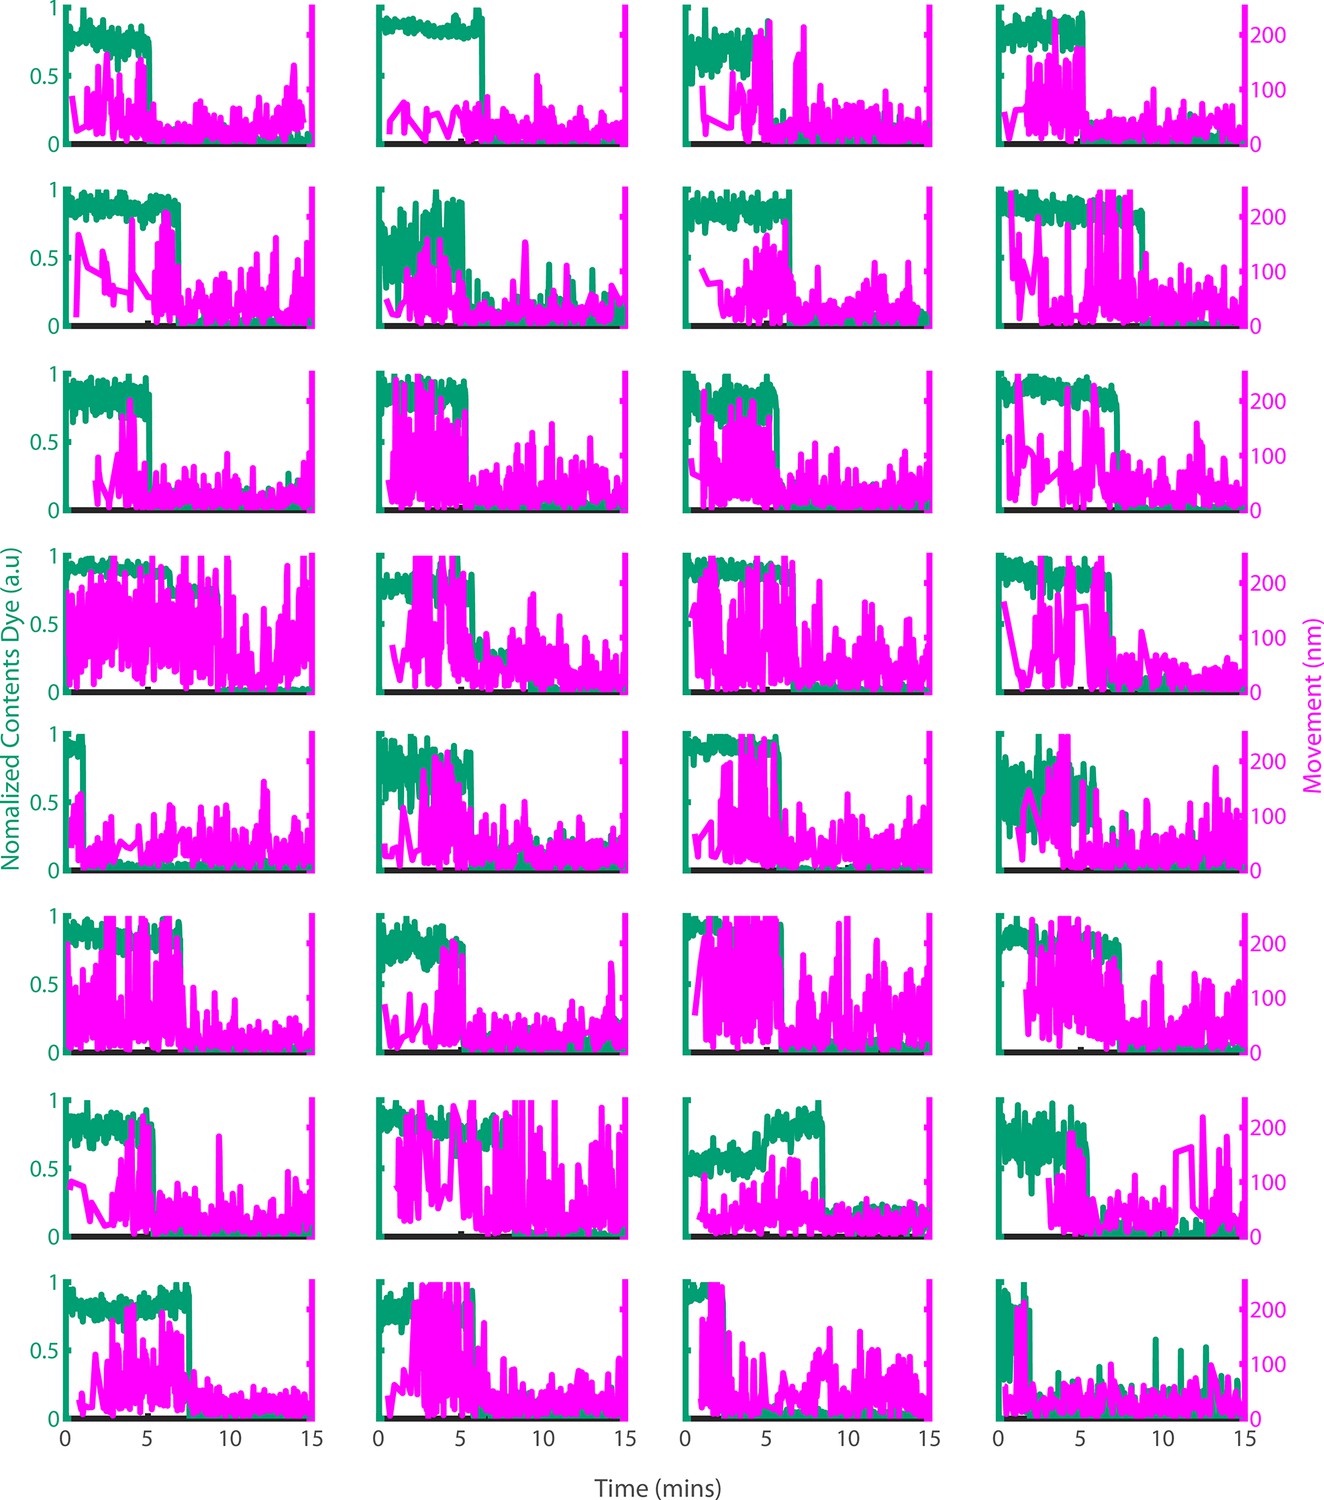
Example traces of PFO oligomer movement on liposomes before and after poration.
Dye-loaded liposomes were imaged in the presence of 500 pM AF647-PFO by dual-colour TIRF microscopy (1 frame every 2 s, 50ms exposure time, 2 mW 488 nm laser, 75 mW 640 nm laser). Pore opening was detected by release of the content dye while the x/y-positions of the PFO oligomer assembling on the liposome were tracked by point-spread function fitting. The movement of the AF647-PFO signal was calculated as the Cartesian distance between x/y-positions in subsequent frames. Shown are example traces recorded at single liposomes of the content dye signal intensity (blue-green) and the corresponding movement of the position of the AF647-PFO signal between frames (magenta).
Figure 8 with 2 supplements
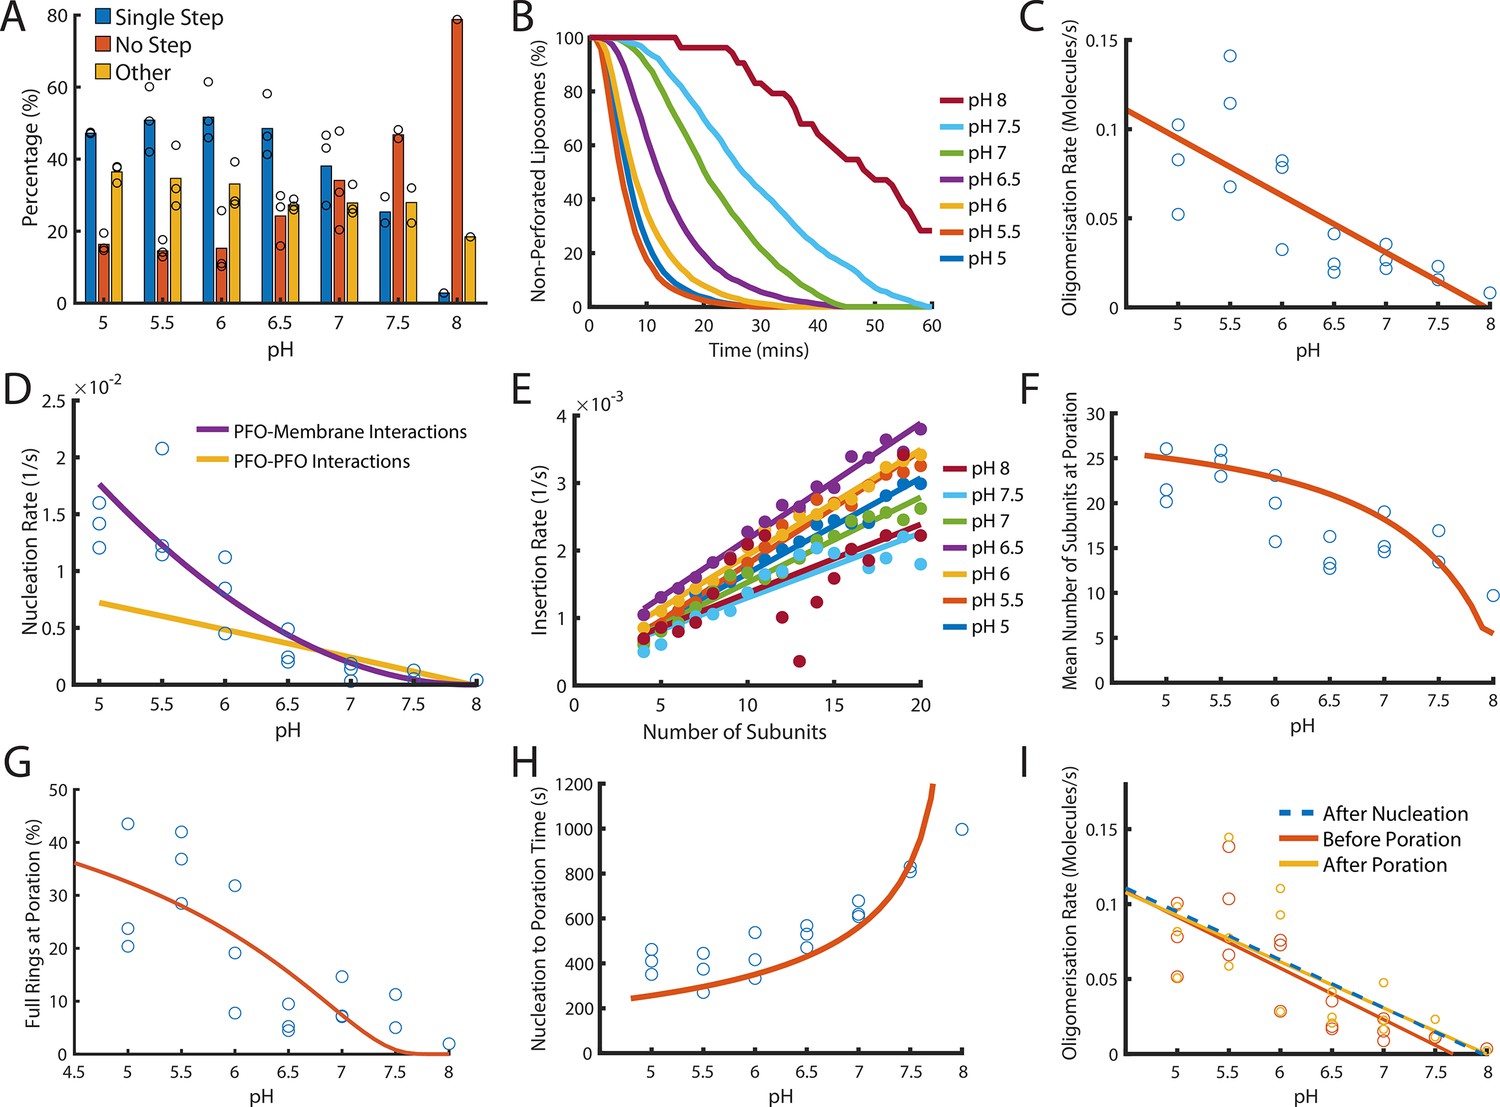
Dependence of PFO pore formation on pH.
Dual-colour TIRF pore formation experiments were carried out with 200 pM AF647-PFO. (A) AF647-PFO pore formation activity at 200 pM decreases with increasing pH resulting in a higher proportion of liposomes with no step. Fraction of liposomes with content dye traces classified as (1) single step, (2) no/little dye loss or (3) other. (B) The overall rate of pore formation decreases with increasing pH. (C) The oligomerisation rate decreases with increasing pH. The dependence is heuristically fit with a straight line. Control experiments confirmed that the intensity of AF647-PFO was independent of pH (Figure 8—figure supplement 2). (D) The nucleation rate decreases with increasing pH. The pH dependence of oligomerisation observed in (C) could result from pH affecting either the membrane-binding kinetics of monomeric PFO, or the lateral interaction between membrane-bound PFO monomers. These two scenarios give rise to different predicted nucleation dependence curves shown in purple and yellow, respectively. (E) Changing pH does not have a significant effect on the insertion kinetics. (F) The mean number of subunits in the prepore at insertion decreases with increasing pH. This dependence is predicted by taking the oligomerisation rate from (C), suggesting that pH does not affect insertion kinetics. (G) The percentage of full pores at time of poration decreases with increasing pH. The dependence is predicted using the oligomerisation rate from (B). (H) The nucleation to insertion time increases with increasing pH. The dependence is predicted using the oligomerisation rate from (B). (I) Oligomerisation kinetics at different pH are the same before (red) and after (yellowed) poration. The analysis of pH dependence is based on three experiments at each pH value between pH 5–7, two experiments at pH 7.5, and one experiment at pH 8. The orange lines in panels F-H represent fits of the model in Figure 6B using the pH-dependent oligomerisation rates in panel C.
Figure 8—figure supplement 1
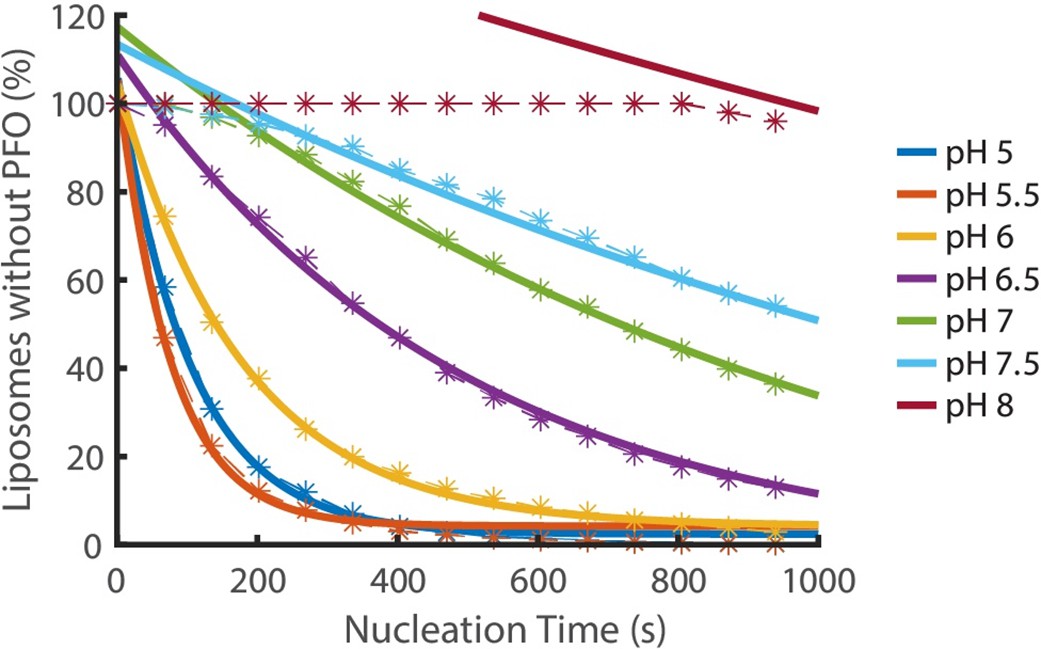
Nucleation kinetics decrease with increasing pH.
Distributions of nucleation times measured at various pH in the presence of 200 pM AF647-PFO. Experimental data represented by dashed lines with stars. Each concentration is an average of at least three experiments. Exponential decay functions (solid lines) were fitted to the experimental data to determine the nucleation rate at each concentration.
Figure 8—figure supplement 2
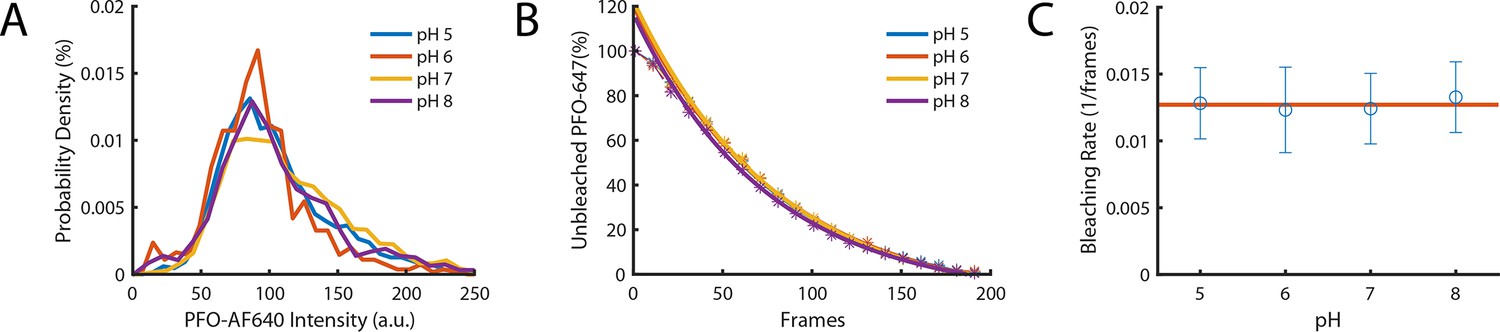
The intensity of PFO-AF647 is independent of pH.
(A) The distribution of single-molecule intensities measured using single-molecule photobleaching for different pH buffers (pH 5, pH 6, pH 7, and pH 8). Data comprises 10 fields of view for each concentration. (B) The distributions of single molecule bleaching times obtained at different pH values are overlaid with exponential fits. (C) The corresponding bleaching rates from the exponent of the fits in panel B. The red line denotes the mean bleaching rate for all pH values.
Appendix 1—figure 1
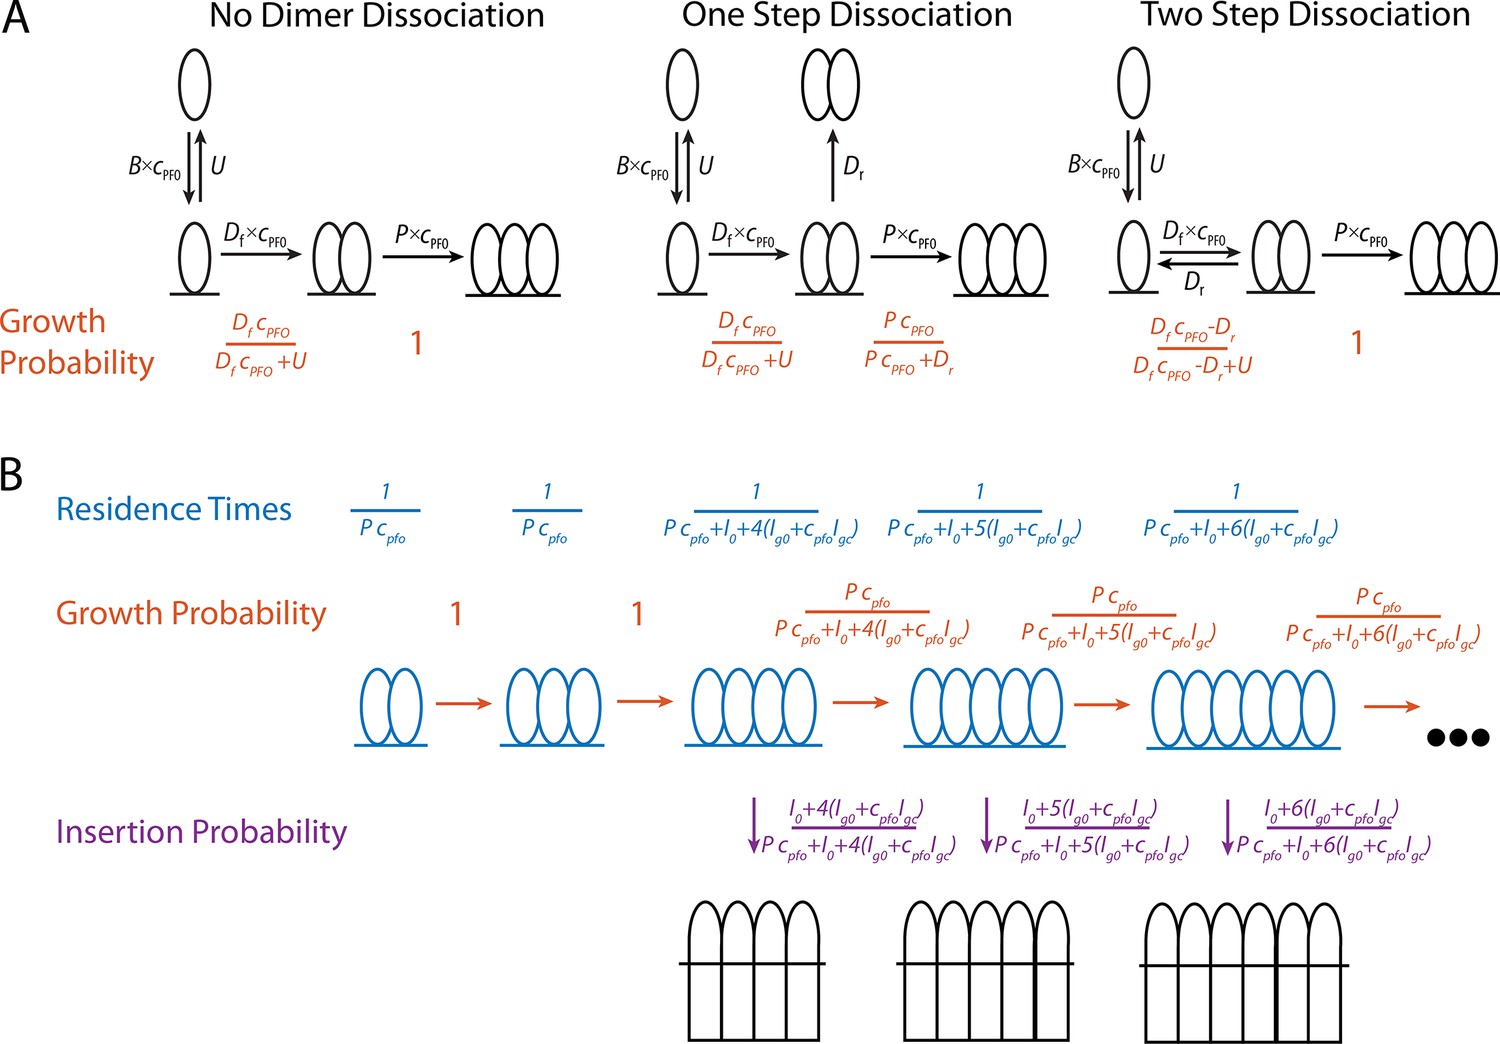
Mathematical modelling of PFO.
(A) Schematics of the nucleation pathway for different scenarios of dimer dissociation (B) The residence times, and transition probabilities, of each state in the pore formation pathway. These are used to calculate the distribution of the number of subunits in the prepore at the time of insertion as well as the nucleation to insertion times.
Appendix 1—figure 2
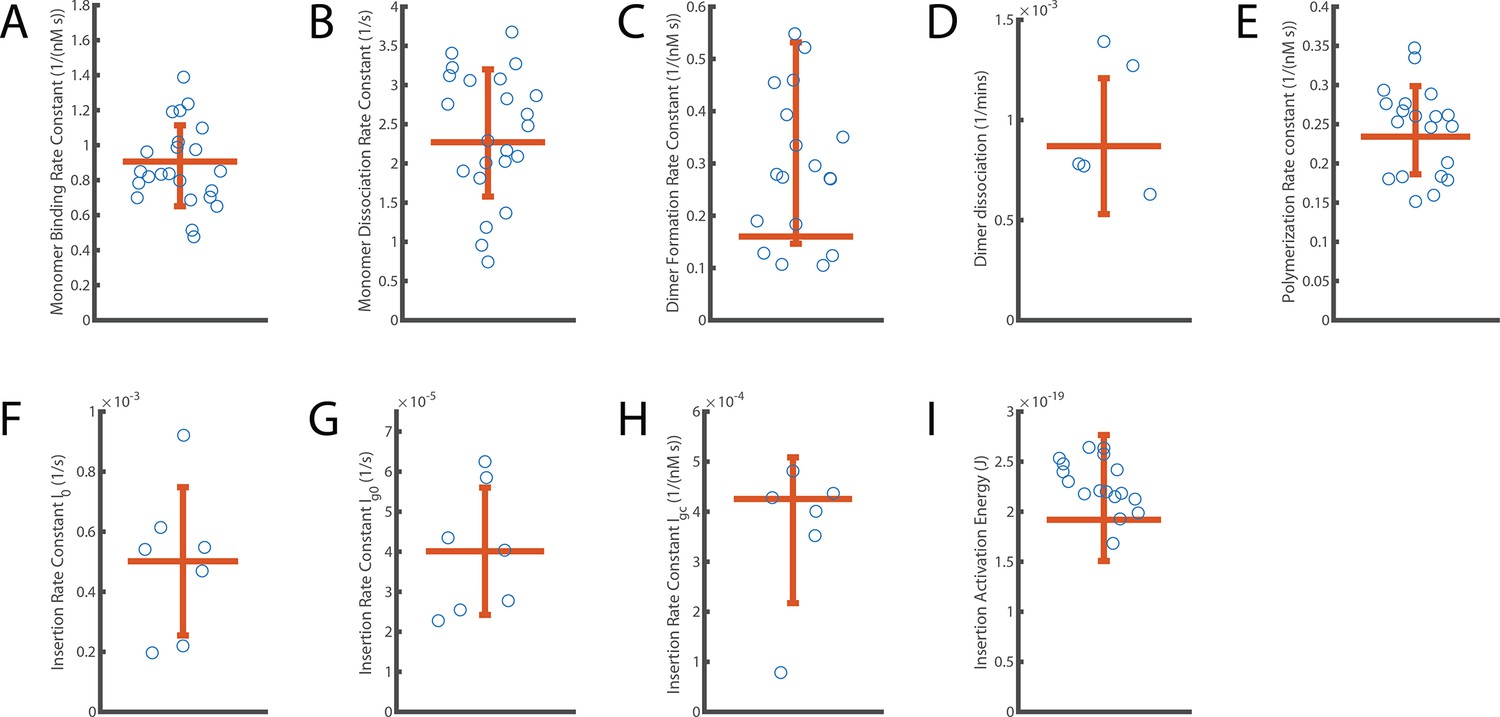
Distribution of independent measurements for each parameter.
The error bar displays the standard deviation of measurements around the mean. The horizontal orange line shows the aggregated fit value reported for each parameter. (A) Monomer binding rate constant (B; from Figure 2). (B) Monomer unbinding rate (U; from to Figure 2). (C) Dimer formation rate constant (Df; from Figure 3). (D) Dimer dissociation rate (Dr; from Figure 3). (E) Oligomerisation rate constant (P; from Figure 4). (F–H) Components describing the overall kinetics of insertion during continuous oligomer growth: insertion rate (I0, shown in panel F), oligomer subunit number-dependent insertion rate (Ig0, shown in panel G) and PFO concentration-dependent insertion rate (Igc, shown in panel H) (from Figures 5 and 6). (I) Activation energy for insertion, that is transition from the prepore state to the open pore state (Ea; from Figure 5).
Appendix 1—figure 3
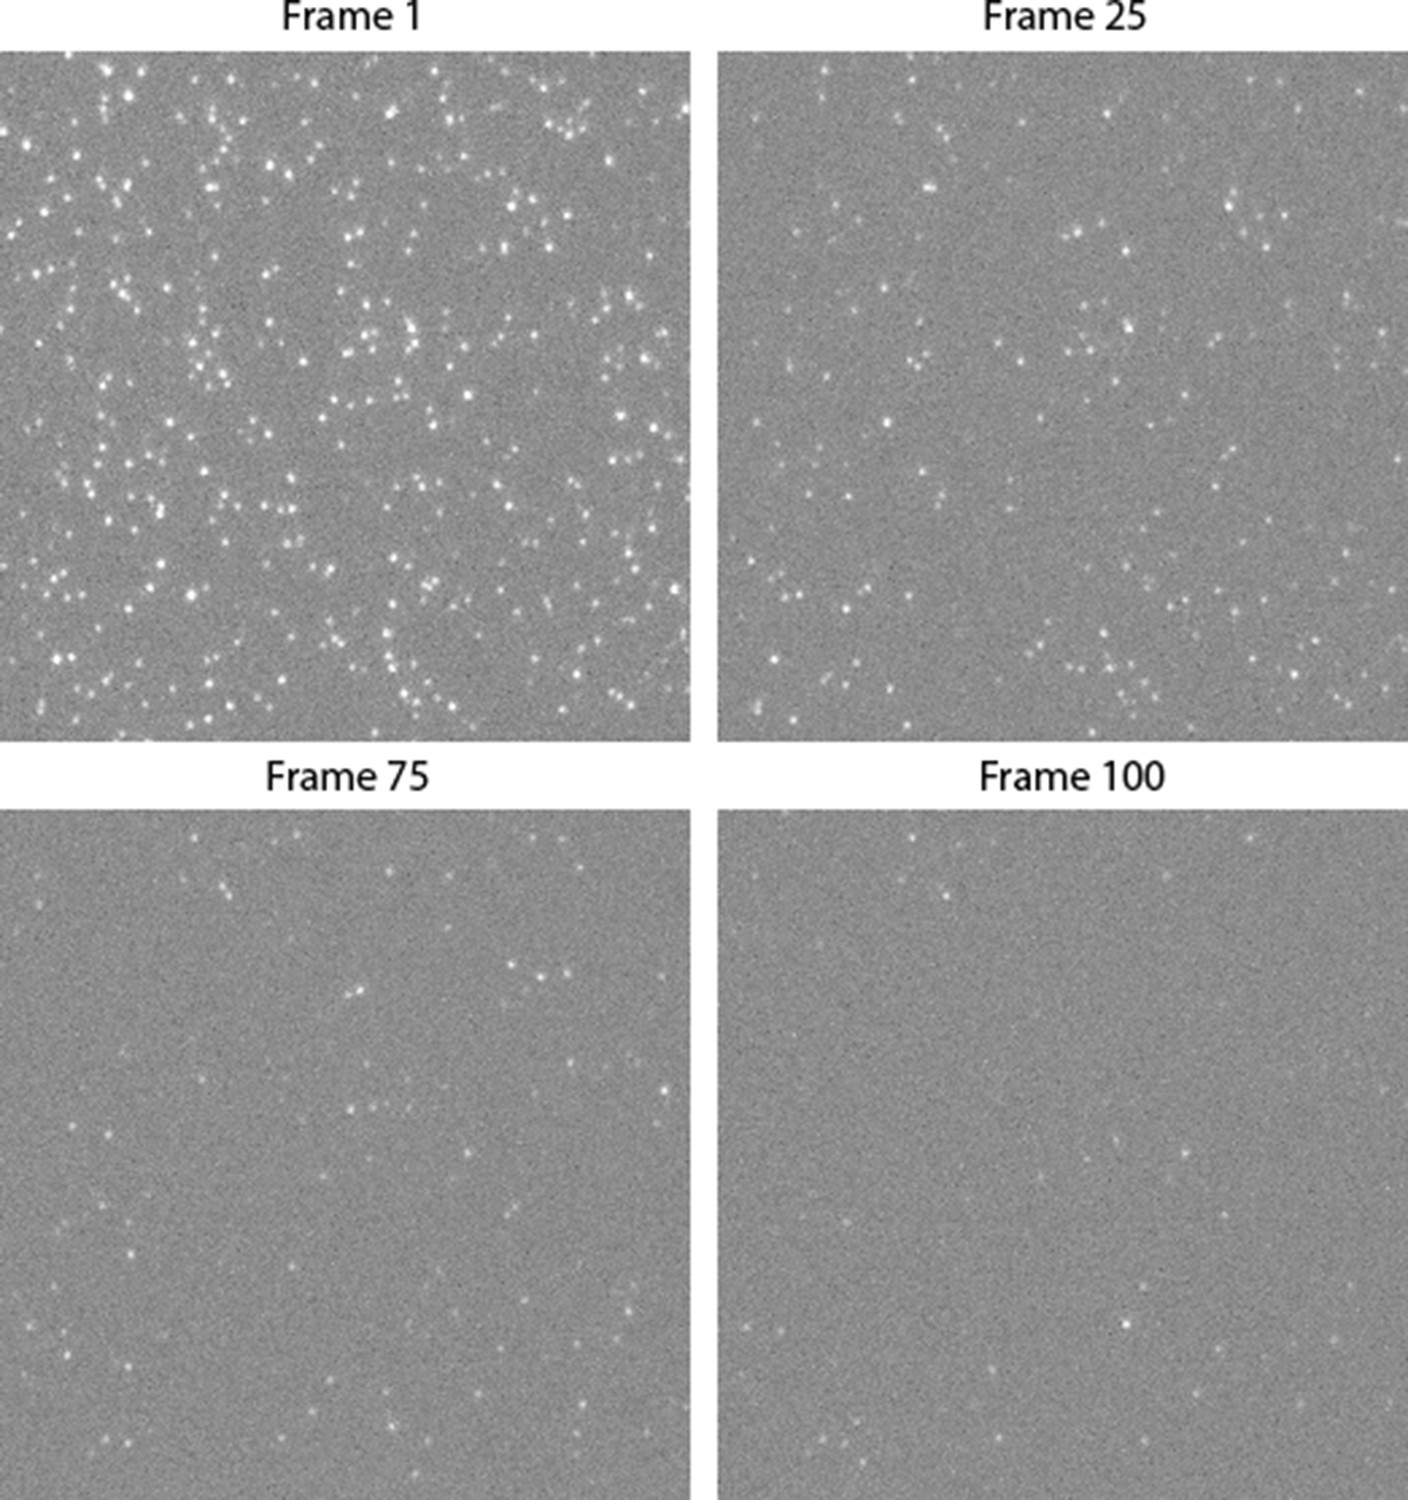
Montage of single-molecule photobleaching image stack.
Single PFO particles, immobilised on a coverslip, bleach as more frames are imaged. The montage shows the 512x512 pixel centre of a single field of view. The complete image is 2048x2048 and in total 5 fields of view were imaged.
Author response image 1
Tables
Table 1
PFO pore formation kinetic and thermodynamic parameter values.
All errors are the standard deviation of independent measurements (see Appendix).
| Parameter | Symbol | Value | Units |
|---|---|---|---|
| Monomer binding rate constant | B | 0.9±0.23 | nM–1 s–1 |
| Monomer unbinding rate | U | 2.27±0.81 | s–1 |
| Dimer formation rate constant | Df | 0.16±0.19 | nM–1 s–1 |
| Dimer dissociation rate | Dr | (8.6±3.4) x10–4 | s–1 |
| Oligomerisation rate constant | P | 0.23±0.028 | nM–1 s–1 |
| Insertion rate (at 22 °C) | I0 | (5.0±2.4) x10–4 | s–1 |
| Ig0 | (4.0±1.6) x10–5 | s–1 | |
| Igc | (4.25±1.45) x10–4 | nM–1 s–1 | |
| Activation energy for insertion | Ea | (1.8±0.63)x10–19 | J |
| 26.2±9.12 | kcal/mol |
Additional files
Download links
A two-part list of links to download the article, or parts of the article, in various formats.
Downloads (link to download the article as PDF)
Open citations (links to open the citations from this article in various online reference manager services)
Cite this article (links to download the citations from this article in formats compatible with various reference manager tools)
Single-molecule analysis of the entire perfringolysin O pore formation pathway
eLife 11:e74901.
https://doi.org/10.7554/eLife.74901


