Continuous sensing of nutrients and growth factors by the mTORC1-TFEB axis
- Department of Molecular and Cellular Biology, University of California, Davis, United States
Figures
Figure 1 with 1 supplement
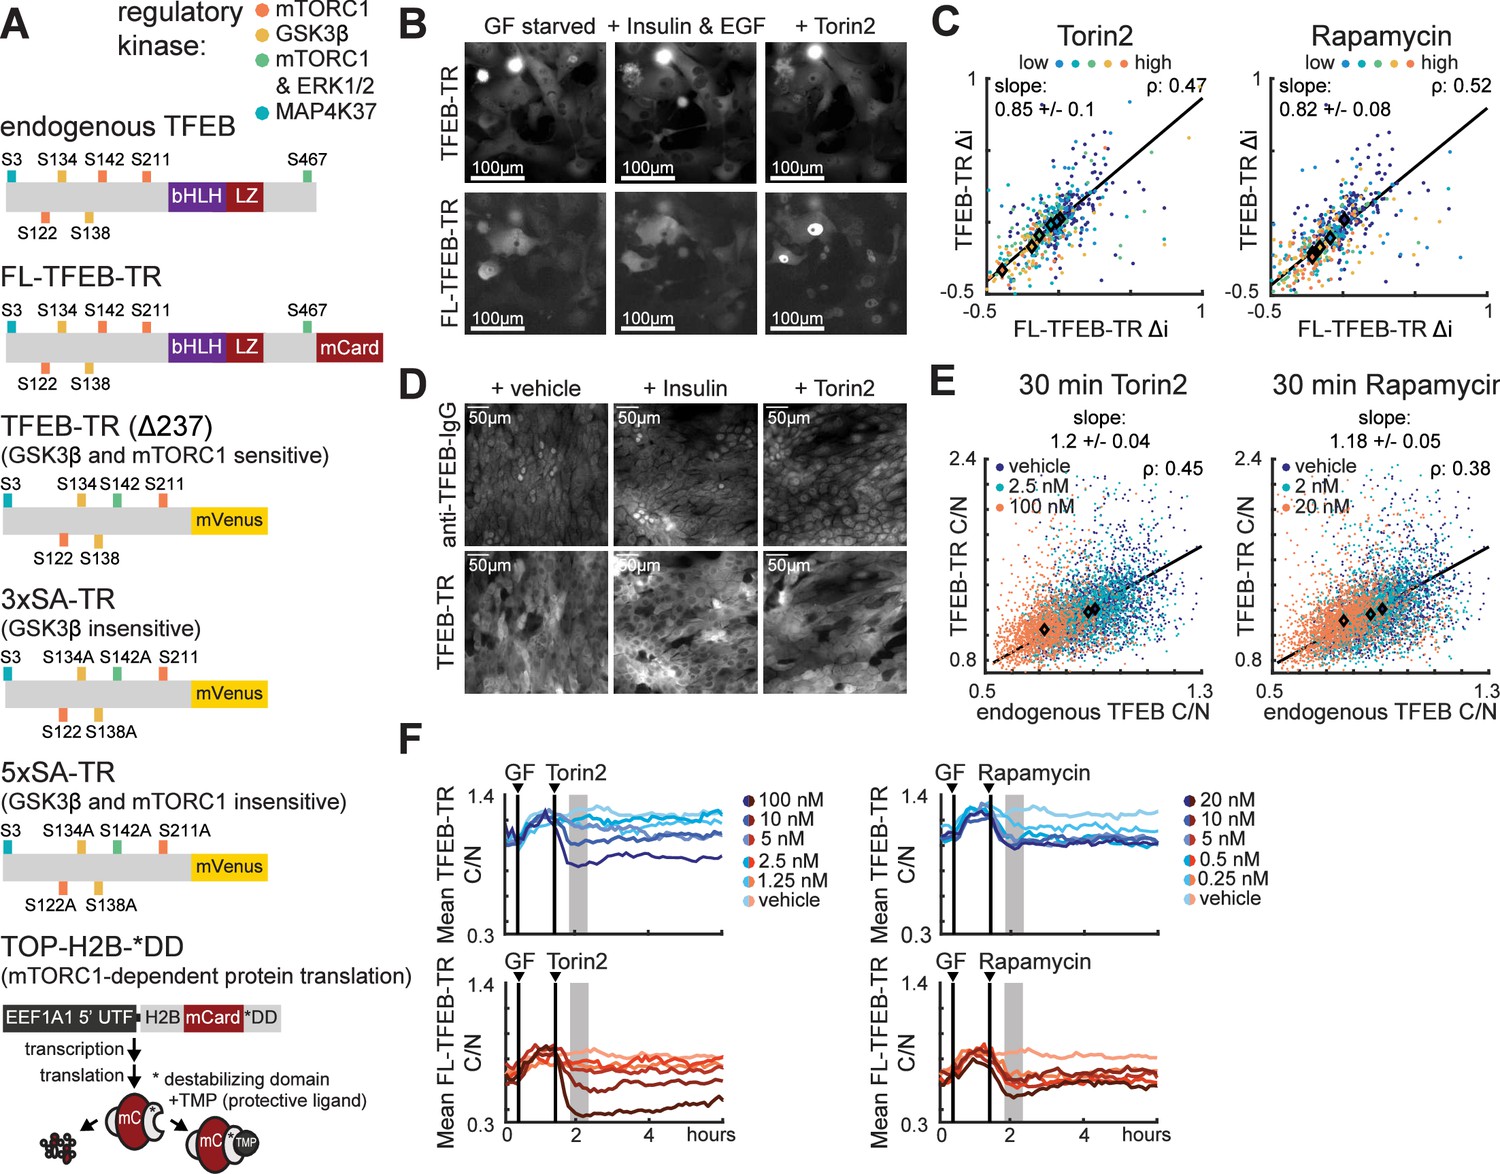
Fluorescent reporters for TFEB localization enable monitoring of mTORC1 activity in living cells.
(A) Schematic of fluorescent protein reporters used in this study. From top to bottom, regulatory phosphorylation sites are indicated for endogenous TFEB, full-length TFEB translocation reporter (FL-TFEB-TR), truncated TFEB-TR (amino acids 1–237), 3xSA-TR (lacking potential GSK3β target sites), and 5xSA-TR (lacking both GSKβ- and mTORC1 sites). The TOP-H2B-DD reporter (bottom) measures mTORC1-dependent protein translation as the rate of fluorescence increase following inhibition of degradation with TMP (Han et al., 2014). (B) Microscopy images of MCF10A cells expressing both FL-TFEB-TR and TFEB-TR. Cells were first starved of growth factors for 6 hr, then treated for 1 hr with vehicle, EGF (20 ng/mL) and insulin (100 ng/mL), or Torin2 (100 nM). Representative images from two experiments are shown. Images represent an arbitrarily selected subset of the full plotted dataset. (C) Scatter plots of same-cell Δi values for dual reporter MCF10A cells (B) treated with Torin2 or rapamycin titrations, for >150 cells per condition. Δi is defined as the change over a 1 hr period following treatment. The Pearson correlation (ρ) for same-cell FL-TFEB-TR and FL-TFEB-TR Δi TFEB-TR is indicated, along with a linear fit of the relationship and its slope (Figure 1—source data 1). (D) Microscopy images showing immunofluorescence detection of endogenous TFEB in TFEB-TR-expressing MCF10A cells. Cells were starved as in (B) and treated with either insulin or Torin2 and fixed following 30 min of treatment. Endogenous TFEB was detected with an antibody against the C-terminal region that is absent in TFEB-TR. (E) Scatter plot of same-cell C/N ratios for endogenous TFEB and TFEB-TR (D), representing >600 cells per condition, presented as in (C) (Figure 1—source data 2). (F) Comparison of temporal TFEB-TR and FL-TFEB-TR localization responses. The mean C/N ratio for each reporter is shown for MCF10A cells expressing both reporters. Treatments with 20 ng/mL EGF and 10 µg/mL insulin (GF), followed by Torin2 or rapamycin, are indicated by vertical lines. Gray regions denote the area for Δi calculation. Averages were calculated from >150 cells, with experiments performed in duplicate.
-
Figure 1—source data 1
TFEB-TR compared with full-length TFEB-TR, live-cell data.
- https://cdn.elifesciences.org/articles/74903/elife-74903-fig1-data1-v2.xls
-
Figure 1—source data 2
TFEB-TR compared with endogenous TFEB, immunofluorescence data.
- https://cdn.elifesciences.org/articles/74903/elife-74903-fig1-data2-v2.xls
Figure 1—figure supplement 1

TFEB reporter validations.
(A) Scatter of Δi values for FL-TFEB-TR and TFEB-TR in dual reporter MCF10A cells treated with AKT inhibitor (MK2206), GSKβ inhibitor (CHIR9902), or insulin titrations. Pearson correlations and linear fits are reported as in Figure 1C. (B) Comparison of TFEB-TR and FL-TFEB-TR localization (mean C/N ratio) over time for dual reporter MCF10A cells treated with 20 ng/mL EGF and 100 ng/mL insulin (GF), followed by AKT inhibitor (MK2206) or GSKβ inhibitor (CHIR9902). Averages were calculated from >150 cells. (C) Scatter plots of C/N ratios for endogenous TFEB immunostaining and TFEB-TR in MCF10A cells. >600 cells per condition were fixed 30 min after treatment with AKT inhibitor (MK2206), GSKβ inhibitor (CHIR99021) or insulin at the concentrations indicated, shown as in Figure 1E. (D) Single-cell traces for TFEB-TR and FL-TFEB-TR C/N in cells expressing both reporters and treated with the indicated conditions. Representative cells were chosen randomly, excluding severe outlier specimens. (E) Cross-correlation of single-cell TFEB-TR and FL-TFEB-TR C/N ratios, calculated for >150 cells during a 5 hr period following treatment with 100 nM Torin2, 20 nM rapamycin, 1 mM MK2206, or CHIR99021. Gray bars indicate ‘scrambled’ controls in which reporter signals from different cells were paired randomly. (F) Comparison of TFEB-TR C/N ratio and total TFEB-TR fluorescence (C+N) over time. MCF10A cells were starved of amino acids for 6 hr then treated with essential amino acids (0.1×). Means are indicated by lines, with shaded areas indicating 75th and 25th quantiles. (G) Single-cell traces of TFEB-TR C/N and total TFEB-TR fluorescence, for cells treated as in (F). Each row shows two randomly selected representative cells, excluding outlier examples. (H) Comparison of pS6 and p4EBP1 kinetics in MCF10A reporter-expressing and nonexpressing cell lines. Cells were starved of growth factors for 48 hr then stimulated with EGF (20 ng/mL) and insulin (10 µg/mL) prior to fixation at the indicated times. Leftmost data are from unstimulated cultures treated with 100 nM Torin2 for 2 hr. Error bars indicate standard deviation.
Figure 2 with 1 supplement
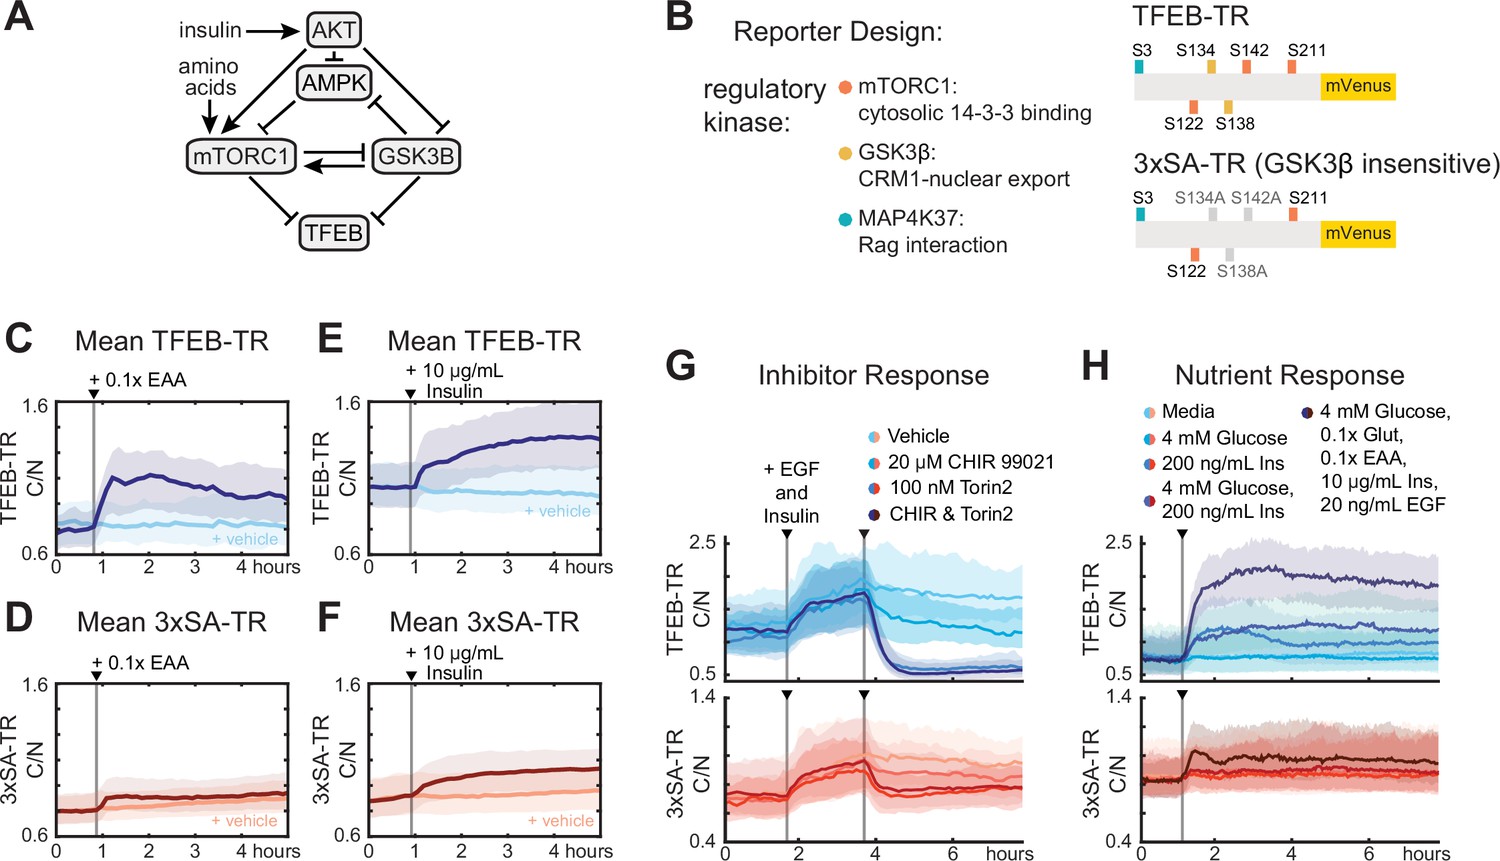
Phosphorylation by GSKβ amplifies cytosolic to nuclear ratio of TFEB.
(A) Schematic diagram of kinase interactions regulating TFEB nuclear localization. (B) Illustration of wild-type TFEB-TR, and the GSKβ-insensitive reporter, 3xSA-TR. (C–F) Temporal changes in reporter C/N ratio following stimulation with essential amino acids (EAA, 0.1×) or insulin (10 µg/mL), shown alongside a vehicle control. Experiments were performed in MCF10A cells expressing both TFEB-TR and 3xSA-TR. (G, H) Comparison of nutrient and inhibitor responses for both TFEB-TR and 3xSA-TR reporters, in dual reporter cells. Mean C/N ratio is indicated by bold lines with the 25th and 75th percentiles indicated by the shaded regions (Figure 2—source data 1).
-
Figure 2—source data 1
TFEB-TR compared with 3xSA-TR, live-cell data, nutrient, and inhibitor treatments.
- https://cdn.elifesciences.org/articles/74903/elife-74903-fig2-data1-v2.xlsx
Figure 2—figure supplement 1

Characterization of TFEB-TR desensitizing mutations.
(A) Quantification of pS6 S240/244 immunofluorescence in MCF10A cells treated with the GSK3β inhibitor, CHIR 99021, in the presence or absence of insulin. (B) Quantification of C/N ratios for 5xSA-TR in response to insulin or amino acid stimulation. Histograms represent the distribution of individual cell C/N ratios; the unstimulated distribution is shown as a transparent gray overlay in each plot for comparison. (C) Comparison of same-cell traces of TFEB-TR and 3xSA-TR C/N ratios, in dual reporter cells. As in Figure 2G, cells were first stimulated with EGF (20 ng/mL) or insulin (10 µg/mL), then treated with (Torin2 100 nM). (D, E) Scatter plots of Δi for dual reporter cells. The Pearson correlation for same-cell Δi TFEB-TR and Δi 3xSA-TR is reported, and linear fits are shown with their slopes. (D) Inhibitor combinations, including vehicle, GSKβ inhibitor (CHIR99021 20 µM), mTOR inhibitor (Torin2 100 nM), or both inhibitors. (E) Stimulus combinations, following 6 hr nutrient and growth factor starvation, including glucose (4 mM), insulin (200 ng/mL), both, or maximal activation by a combination of all nutrients – glucose (4 mM), glutamine (0.25 mM), essential amino acids (0.1×), insulin (10 µg/mL), and EGF (20 ng/mL). (F) Cross-correlation of single-cell TFEB-TR and 3xSA-TR ratios calculated for >150 cells during a 5 hr period following treatment with 100 nM Torin2, 20 ng/mL EGF, and 10 µg/mL insulin, or 20 µM CHIR99021. Gray bars indicate ‘scrambled’ controls in which reporter signals from different cells were paired randomly.
Figure 3 with 1 supplement
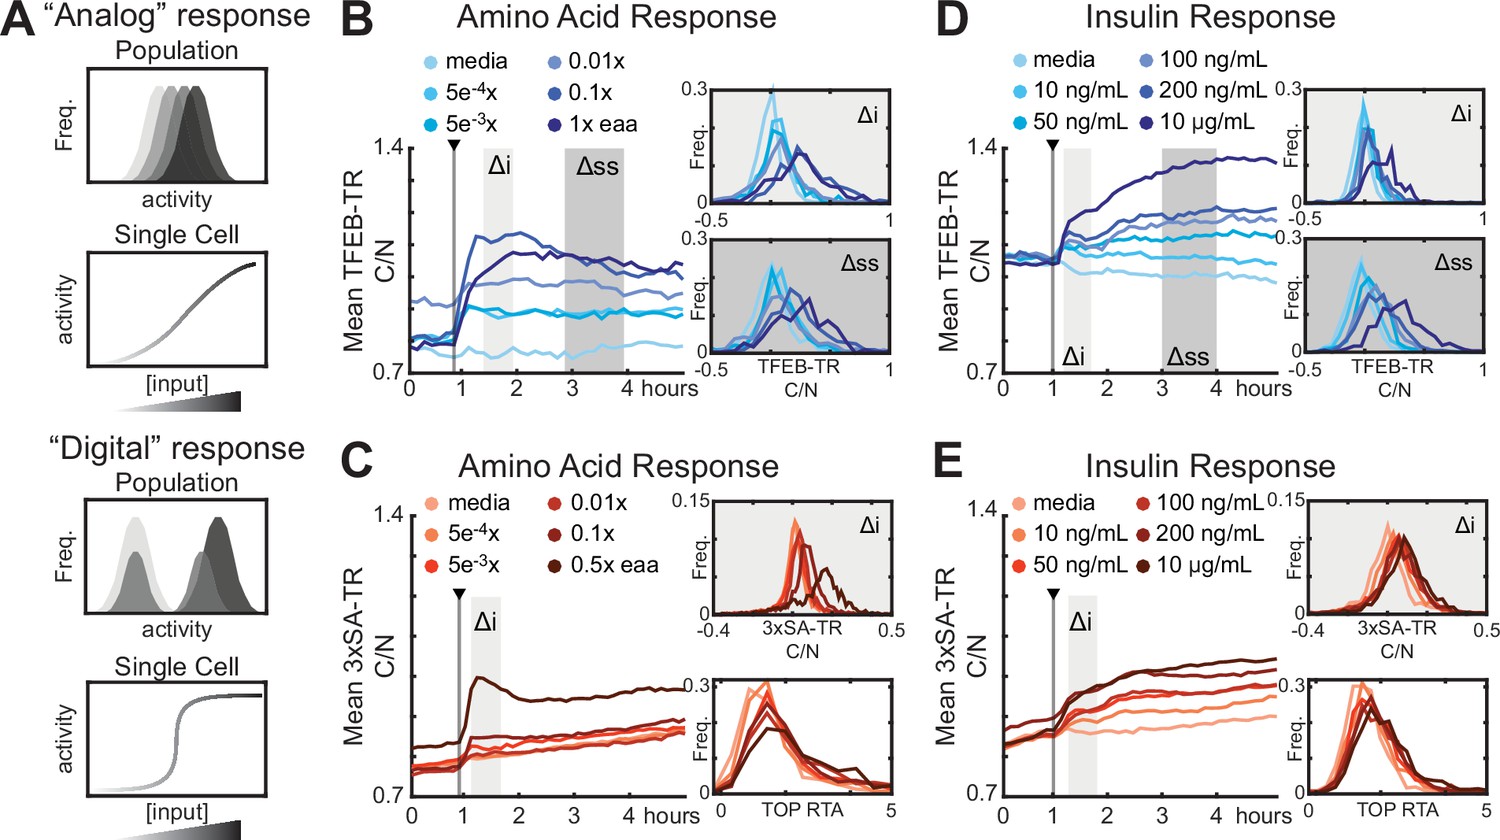
Analog regulation of mTORC1-TFEB axis by input strength.
(A) Conceptual comparison of ‘Analog’ and ‘Digital’ signal responses to graded input concentrations. Histograms and single-cell plots represent the expected results if individual cells show a dose–responsive (analog) behavior or a sharply switching (digital) behavior at a threshold concentration. (B–E) Response of MCF10A cells expressing TFEB-TR, 3xSA-TR, or H2B-TOP-DD to titrations of mTORC1 modulators. The mean C/N ratio over time for over >500 cells is reported as a line, alongside histograms of the initial (Δi) and steady-state (Δss) responses for individual cells. Histograms showing the relative translation activity (RTA), as measured by the TOP reporter, from a parallel experiment are show in place of Δss in (C, E). (B, C) Cells were starved of growth factors and amino acids for 6 hr, then stimulated with essential amino acids. (D, E) Cells were starved of growth factors for 6 hr, then treated with titrations of insulin (Figure 3—source data 1).
-
Figure 3—source data 1
TFEB-TR and 3xSA-TR, live-cell data, insulin and amino acid treatments.
- https://cdn.elifesciences.org/articles/74903/elife-74903-fig3-data1-v2.xls
Figure 3—figure supplement 1

Quantification of responses of TFEB-TR, 3xSA-TR, or H2B-TOP-DD to titrations of mTORC1 modulators, as in Figure 3B–E.
Cells were cultured in fully supplemented medium (including growth factors and amino acids), then treated with titrations of Rapamycin (A, E), GSKβ inhibitor CHIR99021 (B, G), AKT inhibitor MK2206 (C, H), EGF (D), Torin2 (F), and AMPK activator A769662 (I).
Figure 4 with 1 supplement
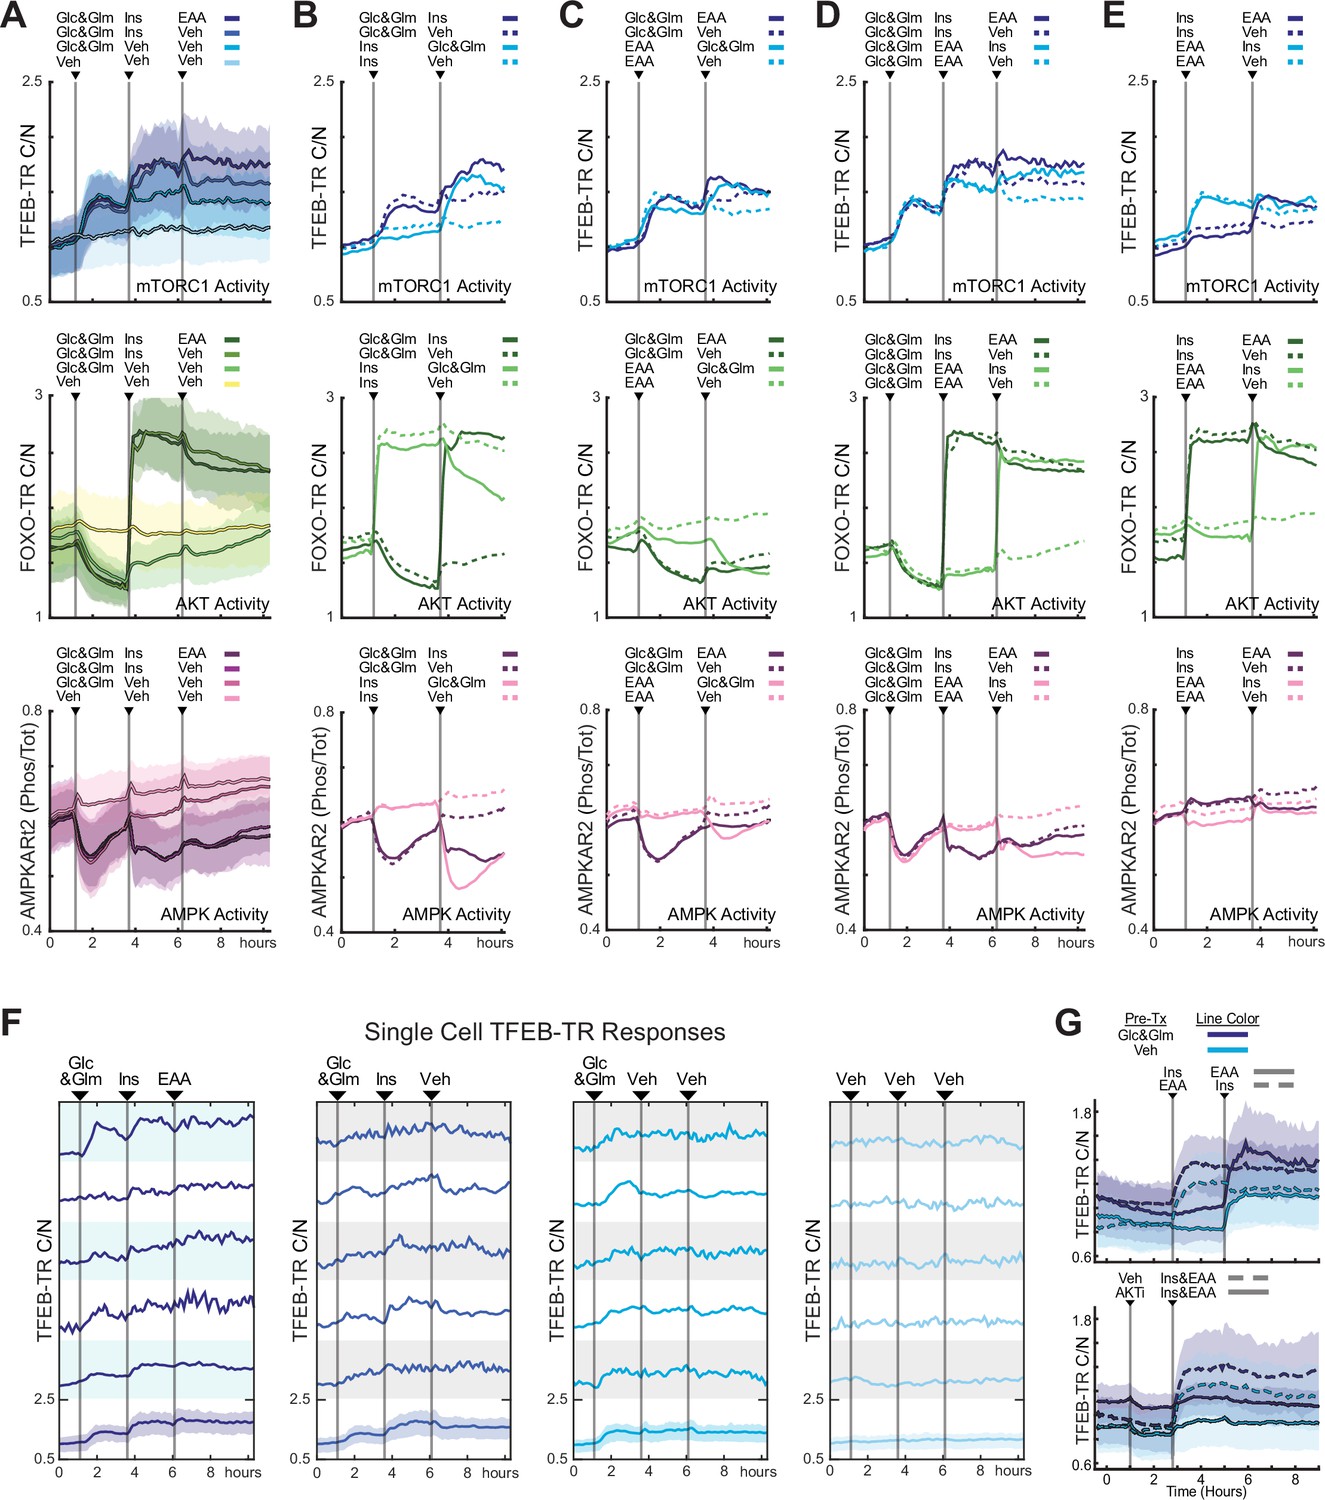
TFEB responds to sequential nutrient addition through incremental changes in localization.
(A) Mean reporter responses to sequential nutrient stimulation in MCF10A cells expressing TFEB-TR, an AKT reporter (FOXO-TR), and an AMPK activity FRET reporter (AMPKAR2), calculated from at least 200 cells per treatment. Cells were starved of nutrients and growth factors for 6 hr, then stimulated with a sequence of glucose (17.5 mM) and glutamine (2.5 mM), followed by insulin (10 µg/mL), and then essential amino acids (0.1×), or vehicle controls as indicated. Shaded regions denote the 25th/75th percentile range. (B–E) Mean reporter responses to various nutrient stimulation sequences in the MCF10A triple reporter cell line. Cells were treated as in (A), with the sequences indicated. Lines represent means of >200 cells; dotted lines indicate vehicle controls. (F) Single-cell responses of TFEB-TR C/N for the stimulus sequence shown in (A). Representative cells were chosen randomly, excluding severe outliers (Figure 4—source data 1–5) (G) Mean response of TFEB-TR reporter in mouse embryonic fibroblast (MEF) cells (displayed as in A), but with line color indicating pretreatment condition and dashed vs. solid lines indicating treatment sequence (Figure 4—source data 6).
-
Figure 4—source data 1
TFEB-TR, FOXO-TR, AMPKAR2, live-cell data corresponding to Figure 4A.
- https://cdn.elifesciences.org/articles/74903/elife-74903-fig4-data1-v2.xlsx
-
Figure 4—source data 2
TFEB-TR, FOXO-TR, AMPKAR2, live-cell data corresponding to Figure 4B.
- https://cdn.elifesciences.org/articles/74903/elife-74903-fig4-data2-v2.xlsx
-
Figure 4—source data 3
TFEB-TR, FOXO-TR, AMPKAR2, live-cell data corresponding to Figure 4C.
- https://cdn.elifesciences.org/articles/74903/elife-74903-fig4-data3-v2.xlsx
-
Figure 4—source data 4
TFEB-TR, FOXO-TR, AMPKAR2, live-cell data corresponding to Figure 4D.
- https://cdn.elifesciences.org/articles/74903/elife-74903-fig4-data4-v2.xlsx
-
Figure 4—source data 5
TFEB-TR, FOXO-TR, AMPKAR2, live-cell data corresponding to Figure 4E.
- https://cdn.elifesciences.org/articles/74903/elife-74903-fig4-data5-v2.xlsx
-
Figure 4—source data 6
TFEB-TR in wild-type mouse embryonic fibroblast (MEF) cells, live-cell data, insulin and amino acid treatments.
- https://cdn.elifesciences.org/articles/74903/elife-74903-fig4-data6-v2.xlsx
Figure 4—figure supplement 1

Mean responses of 3xSA-TR to sequential nutrient stimulation in MCF10A cells, presented as in Figure 4.
In (A–E), cells were starved of glucose and glutamine, amino acids, and growth factors for 6 hr. In (F–J), cells were starved for 6 hr of glucose, amino acids, and growth factors, but cultured in the presence of 2.5 mM glutamine. The mean and 25th/75th percentile were calculated from >600 cells.
Figure 5 with 1 supplement
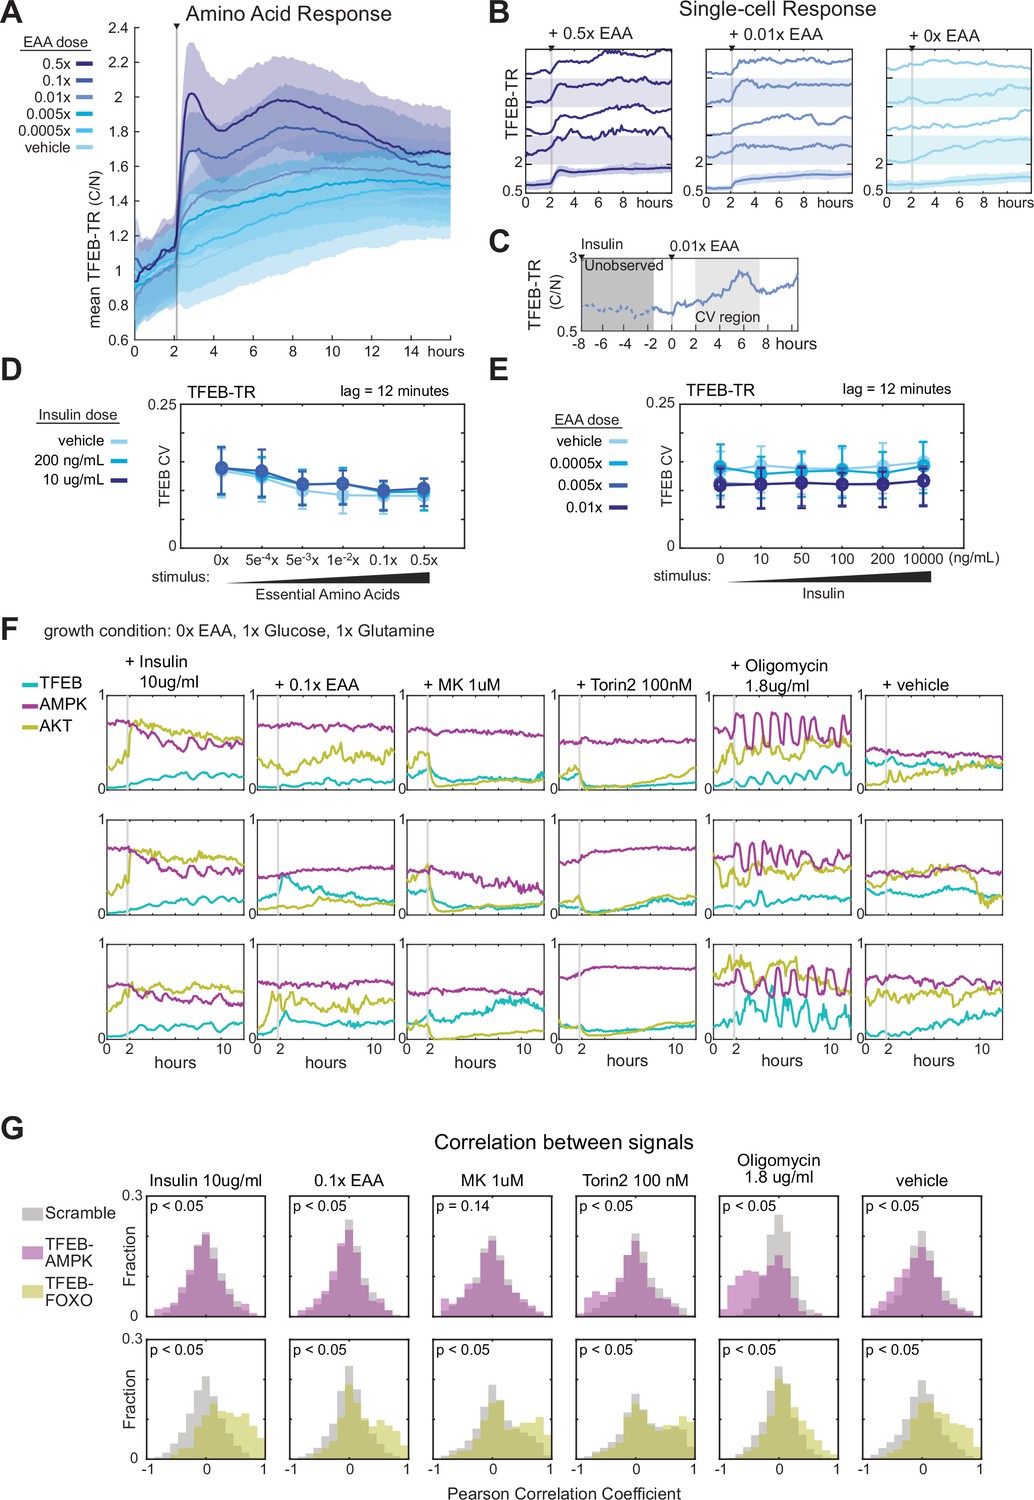
Nutrient limitation induces correlated fluctuations in the AMPK-mTORC1-TFEB network.
(A) Mean TFEB-TR C/N response over 12 hr in MCF10A cells, following starvation of growth factors and amino acids for 6 hr and then stimulated with essential amino acids at a range of concentrations. Data from >400 cells in each condition. (B) Single-cell TFEB-TR C/N responses, for several conditions corresponding to the experiment in (A). The bottom traces show the mean with shaded regions denoting the 25th and 75th percentiles. (C) Schematic illustrating an example experiment timeline and time window used for coefficient of variation calculations in (D) and (E). (D, E) Single-cell coefficient of variation (CV) in TFEB-TR C/N for MCF10A cells grown in dual treatments of insulin and essential amino acids. CV was calculated for >400 individual cells per condition, across 2–7 hr after stimulation, with point-to-point noise reduced by subsampling to 12 min intervals. Error bars report the interquartile range of the CV. (D) Cells were cultured in insulin for 6 hr then stimulated with amino acids. (E) Cells were cultured in amino acids for 6 hr then stimulated with insulin (Figure 1—source data 1 and 2) (F) Single-cell traces for triple reporter MCF10A cells. Cells were starved of amino acids for 6 hr and then treated with insulin, essential amino acids, MK2206, Torin2, Oligomycin, or a vehicle control. (G) Correlation of single-cell TFEB-TR and AMPKAR activity (upper) or TFEB-TR and FOXO-TR activity (lower), calculated for >150 cells during an 8 hr period following the indicated treatments. Optimal lags were identified by cross-correlation, and the median lag used to plot correlation distributions. All median lags were zero. Gray bars indicate the distribution of ‘scrambled’ controls in which reporter signals from different cells were paired randomly (Figure 5—source data 4).
-
Figure 5—source data 1
TFEB-TR response to insulin and amino acid combinations without glucose, live-cell data.
- https://cdn.elifesciences.org/articles/74903/elife-74903-fig5-data1-v2.xlsx
-
Figure 5—source data 2
TFEB-TR response to amino acids after insulin treatment, with glucose, live-cell data.
- https://cdn.elifesciences.org/articles/74903/elife-74903-fig5-data2-v2.xlsx
-
Figure 5—source data 3
TFEB-TR response to insulin after amino acid treatment, with glucose, live-cell data.
- https://cdn.elifesciences.org/articles/74903/elife-74903-fig5-data3-v2.xlsx
-
Figure 5—source data 4
TFEB-TR, AMPKAR, FOXO-TR response to stimuli and inhibitors, live-cell data.
- https://cdn.elifesciences.org/articles/74903/elife-74903-fig5-data4-v2.xlsx
Figure 5—figure supplement 1

Extended view of AMPK-mTORC1-TFEB fluctuations.
(A) Single-cell TFEB-TR C/N over time. Cells were starved of amino acids for 6 hr and then stimulated with essential amino acids ranging from 0× to 0.5×. (B) Single-cell FOXO-TR C/N over time, treated as in (A). (C) Single-cell FRET for AMPK activity reporter over time. For 6 hr, cells were cultured with 0.1× essential amino acids (and 2.5 mM glutamine) and no growth factors, then stimulated with various doses of insulin. (D) Single-cell CV of FOXO-TR C/N for >400 cells per condition, as in (D, E). Cells were cultured with indicated levels of essential amino acids then stimulated with insulin (left) or in insulin then stimulated with amino acids (right). (E) Single-cell CV as in (D), for AMPKAR signal.
Figure 6 with 3 supplements
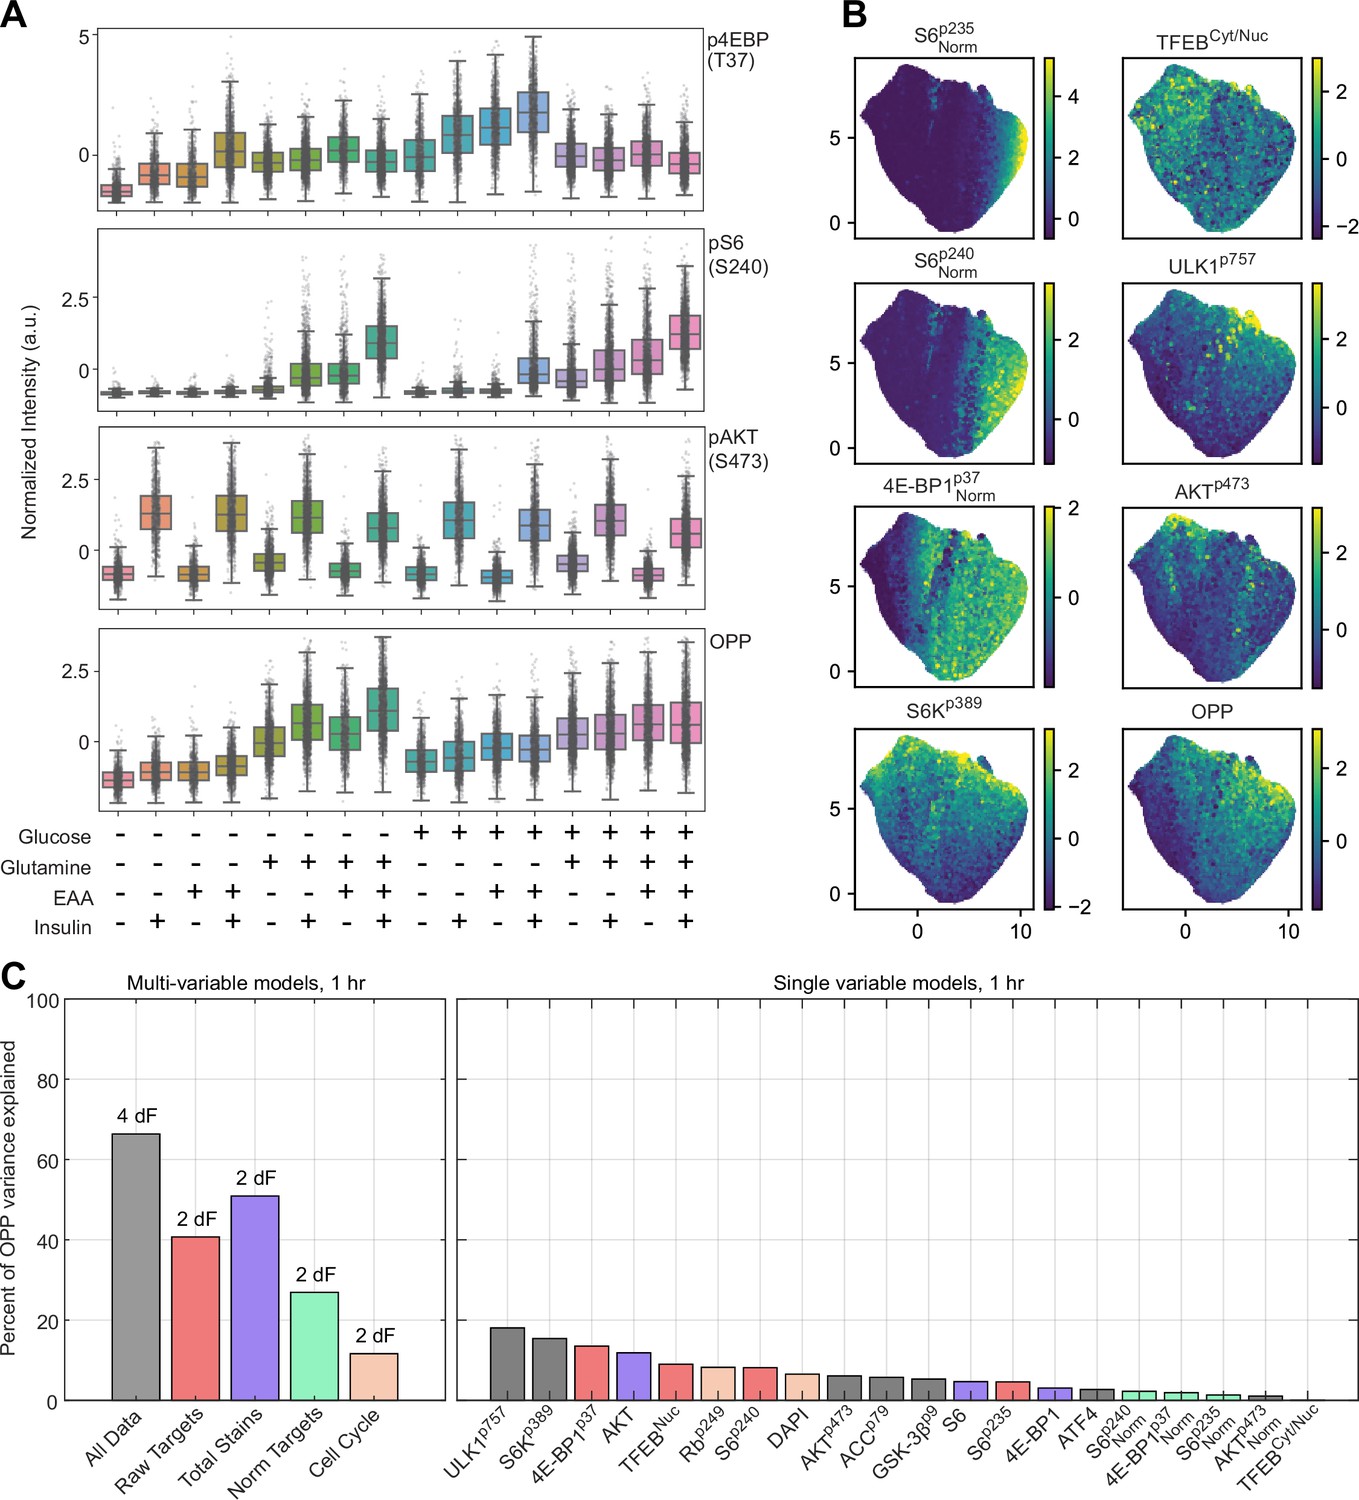
Single-cell immunofluorescent analysis of mTORC1 targets and protein expression.
(A) Normalized distributions of measurements for select targets, under each treatment regimen. Boxplot span 25th–75th percentiles, with a line at the median, and whiskers extend to 5th and 95th percentiles. Individual data are superimposed as small gray dots (Figure 6—source data 1). (B) UMAP projections of dataset, pseudocolored by intensity of select targets. (C) Performance of partial least-squares regression (PLSR) models built to estimate O-propargyl puromycin (OPP) intensity from selected subsets of the dataset. Individual targets (right panel) are colored according to the multivariable model that includes them (left panel). Each multivariable model is annotated with the number of degrees of freedom (dF) that was identified by the PLSR.
-
Figure 6—source data 1
Cyclic immunofluorescence dataset, w/wo glucose, glutamine, insulin, and amino acids.
- https://cdn.elifesciences.org/articles/74903/elife-74903-fig6-data1-v2.xlsx
Figure 6—figure supplement 1
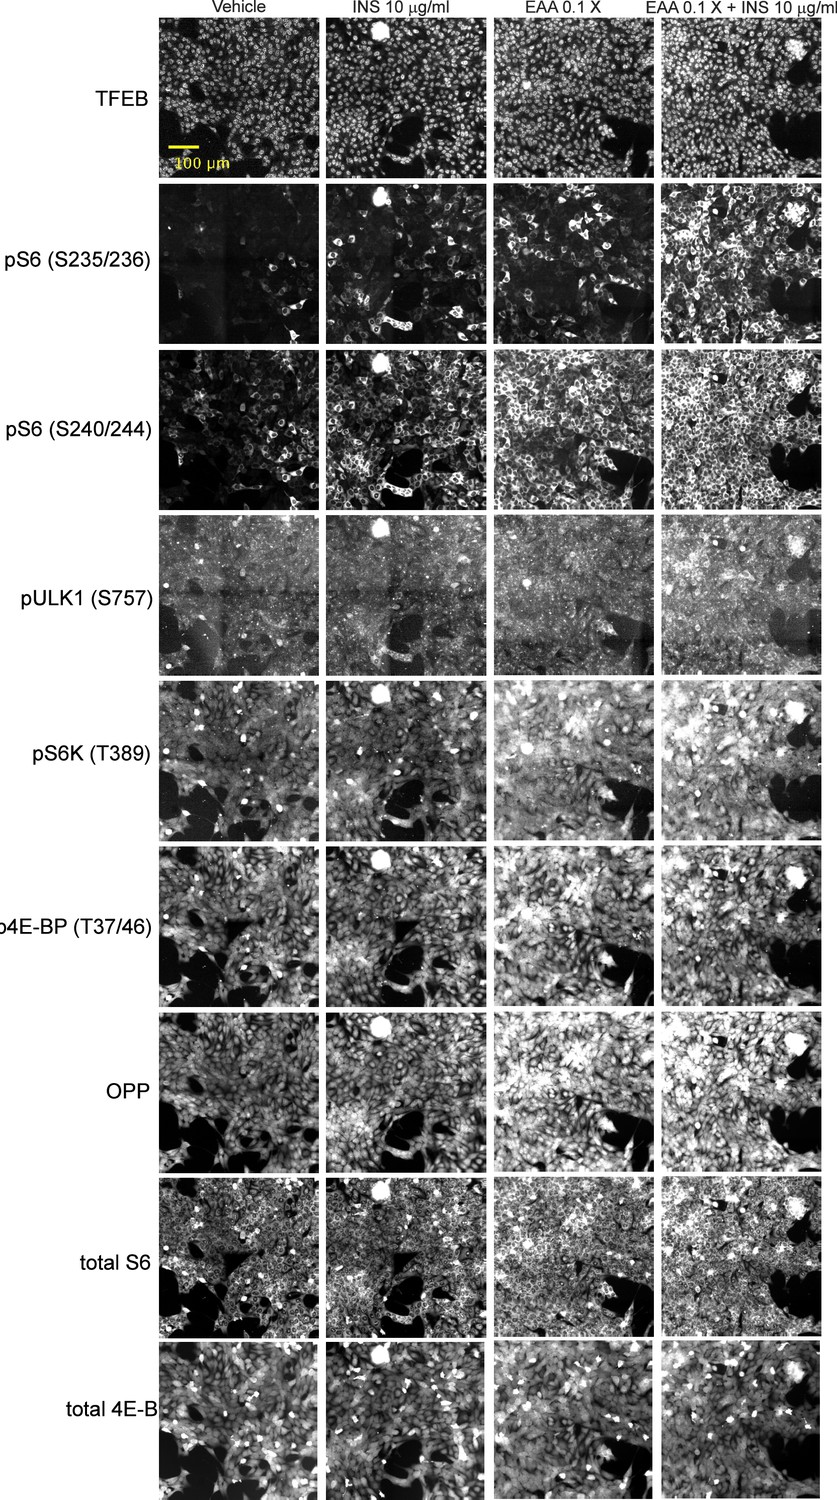
Sample immunofluorescence images of mTORC1 targets, corresponding to the quantified values in Figure 6.
MCF10A cells were starved of amino acids and growth factors for 6 hr, then stimulated for 1 hr with insulin, amino acids, or both. Images are examples taken from a cropped subregion of duplicate wells. All samples imaged contained a range of cell densities, and we did not observe any systematic differences in cell density; any apparent differences in density between images reflect the arbitrary choices of fields shown.
Figure 6—figure supplement 2
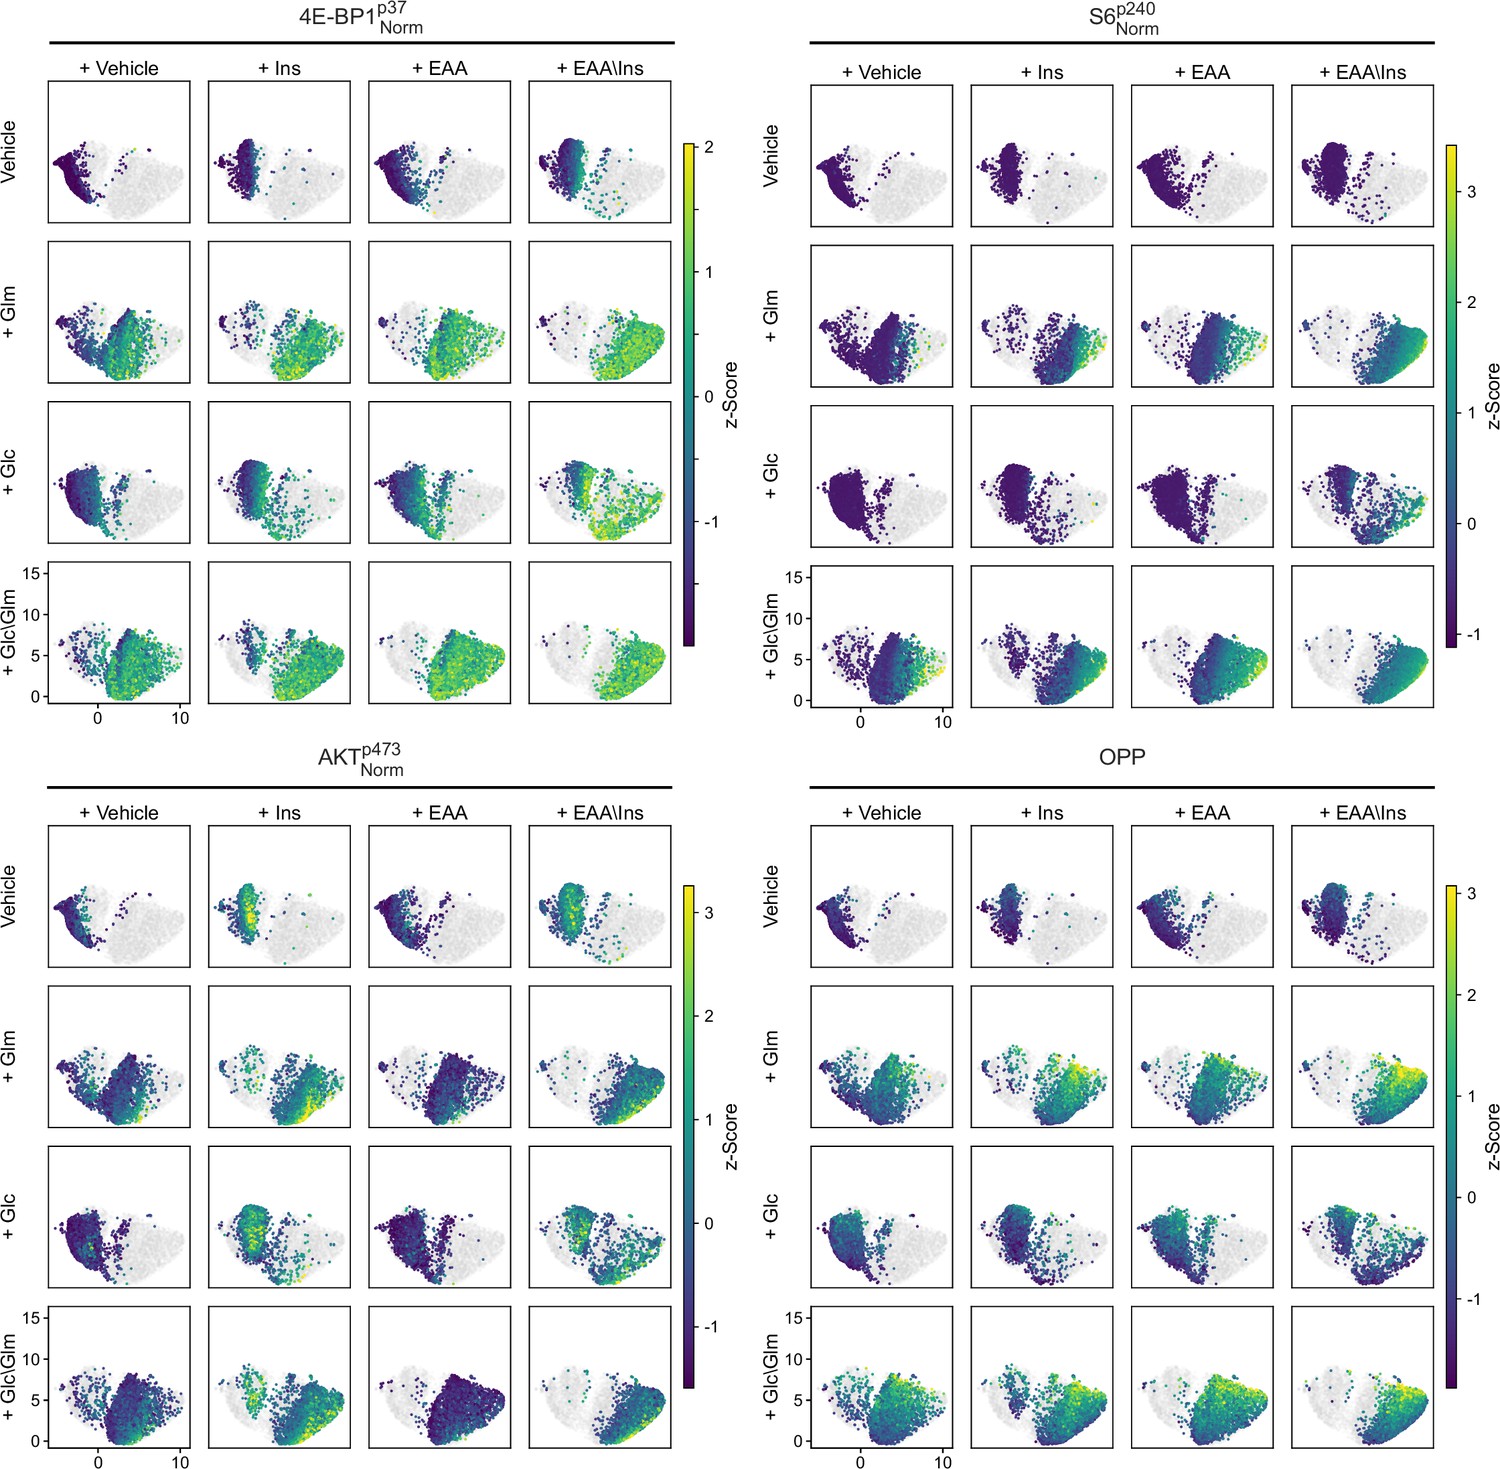
Treatment-specific UMAP projection overlays for select targets.
Grids of UMAP overlays are shown in a grid for each target, with individual overlays for each treatment combination. Treatments are denoted along the left and upper sides of the grid. Each overlay pseudocolors samples corresponding to the target intensity, but only for samples in that treatment combination. All other samples are colored light gray for reference.
Figure 6—figure supplement 3

Performance and behavior of partial least-squares regression (PLSR) models.
(A) Performance of PLSR models built using treatment-averaged data, rather than single-cell values, presents as in Figure 6C. (B, C) Weights assigned to each target in the (B) treatment-averaged models and (C) single-cell models. (D) Scattered distributions of model predicted values (y-axes) vs. data values (x-axes) for single-cell models.
Figure 7
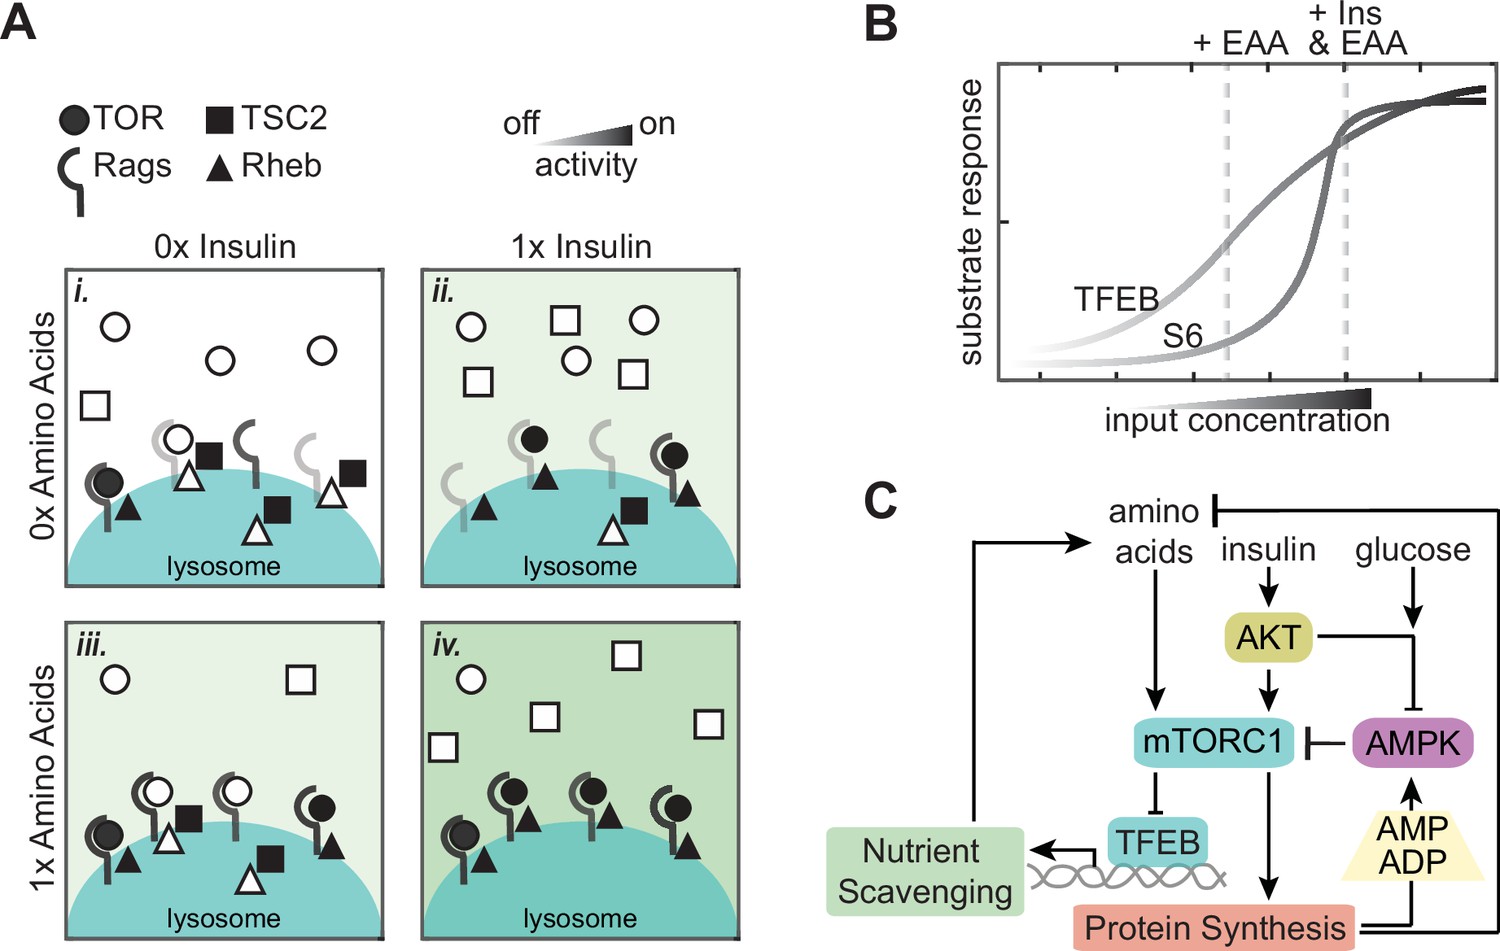
A model of continuous integration of nutrient and growth factor status by mTORC1-TFEB signaling.
(A) Schematic representation of many molecular switches forming an analog integration of nutrient and growth factor abundance by mTORC1 assembly at the lysosome. (B) Graph illustrating how differences in mTORC1 substrate sensitivity can change the appearance of mTORC1 integration logic. (C) Wiring diagram illustrating potential sources for slow and fast fluctuations in mTORC1 activity. Protein synthesis produces ADP and depletes available amino acids, with potential to activate AMPK and inhibit mTORC1 when nutrients are limited. Transcriptional activity of TFEB promotes nutrient scavenging programs to balance metabolic supply and demand.
Additional files
Download links
A two-part list of links to download the article, or parts of the article, in various formats.
Downloads (link to download the article as PDF)
Open citations (links to open the citations from this article in various online reference manager services)
Cite this article (links to download the citations from this article in formats compatible with various reference manager tools)
Continuous sensing of nutrients and growth factors by the mTORC1-TFEB axis
eLife 12:e74903.
https://doi.org/10.7554/eLife.74903


