Transcriptome network analysis implicates CX3CR1-positive type 3 dendritic cells in non-infectious uveitis
- Ophthalmo-Immunology, University Medical Center Utrecht, Utrecht University, Netherlands
- Center for Translational Immunology, University Medical Center Utrecht, Utrecht University, Netherlands
- Department of Ophthalmology, University Medical Center Utrecht, Utrecht University, Netherlands
- Department of Rheumatology & Clinical Immunology, University Medical Center Utrecht, Utrecht University, Netherlands
- University Medical Center Utrecht and Utrecht University, Netherlands
Figures
Figure 1 with 3 supplements
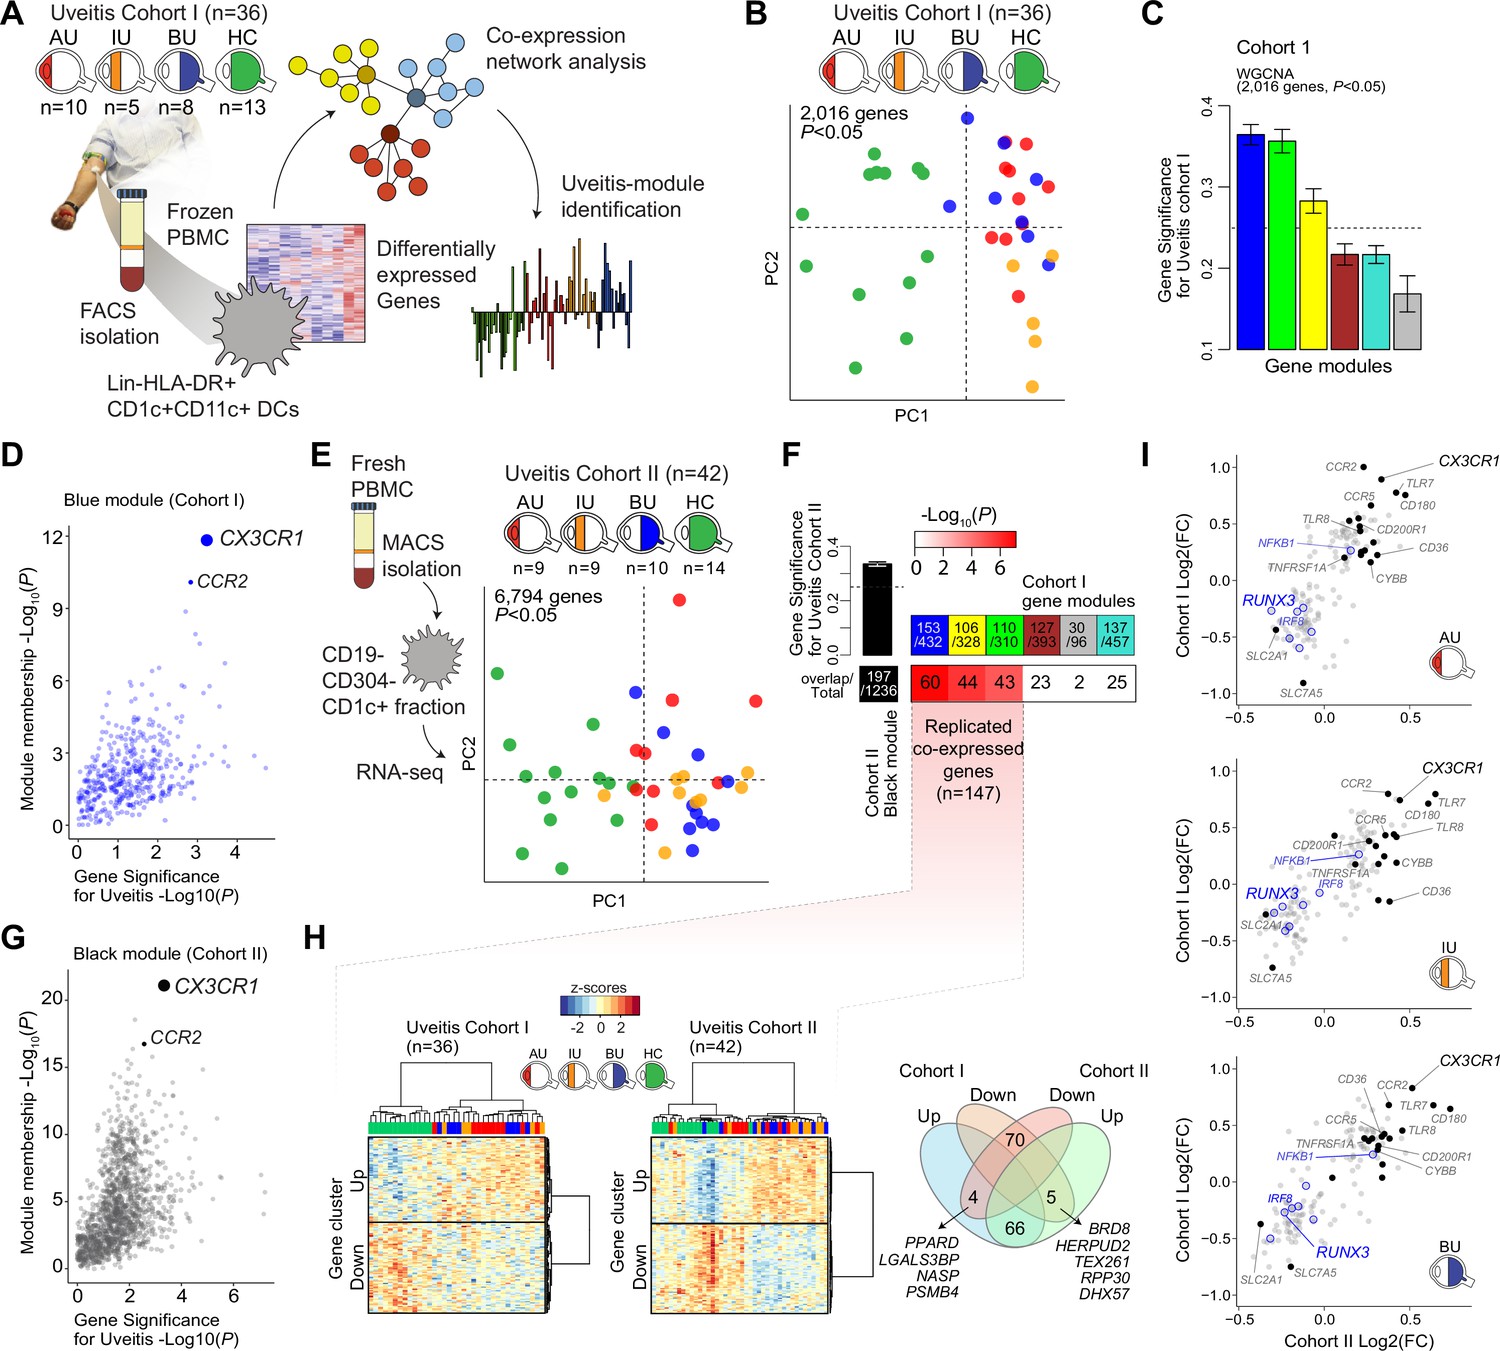
A CX3CR1 gene module in CD1c+ dendritic cells (CD1c+ DC) is associated with non-infectious uveitis.
(A) Study design. CD1c+ DCs were purified from blood and subjected to RNA-sequencing. Co-expression network analysis was used to identify gene modules associated with uveitis. (B) Principal component analysis (PCA) of the 2016 uveitis-associated genes (p < 0.05) in 36 patients and control samples of cohort I. (C) Gene significance for uveitis for the gene modules identified by WGCNA. (D) Module membership and Gene Significance for uveitis for the blue module of cohort I. (E) PCA of the 6794 uveitis-associated genes (p < 0.05) in 42 samples of cohort II. (F) Cross-tabulation of the preservation of co-expressed genes between gene modules from cohort I and the black module from cohort II. p value is from Fisher’s exact test. (G) Same as in D, but for the black module of cohort II. (H) Heatmaps of the 147 replicated co-expressed genes (rows) for samples (columns) from cohorts I and II. The venn diagram shows the up- and downregulated genes (clusters shown in H). (I) The (log2) fold change in gene expression compared to healthy controls (x-axis) for all 147 replicated genes in patients with AU, IU, and BU. Genes encoding surface proteins are indicated in black/gray. Key transcription factors are indicated in blue. AU: anterior uveitis, IU: intermediate uveitis, BU: birdshot uveitis.
Figure 1—figure supplement 1
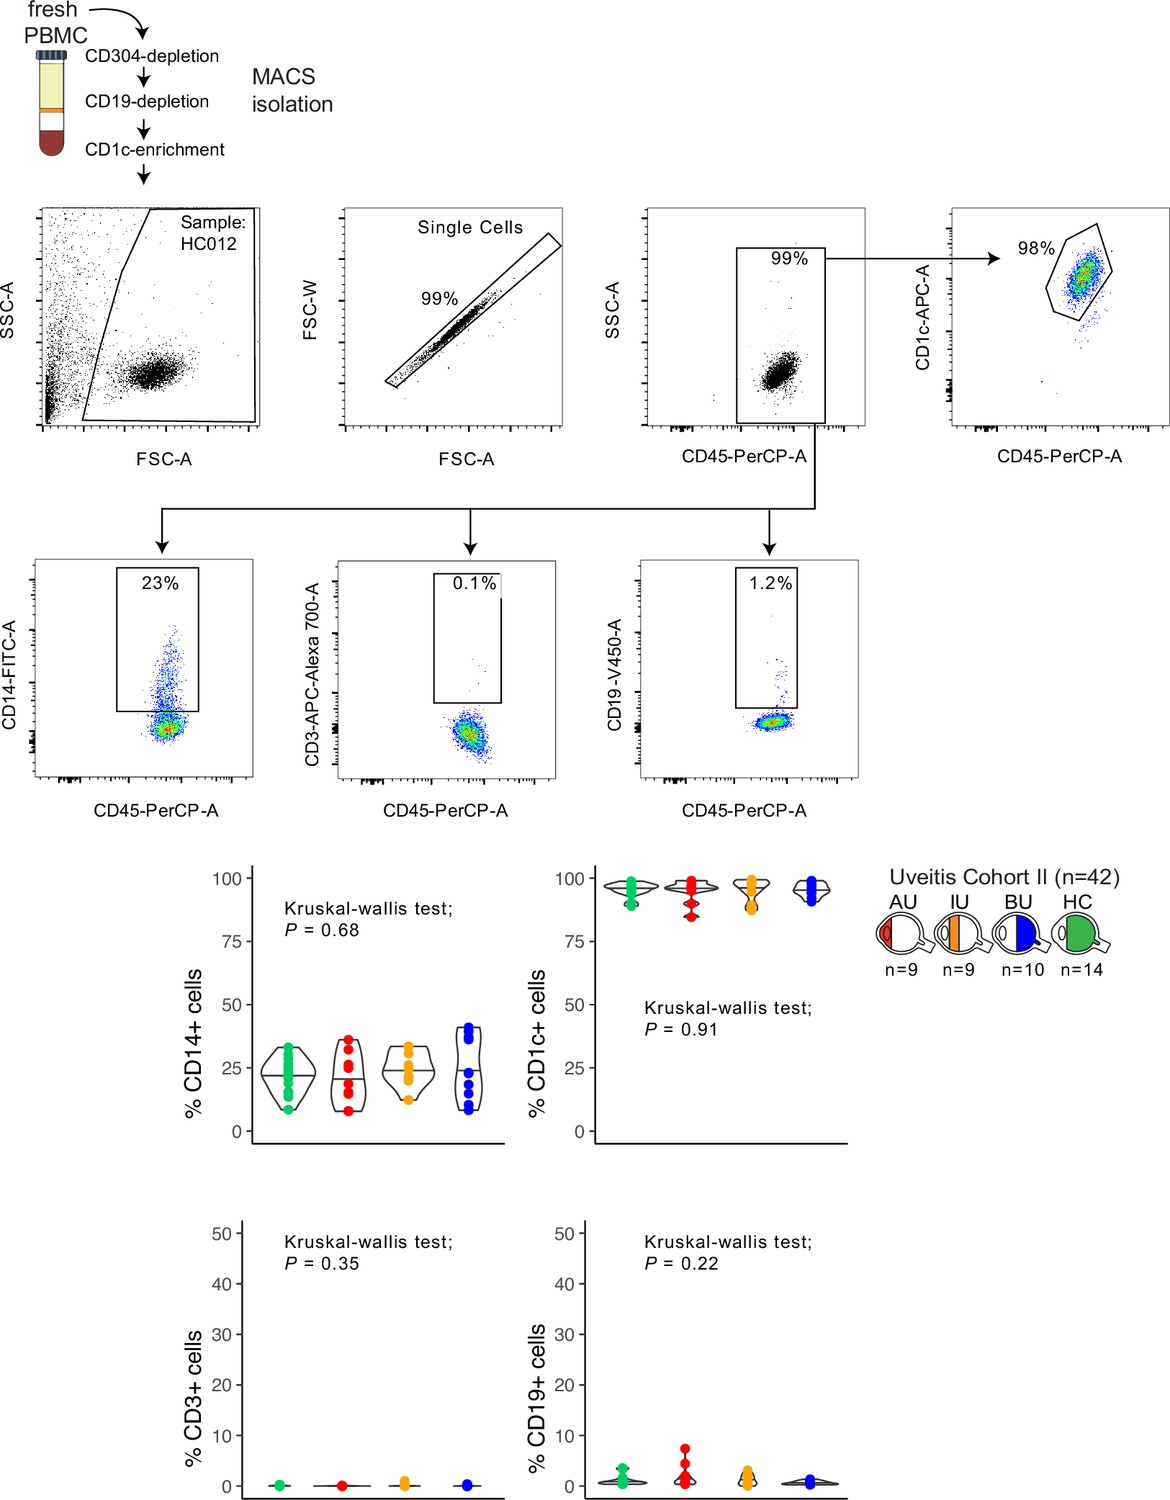
Purity check of cell fractions for RNA-sequencing in cohort II.
Representative sample of flow-cytometry gating of CD14+, CD19+, CD3+, and CD1c+ cell fractions in CD304-depleted, CD19-depleted and CD1c+ enriched magnetic-activated cell sorting (MACS) fractions from fresh peripheral blood mononuclear cells. Manual gating data for each individual sample are available via: https://doi.org/10.34894/9Q0FVO. The percentage of cells positive for each marker on the group levels between the disease groups is indicated in the bottom.
Figure 1—figure supplement 2
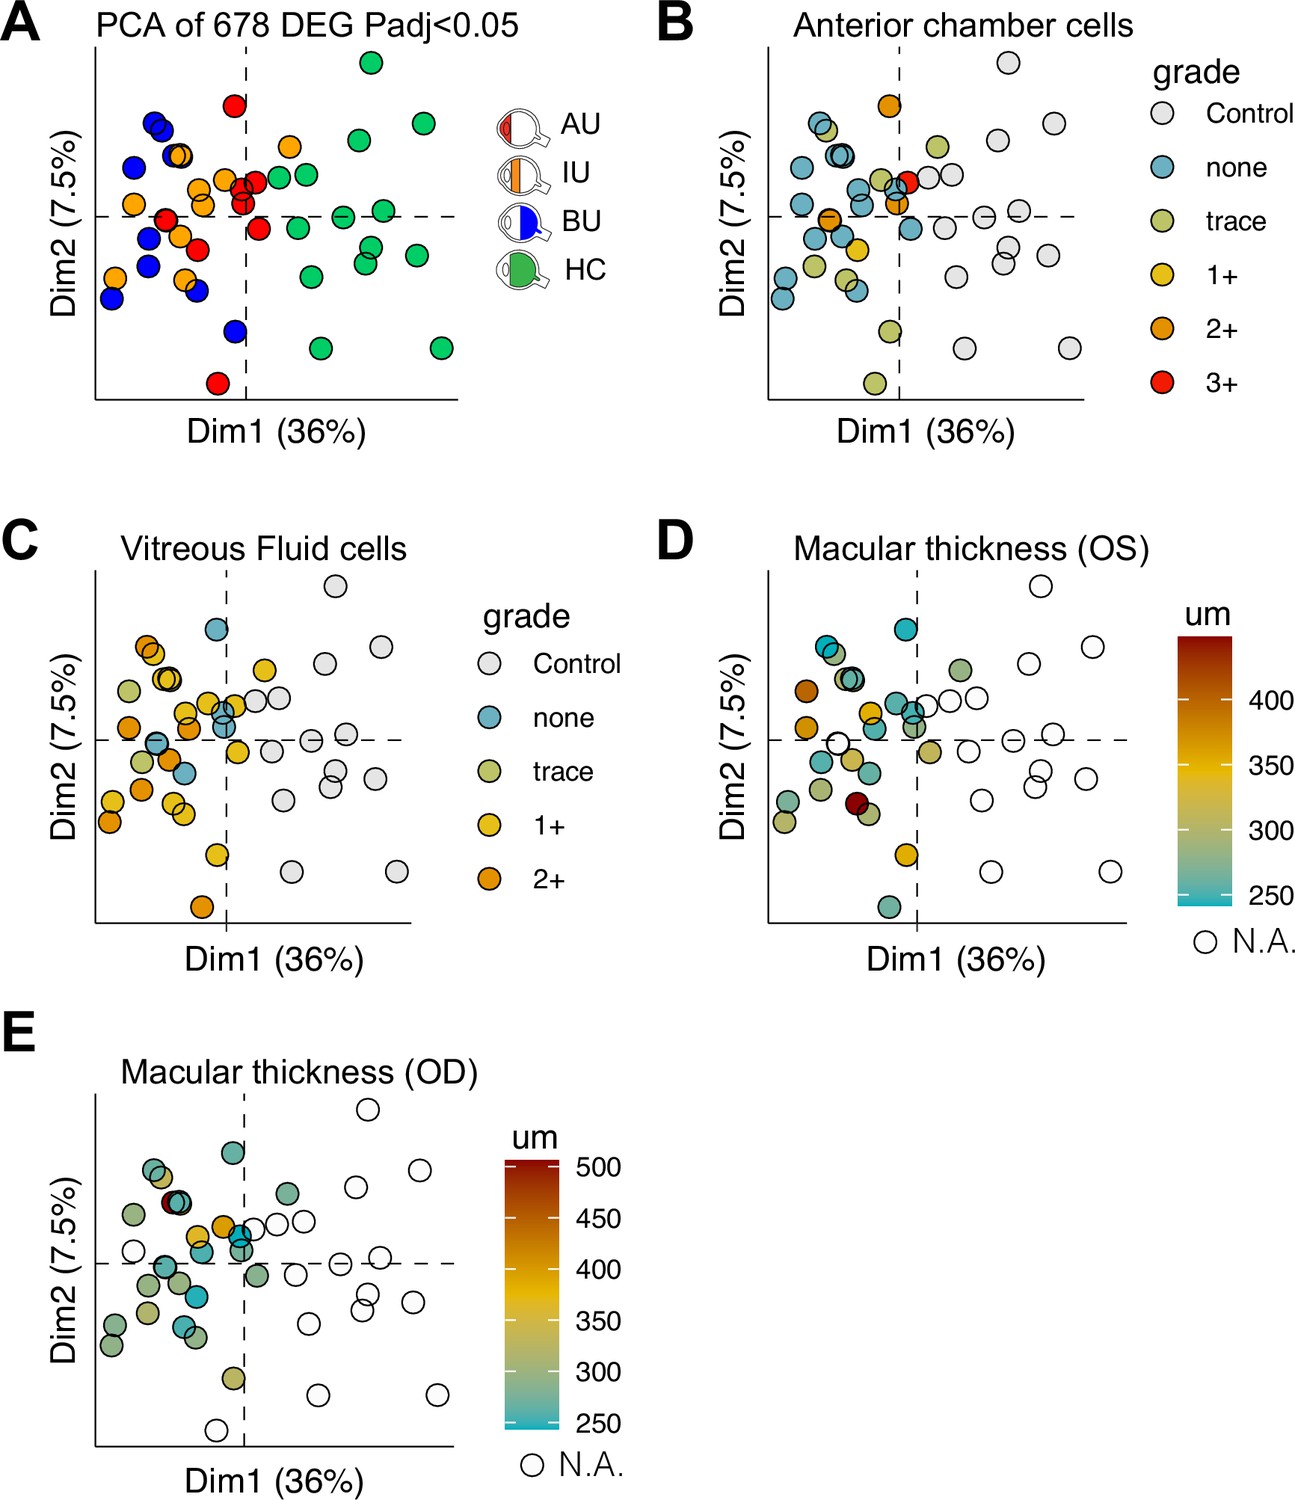
Clinical parameters of disease activity in non-infectious uveitis in cohort II.
A principal component analysis (PCA) plot based on the 678 differentially expressed genes (padj < 0.05) (A), the anterior chamber cell grade (B), vitreous fluid cell grade (C), macular thickness in the left (OS) eye as determined by optical coherence tomography (OCT) (D), and macular thickness in the right eye (OD) as determined by OCT (E) are shown.
Figure 1—figure supplement 3
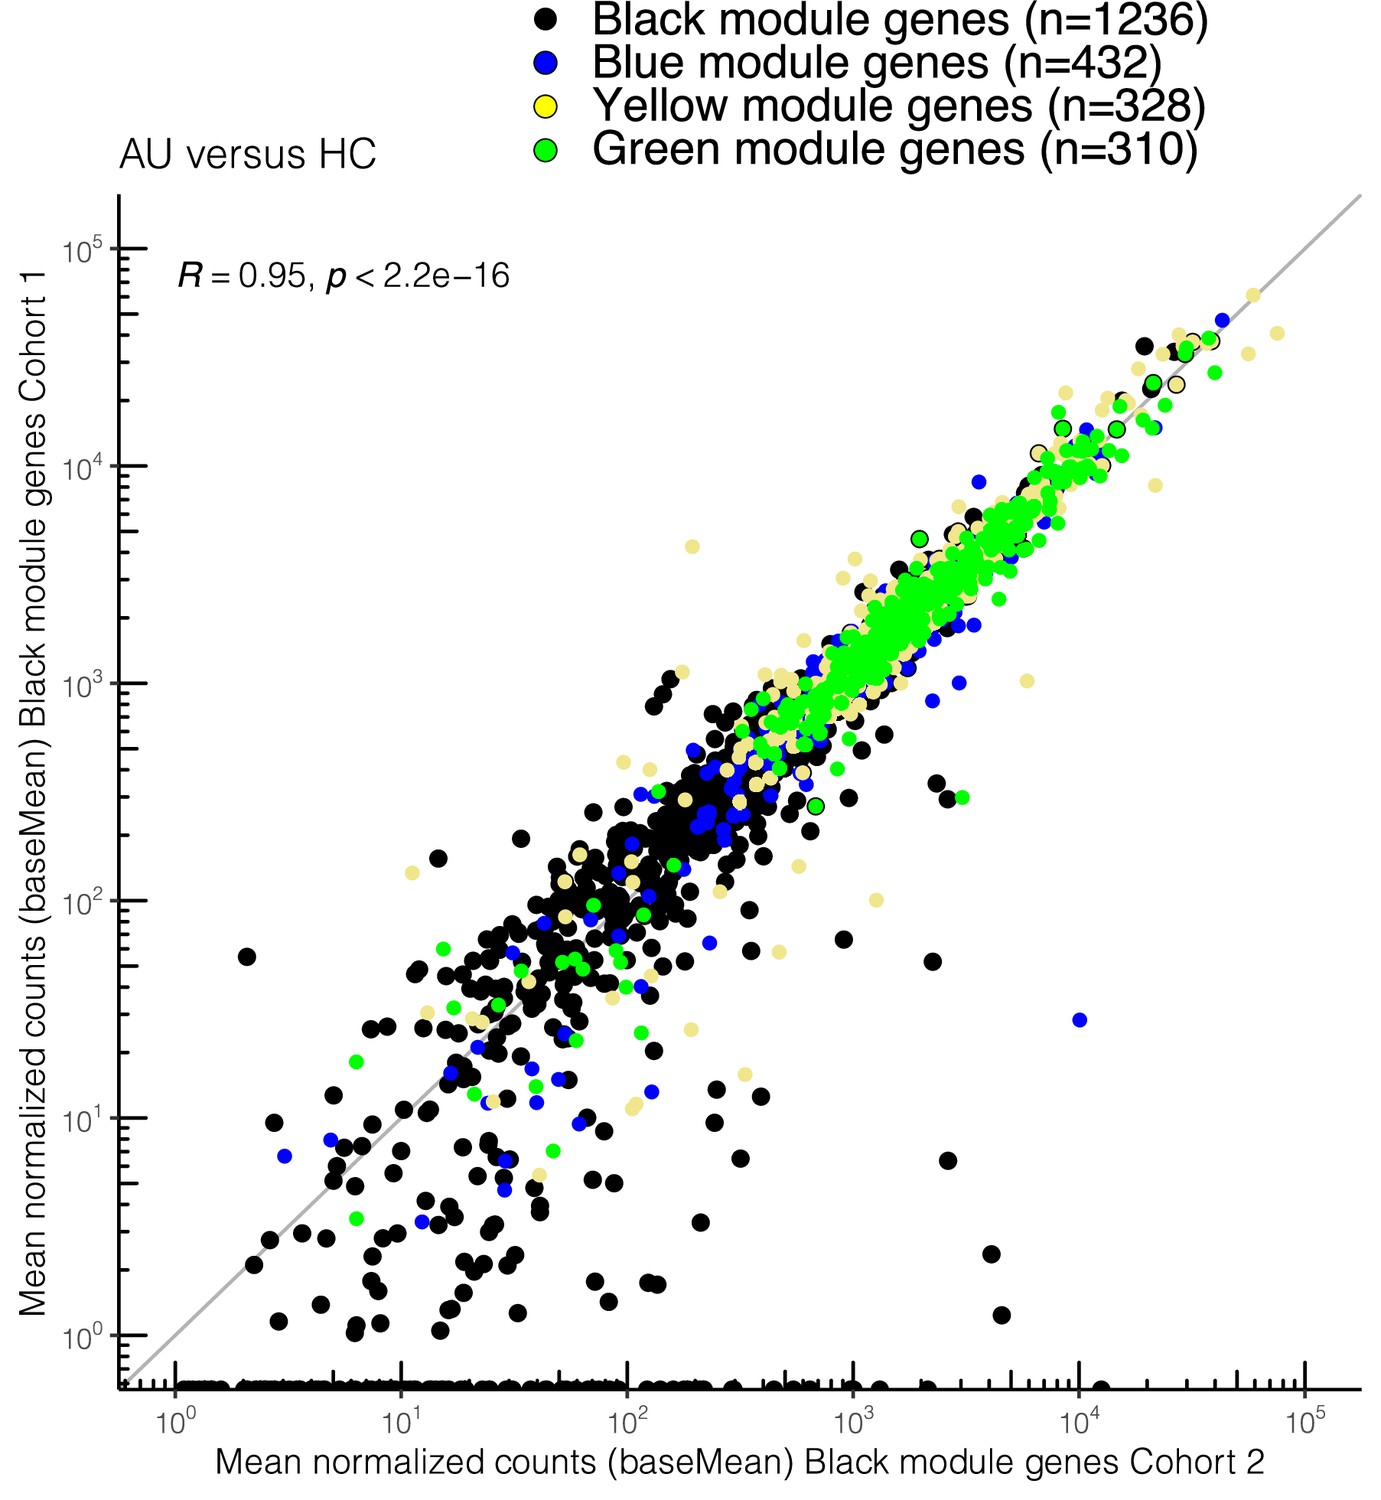
Correlation plot of the mean normalized count (baseMean from DESeq2) of the black module genes from cohort II and the 147 overlapping genes in the blue, yellow, and green module in cohort I.
Figure 2 with 1 supplement
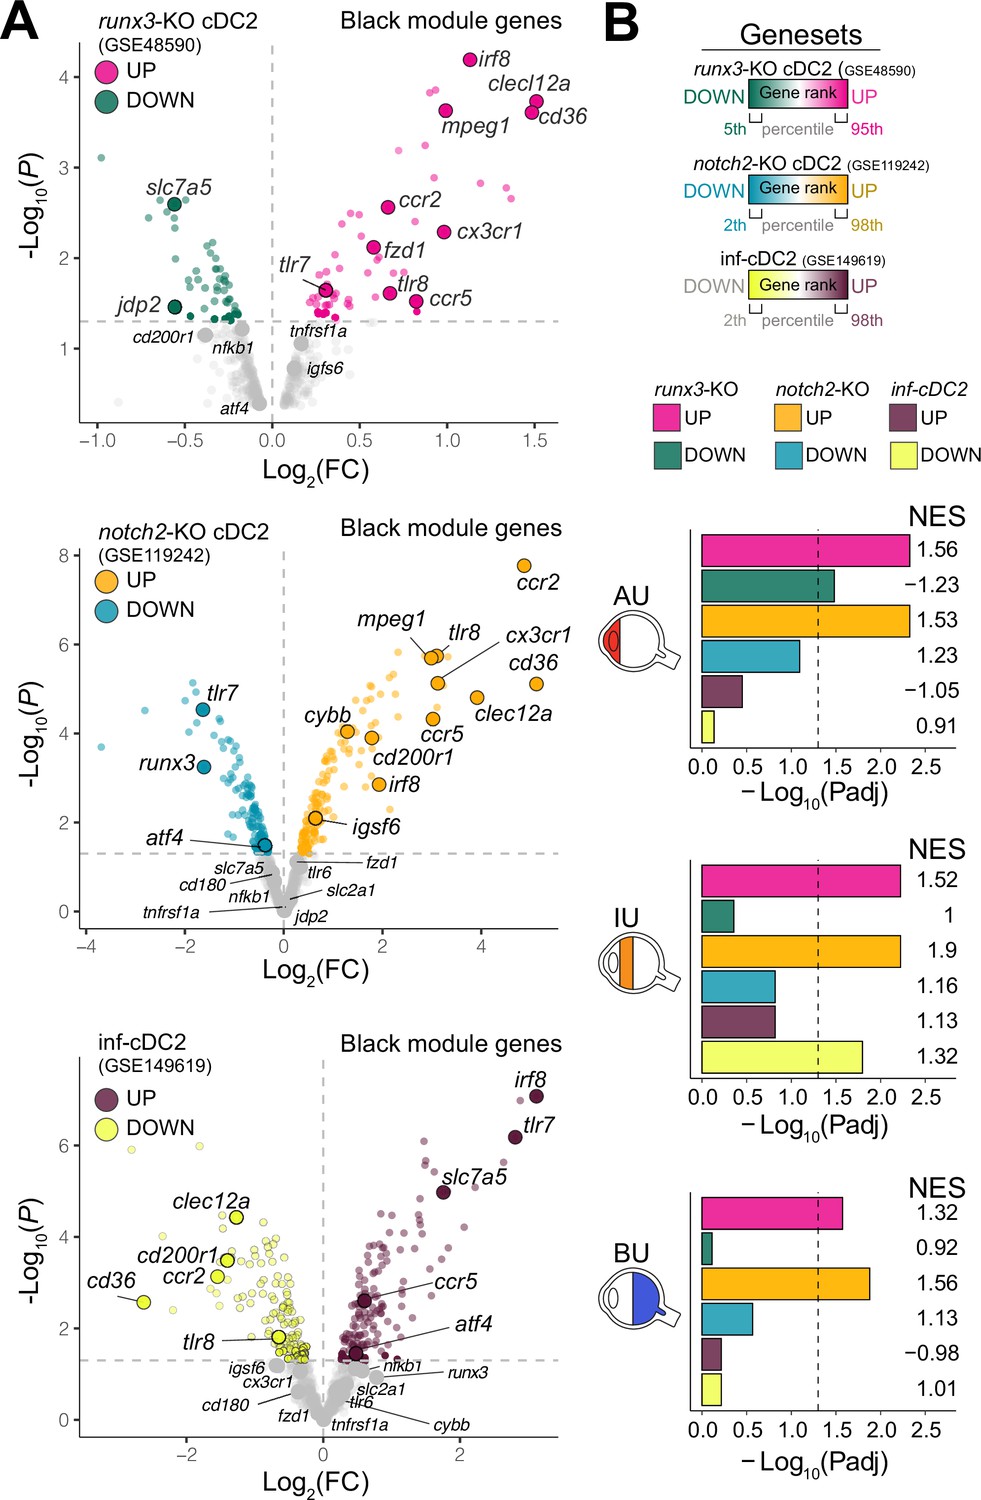
The CX3CR1 gene module of CD1c+ DCs is enriched for NOTCH2-RUNX3 signaling.
(A) Volcano plot for the expression of genes of the black module in cDC2s of runx3-KO mice (GSE48590), notch2-KO mice (GSE119242), and type I IFN-dependent inflammatory [inf-]cDC2s (GSE149619). Up- and downregulated genes for each condition are indicated for each condition; gray dots denote the genes with no significant change in expression. (B) Results from gene set enrichment analysis for ranked transcriptomes (using 20,668 genes with baseMean >4) for AU, IU, and BU patients. The top or bottom percentiles of the ranked [−log10(p) × sign(log2(FC))] genes from runx3-KO cDC2s, notch2-KO cDC2s, and inf-cDC2s (see a) were used as gene sets. Normalized enrichment scores (NES) and p values for each gene set are indicated. The dotted lines indicate padj = 0.05. AU: anterior uveitis, IU: intermediate uveitis, BU: birdshot uveitis.
Figure 2—figure supplement 1
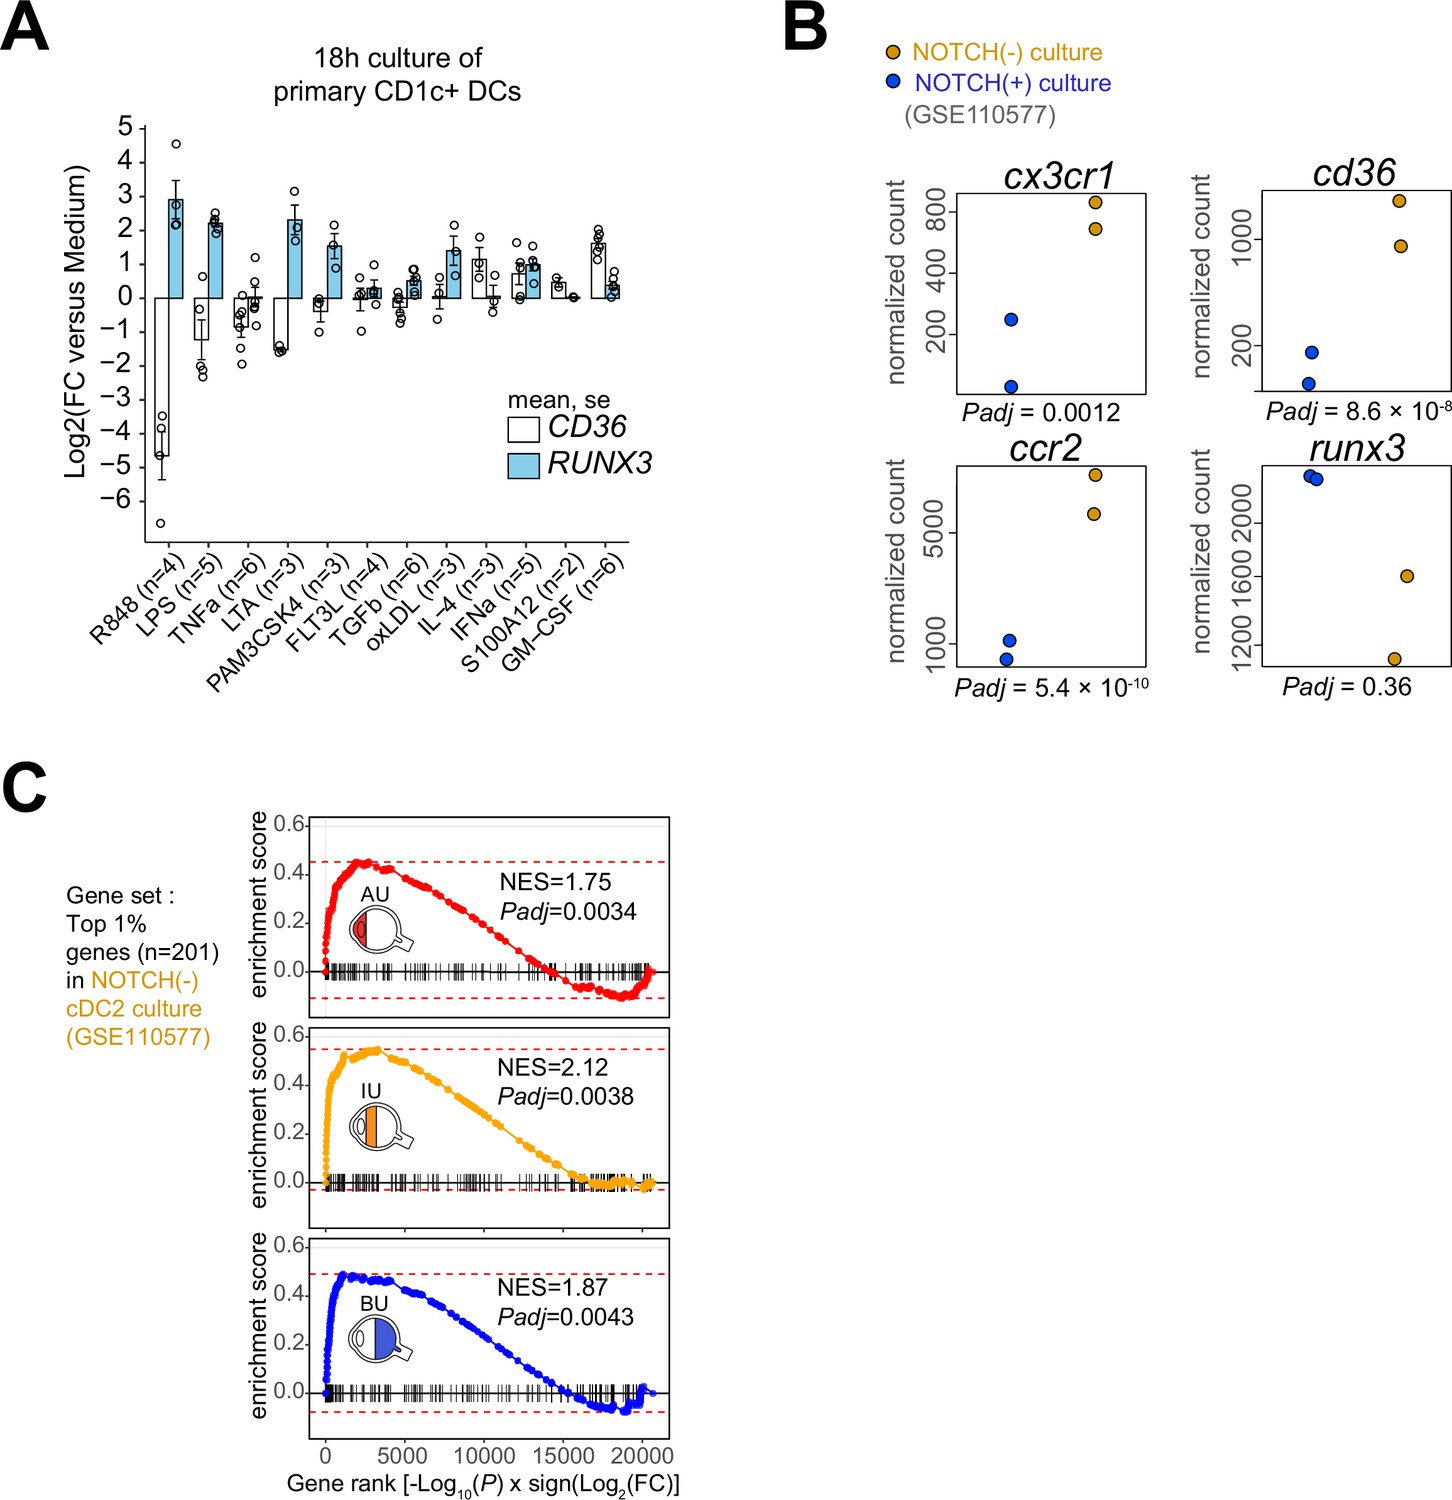
In vitro stimulation of CD1c+ DCs and gene enrichment analysis.
(A) Gene expression (mean [standard error of the mean, SEM]) for RUNX3 and CD36 in primary human CD1c+ DCs from healthy donors stimulated overnight. Each dot represents a single donor used in the experiment. (B) Transcriptomic data (GSE110577, described by Kirkling et al., 2018) of murine bone marrow progenitors cultured for 7 days with OP9 stromal cells that express the NOTCH2 ligand DLL1 or OP-9 cells without DLL1. This analysis revealed that notch2-controlled genes were enriched in the transcriptome of CD1c+ DCs of patients and that notch2-signaling associates with the expression of cd36, ccr2, and cx3cr1 in cDC2s. Normalized counts (and adjusted p values from DESeq2) for cx3cr1, ccr2, cd36, and runx3 from cDC2s generated from murine bone marrow cells and OP-9 with (in blue) or without (in ochre) Notch ligand Delta-like 1 (DLL1). (C) Gene set enrichment analysis using the top 1% (n = 201) genes associated with the NOTCH-negative condition in b as the gene set. R848: Resiquimod, LTA: lipoteichoic acid, LPS: lipopolysaccharides, Pam3CSK4: Pam3CysSerLys4, OxLDL: oxidized low-density lipoprotein, IFNα: interferon alpha, TGFβ: transforming growth factor beta, FLT3L: FMS-like tyrosine kinase 3 ligand, TNFα: tumor necrosis factor alpha, S100A12: S100 calcium-binding protein A12, IL-4: interleukin 4, GM-CSF: granulocyte-macrophage colony-stimulating factor.
Figure 3 with 3 supplements
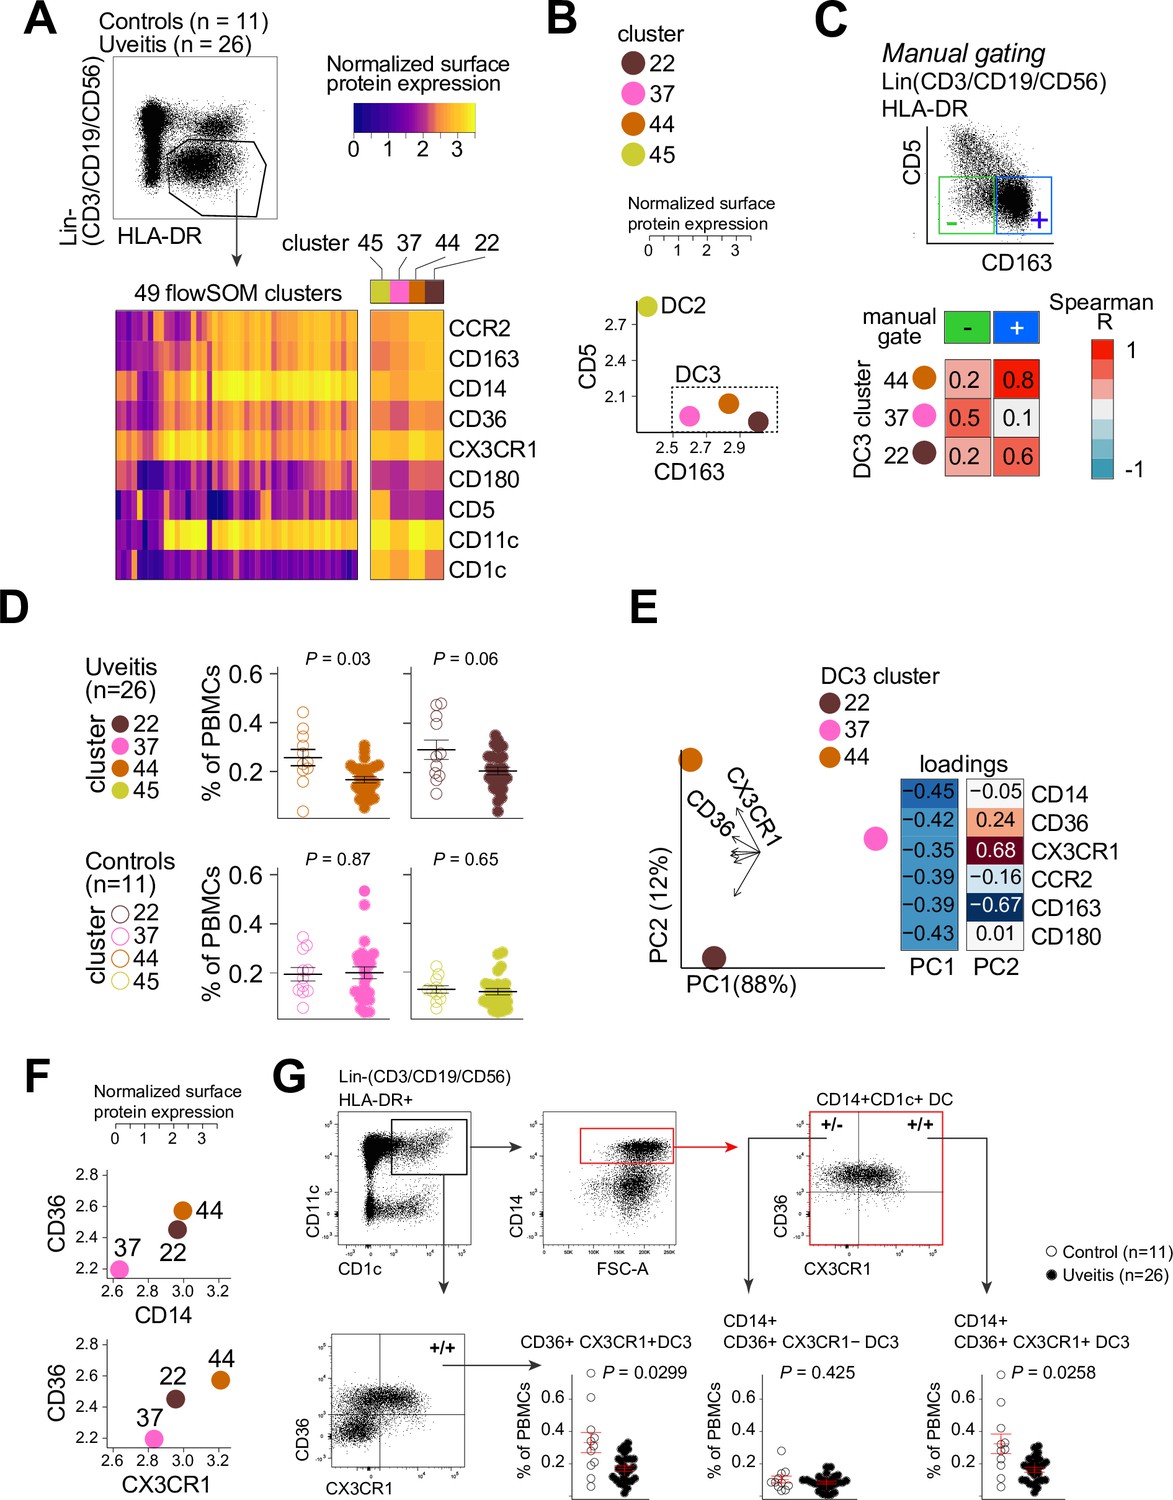
CX3CR1+ DC3s are decreased in the blood of patients with non-infectious uveitis.
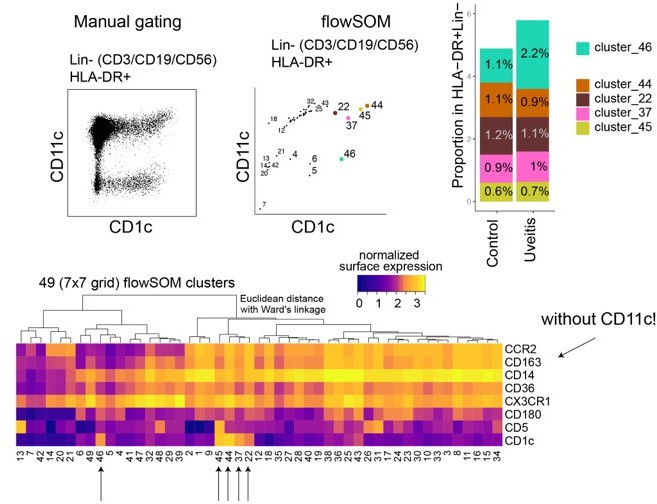
(A) Heatmap of the surface protein expression for 49 flowSOM clusters of flow-cytometry analysis of PBMC samples from 26 patients and 11 controls. The four CD1c+ (CD3−CD19−CD56−HLA-DR+CD11c+) DC clusters identified (clusters 22, 37, 44, and 45) are shown (detailed heatmap in Figure 3—figure supplement 1A). (B) Biplot of the normalized surface expression of CD5 and CD163 for the four CD1c+ DC clusters. (C) Correlation plot between manually gated CD5−CD163− DC3s and CD5−CD163+ DC3s and DC3 flowSOM clusters 22, 37, and 44. (D) The frequency of the 4 CD1c+ DC flowSOM clusters as percentage of PBMCs. p values from Welch’s t-test. (E) Principal component analysis (PCA) biplot of the DC3 clusters 22, 37, and 44. Loadings for PC1 and PC2 are shown on the right. (F) Biplots of the normalized surface expression of CD36, CD14, and CX3CR1 in the DC3 clusters 22, 37, and 44. (G) Manual gating strategy of CD1c+ DC subsets based on CD36 and CX3CR1 in PBMCs in uveitis cases and controls. p value from Welch’s t-test. Details on manual gating strategy: see Figure 3—figure supplement 3. Manual gating revealed that the CD14+CD1c+ DCs (DC3s) can be further subdivided in a CX3CR1− and a CX3CR1+ population.
Figure 3—figure supplement 1
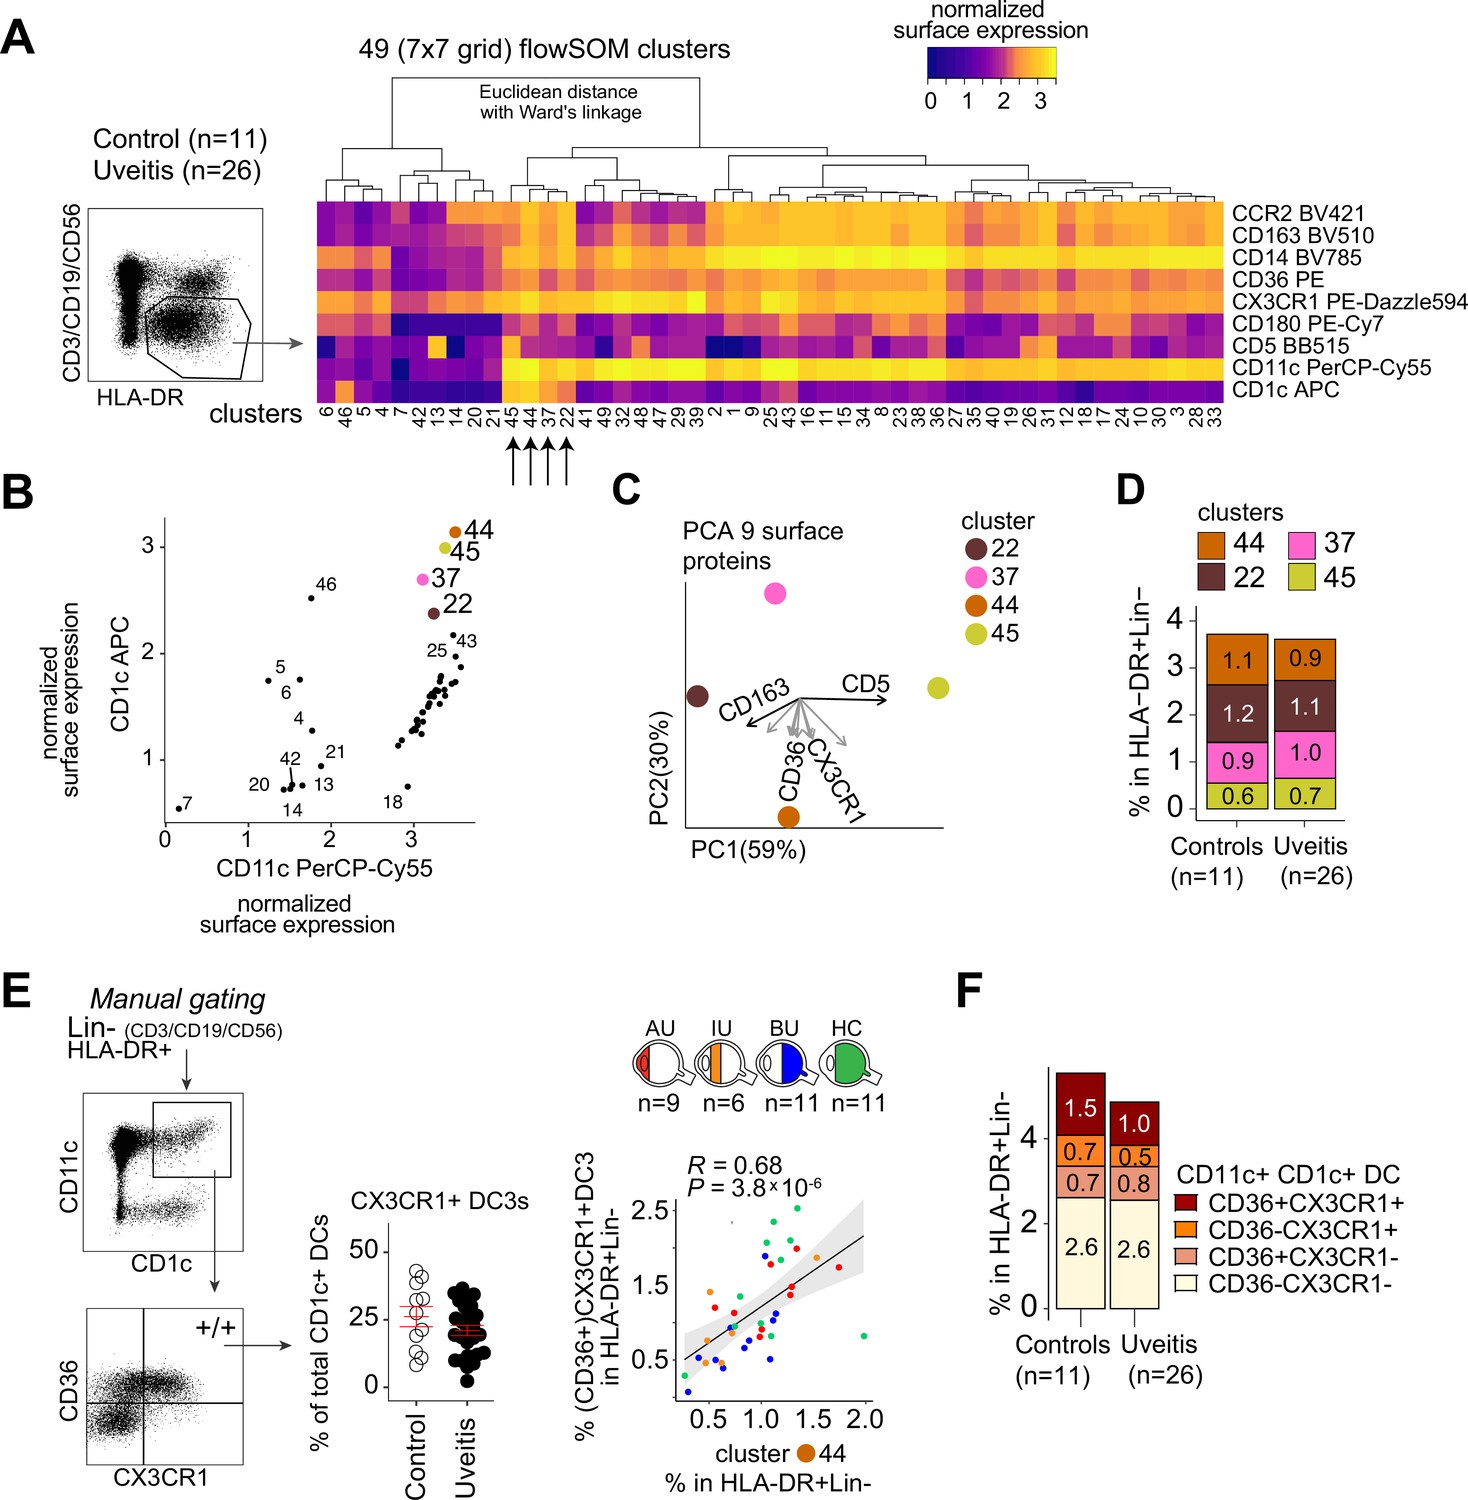
Flow cytometry analysis of peripheral blood CD1c+ DC subsets in non-infectious uveitis.
(A) Heatmap of the surface protein expression for 49 flowSOM clusters of flow-cytometry analysis of PBMC samples from 26 patients and 11 controls. The four CD1c+ (CD3−CD19−CD56−HLA-DR+CD11c+) DC clusters identified (clusters 22, 37, 44, and 45) are highlighted. (B) Biplot of the cell surface expression of CD1c and CD11c for the 49 flowSOM clusters in a. (C) Principal component analysis (PCA) biplot of the surface protein expression for clusters 22, 37, 44, and 45 identified in a. (D) The proportion of the four CD1c+ DC clusters in the HLA-DR+Lin−(CD3−CD19−CD56) population in controls and patients. (E) Manual gating strategy of CD1c+ DC subsets based on CD36 and CX3CR1 and the correlation between CD36+CX3CR1+CD1c+ DCs and the flowSOM cluster 44. R = Spearman correlation. Gray area represents the 95% confidence interval of the linear regression line. (F) The relative proportion of CD1c+ DC subsets based on CD36 and CX3CR1 in the HLA-DR+ Lin− gate.
Figure 3—figure supplement 2
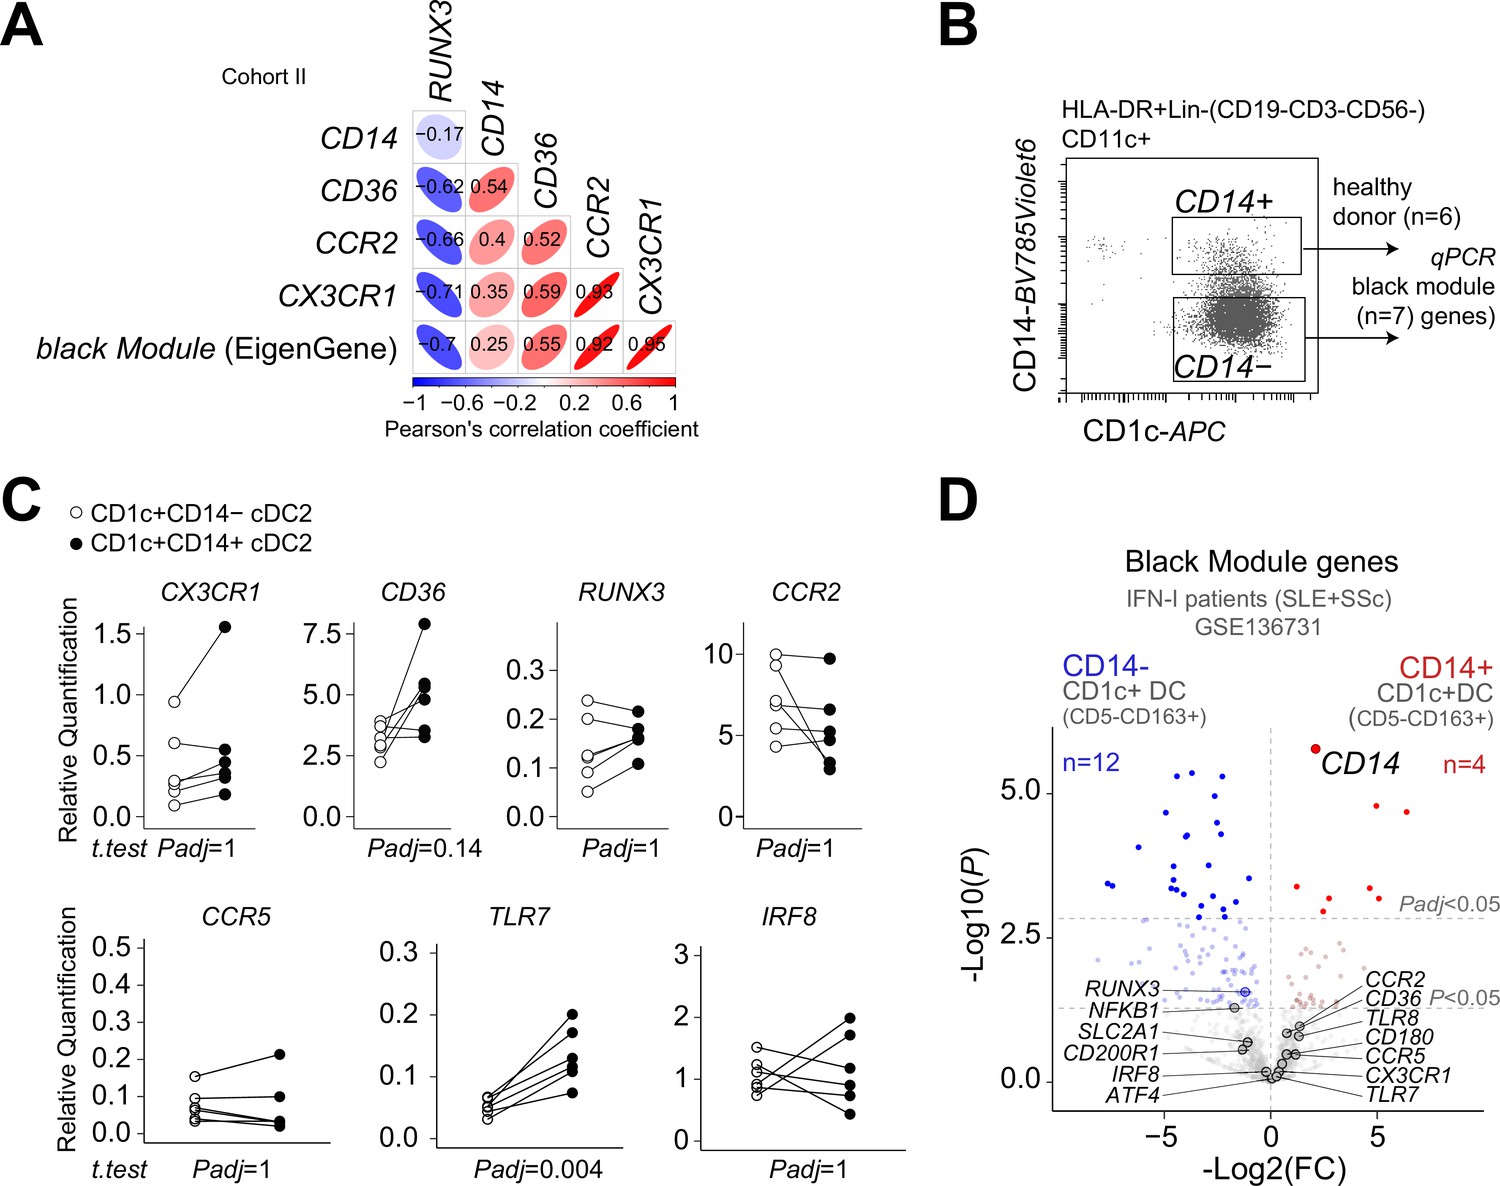
Gene expression profiling of CD14+ and CD14- populations of CD1c+ DCs.
(A) Correlation plot of the gene expression levels of CD14, CD36, CCR2, CX3CR1, and the EigenGene value of the black module. (B) Gating strategy to sort CD14+ and CD14−CD1c+ DCs from healthy donors. (C) Real-time PCR (RT-qPCR) results for a panel of genes of the black module in the sorted CD14+ and CD14−CD1c+ DC fractions in a. padj = adjusted p values from t-test (Bonferroni) corrected for seven genes. (D) Volcano plot showing differential expression analysis for black module genes in CD14+ versus CD14− DC3s purified from systemic lupus erythematosus (SLE) and SSc patients (GSE136731).
Figure 3—figure supplement 3
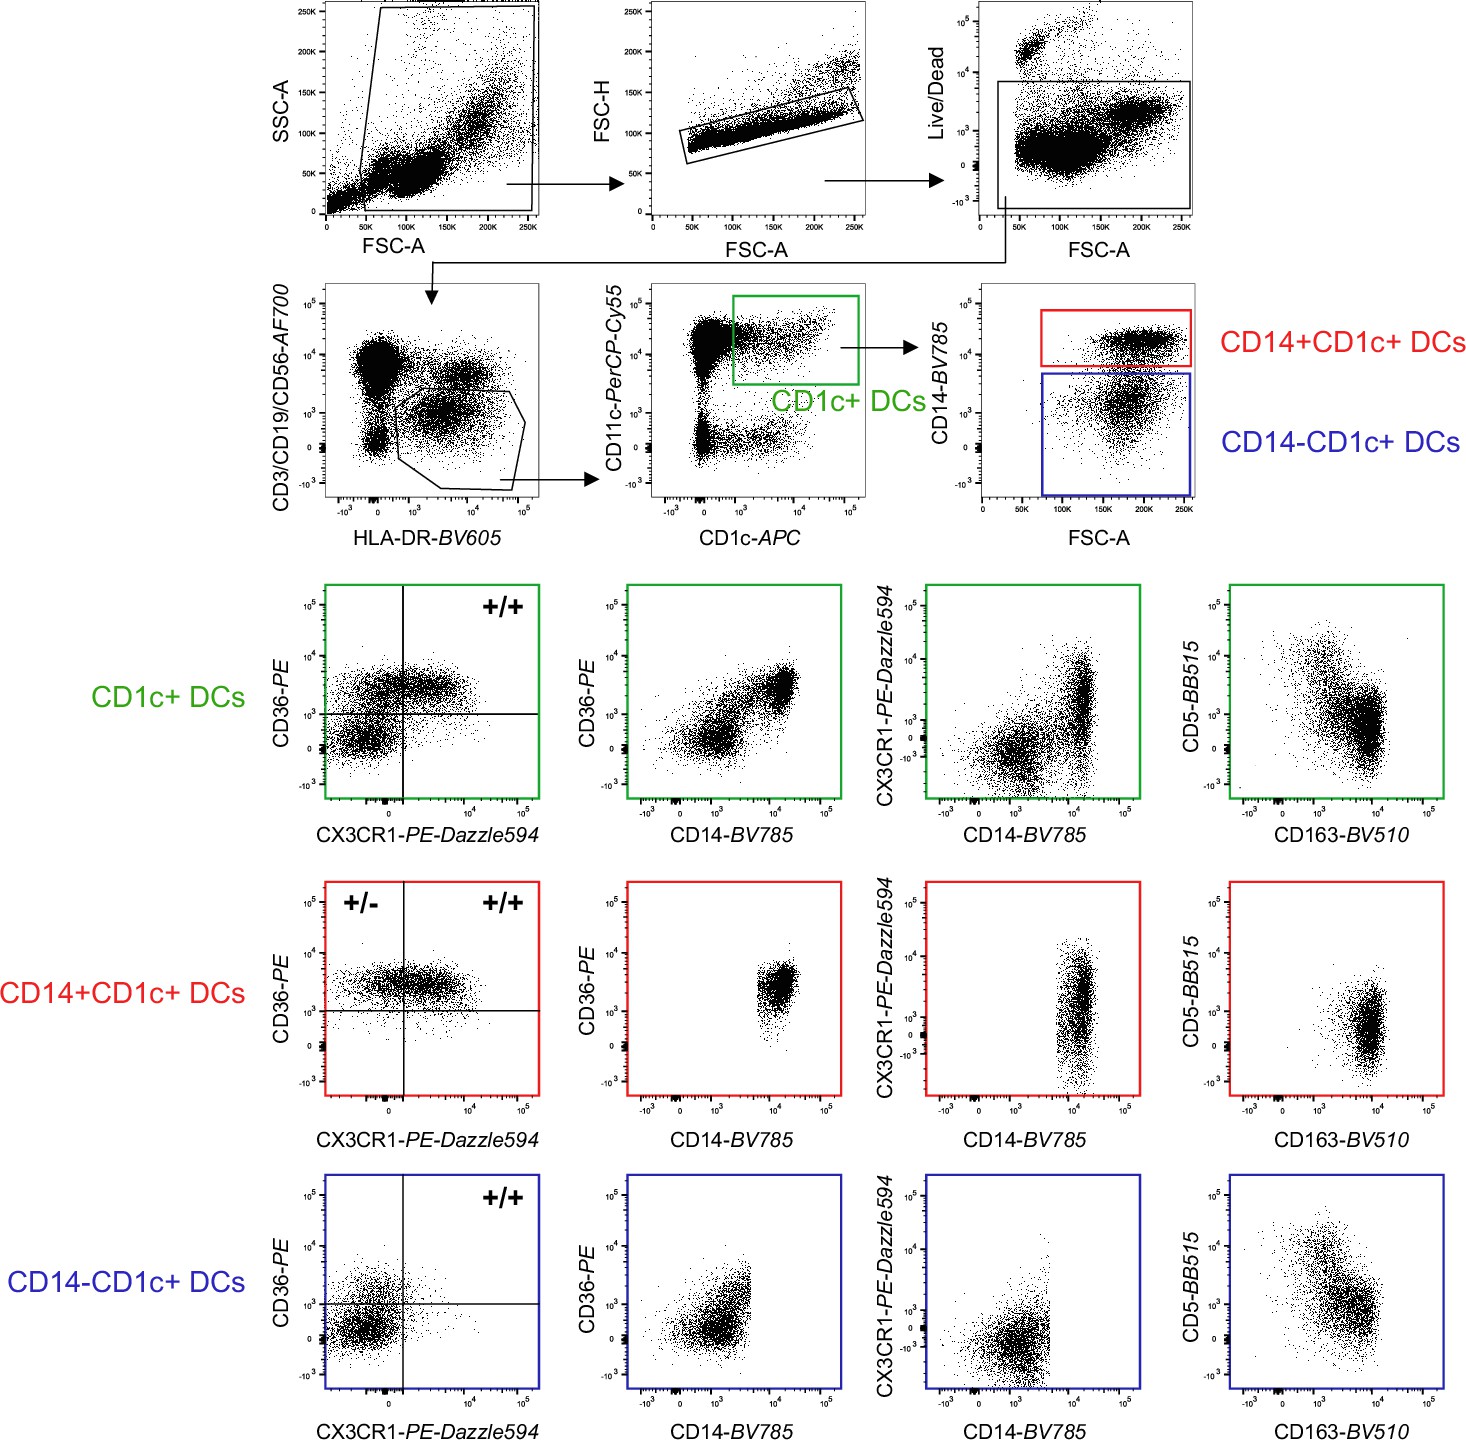
Representative sample of flow-cytometry gating of CD14+ and CD14− fractions of CD1c+ DCs in peripheral blood for the panel used in Figure 3.
Figure 4 with 1 supplement
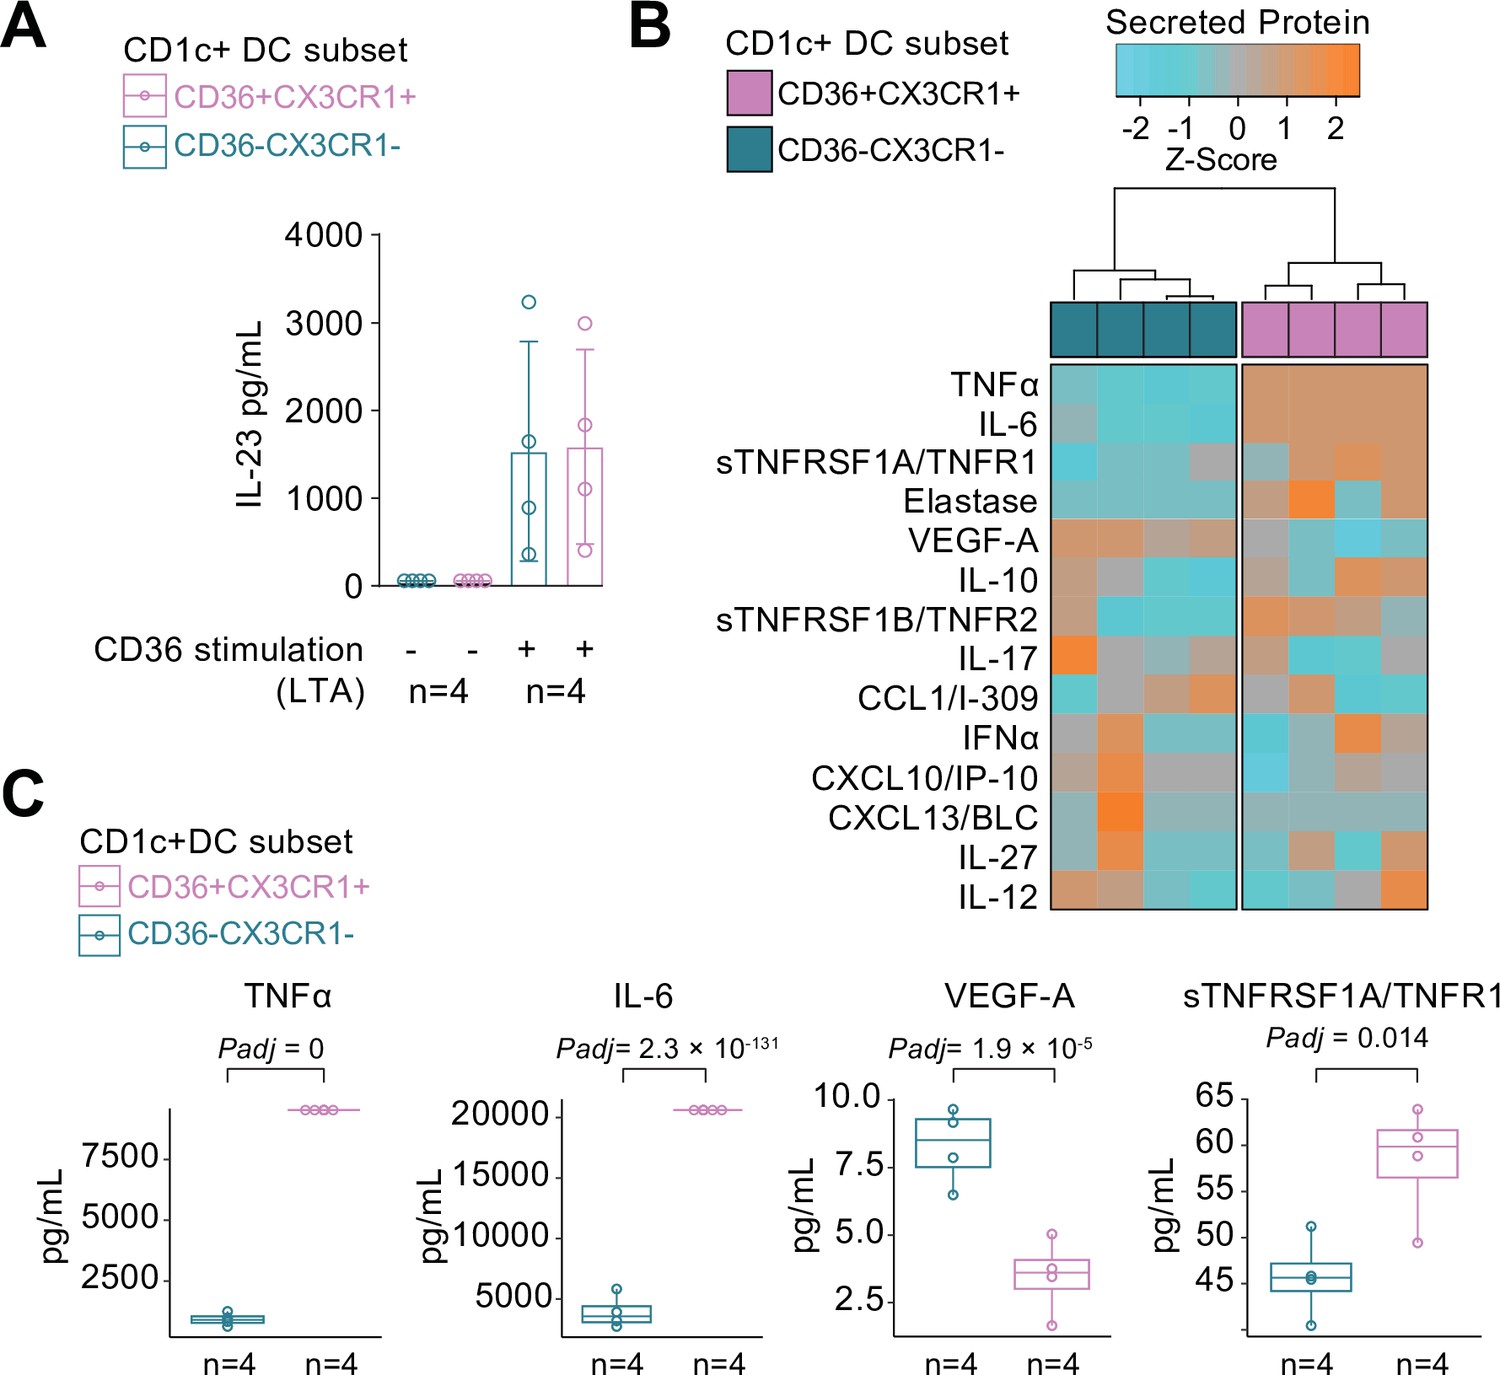
CX3CR1+ DC3s secrete high levels of cytokines implicated in non-infectious uveitis.
(A) The CD1c+ DC cells were fluorescent-activated cell sorting (FACS) sorted into CD36+CX3CR1+ and CD36−CX3CR1−CD1c+ DCs (Figure 4—figure supplement 1). The concentration of IL-23 (ELISA) in supernatants of 18 hr cultured primary human CD1c+ DC subsets cells stimulated with lipoteichoic acid (LTA). (B) Heatmap of the levels (Z-score) of 16 detected proteins in supernatants of 18 hr cultured LTA-stimulated primary human CD1c+ DC subsets cells using an in-house multiplex Luminex assay (Supplementary file 1E). (C) Scatter plots with overlay boxplot with mean and interquartile range of the levels of secreted TNF-alpha, interleukin (IL)-6, VEGF-A, and TNFR1 from the multiplex protein data in d (padj = p values from likelihood ratio test Bonferroni corrected for 16 detected proteins).
Figure 4—figure supplement 1
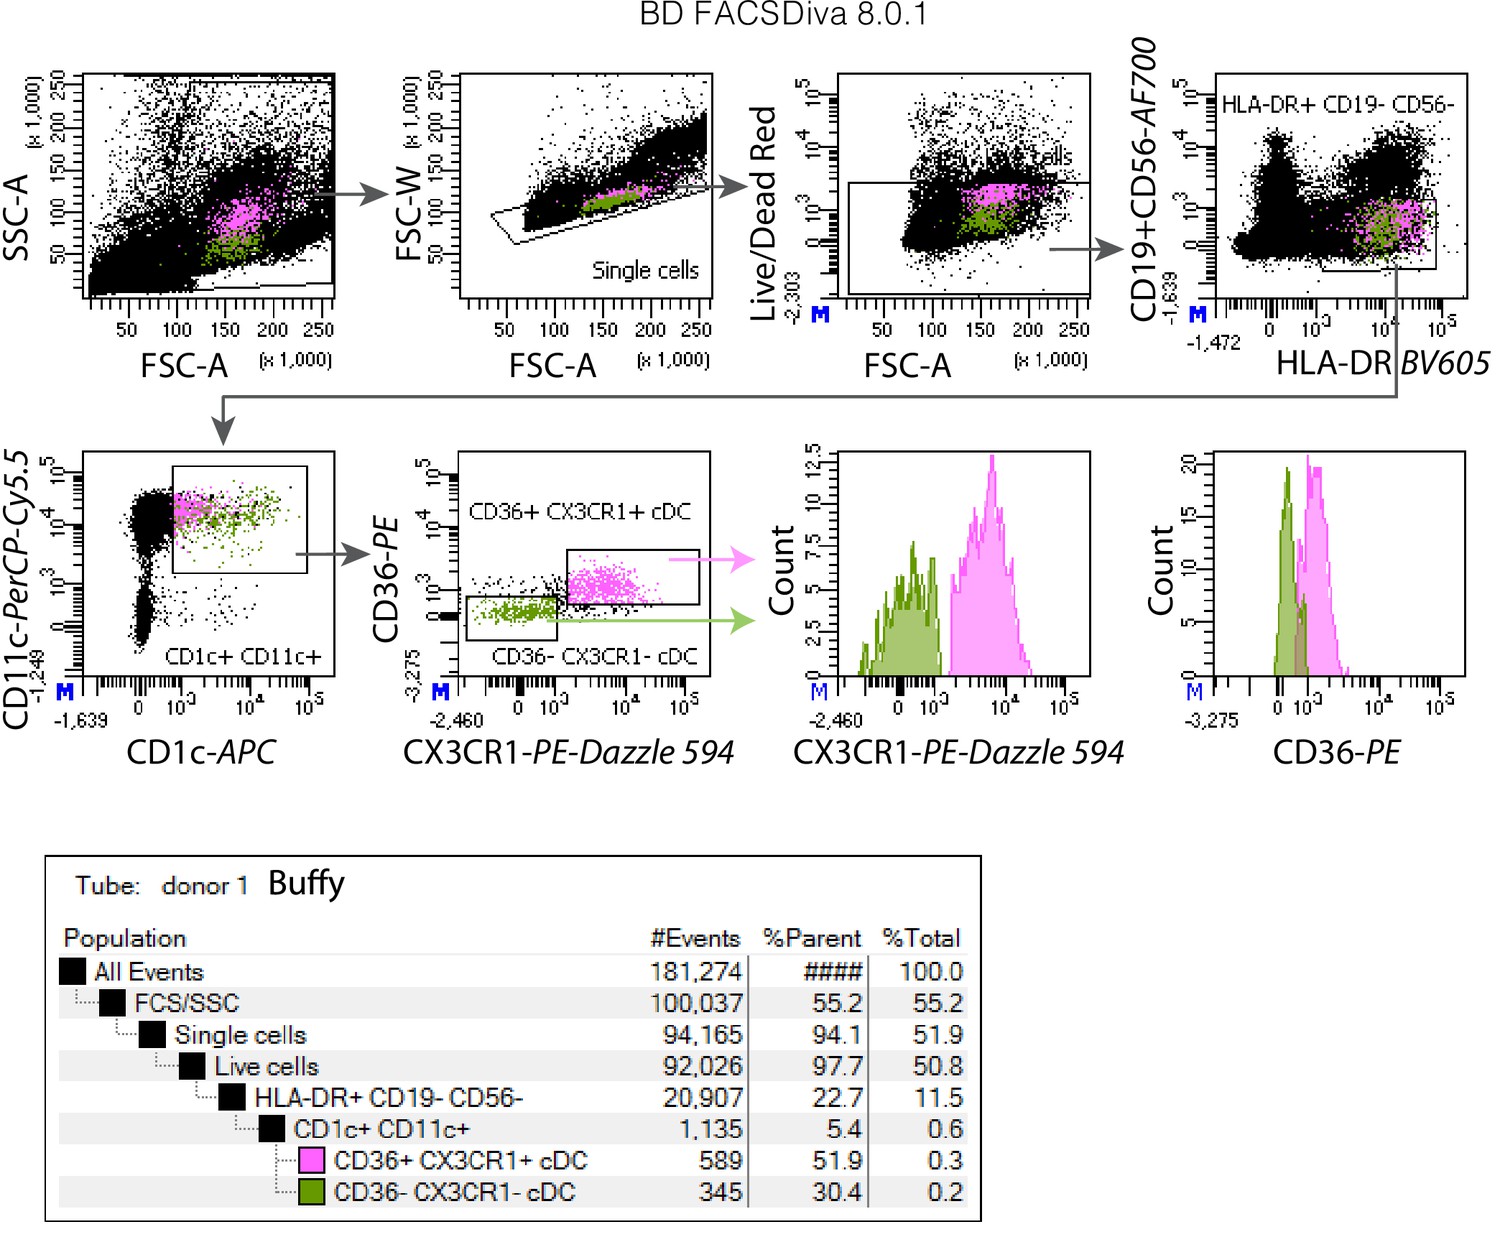
Representative examples of fluorescent-activated cell sorting (FACS) of CD36+CX3CR1+ DC3s and CD36−CX3CR1−CD1c+ DCs used for the analysis in Figure 4.
Figure 5
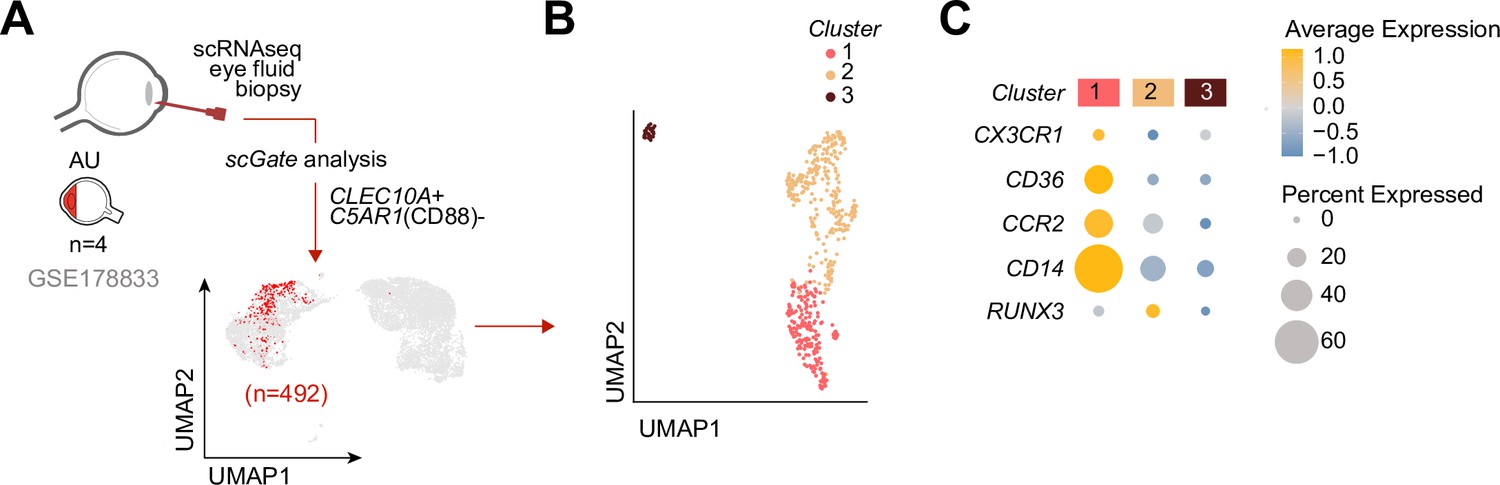
Cells with a gene profile similar to CX3CR1+ DC3s can be found in the inflamed eye during non-infectious uveitis.
(A) Single-cell RNA-sequencing (scRNAseq) analysis of eye fluid biopsies from non-infectious uveitis patients (GSE178833, reported by Kasper et al., 2021). UMAP projections of transcriptomic data from 492 cells (in red) identified by scGate analysis using CLEC10A+ and C5AR1− cells as tissue markers to identify CD1c+ DCs. (B) Unsupervised clustering of CLEC10A+C5AR1− DCs identified in a. (C) Dot plot showing average expression (color-scaled) of key marker genes of the black module and CD14 in each cluster determined in b.
Author response image 1

Manual gating example of human CD34-HPC derived DCs shows substantial autofluorescence.
Author response image 2
Tables
Table 1
Characteristics of the patients and controls from cohorts I and II.
Abbreviations: BU: birdshot uveitis, AU: HLA-B27-associated anterior uveitis, HC: healthy control, IU: idiopathic intermediate uveitis, n.a.: not applicable, *Fisher’s exact test, **ANOVA, ***Kruskal–Wallis.
| Cohort I | AU | IU | BU | HC | p value |
|---|---|---|---|---|---|
| N | 10 | 5 | 8 | 13 | Total = 36 |
| Male/female | 2/8 | 3/2 | 5/3 | 5/8 | 0.26* |
| Age in years; mean ± SD | 45 ± 16 | 30 ± 9 | 42 ± 10 | 42 ± 13 | 0.24*** |
| Disease duration in years; median (range) | 8.1 (0.2–22.3) | 3.4 (0.4–14.1) | 0.9 (0.2–19.9) | n.a. | 0.36** |
| Cohort II | AU | IU | BU | HC | p value |
| N | 9 | 9 | 10 | 14 | Total = 42 |
| Male/female | 3/6 | 2/7 | 4/6 | 6/8 | 0.8790* |
| Age in years; mean ± SD | 47 ± 17 | 39 ± 14 | 52 ± 13 | 39 ± 10 | 0.06*** |
| Disease duration in years; median (range) | 5.8 (0.1–39.3) | 3.7 (0.2–20.0) | 1.3 (0.2–15.1) | n.a. | 0.14** |
Appendix 1—key resources table
| Reagent type (species) or resource | Designation | Source or reference | Identifiers | Additional information |
|---|---|---|---|---|
| Biological sample (Homo sapiens) | Aqueous humor (AqH) | Department of Ophthalmology, University Medical Center Utrecht, Utrecht, The Netherlands | ||
| Biological sample (Homo sapiens) | Blood Plasma (EDTA tubes) | Department of Ophthalmology, University Medical Center Utrecht, Utrecht, The Netherlands | ||
| Antibody | Anti-human CD14-FITC Clone: TÜK4 (mouse monoclonal) | Miltenyi | CAT# 130-080-701 | (Dilution:) 1:50 |
| Antibody | Anti-human CCR2-BV421 Clone: K036C2 (mouse monoclonal) | BioLegend | CAT# 357210 | (Dilution:) 1:150 |
| Antibody | Anti-human CD11c-PerCP-Cy5.5 Clone: Bu15 (mouse monoclonal) | BioLegend | CAT# 337210 | (Dilution:) 1:200 |
| Antibody | Anti-human CD123-FITC Clone: 6 H6 (mouse monoclonal) | eBioscience | CAT# 11-1239-42 | (Dilution:) 1:20 |
| Antibody | Anti-human CD14-PerCP-Cy5.5 Clone: HCD14 (mouse monoclonal) | BioLegend | CAT# 325622 | (Dilution:) 1:100 |
| Antibody | Anti-human CD14-BV785 Clone: M5E2 (mouse monoclonal) | BioLegend | CAT# 301840 | (Dilution:) 1:100 |
| Antibody | Anti-human CD141 BDCA3-APC Clone: AD5-14H12 (mouse monoclonal) | Miltenyi | CAT# 130-090-907 | (Dilution:) 1:20 |
| Antibody | Anti-human CD163-BV510 Clone: GHI/61 (mouse monoclonal) | BioLegend | CAT# 333628 | (Dilution:) 1:25 |
| Antibody | Anti-human CD180-PE/Cy7 Clone: MHR73-11 (mouse monoclonal) | BioLegend | CAT# 312910 | (Dilution:) 1:100 |
| Antibody | Anti-human CD19-eF450 Clone: HIB19 (mouse monoclonal) | eBioscience | CAT# 48-0199-42 | (Dilution:) 1:25 |
| Antibody | Anti-human CD19-BV605 Clone: SJ25C1 (mouse monoclonal) | BD | CAT# 562653 | (Dilution:) 1:50 |
| Antibody | Anti-human CD19-AF700 Clone: HIB19 (mouse monoclonal) | eBioscience | CAT# 56-0199-42 | (Dilution:) 1:50 |
| Antibody | Anti-human CD1c-APC Clone: L161 (mouse monoclonal) | eBioscience | CAT# 17-0015-42 | (Dilution sorting cohort 2:) 1:50 |
| Antibody | Anti-human CD1c BDCA1-BV421 Clone: L161 (mouse monoclonal) | BioLegend | CAT# 331526 | (Dilution:) 1:25 |
| Antibody | Anti-human CD1c BDCA1-APC Clone: L161 (mouse monoclonal) | eBioscience | CAT# 17-0015-42 | (Dilution purity check cohort 1:) 1:20 |
| Antibody | Anti-human CD20-PE Clone: 2 H7 (mouse monoclonal) | eBioscience | CAT# 12-0209-42 | (Dilution:) 1:50 |
| Antibody | Anti-human CD3-AF700 Clone: UCHT1 (mouse monoclonal) | BioLegend | CAT# 300424 | (Dilution:) 1:50 |
| Antibody | Anti-human CD304 BDCA4-PE Clone: AD5-17F6 (mouse monoclonal) | Miltenyi | CAT# 130-090-533 | (Dilution:) 1:20 |
| Antibody | Anti-human CD36-PE Clone: CB38 (mouse monoclonal) | BD | CAT# 555455 | (Dilution:) 1:200 |
| Antibody | Anti-human CD4-BV711 Clone: OKT4 (mouse monoclonal) | BioLegend | CAT# 317440 | (Dilution:) 1:50 |
| Antibody | Anti-human CD45-PerCP Clone: HI30 (mouse monoclonal) | BioLegend | CAT# 304026 | (Dilution:) 1:100 |
| Antibody | Anti-human CD5-BB515 Clone: UCHT2 (mouse monoclonal) | BD | CAT# 564647 | (Dilution:) 1:100 |
| Antibody | Anti-human CD56-AF700 Clone: B159 (mouse monoclonal) | BD | CAT# 557919 | (Dilution:) 1:50 |
| Antibody | Anti-human CD8-V500 Clone: RPA-T8 (mouse monoclonal) | BD | CAT# 560774 | (Dilution:) 1:50 |
| Antibody | Anti-human CX3CR1-PE/Dazzle594 Clone: 2 A9-1 (rat monoclonal) | BioLegend | CAT# 341624 | (Dilution:) 1:100 |
| Antibody | Anti-human HLA-DR-BV605 Clone: G46-6 (mouse monoclonal) | BD | CAT# 562845 | (Dilution:) 1:150 |
| Other | Viability dye and labelling reagent. Live/Dead-APC-eF780 | eBioscience | CAT# 65-0865-14 | (Dilution:) 1:1000 |
| Chemical compound, drug | R848 | Invivogen | CAT# tlrl-r848 | (Concentration:) 1 µg/ml |
| Chemical compound, drug | Lipoteichoic acid (LTA) | Sigma-Aldrich | CAT# L2515-5MG | (Concentration:) 1 µg/ml |
| Chemical compound, drug | Lipopolysaccharide (LPS) | Invivogen | CAT# tlrl-3pelps | (Concentration:) 10 ng/ml |
| Chemical compound, drug | Pam3CSK4 | Invivogen | CAT# tlrl-pms | (Concentration:) 5 µg/ml |
| Chemical compound, drug | oxLDL | Cell Biolabs | CAT# STA-214 | (Concentration:) 50 µg/ml |
| Chemical compound, drug | TGFβ-b2 | R&D Systems | CAT# 302-B2-002/CF | (Concentration:) 100 ng/ml |
| Chemical compound, drug | FLT3L | Cellgenix | CAT# 1415-05 | (Concentration:) 100 ng/ml |
| Chemical compound, drug | TNFα | R&D Systems | CAT# 210-TA-020 | (Concentration:) 100 ng/ml |
| Chemical compound, drug | S100A12 (EN-RAGE) | R&D Systems | CAT# 1052-ER-050 | (Concentration:) 1 µg/ml |
| Chemical compound, drug | IL-4 | R&D Systems | CAT# 204-IL-50 | (Concentration:) 10 ng/ml |
| Chemical compound, drug | IFNα-2a | Cell Sciences | CAT# CRI003B | (Concentration:) 1000 U/ml |
| Chemical compound, drug | GM-CSF | R&D Systems | CAT# 215 GM-500 | (Concentration:) 800 U/ml |
| Commercial assay or kit | Olink Target 96 Immuno-Oncology | Olink | CAT# 95311 | Olink Targeted Proteomics analysis |
| Commercial assay or kit | TruSeq RNA Library Prep Kit | Illumina | CAT#RS-122-2001 | RNA-seq |
| Commercial assay or kit | AllPrep DNA/RNA/miRNA Universal Kit | QIAGEN | CAT# 80224 | RNA isolations |
| Commercial assay or kit | CD1c (BDCA-1)+Dendritic Cell Isolation Kit, human | Miltenyi Biotec | CAT#130-119-475 | isolation of CD1c+ DCs from PBMCs. |
| Commercial assay or kit | CD19 MicroBeads, human | Miltenyi Biotec | CAT#130-050-301 | Depletion of CD19+ B cells from PBMCs |
| Commercial assay or kit | CD304 (BDCA-4/Neuropilin-1) MicroBead Kit, human | Miltenyi Biotec | CAT#130-090-532 | Depletion of plasmacytoid dendritic cells from PBMCs |
| Commercial assay or kit | Human IL-23 Quantikine ELISA Kit | R&D Systems | CAT# D2300B | Quantification of IL-23 in supernatant of CD1c+ DC cultures |
| Recombinant DNA reagent | CD36 FW (Sequence 5′–3′) AAAGAGGTCCTTATACGTACAGAGTTCGT | Integrated DNA Technologies | qPCR primer | |
| Recombinant DNA reagent | CD36 RV (Sequence 5′–3′) AGCCTTCTGTTCCAACTGATAGTGA | Integrated DNA Technologies | qPCR primer | |
| Recombinant DNA reagent | RUNX3 FW (Sequence 5′–3′) CAATGACGAGAACTACTCCGC | Integrated DNA Technologies | qPCR primer | |
| Recombinant DNA reagent | RUNX3 RV (Sequence 5′–3′) GAAGCGAAGGTCGTTGAACC | Integrated DNA Technologies | qPCR primer | |
| Recombinant DNA reagent | GUSB FW (Sequence 5′–3′) CACCAGGGACCATCCAATACC | Integrated DNA Technologies | qPCR primer | |
| Recombinant DNA reagent | GUSB RV (Sequence 5′–3′) GCAGTCCAGCGTAGTTGAAAAA | Integrated DNA Technologies | qPCR primer | |
| Recombinant DNA reagent | CCR2 FW (Sequence 5′–3′) CCACATCTCGTTCTCGGTTTATC | Integrated DNA Technologies | qPCR primer | |
| Recombinant DNA reagent | CCR2 RV (Sequence 5′–3′) CAGGGAGCACCGTAATCATAATC | Integrated DNA Technologies | qPCR primer | |
| Recombinant DNA reagent | CX3CR1 FW (Sequence 5′–3′) AGTGTCACCGACATTTACCTCC | Integrated DNA Technologies | qPCR primer | |
| Recombinant DNA reagent | CX3CR1 RV (Sequence 5′–3′) AAGGCGGTAGTGAATTTGCAC | Integrated DNA Technologies | qPCR primer | |
| Recombinant DNA reagent | IRF8 FW (Sequence 5′–3′) CGACGCGCACCATTCA | Integrated DNA Technologies | qPCR primer | |
| Recombinant DNA reagent | IRF8 RV (Sequence 5′–3′) GCTTGCCCCCATAGTAGAAGCT | Integrated DNA Technologies | qPCR primer | |
| Recombinant DNA reagent | TLR7 FW (Sequence 5′–3′) CAAGAAAGTTGATGCTATTGGGC | Integrated DNA Technologies | qPCR primer | |
| Recombinant DNA reagent | TLR7 RV (Sequence 5′–3′) TGGTTGAAGAGAGCAGAGCA | Integrated DNA Technologies | qPCR primer | |
| Recombinant DNA reagent | CCR5 FW (Sequence 5′–3′) TGCTACTCGGGAATCCTAAAAACT | Integrated DNA Technologies | qPCR primer | |
| Recombinant DNA reagent | CCR5 RV (Sequence 5′–3′) TTCTGAACTTCTCCCCGACAAA | Integrated DNA Technologies | qPCR primer | |
| Software, algorithm | R Project for Statistical Computing; R version 4.0.3 (2020-10-10) | https://www.r-project.org/ | RRID:SCR_001905 | RNA-seq,flowSOM, statistical analysis |
| Software, algorithm | FlowJo v10.6.1 | BD Biosciences; https://www.flowjo.com/solutions/flowjo | RRID:SCR_008520 | Flow cytometry |
| Software, algorithm | Seurat v3.1.5 | Stuart et al., 2019; http://seurat.r-forge.r-project.org/ | RRID:SCR_007322 | scRNA-seq analysis |
| Software, algorithm | DESeq2 v1.30.1 | https://bioconductor.org/packages/release/bioc/html/DESeq2.html | RRID:SCR_015687 | RNA-seq analysis |
| Software, algorithm | WGCNA v 1.70-3 | http://www.genetics.ucla.edu/labs/horvath/CoexpressionNetwork/ | RRID:SCR_003302 | Co-expression network analysis |
| Software, algorithm | flowSOM | https://github.com/SofieVG/FlowSOM, Van Gassen et al., 2023 | RRID:SCR_016899 | Flowcytometry analysis using a Self-Organizing Map. |
| Software, algorithm | UCell v1.3.1 | https://github.com/carmonalab/UCell, Andreatta and Carmona, 2023 | scRNAseq Module score | |
| Software, algorithm | scGate v1.0.0 | https://github.com/carmonalab/scGate, Andreatta et al., 2023 | Purification of intraocular CD1c+ DCs in scRNAseq data |
Additional files
-
Transparent reporting form
- https://cdn.elifesciences.org/articles/74913/elife-74913-transrepform1-v2.docx
-
Supplementary file 1
Supplementary tables.
(A) Antibody panel used for sorting peripheral blood mononuclear cells. (B) Antibody panel used for determination of CD1c+ DC purity after MACS isolation. (C) Antibody panel used for phenotyping cDC2 populations in uveitis patients. (D) Overview of stimuli used for CD1c+ DC stimulations in Figure 3C. (E) Luminex analysis supernatant of LTA-stimulated CD1c+ DC sorted fraction (protein levels are in pg/mL). (F) Sequences of primers used for RT-qPCR. (G) Results from differential expression analysis and co-expression network analysis in cohort I. (H) Results from differential expression analysis and co-expression network analysis in cohort II. (I) 147 replicated co-expressed genes for cohort 1 and cohort 2
- https://cdn.elifesciences.org/articles/74913/elife-74913-supp1-v2.xlsx
Download links
A two-part list of links to download the article, or parts of the article, in various formats.
Downloads (link to download the article as PDF)
Open citations (links to open the citations from this article in various online reference manager services)
Cite this article (links to download the citations from this article in formats compatible with various reference manager tools)
Transcriptome network analysis implicates CX3CR1-positive type 3 dendritic cells in non-infectious uveitis
eLife 12:e74913.
https://doi.org/10.7554/eLife.74913


