Single-cell analysis of the aged ovarian immune system reveals a shift towards adaptive immunity and attenuated cell function
- Department of Physiology, Biophysics and Systems Biology, Rappaport Faculty of Medicine, Technion – Israel Institute of Technology, Israel
- Rappaport Family Institute for Research in the Medical Sciences, Israel
Figures
Figure 1 with 8 supplements
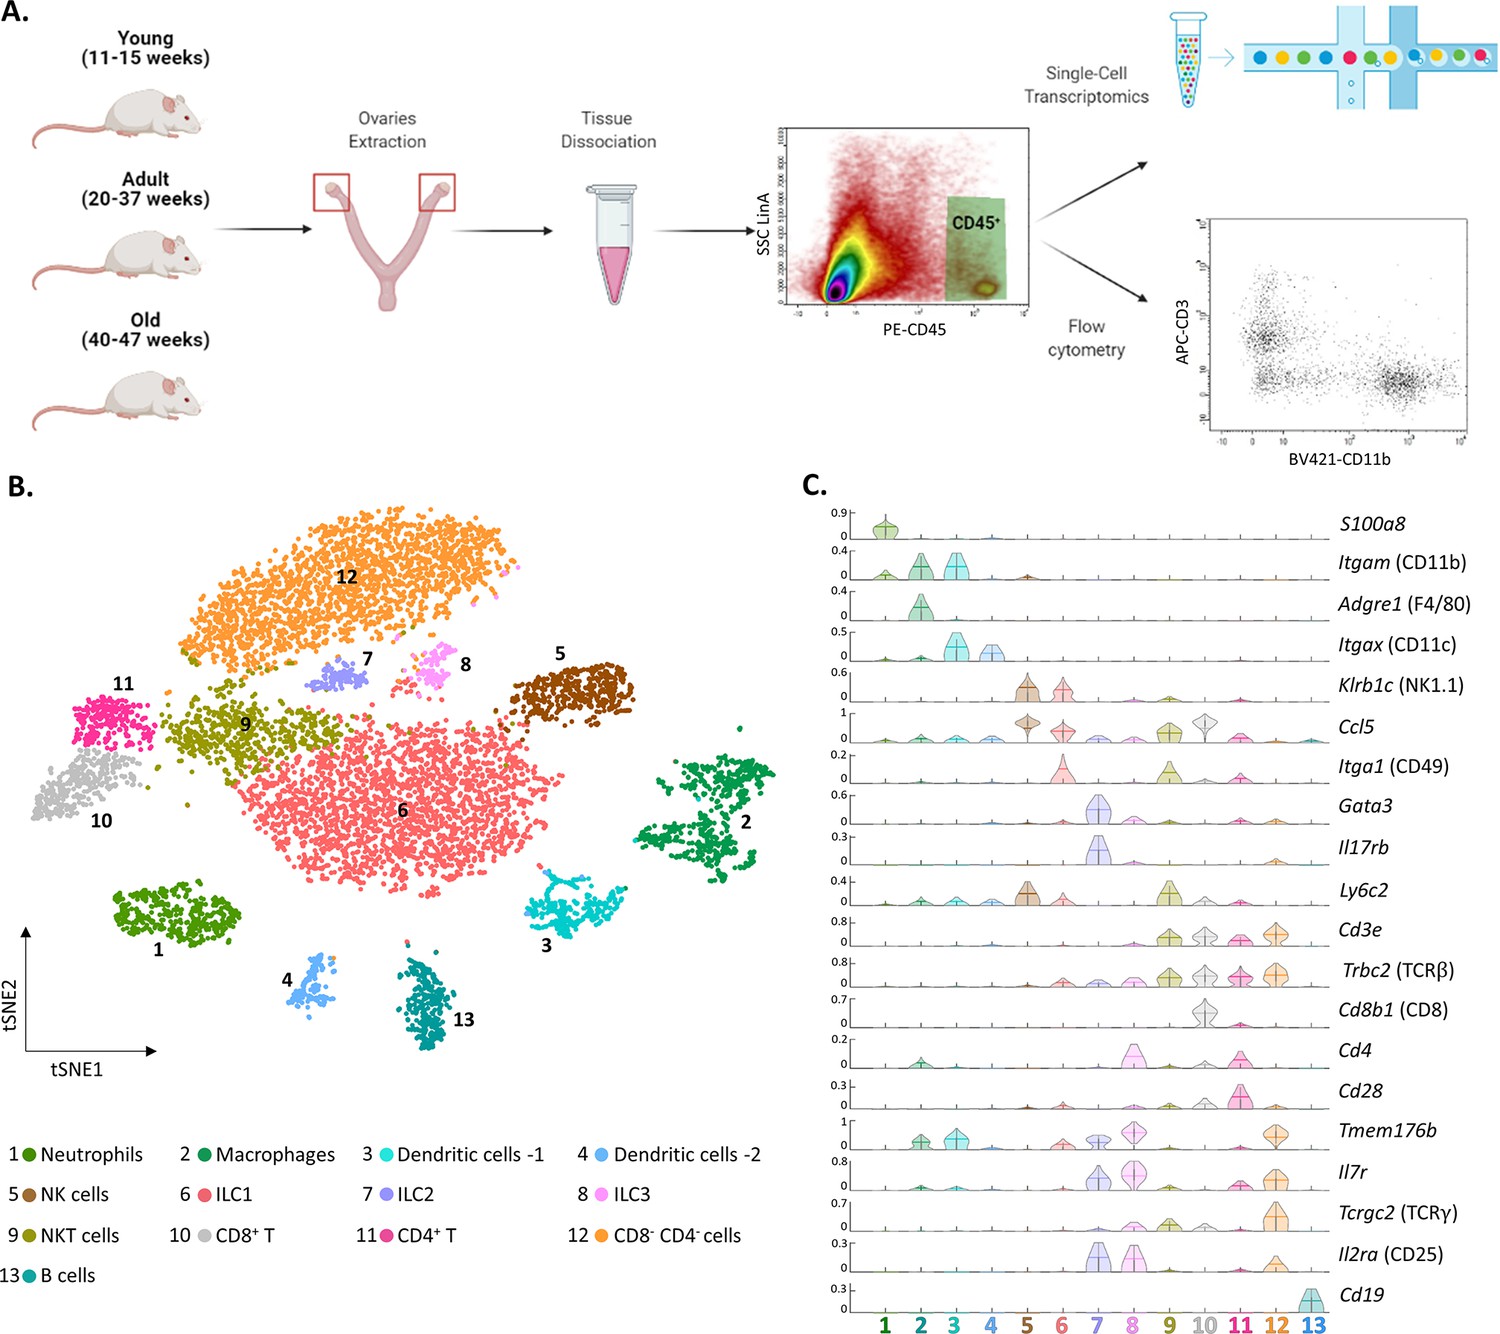
The ovarian immune milieu is consisted of various cell types.
(A) Schematic illustration of the experimental pipeline (created with BioRender.com). Ovaries of female mice at different ages were extracted. Then, cells were gated for CD45 expression and further analyzed using single-cell RNA sequencing or flow cytometry. (B) tSNE plot of joint data from both samples (young and old), divided into clusters. (C) Violin plot of normalized expression for cluster-specific markers. Each row represents the normalized expression of a single marker across all immune clusters. Normalized expression values are between 0–1.
-
Figure 1—source data 1
Young raw data.
- https://cdn.elifesciences.org/articles/74915/elife-74915-fig1-data1-v2.zip
Figure 1—figure supplement 1
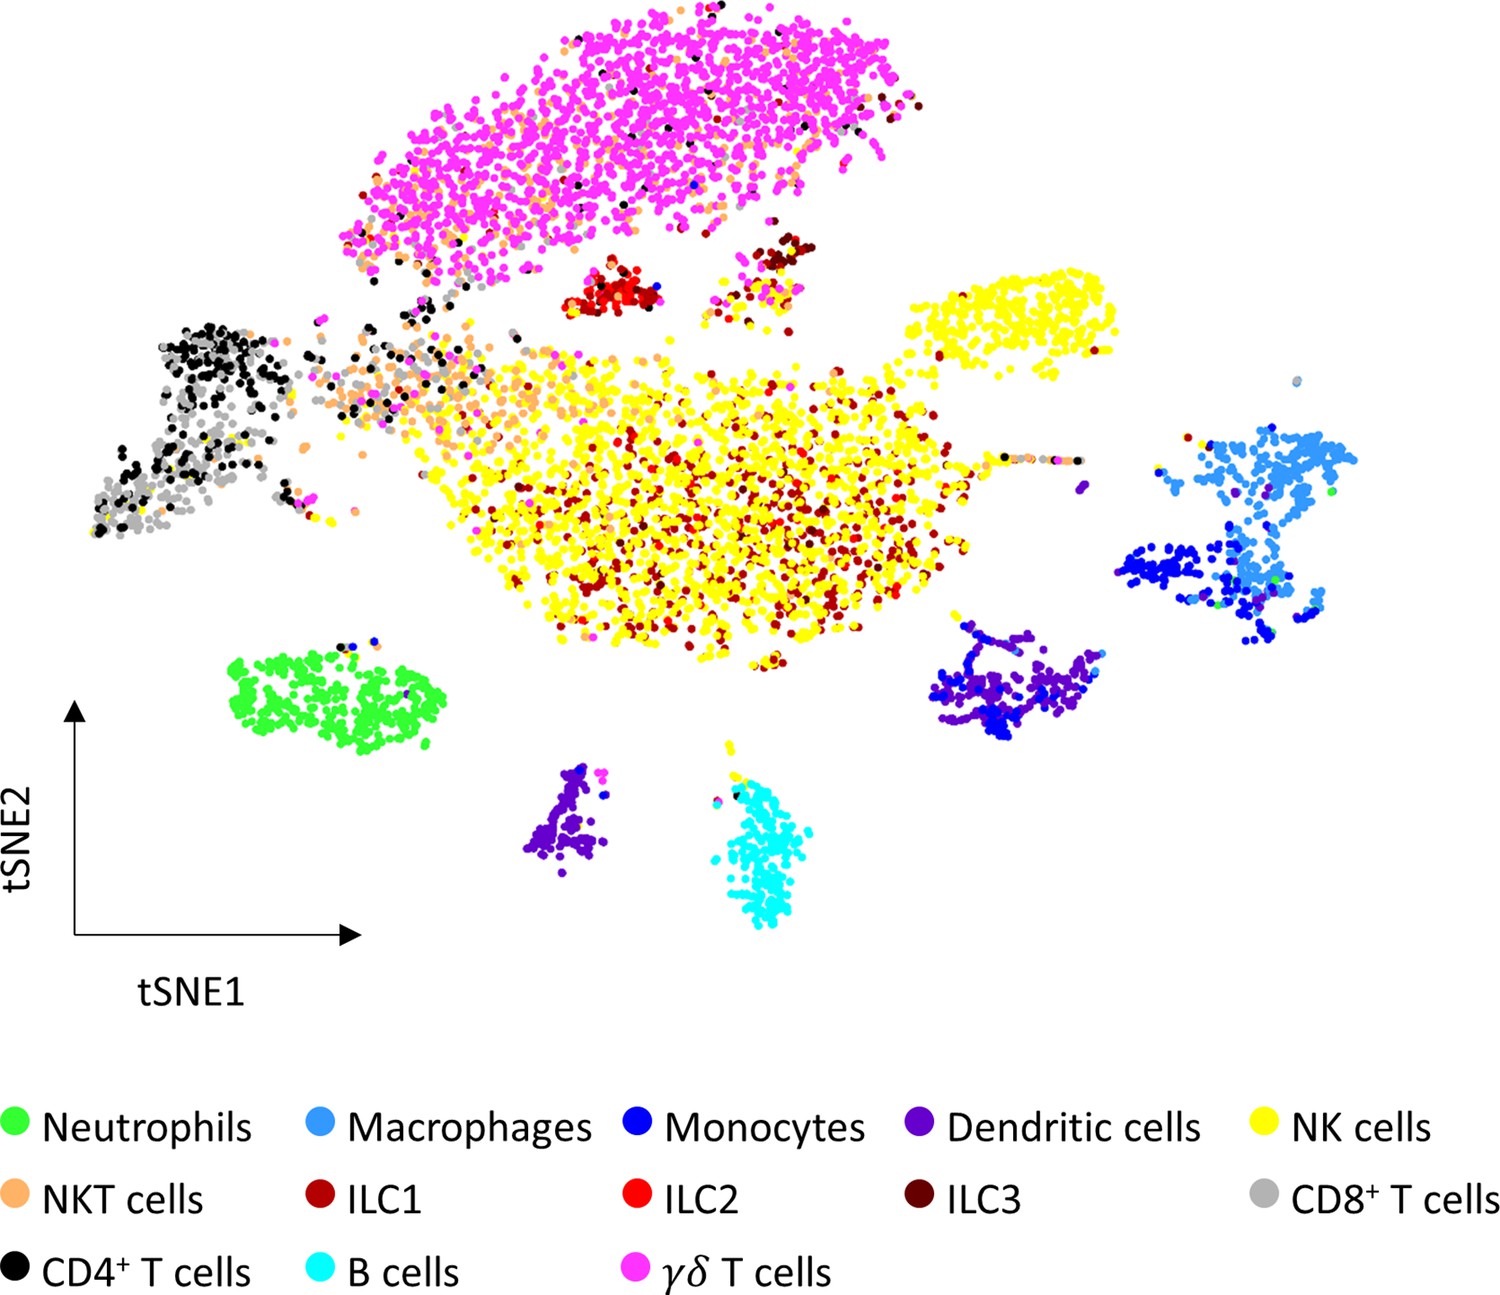
Automatic ovarian immune cells annotation.
tSNE plot of both young and old samples annotated using the SignleR algorithm. A correlation between each cell’s transcriptomic signature is calculated with reference cell types signatures from ImmGen. Annotation is decided based on the reference cell type which correlated the most to the cell.
Figure 1—figure supplement 2
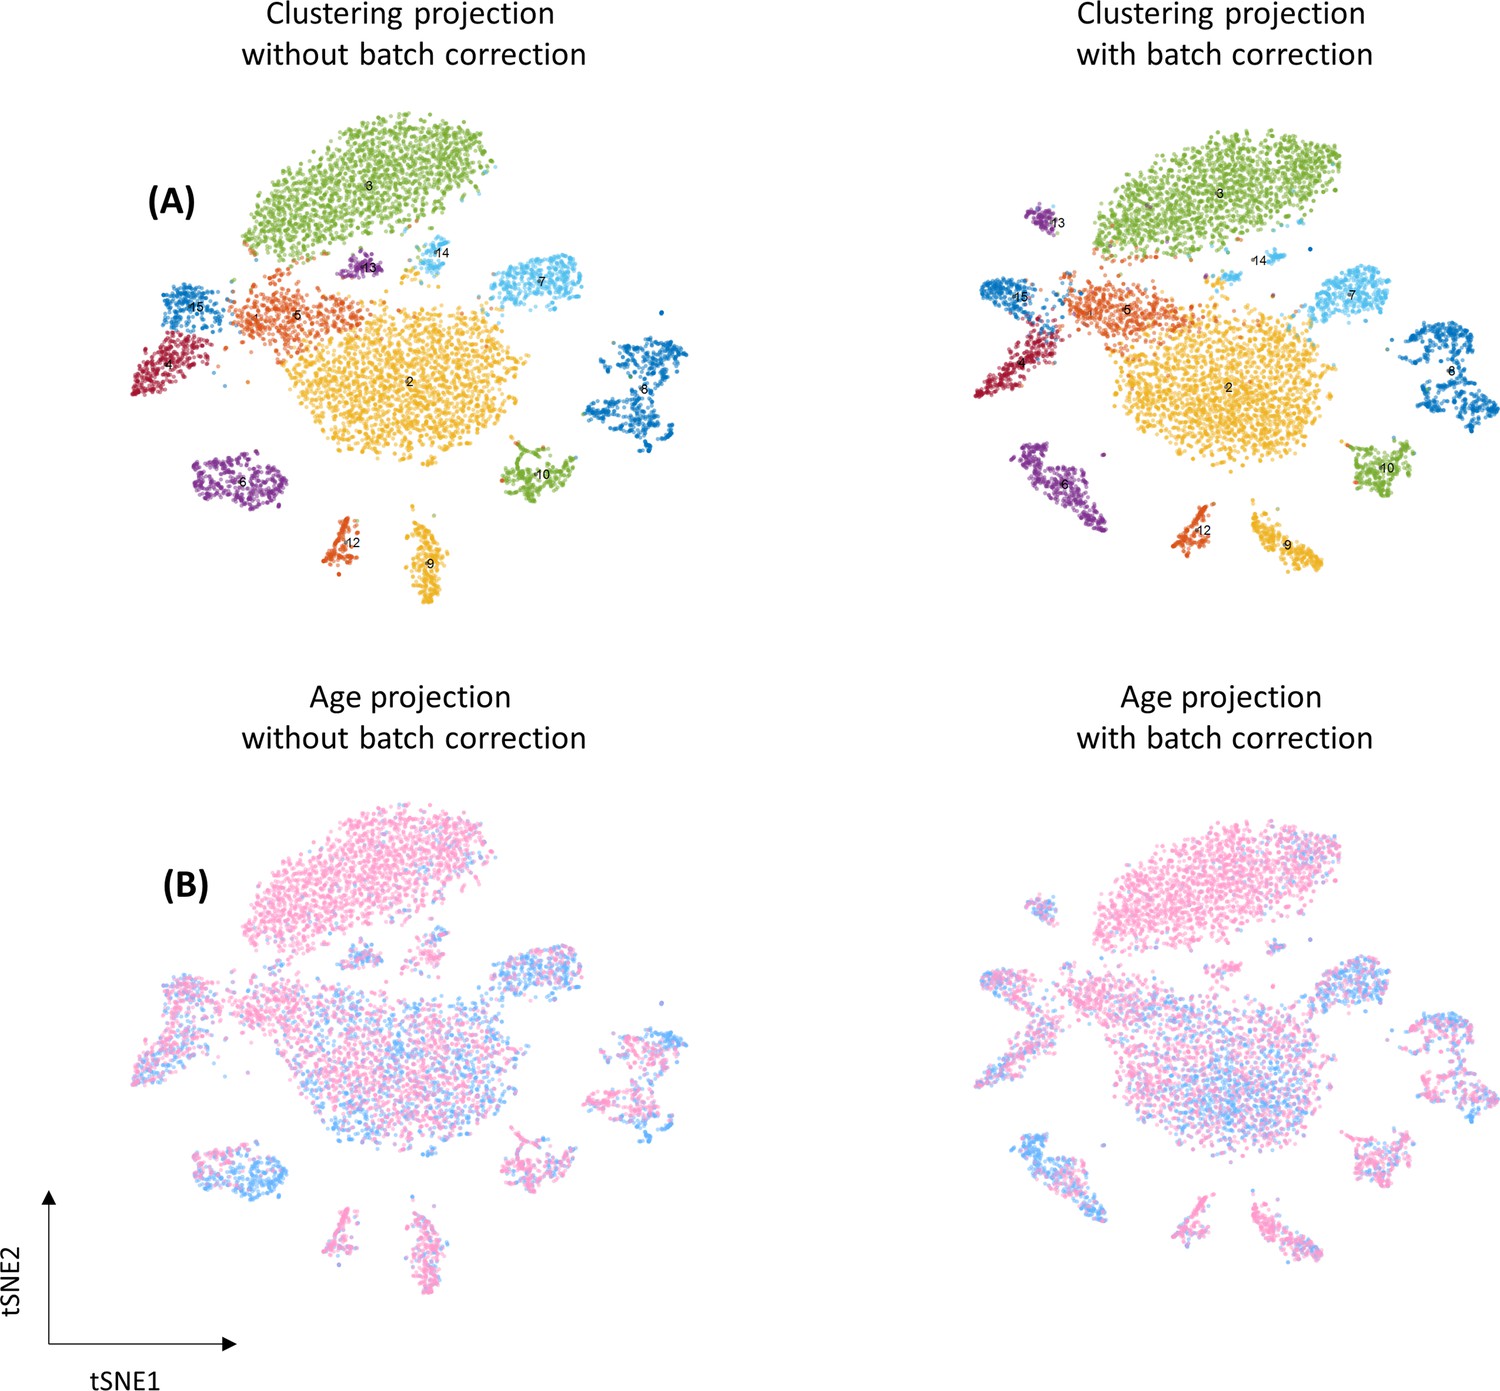
The effect of batch correction.
(A) Clustering projection according to Seurat’s clustering system using tSNE as dimension reduction method. (B) Data projected on tSNE according to age.
Figure 1—figure supplement 3
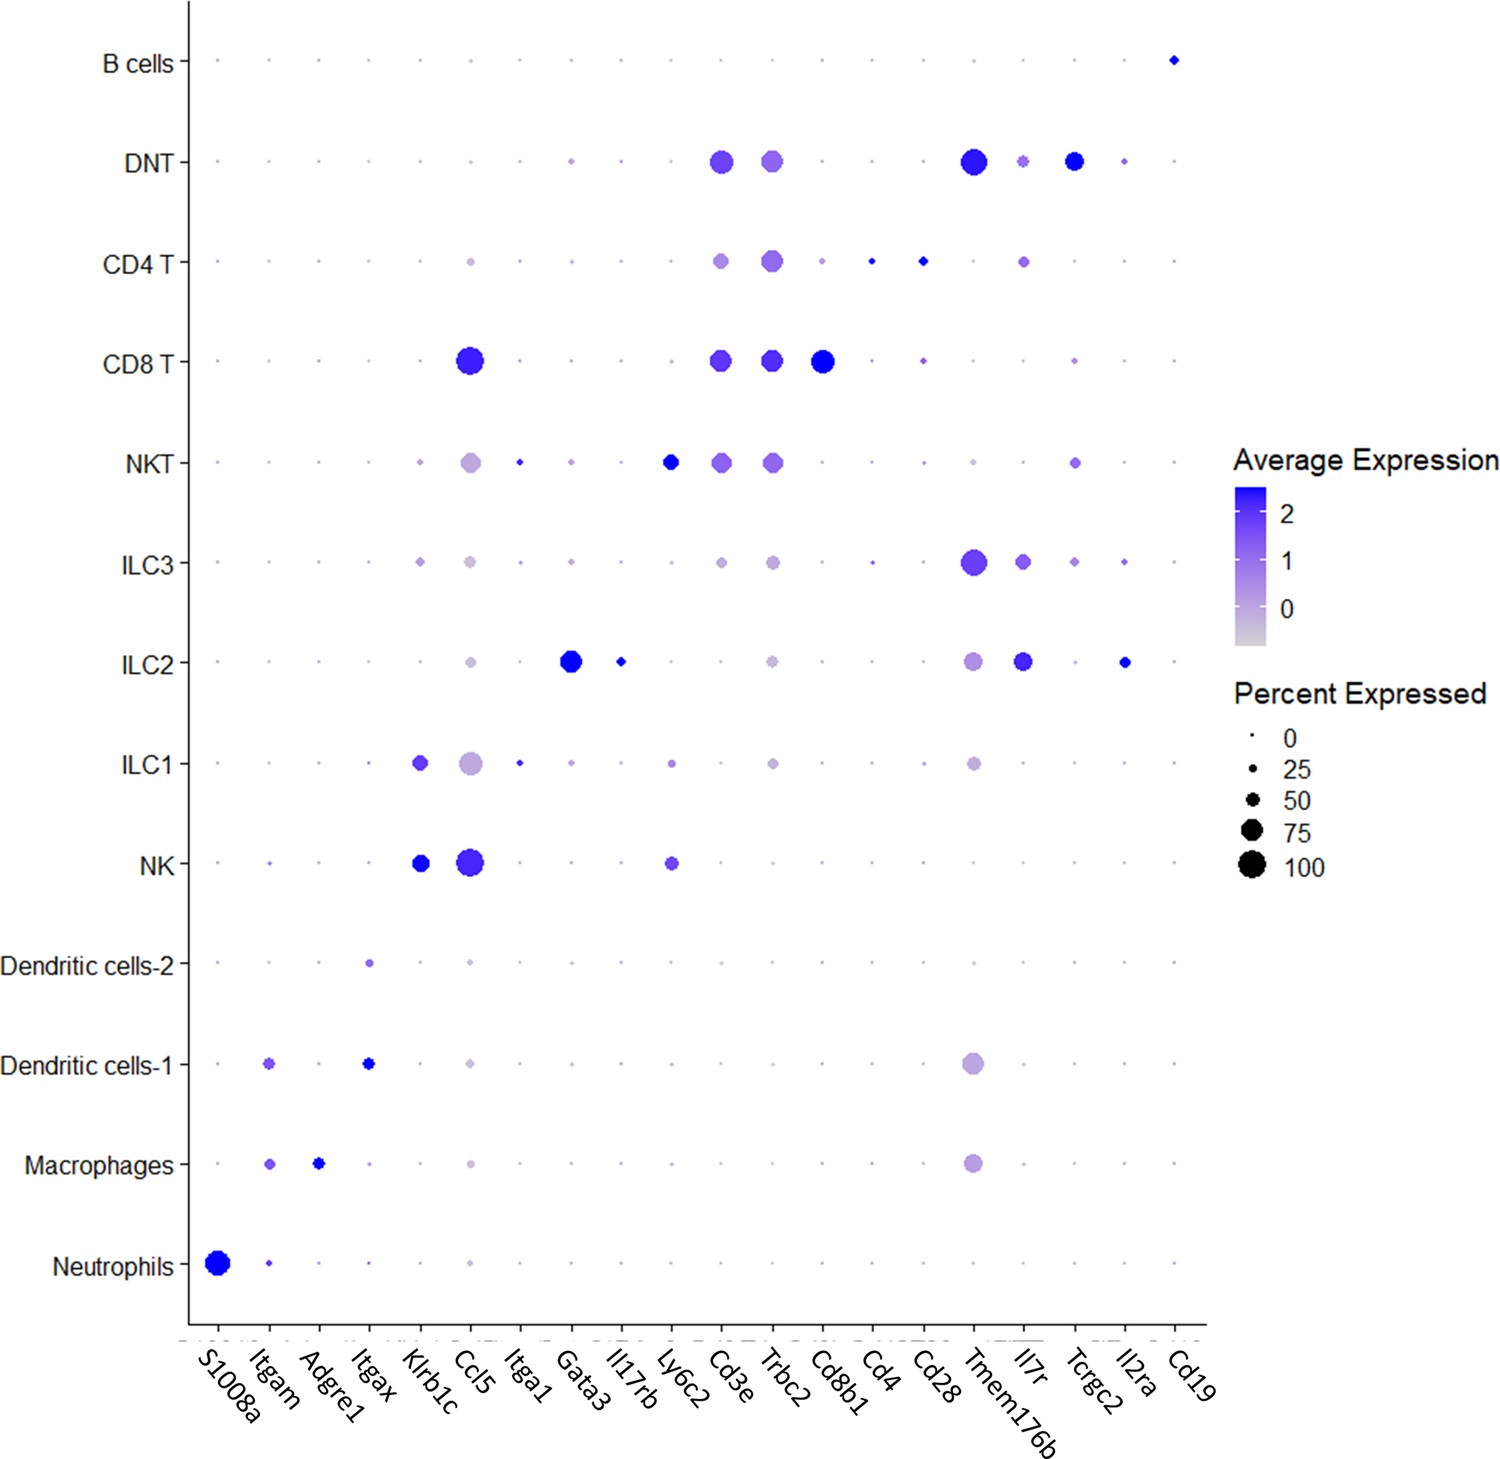
Literature-based annotation of ovarian immune cell populations.
Each row represents the markers expression of different cell type, and each column represents different marker. The size of each dot represents the fraction of cells in each type that expresses each marker. The color of each dot represents the average expression of each marker in every cell type.
Figure 1—figure supplement 4
Flow cytometry gating strategy.
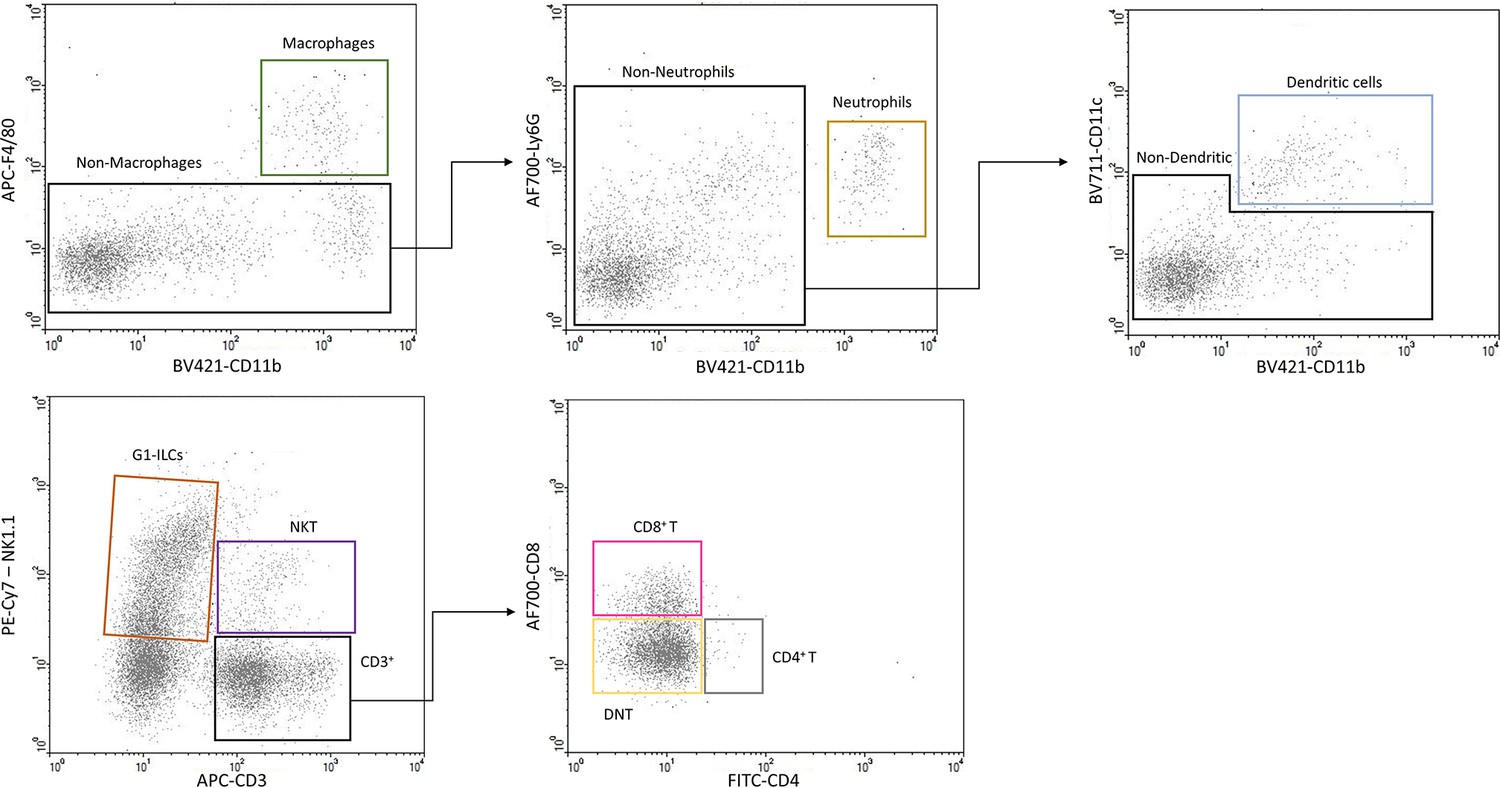
After gating on PE-CD45+ cells (see Figure 1A) we used two set of panels in order to validate the presence of the immune cell populations found in our 10x experiments. Each row shows a representative experiment of one of the panels. The top panel was used in order to characterize Macrophages, Neutrophils, and Dendritic cells. The bottom panel was to characterize Group-1 Innate lymphoid cells (G1-ILCs), NKT, CD8 T, CD4 T, and DNT cells.
Figure 1—figure supplement 5
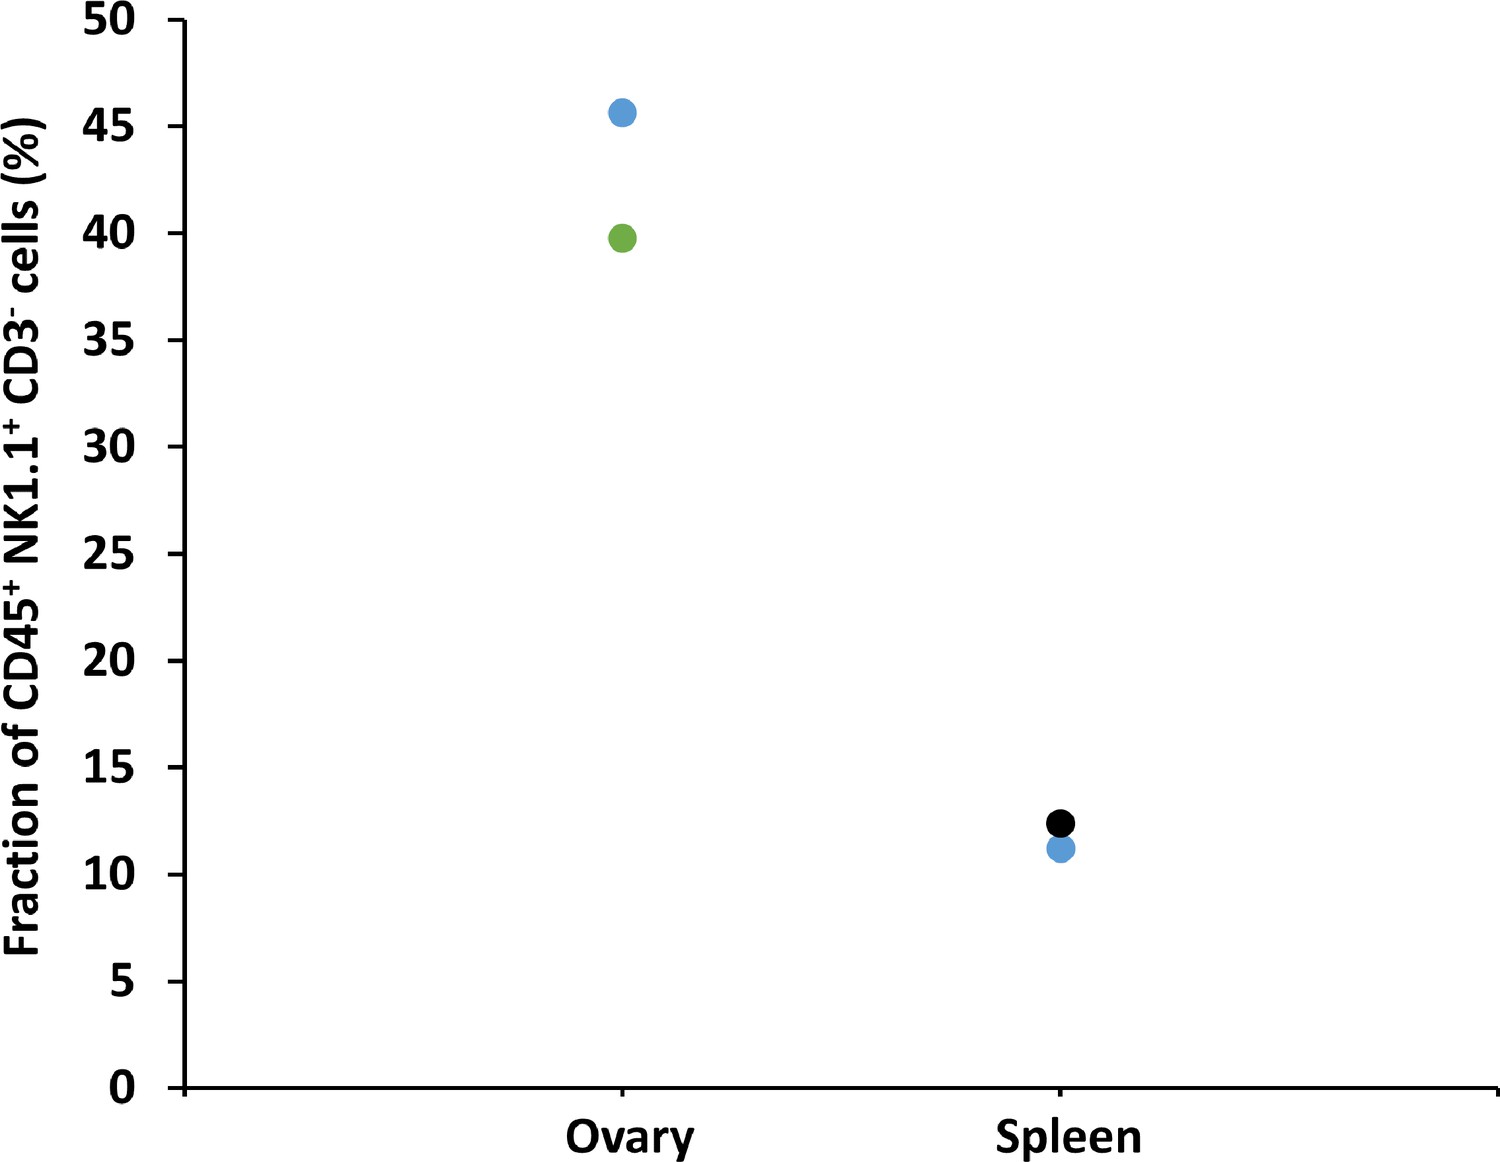
Flow cytometry measurement of Group 1 innate lymphoid cells (G1-ILCs) fraction in the ovaries.
Young female mice’s (n=3, 12 weeks old) immune cells were collected from the ovaries and spleen and were analyzed using flow cytometry for their group 1 innate lymphoid cells (CD45+ NK1.1+ CD3-) distribution. Each color represents measurement from a different mouse.
Figure 1—figure supplement 6
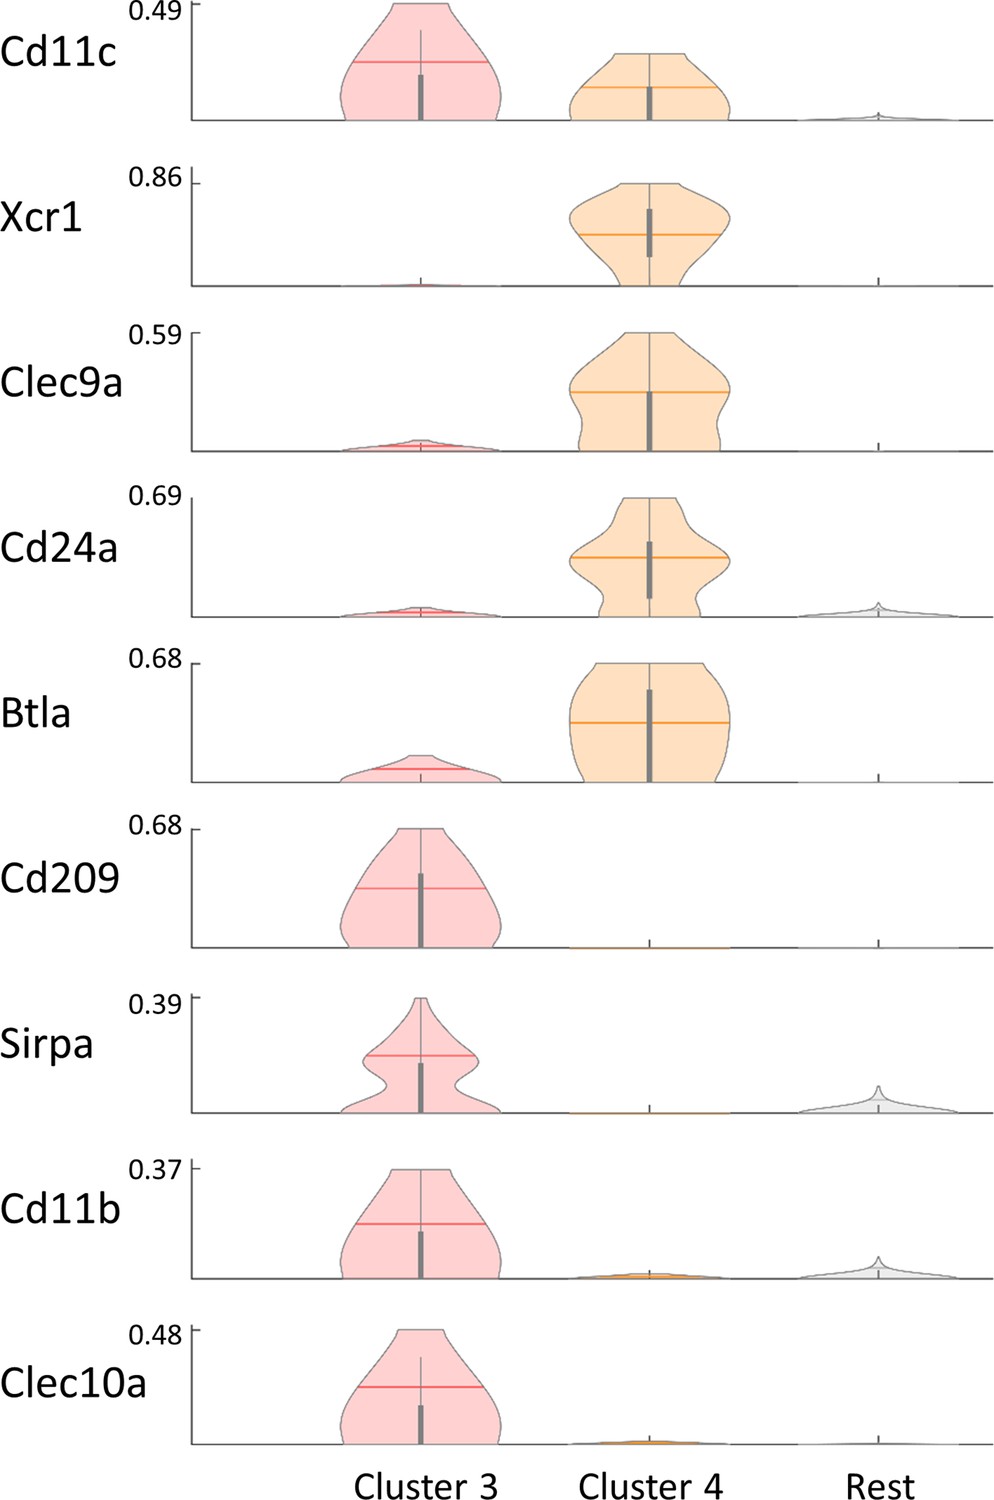
Dendritic cells clusters are composed from cDC1 and cDC2 populations.
Violin plot of the expression levels of several literature-based markers for cDC1 and cDC2 reveal that cluster 3 (Figure 1C) corresponds to an expression pattern of cDC2, while cluster 4 corresponds to an expression pattern of cDC1. Each row represents the normalized expression of a single marker across dendritic cells clusters and the rest of the immune cells. Normalized expression values are between 0–1.
Figure 1—figure supplement 7
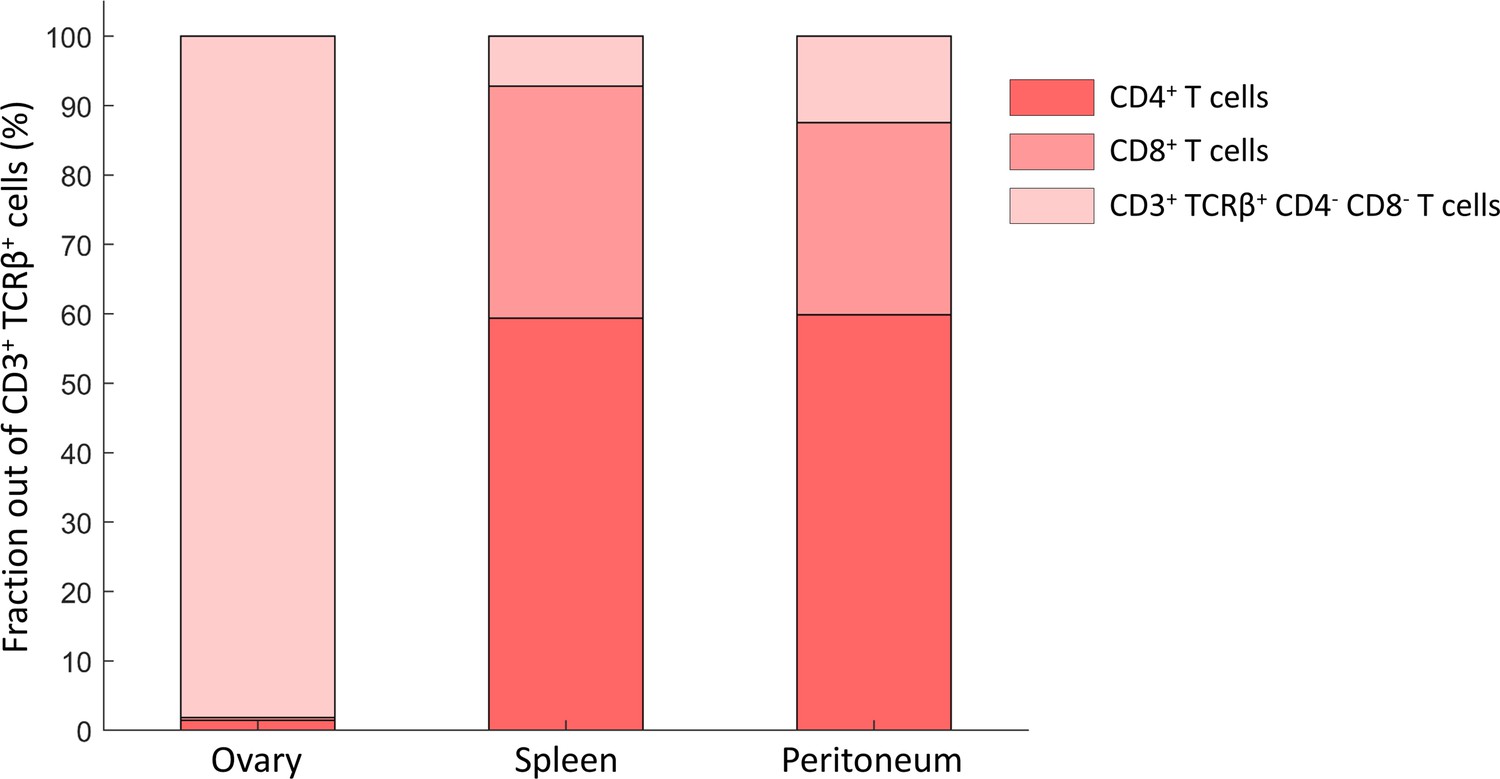
Double-negative T cells are more abundant in the ovaries compared to other tissues.
Old female mouse’s (55 weeks) immune cells were collected from the ovaries, spleen and peritoneum and were analyzed using flow cytometry for their T-lymphocytes distribution. While most cells in the spleen and peritoneum were CD4+ and CD8+ T cells as anticipated, almost all T cells in the ovaries were CD4- CD8-.
Figure 1—figure supplement 8
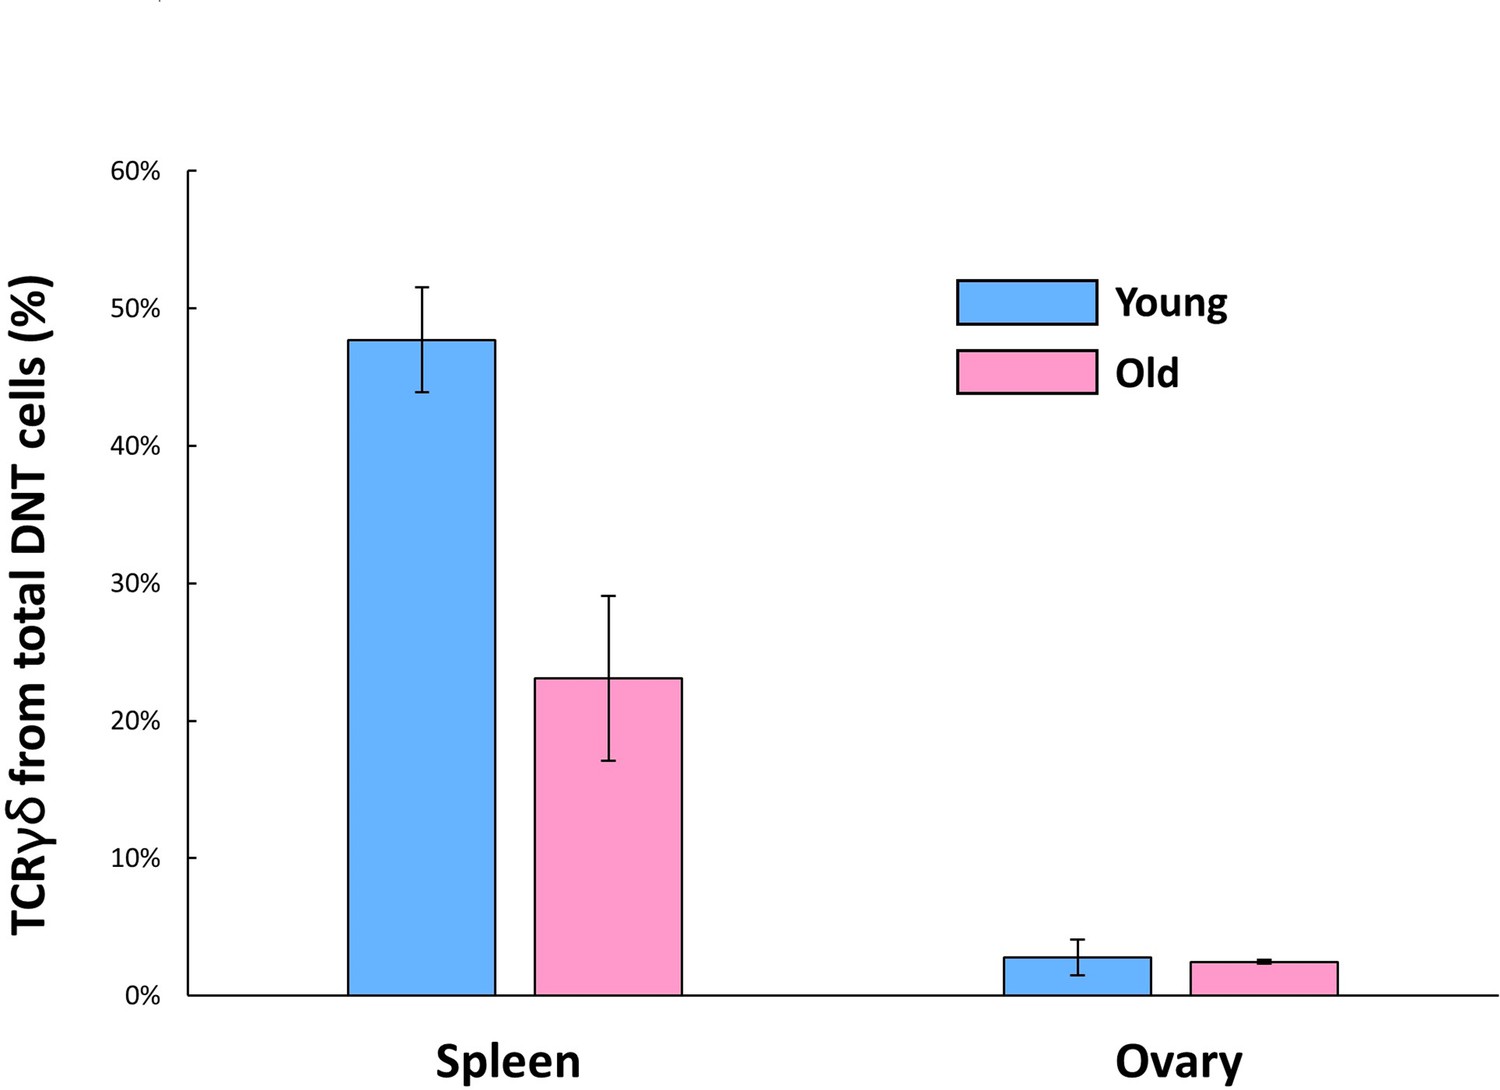
Ovarian CD3+ CD4- CD8- cells are predominantly TCRγδ-.
CD3+ CD4- CD8- cells from both spleen and ovaries, of young (14.5 weeks, n=2) and old (42.5–44.3 weeks, n=2) mice, were analyzed for their TCRγδ expression using flow cytometry. Ovarian CD3+ CD4- CD8- cells were predominantly TCRγδ-, regardless of age (2.78% at young, 2.48% at old mice). Splenic CD3+ CD4- CD8- cells were used as positive control and were 47.7% TCRγδ+ at young age and 23.09% at old age. Error bars denote standard deviation.
Figure 2 with 5 supplements
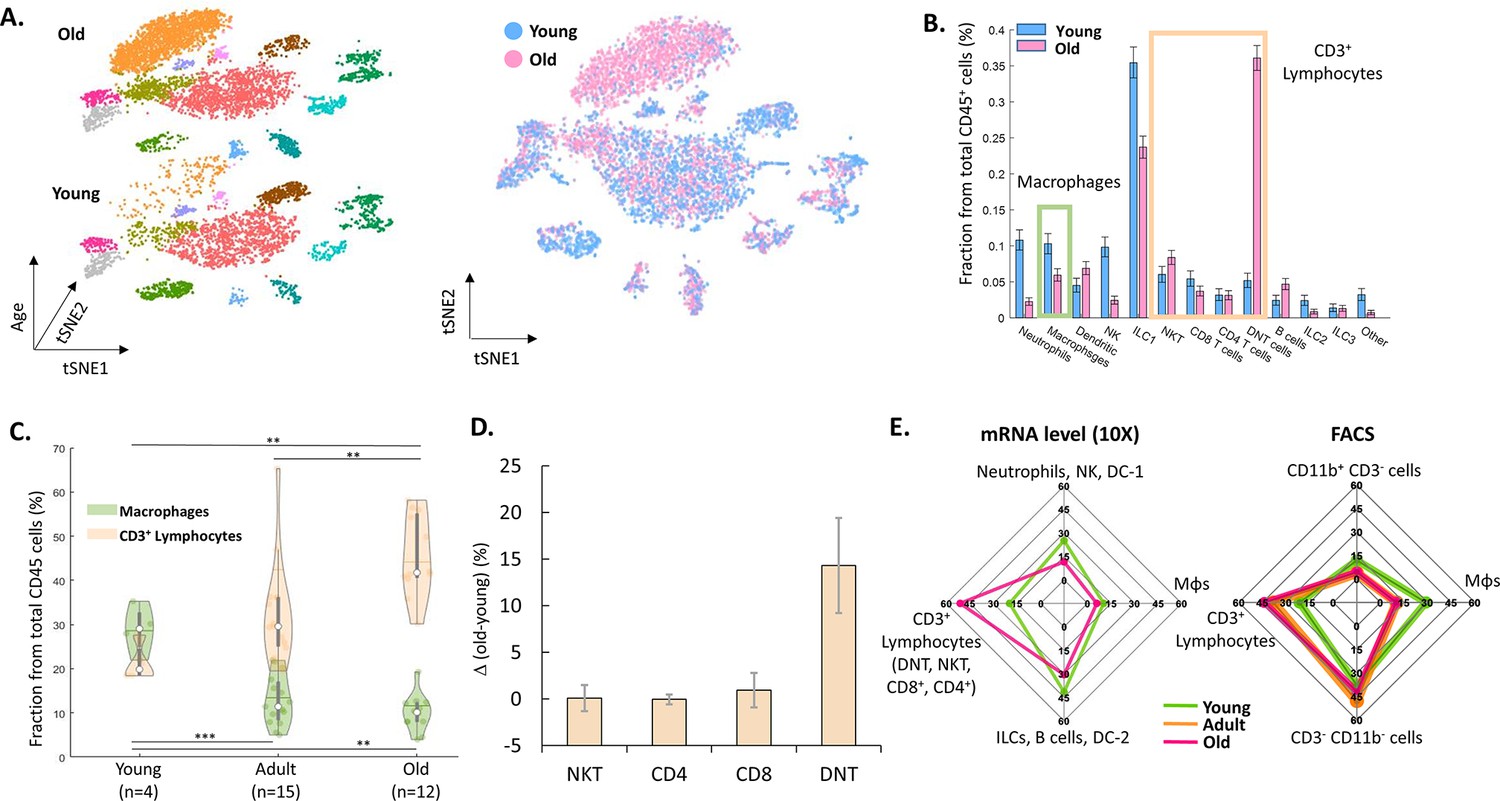
The effect of female age on the ovarian immune milieu.
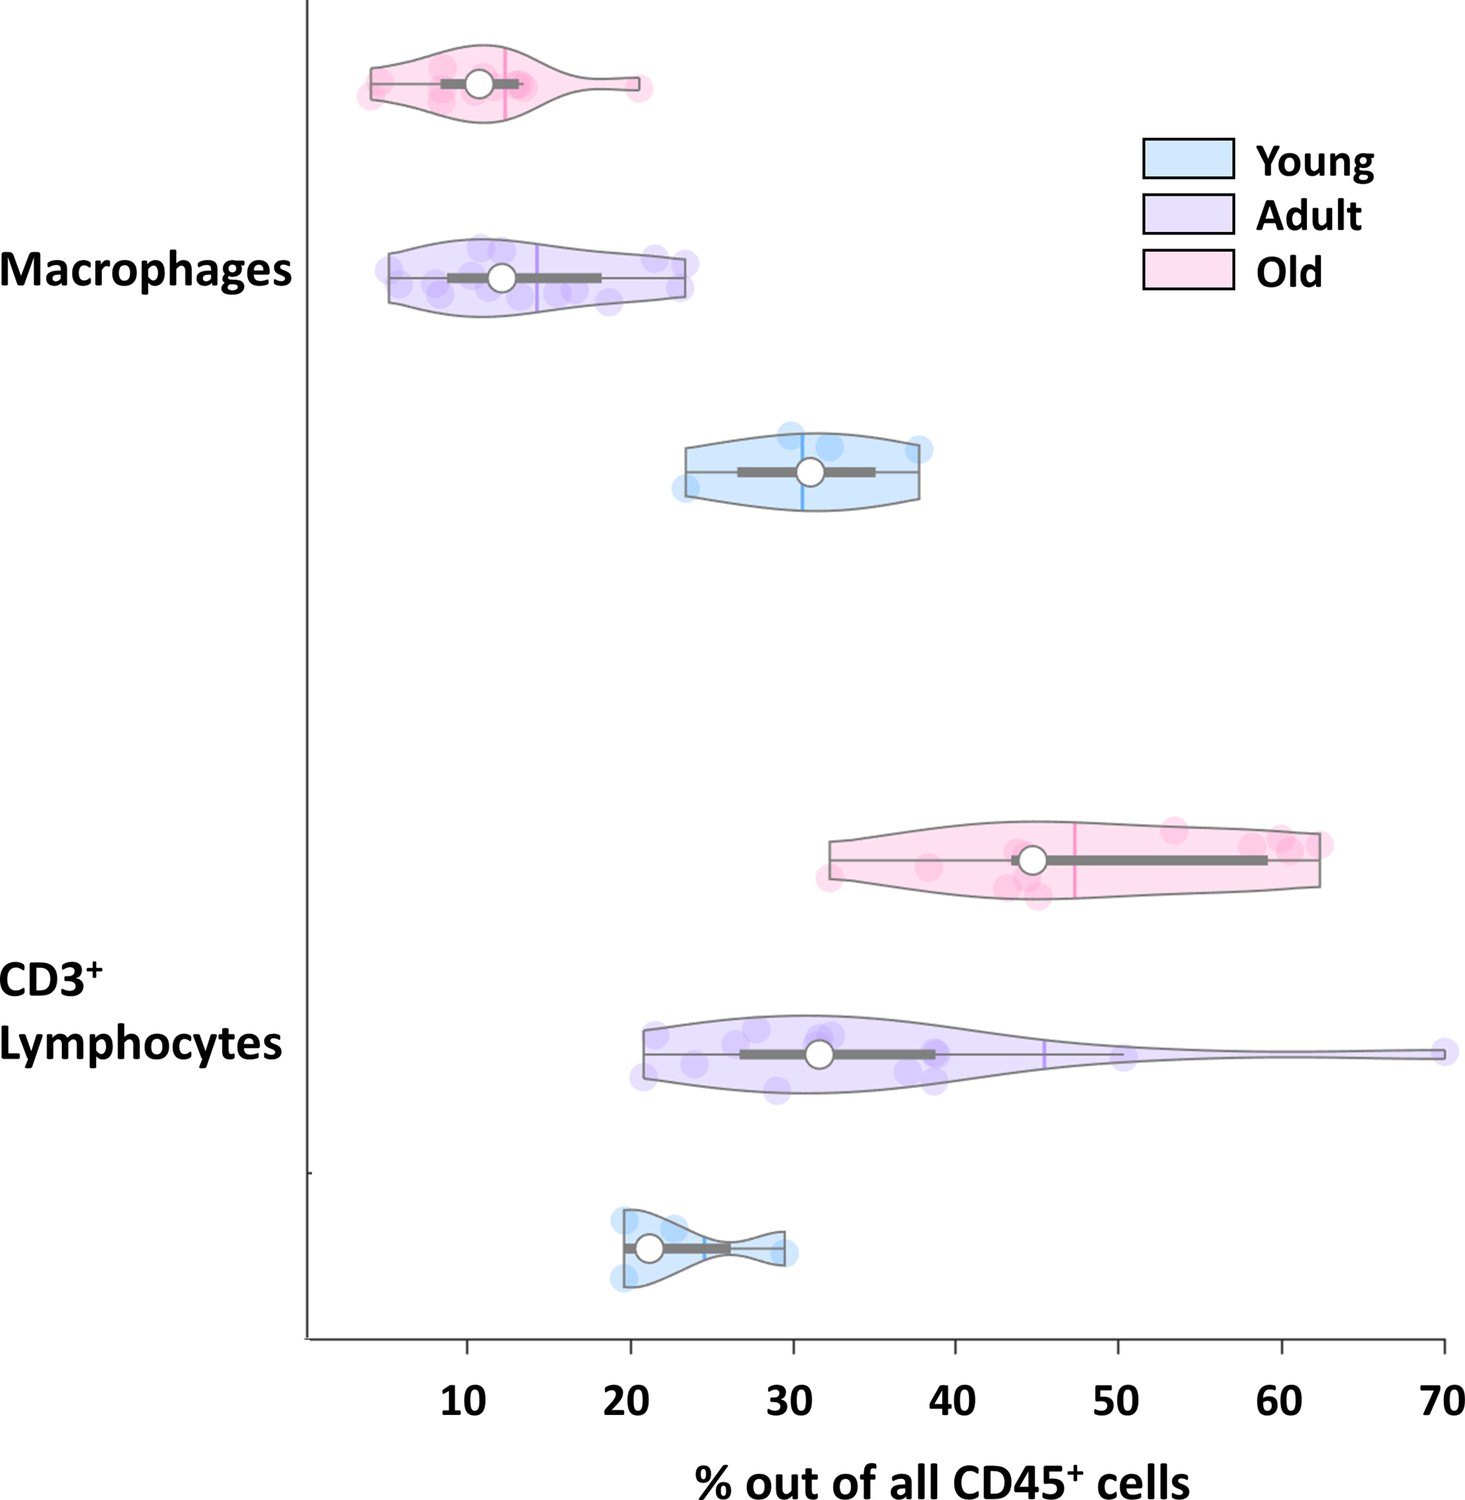
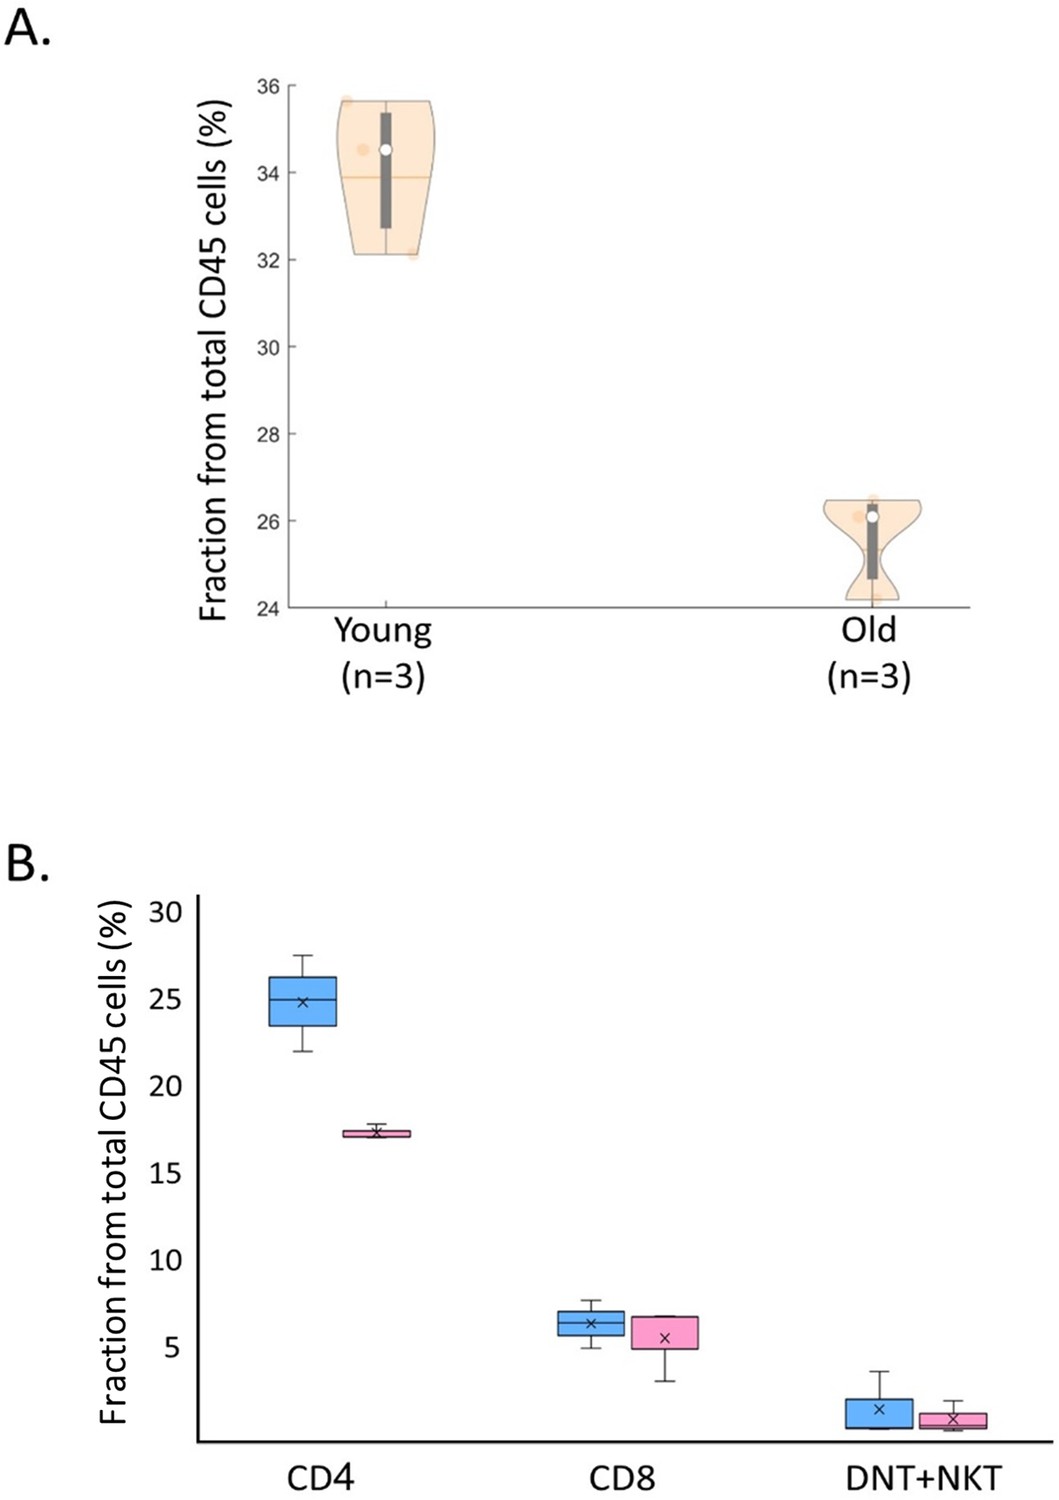
(A) 3-D tSNE plot (left) and an overlay (right) of all ovarian CD45+ cells found in scRNA-seq, divided by age group. (B) The effect of female age on the fractions of each cell type, with a confidence interval of 95% at the top of each bar. The green and yellow rectangles mark the macrophages and CD3+ populations, respectively. (C) Violin plot of the changes in fraction distributions of macrophages and CD3+ lymphocytes as a function of age as measured by flow cytometry (Kolmogorov-Smirnov test, ** p-value <10–2, *** p-value <10–3). (D) Change in the fraction of different CD3+ population comparing old (for CD4 and CD8 T cells – 42.6–49.6 weeks, n=4; for DNT and NKT cells – 49.6 weeks, n=2) and young (for CD4 and CD8 T cells – 10.1–14.5 weeks, n=5; for DNT and NKT cells – 10.1 weeks, n=3) mice as measured using flow cytometry. Error bars denote standard deviation. (E) Comparison between transcriptome and protein level of immune populations within the ovaries at different female ages. Each spider plot shows the distribution of different immune cell types measured using scRNA-seq (left panel) and flow cytometry (right).
-
Figure 2—source data 1
Old raw data.
- https://cdn.elifesciences.org/articles/74915/elife-74915-fig2-data1-v2.zip
Figure 2—figure supplement 1
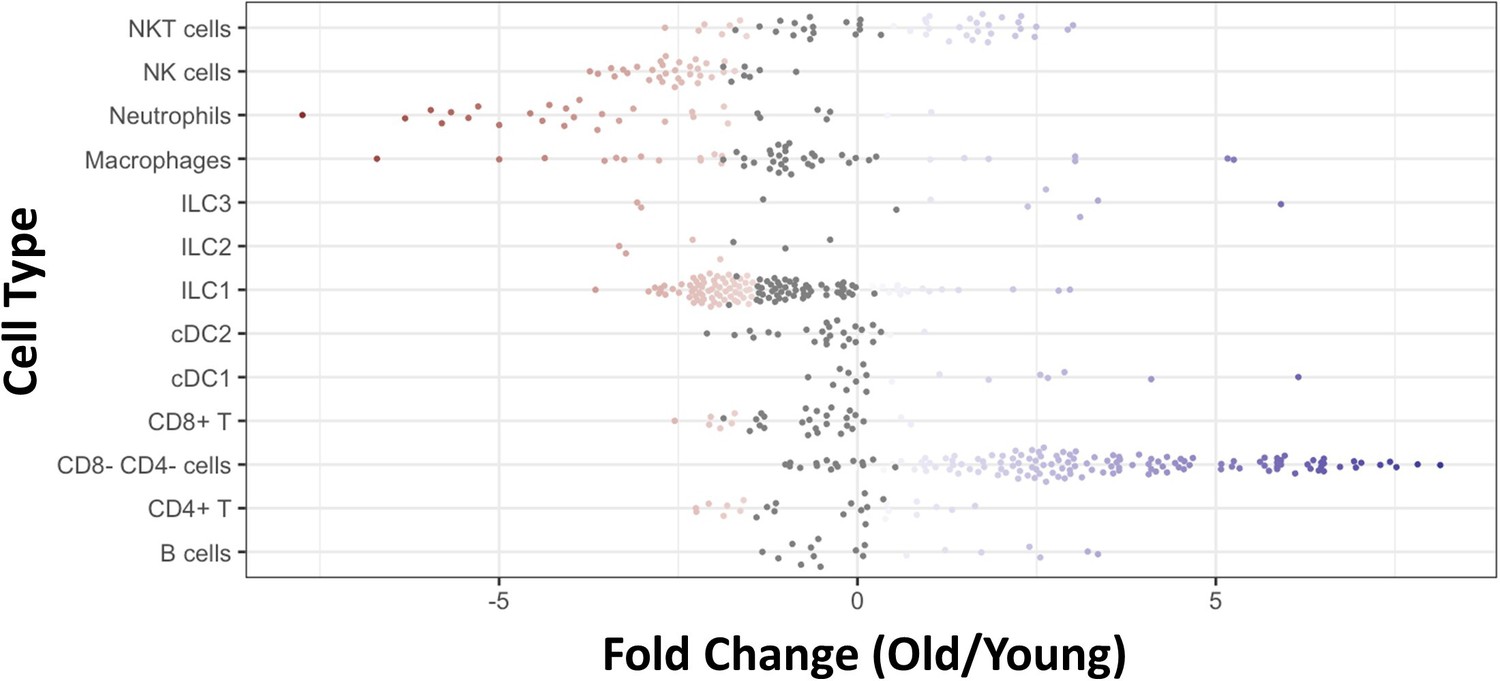
Significant changes in cell type abundance at old age.
Using the MILO algorithm (which divides the population for neighborhoods of cells, see Methods for further details) we identified significant changes in several cell types. Each dot represents a neighborhood. Blue dots are neighborhoods which increase significantly at old age, and red dots are neighborhoods which decrease significantly at old age (p-value <0.05). The most prominent increase is of DNT (CD4- CD8- T) and NKT cells, while ILC1, macrophages, neutrophils and NK cells decrease at old age.
Figure 2—figure supplement 2
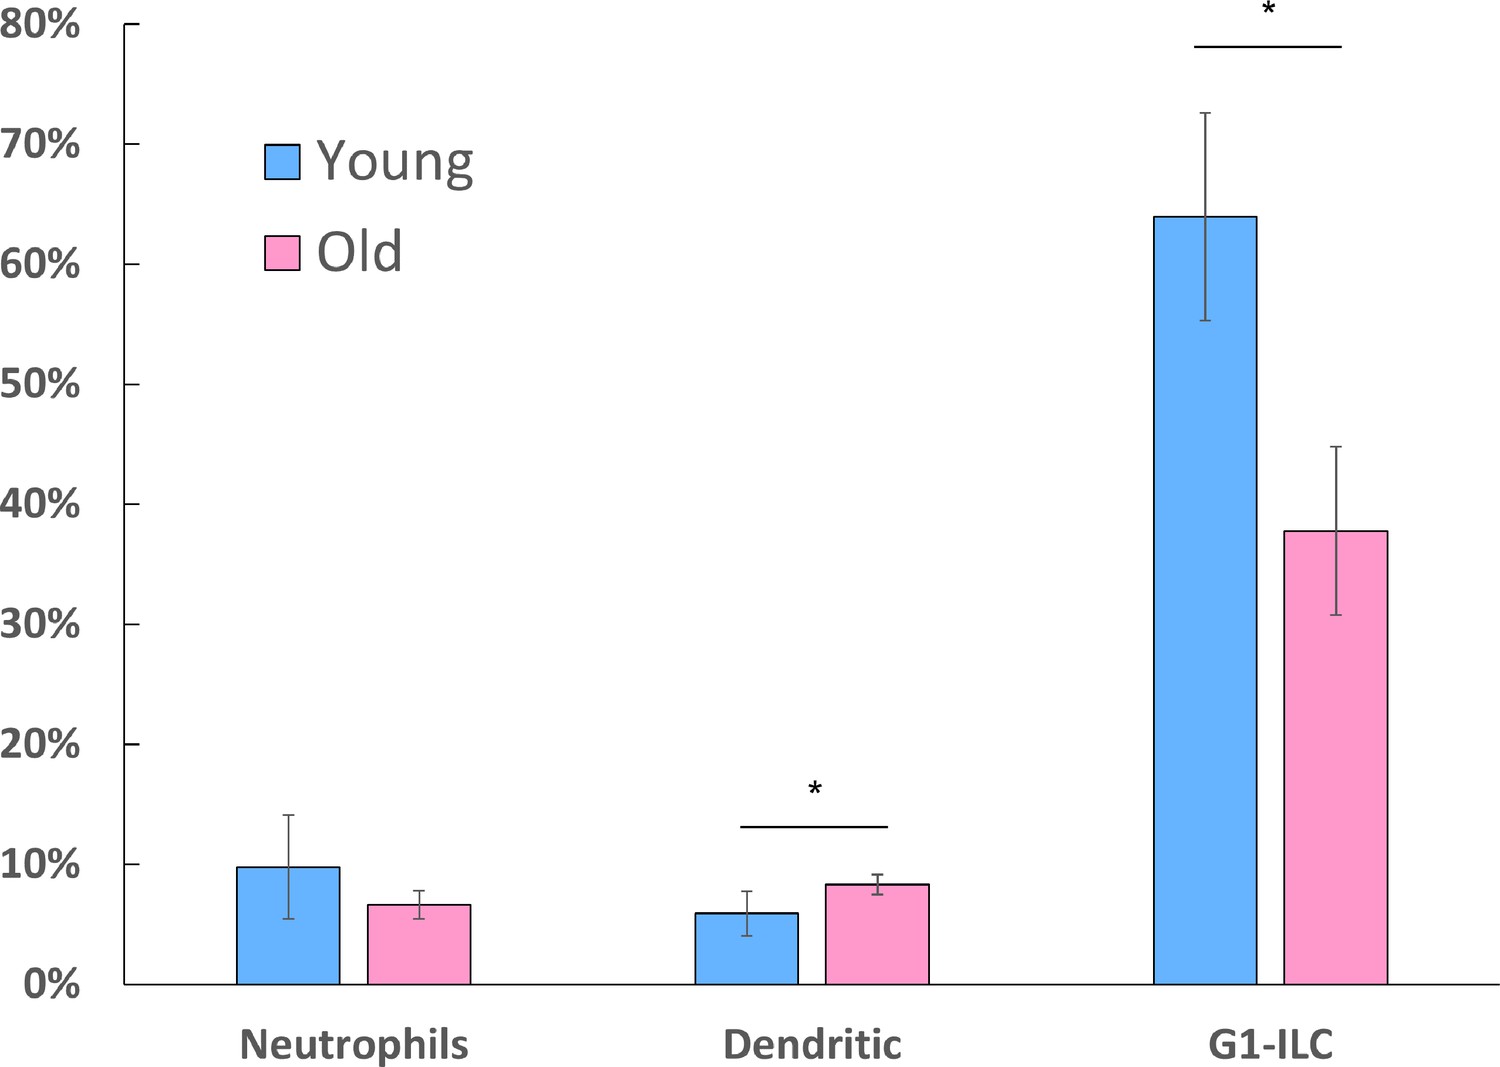
Flow cytometry measurements of additional ovarian immune populations.
Flow cytometry measurements were used to analyze the fraction of Neutrophils, Dendritic cells (young, n=6; old, n=3) and group-1 ILCs (G1-ILCs; young, n=3; old, n=2). Neutrophils were characterized as CD45+ CD11b+ Ly6G+ cells; Dendritic cells were characterized as CD45+ CD11c+ cells; G1-ILCs were characterized as CD45+ NK1.1+ cells; * p-value <0.05; student’s t-test. Error bars denote standard deviation.
Figure 2—figure supplement 3
Changes in ovarian CD3+ cells and macrophages.
Violin plot of macrophages and CD3+ lymphocytes fractions out of total CD45+ as shown in Figure 2C, separated by cell type.
Figure 2—figure supplement 4
Splenic CD3+ cells fraction is decreasing at older age.
(A) Fraction of splenic CD45+ CD3+ cells from young (34.09%, 10–14.5 weeks old, n=3) and old (25.59%, 42.5–49.6 weeks old, n=3) mice, as measured using flow cytometry. (B) Fraction differences of various CD3+ cells populations between old and young mice. Error bars denote standard deviation.
Figure 2—figure supplement 5
Changes in ovarian CD3+ cells and Macrophages is cycle stage independent.
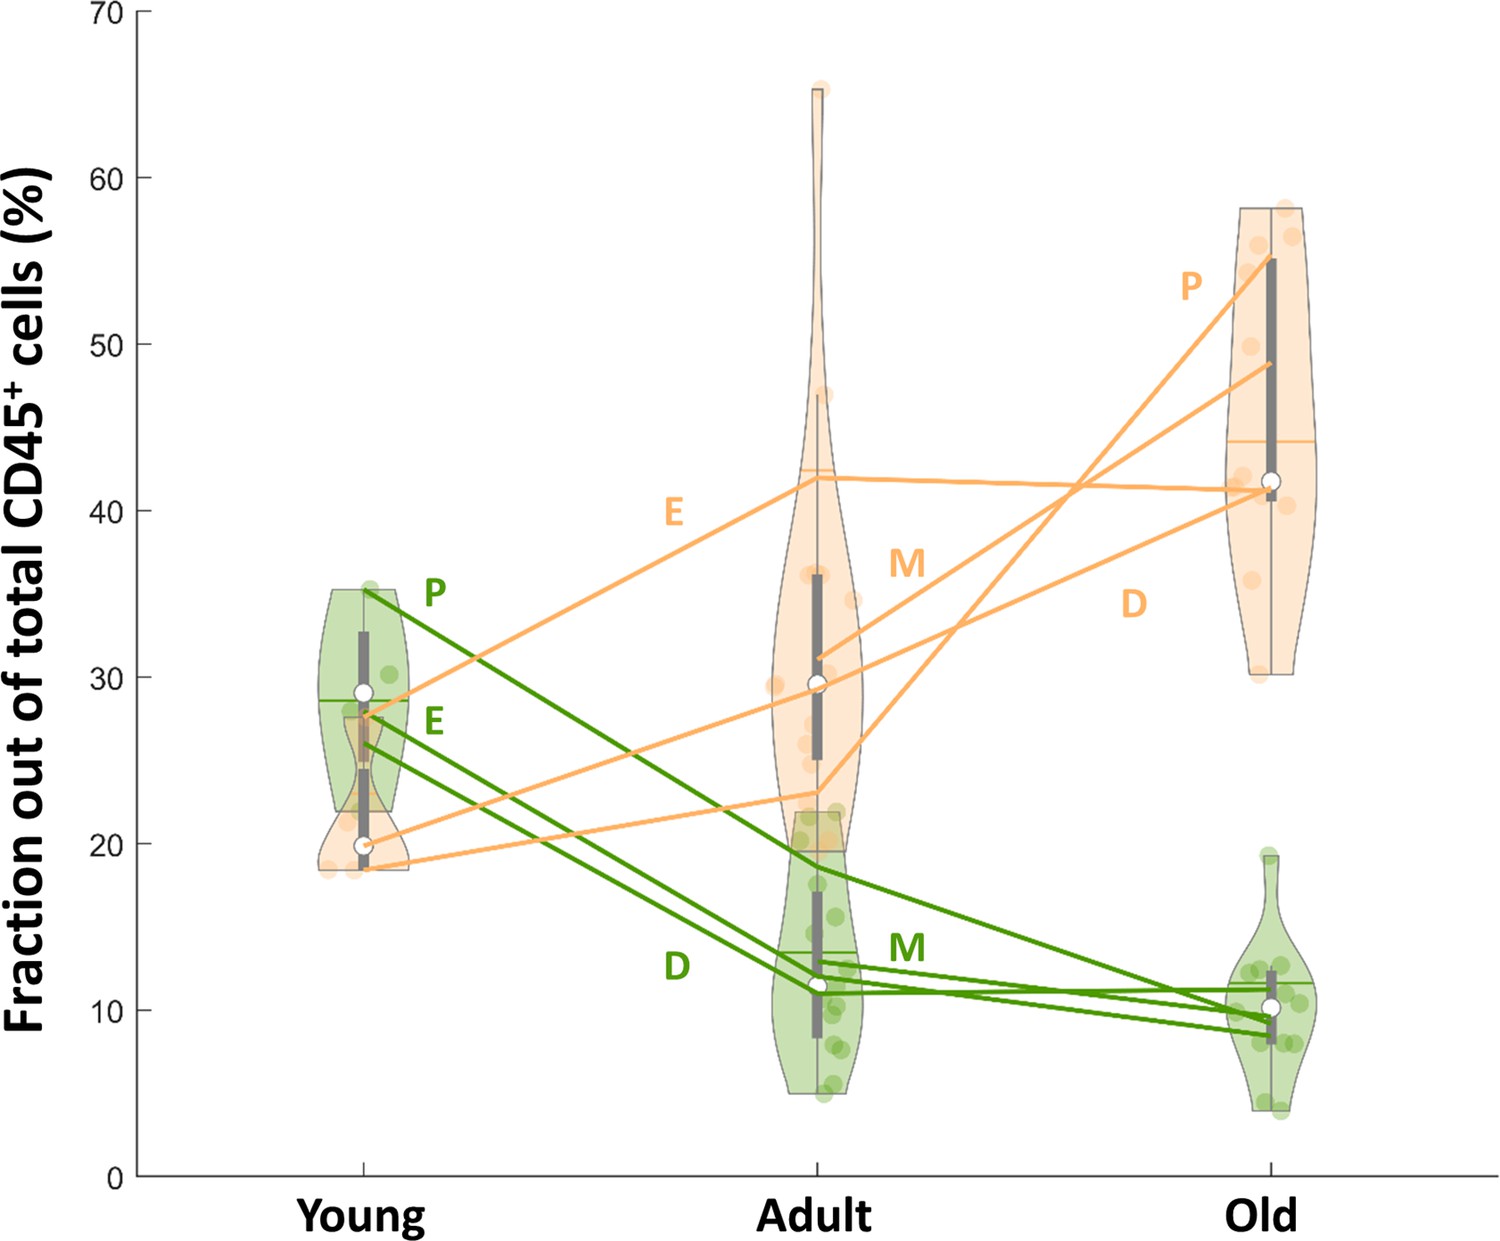
Violin plot of macrophages and CD3+ lymphocytes fractions out of total CD45+ as shown in Figure 2C with an additional annotation of the cycle stage. Lines represent the mean fraction of each population in each stage of the estrus cycle (P – Proestrus; E – Estrus; M – Metestrus; D - Diestrus). NYoung_P = 1, NYoung_E = 1, NYoung_D = 2, NAdult_P = 2, NAdult_E = 4, NAdult_m = 4, NAdult_D = 5, NOld_P = 2, NOld_E = 2, NOld_M = 3, NOld_D = 5.
Figure 3
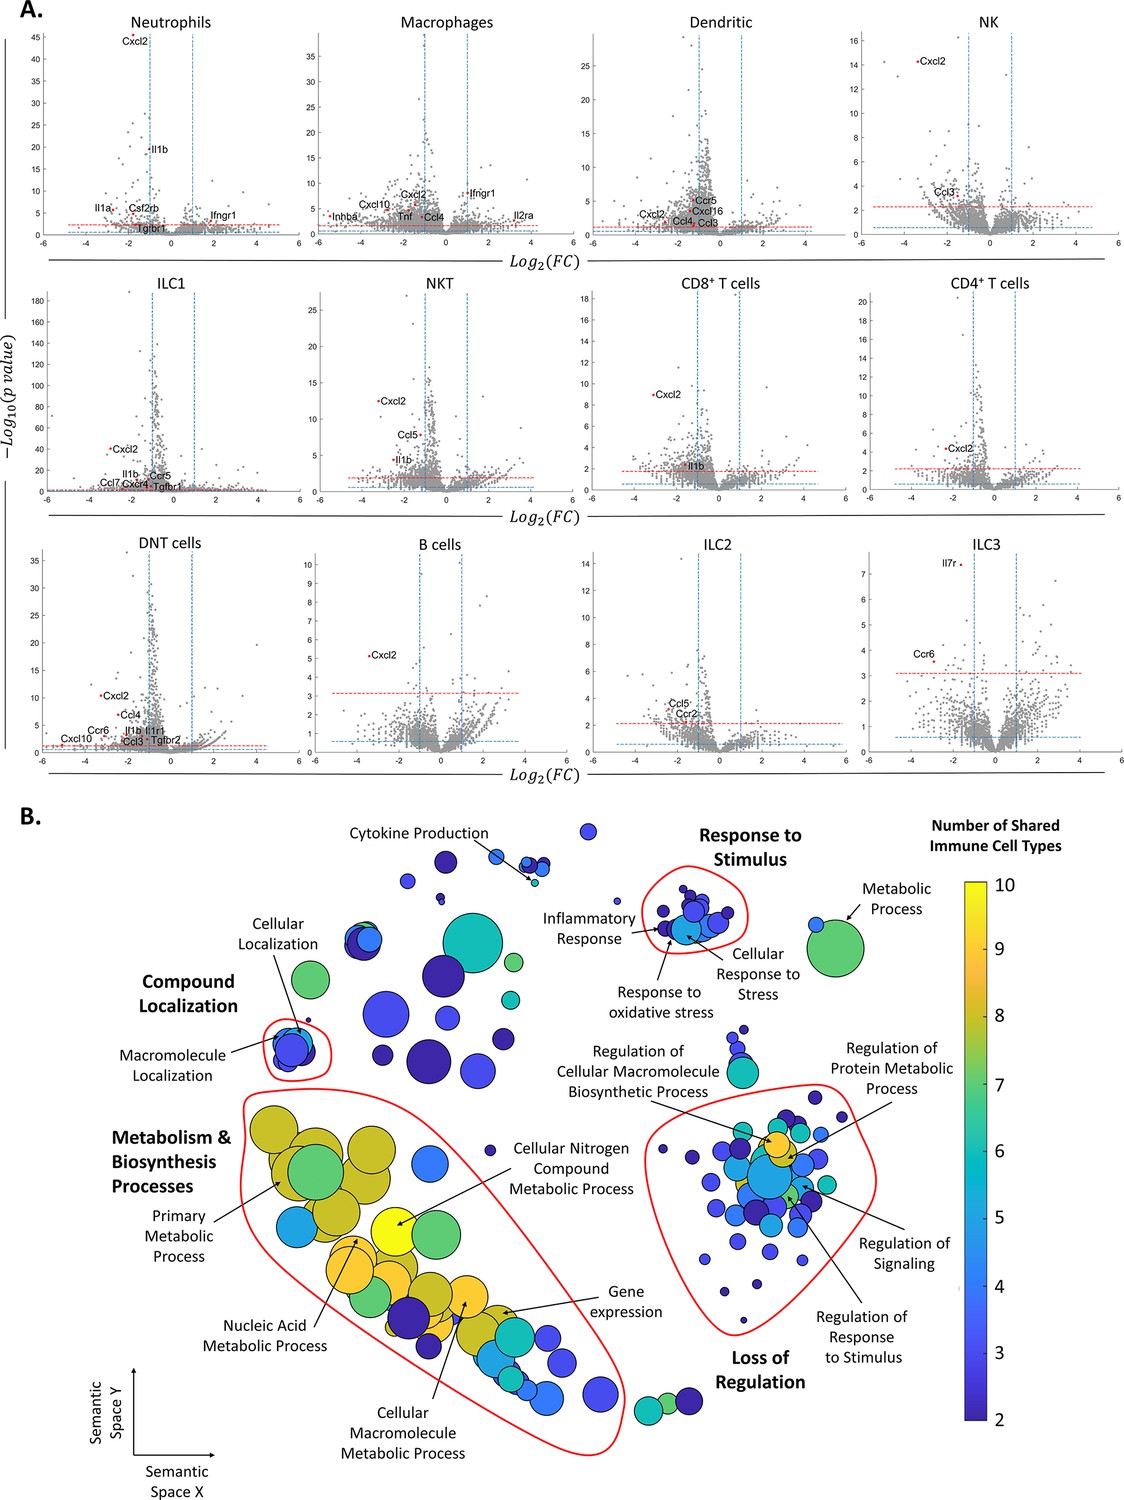
Changes in gene expression along with female age.
(A) Volcano plots of the scRNA-seq analysis for the different immune cell types. The vertical dashed lines mark twofold upregulation and downregulation, the blue horizontal dashed line marks p-value = 0.05, and the red horizontal dashed line marks FDR = 0.1. Genes in the top left section of each graph are significantly downregulated at old age, while genes in the top right section are upregulated at old age. Each grey dot represents the change in the expression of different genes. Red dots denote significantly changed chemokines and cytokines. (B) Each circle represents a downregulated biological process in the old mice, which appeared in at least two types of immune cells. The axes represent semantic similarities distance as calculated by REVIGO (‘Methods’). The color of each term represents the number of immune cell types in which the process is downregulated with age. The size of each term represents the hierarchy of the biological process; the bigger the circle, the higher the hierarchy of the process is.
Figure 4 with 1 supplement
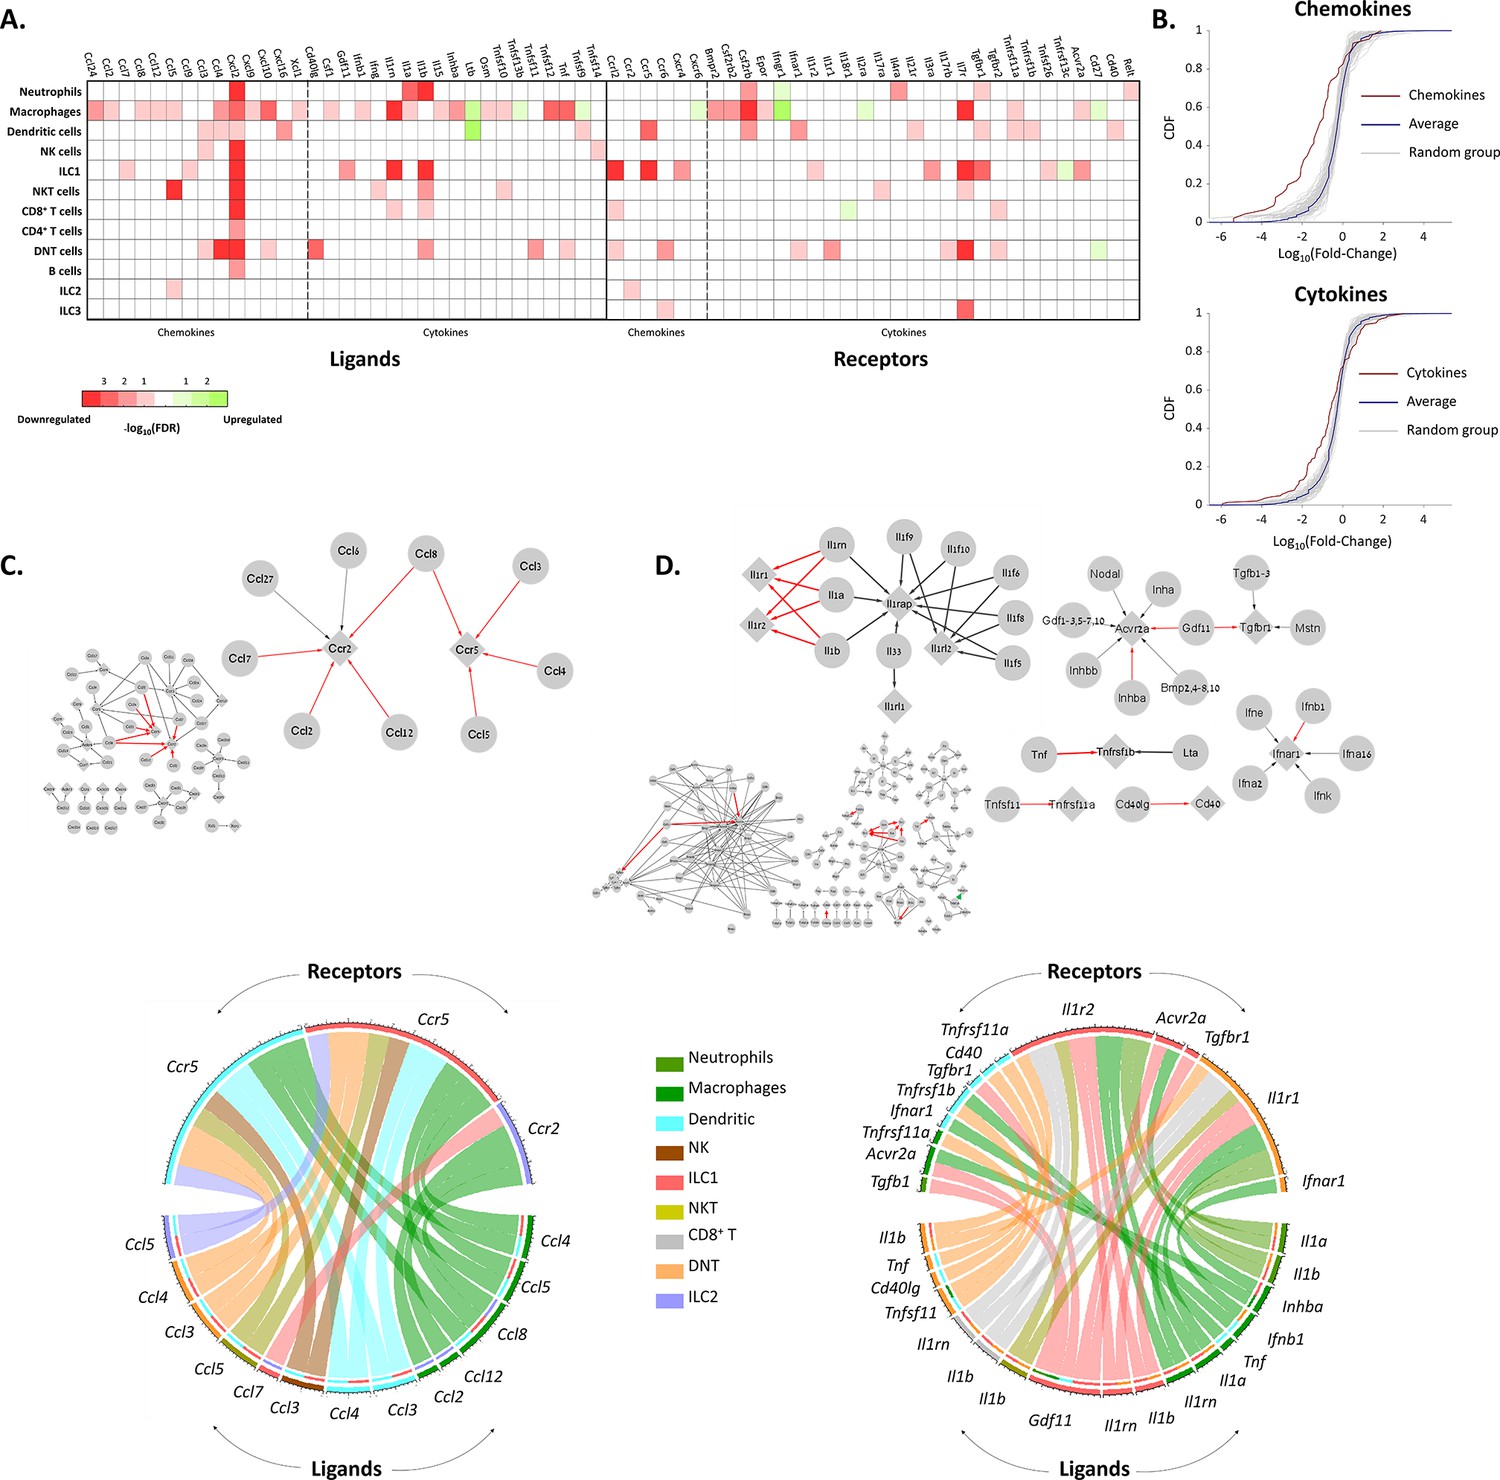
The effect of female age on the chemokines and cytokines networks of the ovarian immune cells.
(A) A heat map of a significant (p-value <0.05; FDR ≤0.1) twofold decrease (red) or increase (green) in the expression levels of chemokines, cytokines, and their receptors in different immune cell types. (B) Cumulative probability distribution (CDF) of the fold change (FC) of chemokines (upper panel) and cytokines (lower panel) (red line). The gray lines are the CDFs of FC for random groups of genes at the same size as the chemokines/cytokines genes. The blue line is the CDF of the FC of all the genes. There is a significant decrease in the expression of chemokines and cytokines with age (Kolmogorov-Smirnov test p-value <0.01). (C) Downregulation of the chemokines network due to age. Upper panel - Edges within the chemokine network in which both the ligand and the receptor were significantly downregulated in at least one cell type are colored in red. Edges that only the ligand/receptor, or none of them, were significantly downregulated are colored in grey. The sub-graph that contains the affected interactions is magnified at the right-hand side of the figure. Bottom panel - Chord diagram that illustrate the decrease in chemokine ligand-receptor interactions between the different cell types. The color of each chord denotes the color of the cell type that underwent a reduction in ligand expression. In the upper semi-circles, the colors indicate the cell type that showed a decrease in receptor expression. In the lower semi-circle, the outer and inner colors denote the cell types in which ligands and target receptors were downregulated, respectively. (D) Downregulation in the cytokines network due to age. Same color-coding as in (C) for the cytokines interaction network.
Figure 4—figure supplement 1
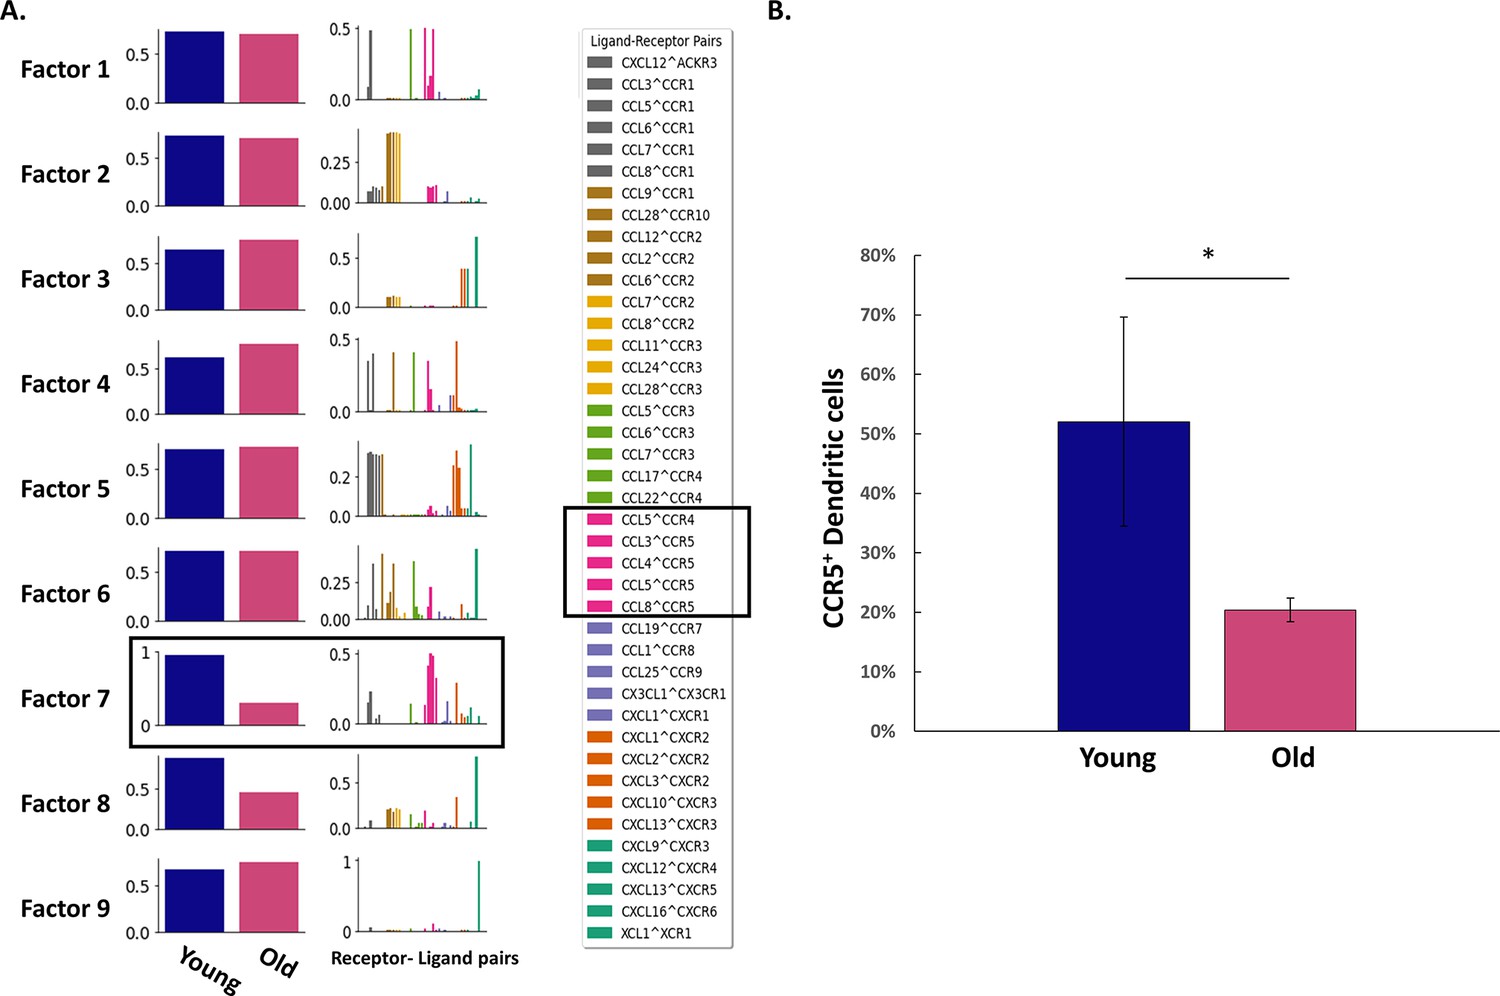
Age differences in chemokines network are mainly due alternations in CCR5 expression.
(A) Cell2Cell algorithm ('Methods') was applied on the chemokines network and found that the main receptor-ligand connections responsible for age differences involve mainly CCR5 and several of its ligands. (B) The fraction of ovarian CCR5+ Dendritic cells (CD11c+) cells was measured using flow cytometry in young (n=4, mean = 52%, SD = 17.54) and old (n=2, mean = 20.4%, SD = 1.97) female mice. CCR5 expression is significantly decreased at old age (* p-value <0.05; student’s t-test).
Figure 5 with 1 supplement
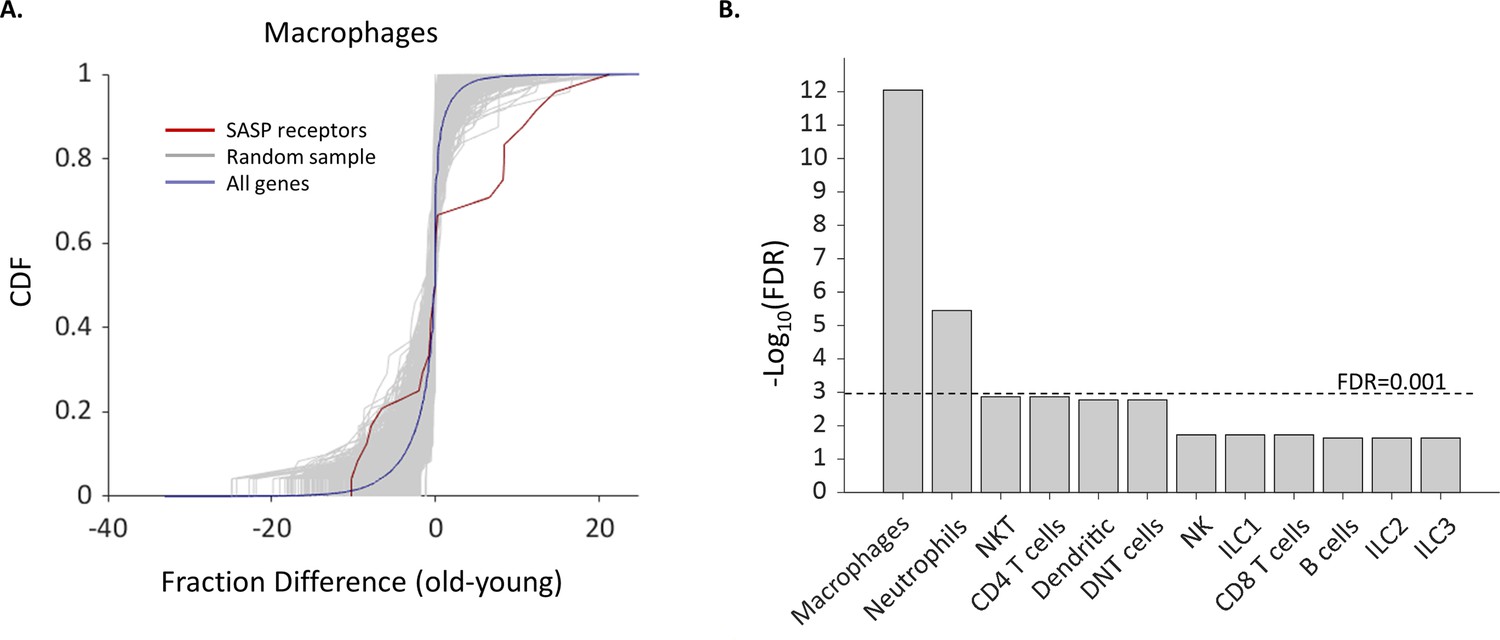
The fraction of Macrophages and Neutrophils expressing SASP receptors is elevated in old age.
(A) Cumulative probability distribution (CDF) of the difference of a fraction of old and young macrophages that express 24 SASP genes (red line). The gray lines are the fraction difference CDFs of groups of 24 random genes (10,000 samples). The blue line is the CDF of the fraction difference of all the macrophage genes. There is a significant increase with age in the fraction of cells that express members of the SASP genes (Kolmogorov-Smirnov test p-value <0.01). (B) The false discovery rate (FDR) for significant change (p-value <0.01) in the fraction of different cell types that express SASP genes. Macrophages and neutrophils exhibit FDR which is much smaller than 0.001.
Figure 5—figure supplement 1
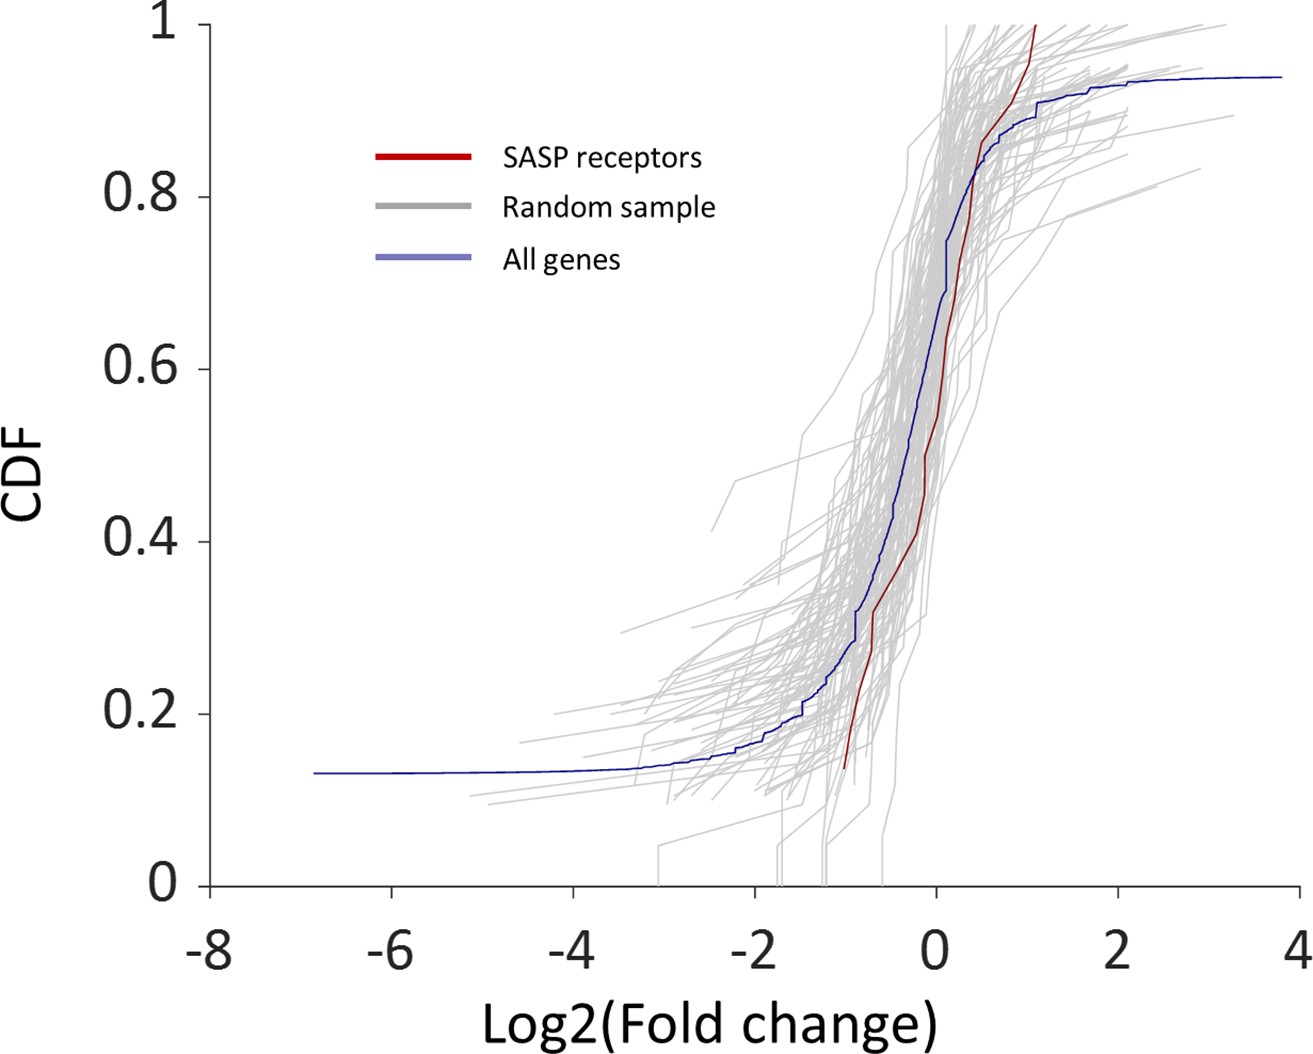
Cumulative probability distribution (CDF) of the fold change between old and young macrophages’ expression in SASP genes.
The red line is the CDF of the fold change between old and young macrophages’ expression in 24 SASP genes. The gray lines are the fold change CDFs of groups of 24 random genes (10,000 samples). The blue line is the CDF of the fold change of all the macrophage genes. There is no significant change with age.
Figure 6
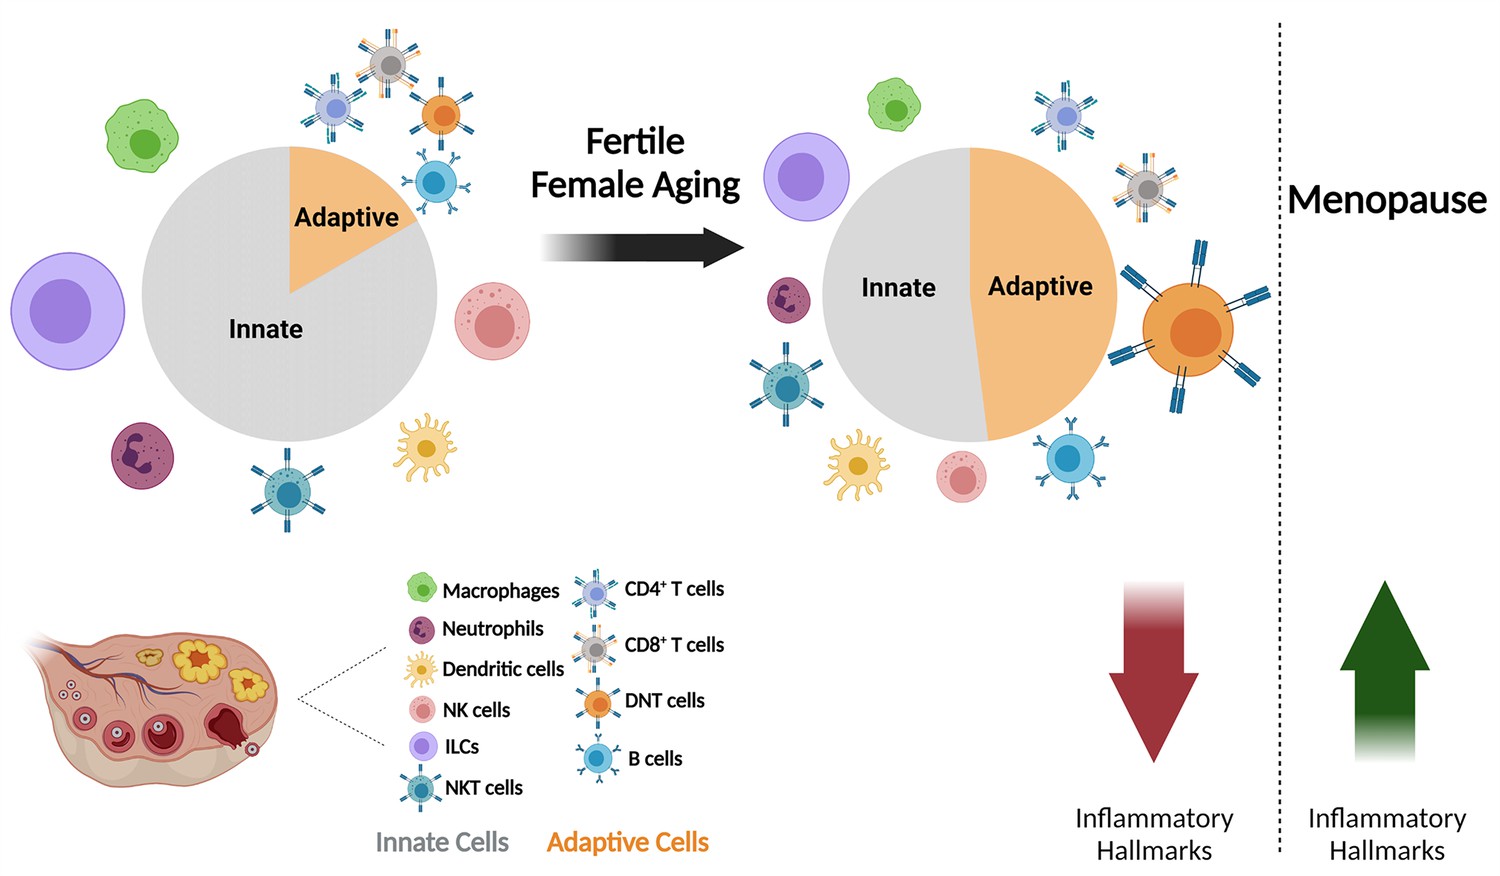
The effect of fertile female aging on the ovarian immune system.
As the female ages, most innate immunity cells, such as NTs, Mφs, ILCs, and NK cells exhibit a decrease in their fractions within the total immune population. Moreover, there is a substantial increase in the fraction of DNTs. The ovarian immune aging during the female fertile period is characterized by decreased inflammatory hallmarks, as opposed to the post-menopause inflammaging. (Created with BioRender.com).
Additional files
-
Supplementary file 1
Up and down DEGs.
- https://cdn.elifesciences.org/articles/74915/elife-74915-supp1-v2.xlsx
-
Supplementary file 2
Summary of downregulated processes REVIGO.
- https://cdn.elifesciences.org/articles/74915/elife-74915-supp2-v2.xlsx
-
Supplementary file 3
Summary of upregulated processes REVIGO.
- https://cdn.elifesciences.org/articles/74915/elife-74915-supp3-v2.xlsx
-
Supplementary file 4
GO enrichment CDF based.
- https://cdn.elifesciences.org/articles/74915/elife-74915-supp4-v2.xlsx
-
Supplementary file 5
SASP receptors list.
- https://cdn.elifesciences.org/articles/74915/elife-74915-supp5-v2.xlsx
-
Transparent reporting form
- https://cdn.elifesciences.org/articles/74915/elife-74915-transrepform1-v2.pdf
Download links
A two-part list of links to download the article, or parts of the article, in various formats.
Downloads (link to download the article as PDF)
Open citations (links to open the citations from this article in various online reference manager services)
Cite this article (links to download the citations from this article in formats compatible with various reference manager tools)
Single-cell analysis of the aged ovarian immune system reveals a shift towards adaptive immunity and attenuated cell function
eLife 12:e74915.
https://doi.org/10.7554/eLife.74915


