Neural correlates and determinants of approach–avoidance conflict in the prelimbic prefrontal cortex
- Department of Neurobiology and Anatomy, The University of Texas Health Science Center, United States
- Rice University, United States
Figures
Figure 1 with 1 supplement
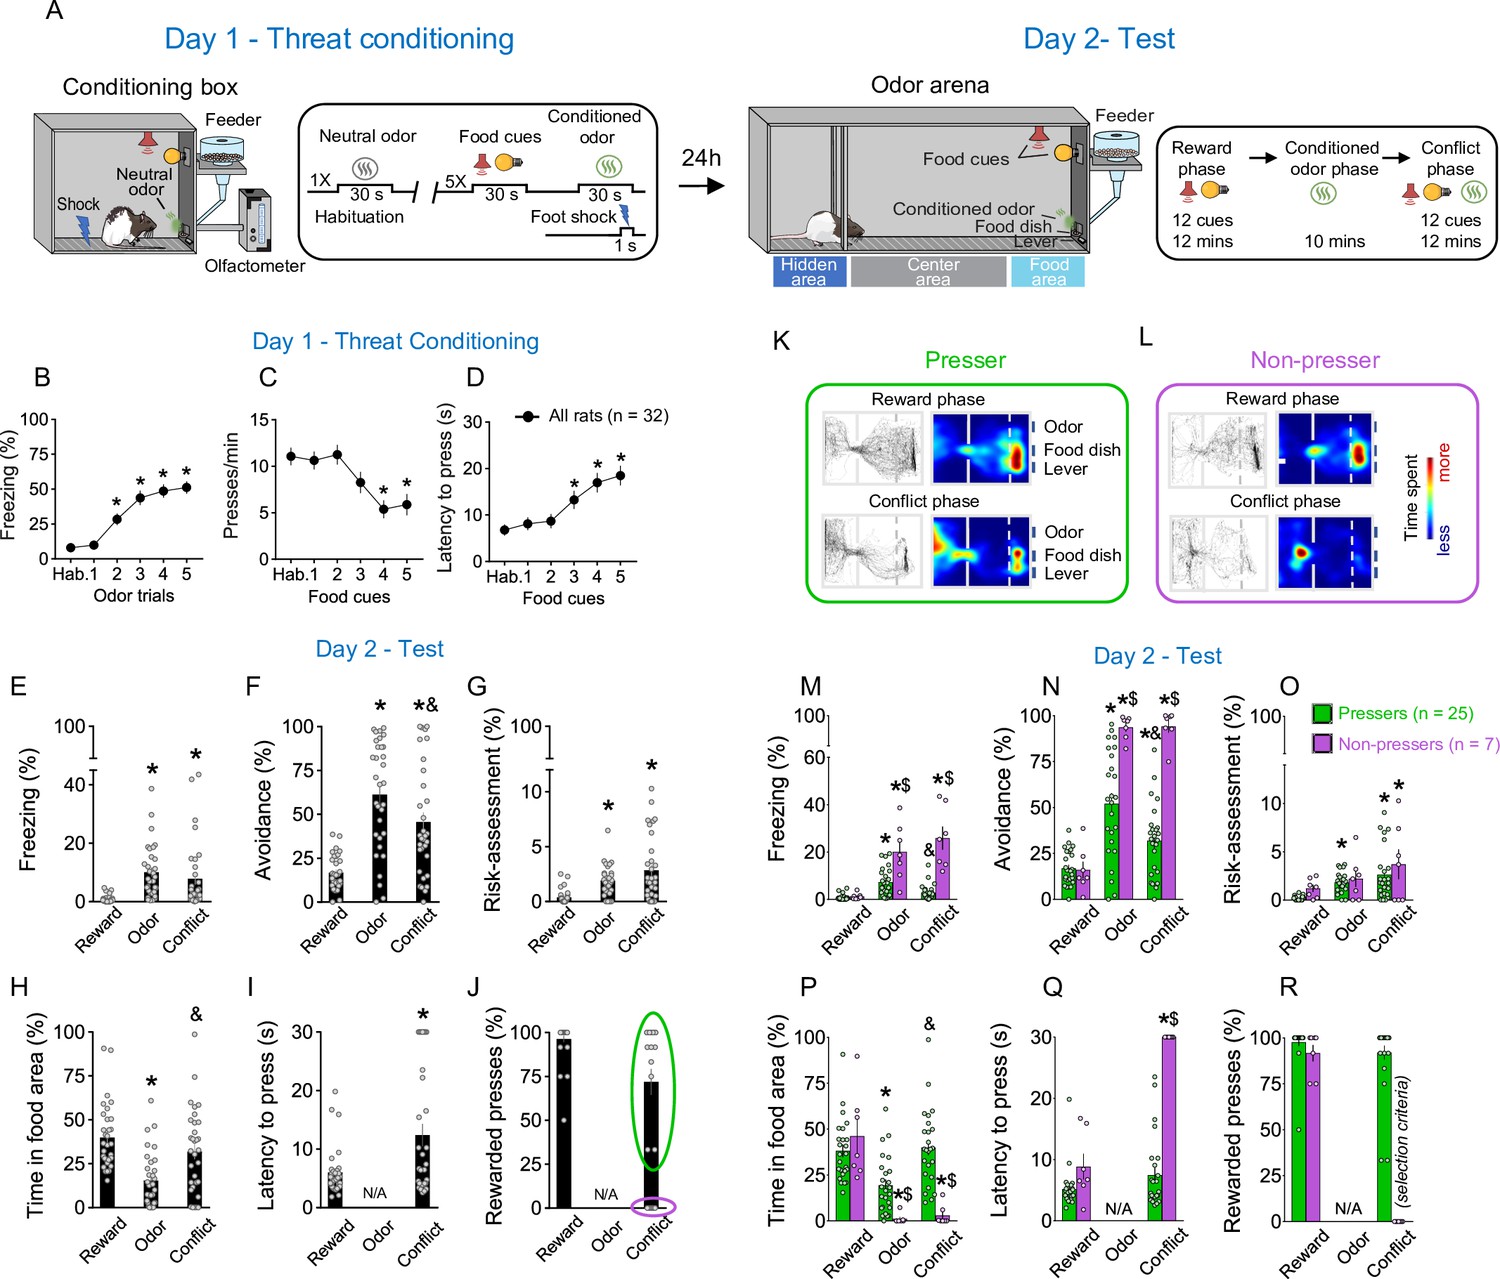
Rats show individual variability in reward-seeking responses during an approach–avoidance conflict test.
(A) Schematic and timeline of the approach–avoidance conflict test. (B–D) Rats exhibited an increase in the percentage of time freezing (Shapiro–Wilk normality test, p < 0.001, Friedman test, Friedman statistic = 84.08, p < 0.001, Dunn’s post hoc, p < 0.001) and a reduction in lever presses (Shapiro–Wilk normality test, p < 0.001, Friedman test, Friedman statistic = 35.11, p < 0.001, Dunn’s post hoc, p < 0.001) with a higher latency to press the lever (Shapiro–Wilk normality test, p < 0.001, Friedman test, Friedman statistic = 29.45, p < 0.001, Dunn’s post hoc, p < 0.001) during the olfactory threat conditioning session on day 1 (n = 32), when compared to before the shock. (E–G) Patterns of defensive responses and food seeking during the different phases (reward, odor, and conflict) of the test session on day 2. Rats showed an increase in defensive responses characterized by an augment in the percentage of time exhibiting (E) freezing (Shapiro–Wilk normality test, p < 0.05, Friedman test, Friedman statistic = 40.46, p < 0.001, Dunn’s post hoc, p < 0.001), (F) avoidance (Shapiro–Wilk normality test, p < 0.05, Friedman test, Friedman statistic = 31.67, p < 0.001, Dunn’s post hoc, p < 0.001), and (G) risk-assessment (Shapiro–Wilk normality test, p < 0.05, Friedman test, Friedman statistic = 29.86, p < 0.001, Dunn’s post hoc, p < 0.001); and a decrease in the (H) percentage of time spent in the food area (Shapiro–Wilk normality test, p < 0.05, Friedman test, Friedman statistic = 32.19, p < 0.001, Dunn’s post hoc, p < 0.001) during the odor presentation, when compared to the reward phase. Rats’ defensive responses were significantly attenuated during the conflict phase as evidenced by a reduction in the percentage of time. (F) Avoiding the odor (p = 0.0031) and an increase in the percentage of time (H) approaching the food area (p < 0.001), when compared to the odor phase. (I, J) Two different behavioral phenotypes emerged during the conflict phase: rats that continued to press the lever (Pressers, green circle, n = 25) and rats that showed a complete suppression in lever pressing (Non-pressers, purple circle, n = 7). Rewarded presses were calculated as the percentage of the 12 cue trials in which rats pressed the lever. Representative tracks and heatmaps of time spent in each compartment of the arena for a (K) Presser or a (L) Non-pressers rat during the test session. (M–R) Patterns of defensive responses and food seeking during the different phases (reward, odor, and conflict) of the test session on day 2 after separating the animals into Pressers and Non-pressers. When compared to Non-pressers, Pressers showed reduced defensive responses characterized by an attenuation in the percentage of time exhibiting (M) freezing (F(2, 60) = 29.54, p < 0.001) and (N) avoidance responses (F(2, 60) = 23.27, p < 0.001), and an augment in the percentage of time (P) approaching the food area (F(2, 60) = 22.49, p < 0.001) during both the odor and the conflict phases (Bonferroni post hoc test – odor phase, p = 0.0453; conflict phase, p < 0.001). (Q) Non-pressers showed increased latency to press the lever during the conflict phase when compared to the reward phase or to Pressers in the same phase (F(1, 30) = 55.14, p < 0.001, Bonferroni post hoc test – all p’s < 0.001). (R) The percentage of rewarded trials was used as a binary criterium for group classification. Data shown as mean ± standard error of the mean (SEM). One- or two-way analysis of variance (ANOVA) repeated measures followed by Bonferroni post hoc test, all *p’s < 0.05 compared to the same group during the reward phase, all &p’s < 0.05 compared to the same group during the odor phase, all $p’s < 0.05 compared to Pressers during the same phase. All statistical analysis details are presented in Source data 1. See also Figure 1—figure supplement 1 and Video 1.
-
Figure 1—source data 1
Source data for Figure 1.
- https://cdn.elifesciences.org/articles/74950/elife-74950-fig1-data1-v2.xlsx
Figure 1—figure supplement 1
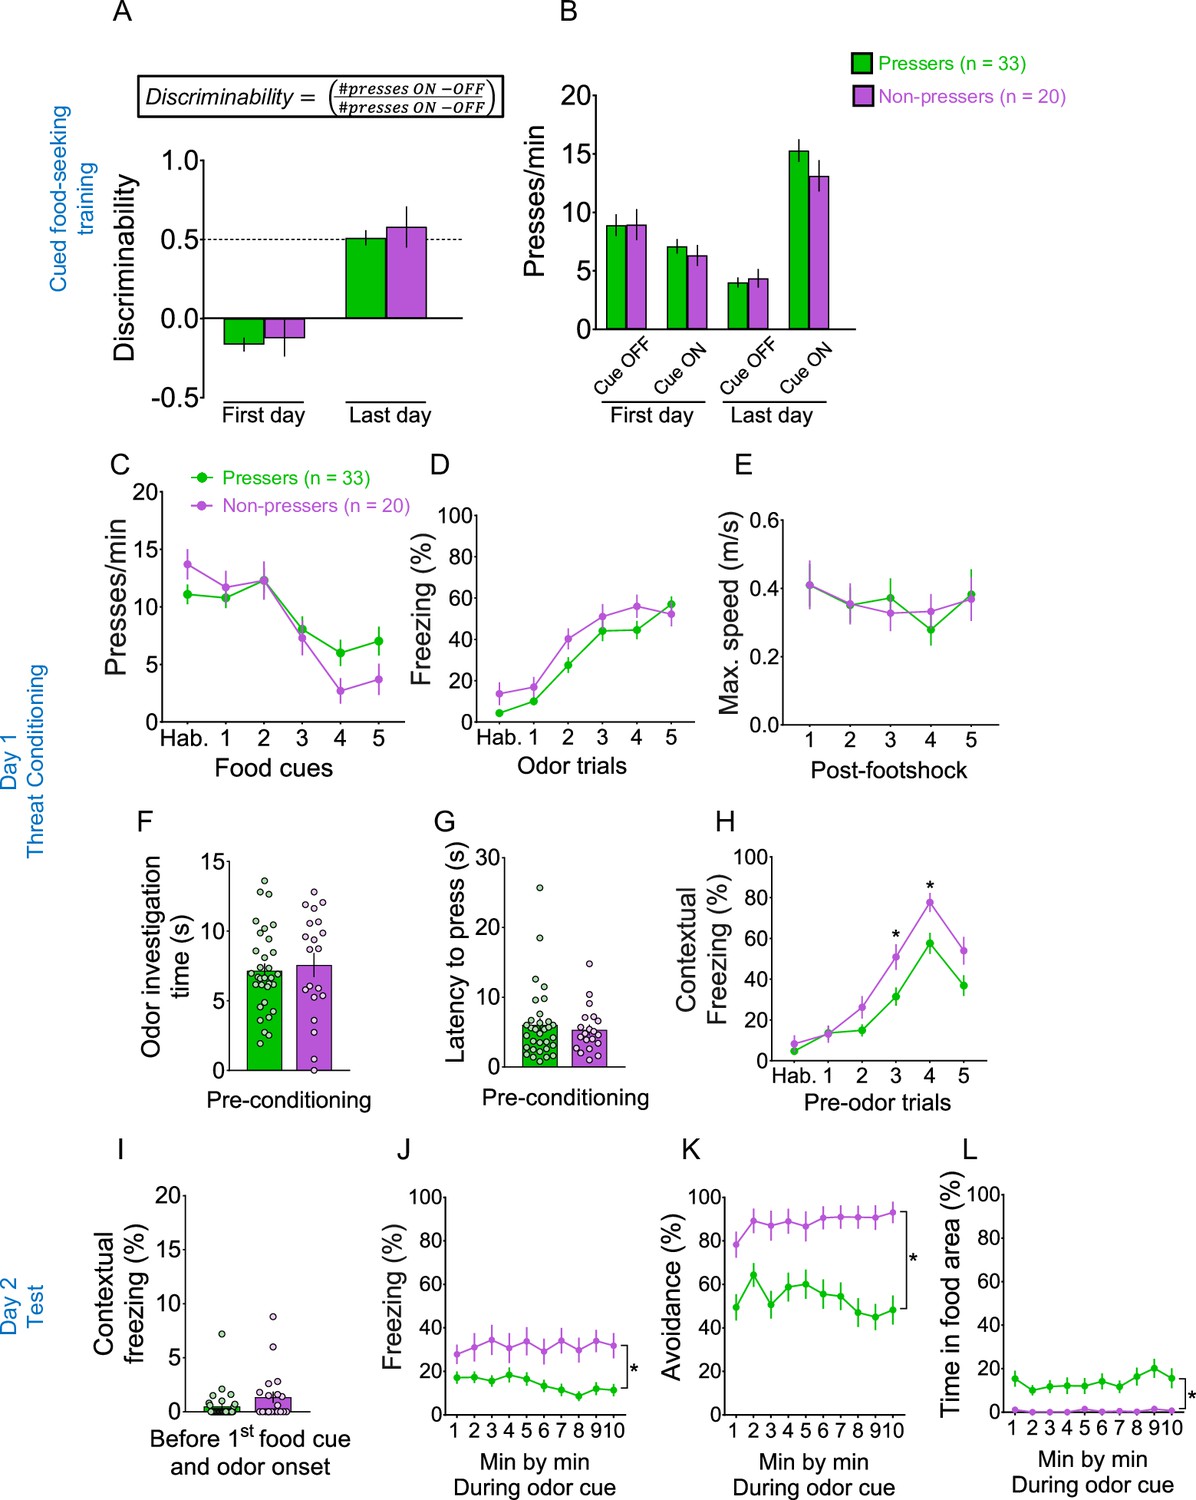
Pressers and Non-pressers showed similar behavioral responses during cued food-seeking training and olfactory threat conditioning.
(A) Pressers and Non-pressers learned to discriminate equally the food-cue off from the food-cue on periods during the training phase (Group, F(1, 55) = 2.166, p = 0.146; Time, F(1, 55) = 238.7, p < 0.001; Interaction, F(1, 55) = 0.106, p = 0.745; Bonferroni post hoc for early vs. late p < 0.001). Discriminability was calculated as the number of lever, pressers during the cue on period (30 s) minus the number of lever presses during the cue off period (30 s before cue) divided by the total number of presses during both periods. (B) Pressers and Non-pressers showed the same lever press rates during the cue-off and cue-on periods across the cued food-seeking training (F(3, 153) = 1.28, p = 0.283). Pressers and Non-pressers exhibited the same (C) lever press rates (F(1, 51) = 0.265, p = 0.608), (D) freezing levels (F(1, 51) = 3.737, p = 0.058), and (E) maximum speed (F(1, 51) = 6.538e007, p = 0.999) during the olfactory threat conditioning training. Pressers and Non-pressers spent the same (F) time investigating the odor (unpaired Student’s t-test, t = 0.43, p = 0.665) and showed the same (G) latency to press the lever (unpaired Student’s t-test, t = 0.55, p = 0.578) before the first odor–shock pairing. (H) Non-pressers showed higher contextual freezing during the third and fourth preodor trials (30 s before odor onset), compared to Pressers (F(5, 250) = 3.038, p = 0.011; Bonferroni post hoc test, third preodor trial: p = 0.0214; fourth preodor trial: p = 0.015). During the test session on day 2, Pressers and Non-pressers showed the same levels of (I) contextual freezing before the first food cue and odor onset (Shapiro–Wilk normality test, p < 0.001, Mann–Whitney, U = 248, p = 0.113). The behavioral responses were different between groups but constant across the session for (J) freezing (Group, F(1, 50) = 13.07, p < 0.001; Interaction, F(9, 450) = 1.327, p = 0.220), (K) avoidance (Group, F(1, 50) = 20.31, p < 0.001; Interaction, F (9, 450) = 2.109, p = 0.027; Bonferroni post hoc min 1 vs. min 10, p > 0.999) and (L) time in food area (Group, F(1, 50) = 117.5, p = 0.001; Interaction, F(9, 450) = 0.573, p = 0.819). Combined data for all Pressers and Non-pressers used across the experiments. Data shown as mean ± standard error of the mean (SEM). Two-way analysis of variance (ANOVA) repeated measures followed by Bonferroni post hoc test, *p < 0.05 for group comparison. All statistical analysis details are presented in Source data 1.
-
Figure 1—figure supplement 1—source data 1
Source data for Figure 1—figure supplement 1.
- https://cdn.elifesciences.org/articles/74950/elife-74950-fig1-figsupp1-data1-v2.xlsx
Figure 2 with 4 supplements

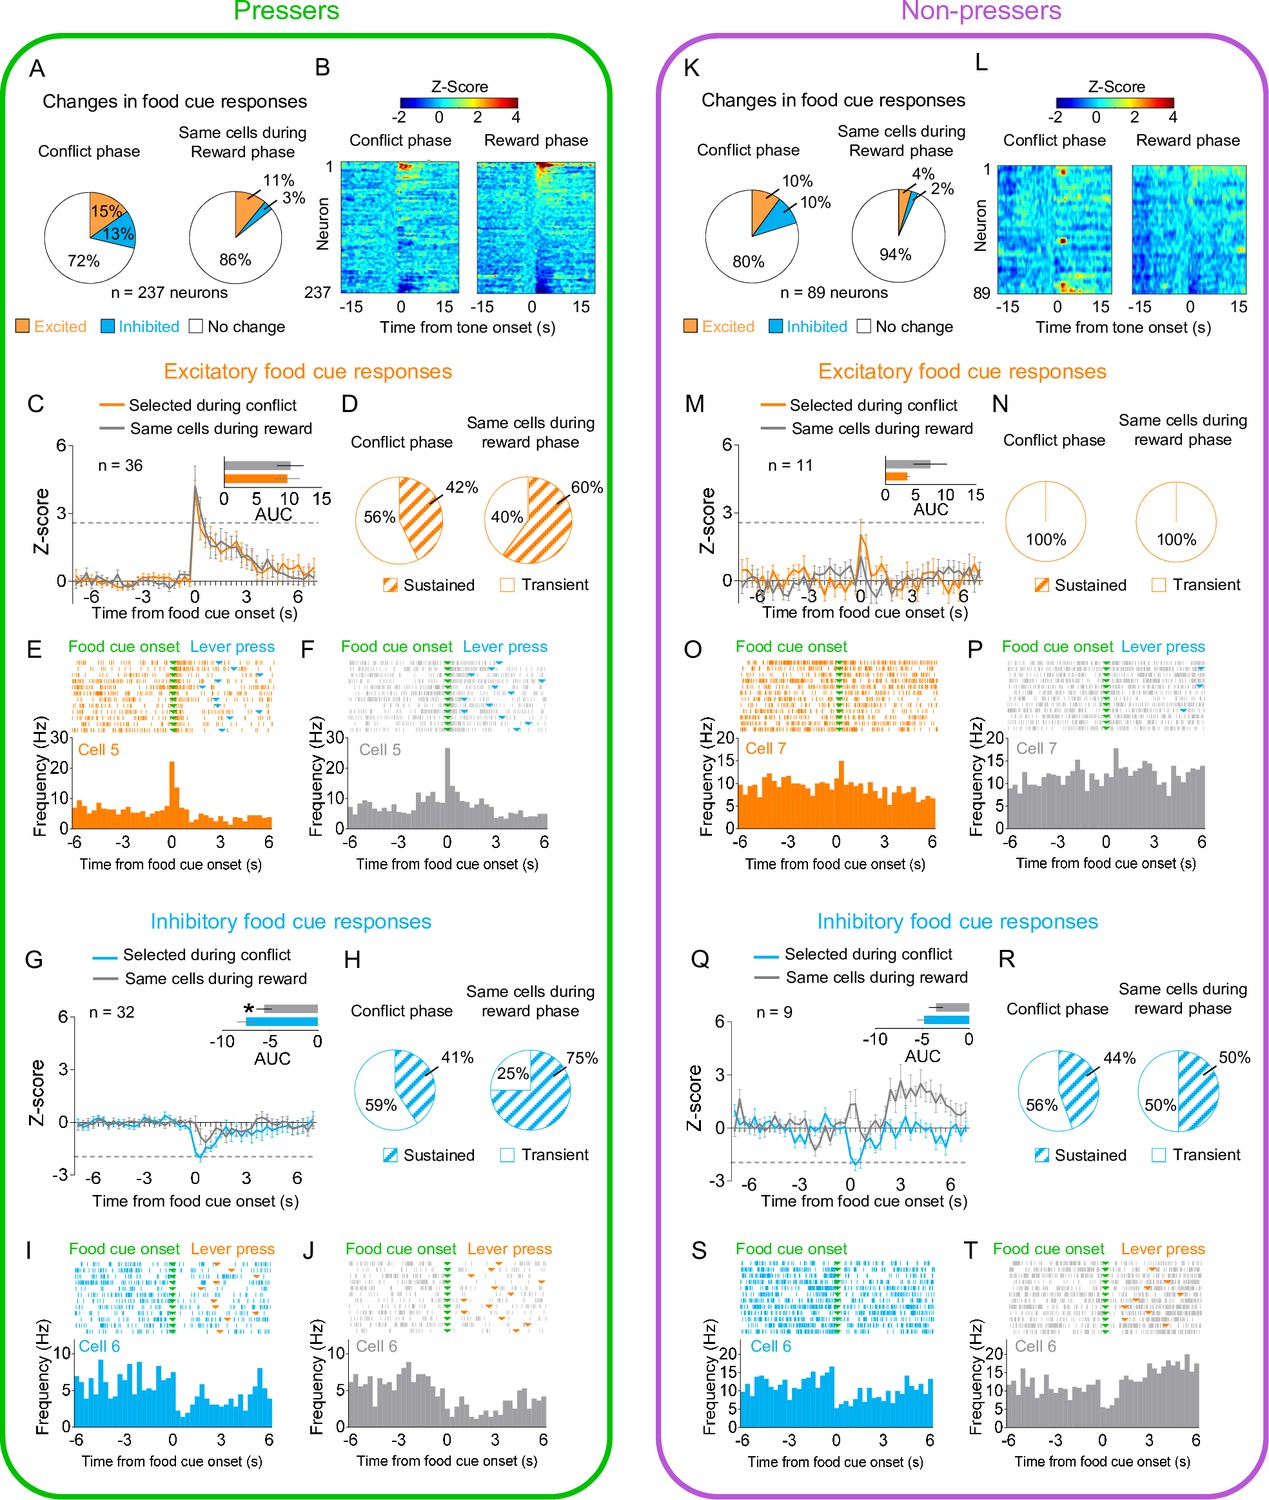
Prelimbic (PL) neurons respond differently to reward cues in Pressers vs. Non-pressers during conflict.
(A) Diagram of the electrode placements in PL. (B) Schematic and timeline of PL recordings for food cue responses during of the approach–avoidance conflict test (12 food cues per phase). (C) Pie charts showing changes in PL firing rate in response to food cues during reward (left) vs. conflict (right) phases for Pressers (n = 237 neurons from 25 rats, Fisher Exact Test, responsive during reward phase: n = 79, responsive during conflict phase: n = 32, p < 0.001; excited during reward phase: n = 48, excited during conflict phase: n = 25, p = 0.0049; inhibited during reward phase: n = 31, inhibited during conflict phase: n = 7, p < 0.001). (D) Heatmap of Z-scored neural activities for PL neurons selected during reward phase and tracked to conflict phase. (E) Average peristimulus time histograms (PSTHs) for all PL neurons showing excitatory food-cue responses (Z-score >2.58, dotted line) during reward (red line) compared to the same cells during conflict (gray line). (E) Inset: differences in the positive area under the curve (AUC) between the two phases (Shapiro–Wilk normality test, p < 0.001; Wilcoxon test, W = −824, excitatory responses reward phase vs. conflict phase, p < 0.001). (F) Pie charts showing the percentage of sustained vs. transient excitatory food-cue responses in PL neurons during the reward phase with the same neurons tracked during the conflict phase. Representative PSTHs for a PL neuron showing excitatory responses to food cues during the (G) reward phase vs. the same neuron during the (H) conflict phase. (I) Average PSTHs for all PL neurons showing inhibitory food-cue responses (Z-score <−1.96, dotted line) during reward (blue line) compared to the same cells during conflict (gray line). (I) Inset: differences in the negative AUC between the two phases (Shapiro–Wilk normality test, p < 0.001; Wilcoxon test, W = 367, inhibitory responses reward phase vs. conflict phase, p < 0.001). (J) Pie charts showing the percentage of sustained vs. transient inhibitory food-cue responses in PL neurons during the reward phase with the same neurons tracked during the conflict phase. Representative PSTHs for a PL neuron showing inhibitory responses to food cues during the reward phase (K) vs. the same neuron during the conflict phase (L). (M) Pie charts showing changes in PL firing rate in response to food cues during reward (left) vs. conflict (right) phases for Non-pressers (n = 89 neurons from seven rats; Fisher Exact Test, responsive during reward phase: n = 19, responsive during conflict phase: n = 6, p < 0.0086; excited during reward phase: n = 10, excited during conflict phase: n = 4, p = 0.162; inhibited during reward phase: n = 9, inhibited during conflict phase: n = 2, p = 0.057). (N–O) Same as D and E, but for Non-pressers. (O) Inset: differences in the positive AUC between the two phases (paired Student’s t-test, t = 2.34, p = 0.043). (P–S) Same as (F–I) but for Non-pressers. (S) Inset: differences in the negative AUC between the two phases (paired Student’s t-test, t = 0.59, p = 0.569) (T–V). Same as (J–L) but for Non-pressers. The threshold used to identify significant differences per neurons was Z-score >2.58 for excitation and Z-score <−1.96 for inhibition. cc, corpus callosum; CG1, anterior cingulate cortex; IL, infralimbic cortex. All *p‘s < 0.05. All statistical analysis details are presented in Source data 1. See also Figure 2—figure supplements 1–4.
-
Figure 2—source data 1
Source data for Figure 2.
- https://cdn.elifesciences.org/articles/74950/elife-74950-fig2-data1-v2.xlsx
Figure 2—figure supplement 1
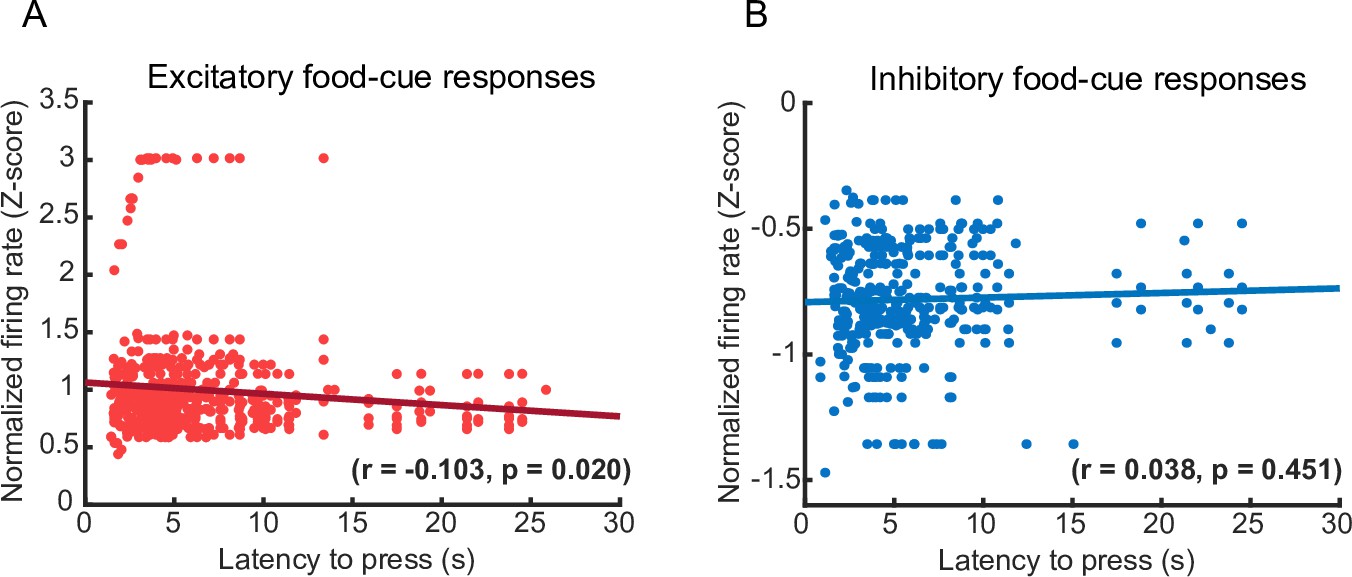
Correlation between food-cue-evoked PL activity and lever press latency during the conflict phase in Pressers.
(A) Scatter plot showing a significant inverse correlation between the normalized firing rate (Z-score) of excitatory food-cue responsive neurons and the latency to press the lever after the food-cue onset during the conflict phase (r = −0.103, p = 0.020). (B) Scatter plot showing lack of correlation between the normalized firing rate (Z-score) of inhibitory food-cue responsive neurons and the latency to press the lever after the food-cue onset during the conflict phase (r = 0.038, p = 0.451). Each data point denotes the averaged Z-scored response of one neuron until the animal pressed the lever (y-axis) vs. the respective latency to press during each food-cue presentation (x-axis). The black lines represent the linear regression of the data points, fitting the first degree polynomial to the data (see Methods for details). The equation for the linear fitting in the excitatory case is y = 0.0098x + 1.1 and for inhibitory case is y = 0.0018x − 0.79.
-
Figure 2—figure supplement 1—source data 1
Source data for Figure 2—figure supplement 1.
- https://cdn.elifesciences.org/articles/74950/elife-74950-fig2-figsupp1-data1-v2.xlsx
Figure 2—figure supplement 2
Changes in prelimbic (PL) responses to reward cues selected during the conflict phase for Pressers and Non-pressers.
(A) Pie charts showing changes in PL firing rate in response to food cues during conflict (left) vs. reward (right) phases for Pressers (n = 237 neurons from 25 rats, Fisher Exact Test, responsive during conflict phase: n = 68, responsive during reward phase: n = 34, p < 0.001, excitatory during conflict phase: n = 36, excitatory during reward phase: n = 26, p = 0.22; inhibitory during conflict phase: n = 32, inhibitory during reward phase: n = 8, p < 0.001). (B) Heatmap of Z-scored neural activities for PL neurons selected during conflict phase and tracked to reward phase. (C) Average peristimulus time histograms (PSTHs) for all PL neurons showing excitatory food-cue responses (Z-score >2.58, dotted line) during conflict (orange line) compared to the same cells during reward (gray line). (C) Inset: differences in the positive area under the curve (AUC) between the two phases (Wilcoxon test, W = 122, excitatory responses reward phase vs. conflict phase, p = 0.346). (D) Pie charts showing the percentage of sustained vs. transient excitatory food-cue responses in PL neurons during the conflict phase with the same neurons tracked back during the reward phase. Representative PSTHs for a PL neuron showing excitatory responses to food cues during the (E) conflict phase vs. the same neuron during the (F) reward phase. (G) Average PSTHs for all PL neurons showing inhibitory food-cue responses (Z-score <−1.96, dotted line) during conflict (blue line) compared to the same cells during reward (gray line). (G) Inset: differences in the negative AUC between the two phases (Wilcoxon test, W = 266, inhibitory responses reward phase vs. conflict phase, p = 0.011). (H) Pie charts showing the percentage of sustained vs. transient inhibitory food-cue responses in PL neurons during the conflict phase with the same neurons tracked back during the reward phase. Representative PSTHs for a PL neuron showing inhibitory responses to food cues during the (I) conflict phase vs. the same neuron during the (J) reward phase. (K) Pie charts showing changes in PL firing rate in response to food cues during conflict (left) vs. reward (right) phases for Non-presses (n = 89 neurons from seven rats, Fisher Exact Test, responsive during conflict phase: n = 18, responsive during reward phase: n = 6, p = 0.0129; excitatory during conflict phase: n = 9, excitatory during reward phase: n = 4, p = 0.2486; inhibitory during conflict phase: n = 9, inhibitory during reward phase: n = 2, p = 0.0573). (L, M) Same as B and C, but for Non-pressers. (M) Inset: differences in the positive AUC between the two phases (Wilcoxon test, W = 19, excitatory responses reward phase vs. conflict phase, p = 0.300). (N) Pie charts showing the percentage of sustained vs. transient excitatory food-cue responses in PL neurons during the conflict phase with the same neurons tracked back during the reward phase. (O–Q) Same as E–G, but for Non-pressers. (Q) Inset: differences in the negative AUC between the two phases (Wilcoxon test, W = 11, excitatory responses reward phase vs. conflict phase, p = 0.570). (R) Pie charts showing the percentage of sustained vs. transient inhibitory food-cue responses in PL neurons during the conflict phase with the same neurons tracked back during the reward phase. (S, T) Same as I and J, but for Non-pressers. For all Shapiro–Wilk normality test, p < 0.05. All statistical analysis details are presented in Source data 1.
-
Figure 2—figure supplement 2—source data 1
Source data for Figure 2—figure supplement 2.
- https://cdn.elifesciences.org/articles/74950/elife-74950-fig2-figsupp2-data1-v2.xlsx
Figure 2—figure supplement 3
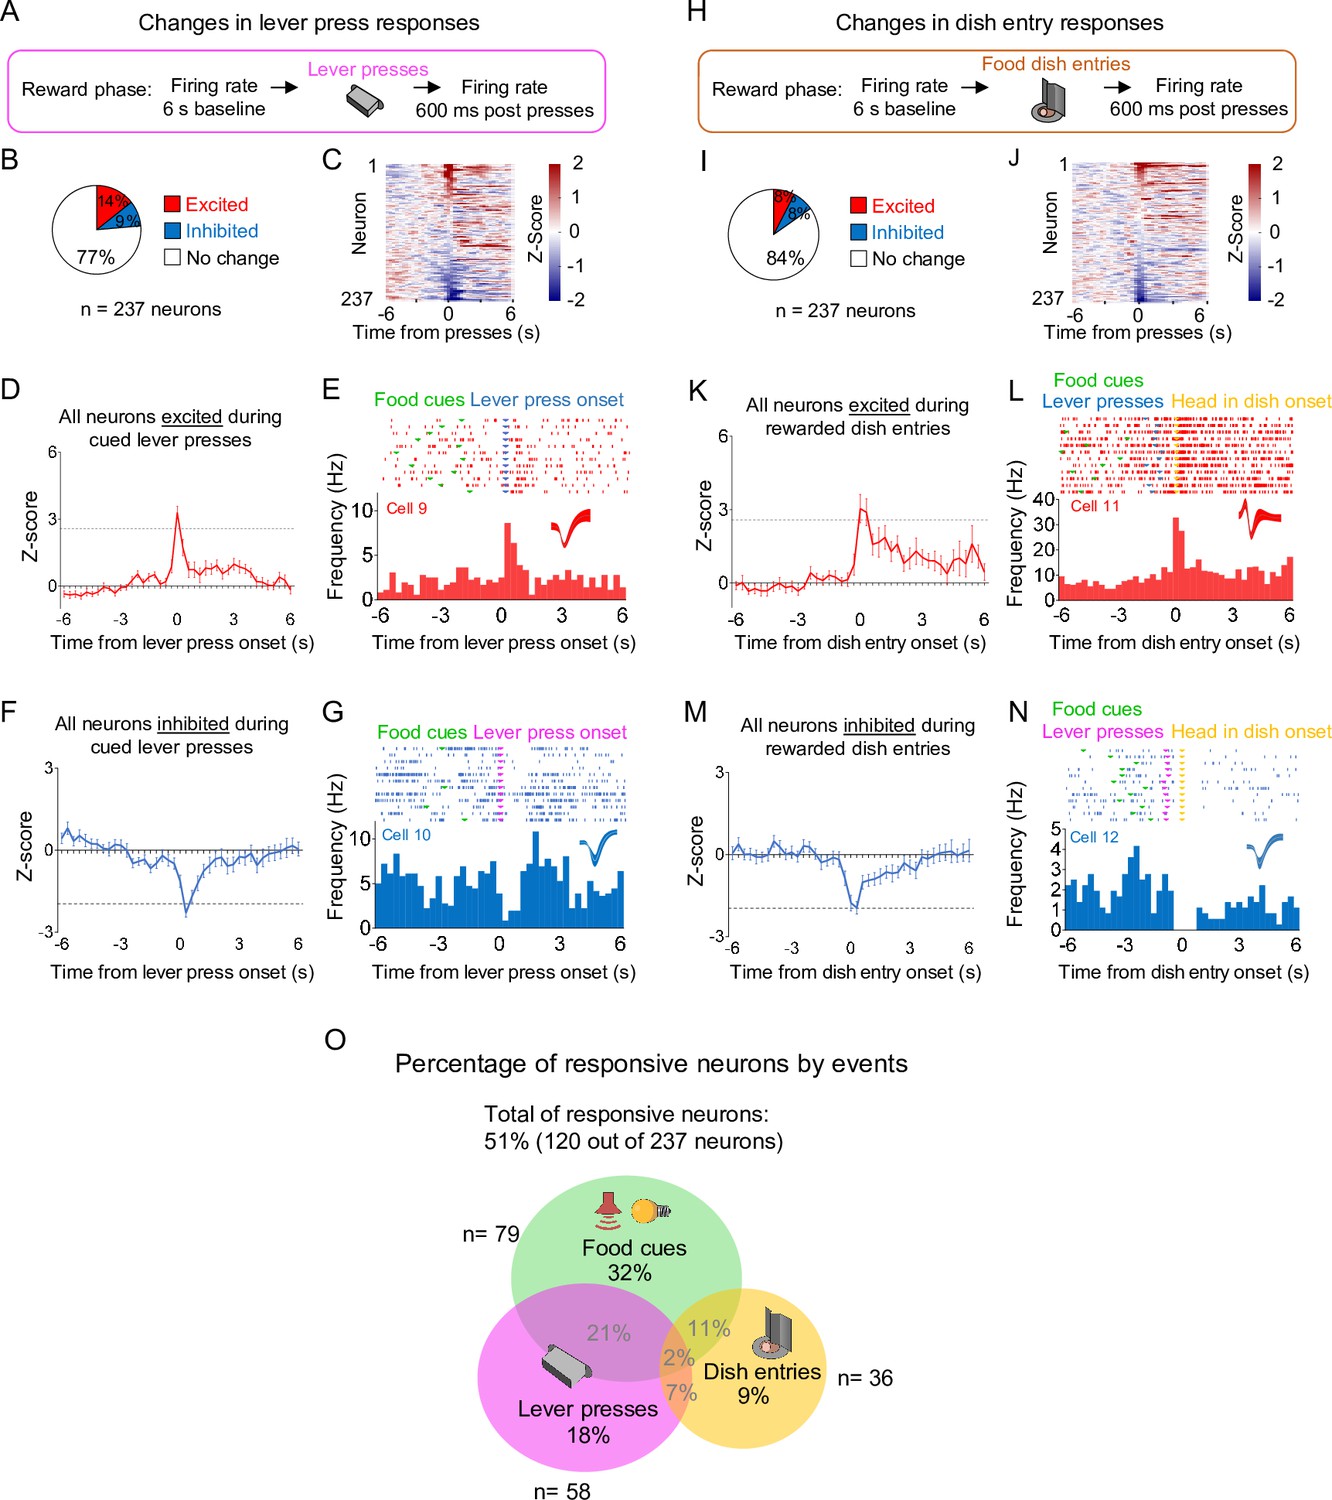
Distinct subpopulations of prelimbic (PL) neurons change their firing rates in response to food cues, lever pressers, and dish entries.
(A) Schematic of the recordings during cued lever presses. (B) Pie charts showing the percentage of lever-press responsive neurons during the reward phase. (C) Heatmap showing the normalized firing rate of individual PL neurons time locked for lever presses. (D) Average peristimulus time histogram (PSTH) of all PL neurons showing excitatory lever-press responses. (E) Raster plot and PSTH of a representative PL neuron showing excitatory lever-press responses. (F) Average PSTH of all PL neurons showing inhibitory lever-press responses. (G) Raster plot and PSTH of a representative PL neuron showing inhibitory lever-press responses. (H) Schematic of the recordings during rewarded food dish entries. (I) Pie charts showing the percentage of dish entry responsive neurons during the reward phase (n = 237 neurons). (J) Heatmap showing the normalized firing rate of individual PL neurons time-locked for rewarded food dish entries. (K) Average PSTH of all PL neurons showing excitatory dish entry responses. (L) Raster plot and PSTH of a representative PL neuron showing excitatory dish entry responses. (M) Average PSTH of all PL neurons showing inhibitory dish entry responses. (N) Raster plot and PSTH of a representative PL neuron showing inhibitory dish entry responses. (O) Venn diagram showing the percentage of all responsive neurons (120 out of 237) by events. Most of the responsive neurons (59%) responded exclusively to one of the events. n = 237 neurons from 25 rats.
-
Figure 2—figure supplement 3—source data 1
Source data for Figure 2—figure supplement 3.
- https://cdn.elifesciences.org/articles/74950/elife-74950-fig2-figsupp3-data1-v2.xlsx
Figure 2—figure supplement 4
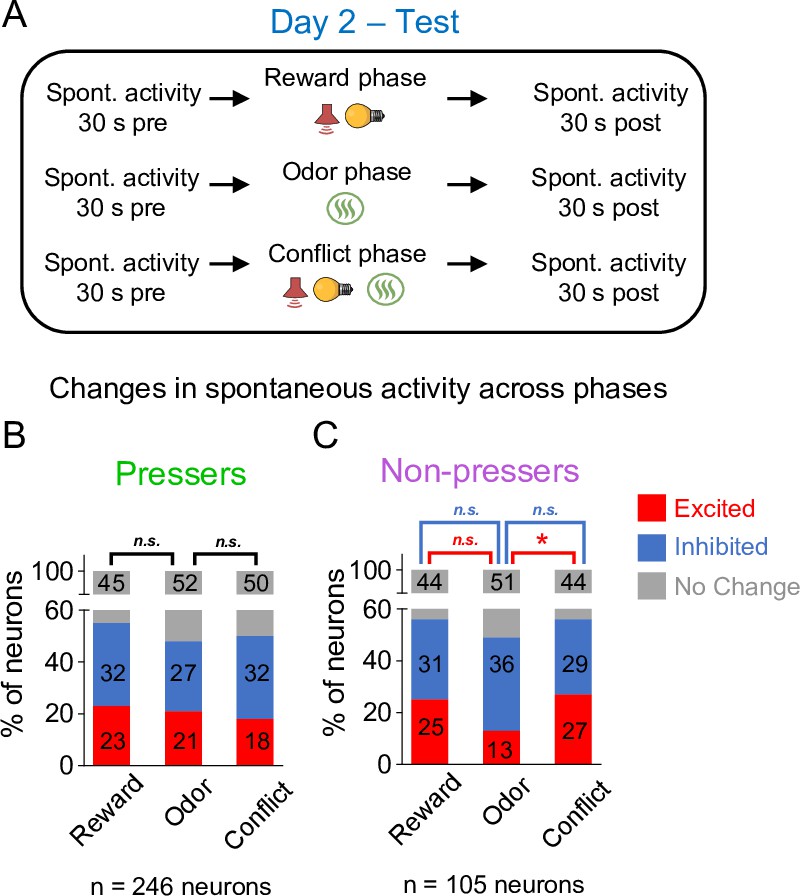
Changes in prelimbic (PL) spontaneous activity in Pressers and Non-pressers across the different phases of the test session.
(A) Timeline of PL recordings for spontaneous activity during test. Stacked bars showing the percentage of PL neurons that changed their spontaneous firing rates across the different phases of the test in both Pressers (B) and Non-pressers (C). Non-pressers showed a significant increase in the proportion of excited neurons from the odor to the conflict phase (Fisher Exact Test, excited from reward phase to odor phase: 14 neurons), excited from odor phase to conflict phase: 28 neurons, p = 0.015. n.s. = nonsignificant, *p < 0.05. All statistical analysis details are presented in Source data 1.
-
Figure 2—figure supplement 4—source data 1
Source data for Figure 2—figure supplement 4.
- https://cdn.elifesciences.org/articles/74950/elife-74950-fig2-figsupp4-data1-v2.xlsx
Figure 3 with 1 supplement
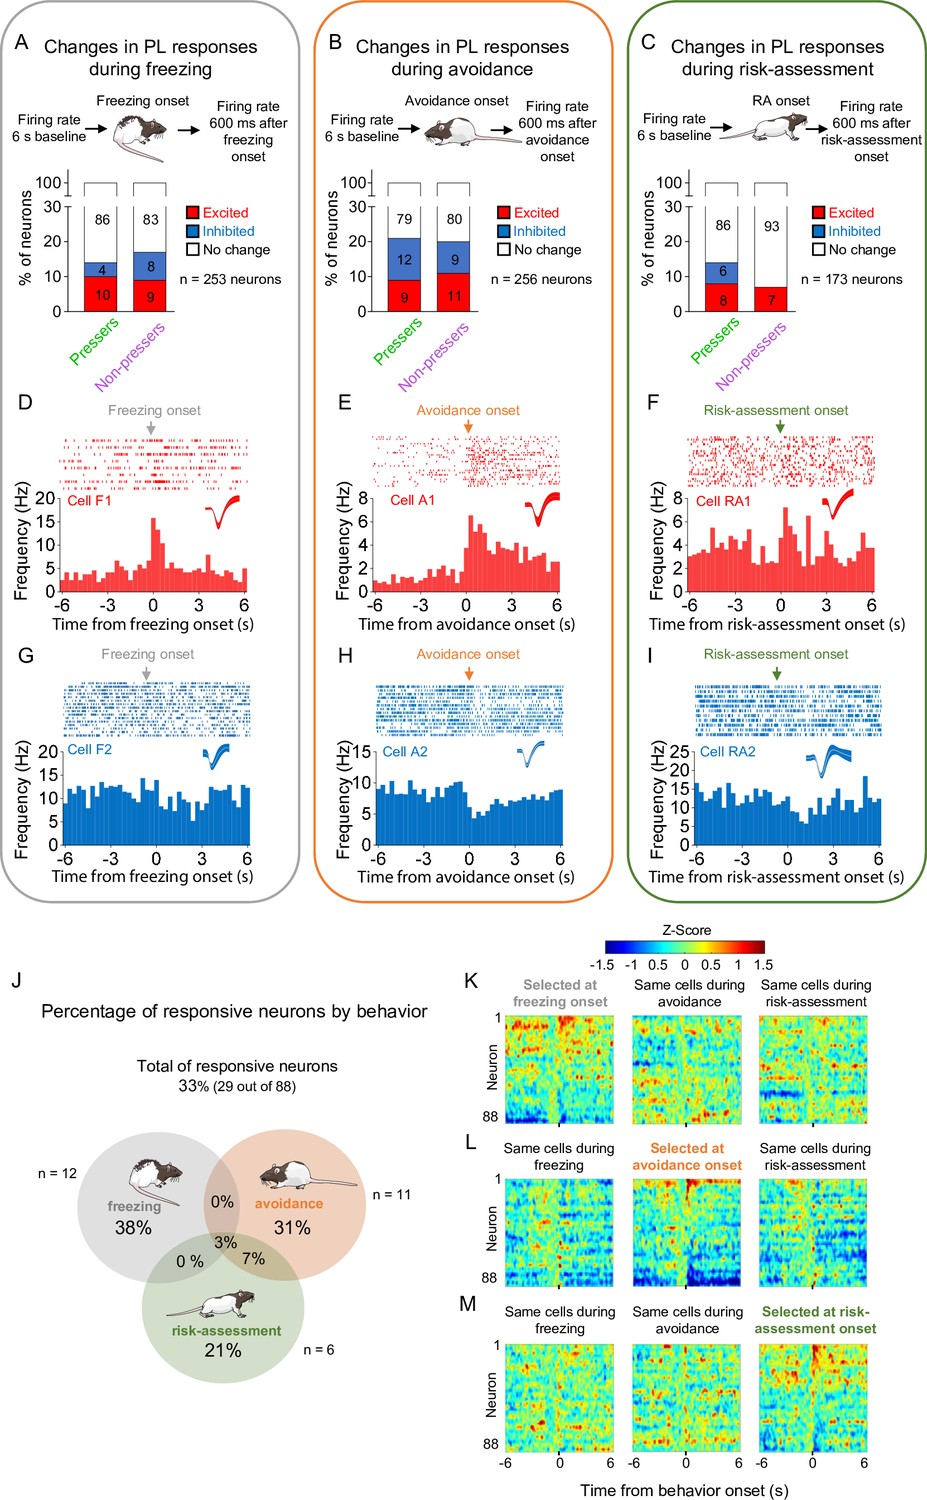
Prelimbic (PL) activity correlates with the onset of freezing, avoidance, or risk-assessment behaviors in both Pressers and Non-pressers.
Both Pressers and Non-pressers showed the same number and proportion of excitatory and inhibitory PL responses during the onset of (A) freezing (Fisher Exact Test, responsive neurons in Pressers: 22 neurons, in Non-pressers: 15 neurons, p = 0.462), (B) avoidance (Fisher Exact Test, responsive neurons in Pressers: 43 neurons, in Non-pressers: 9 neurons, p = 0.999), or (C) risk-assessment (RA, Fisher Exact Test, responsive neurons in Pressers: 12 neurons, in Non-pressers: 6 neurons, p = 0.318) behaviors. Representative peristimulus time histograms (PSTHs) for distinct PL neurons showing excitatory responses at the onset of (D) freezing, (E) avoidance, or (F) risk-assessment behaviors. Representative PSTHs for distinct PL neurons showing inhibitory responses at the onset of freezing (G), avoidance (H), or risk-assessment (I) behaviors. (J) Venn diagram showing the percentage of all PL responsive neurons (29 out of 88 neurons) by behavior. Most of the responsive neurons responded selectively at the onset of one of the behaviors. Heatmap of Z-scored neural activities for PL neurons selected at the onset of freezing (K), avoidance (L), or risk-assessment behavior (M) with the same cells tracked during the other behaviors. The threshold used to identify significant differences per neurons was Z-score >2.58 for excitation and Z-score <−1.96 for inhibition. n.s. = nonsignificant. All statistical analysis details are presented in Source data 1. See also Figure 3—figure supplement 1.
-
Figure 3—source data 1
Source data for Figure 3.
- https://cdn.elifesciences.org/articles/74950/elife-74950-fig3-data1-v2.xlsx
Figure 3—figure supplement 1
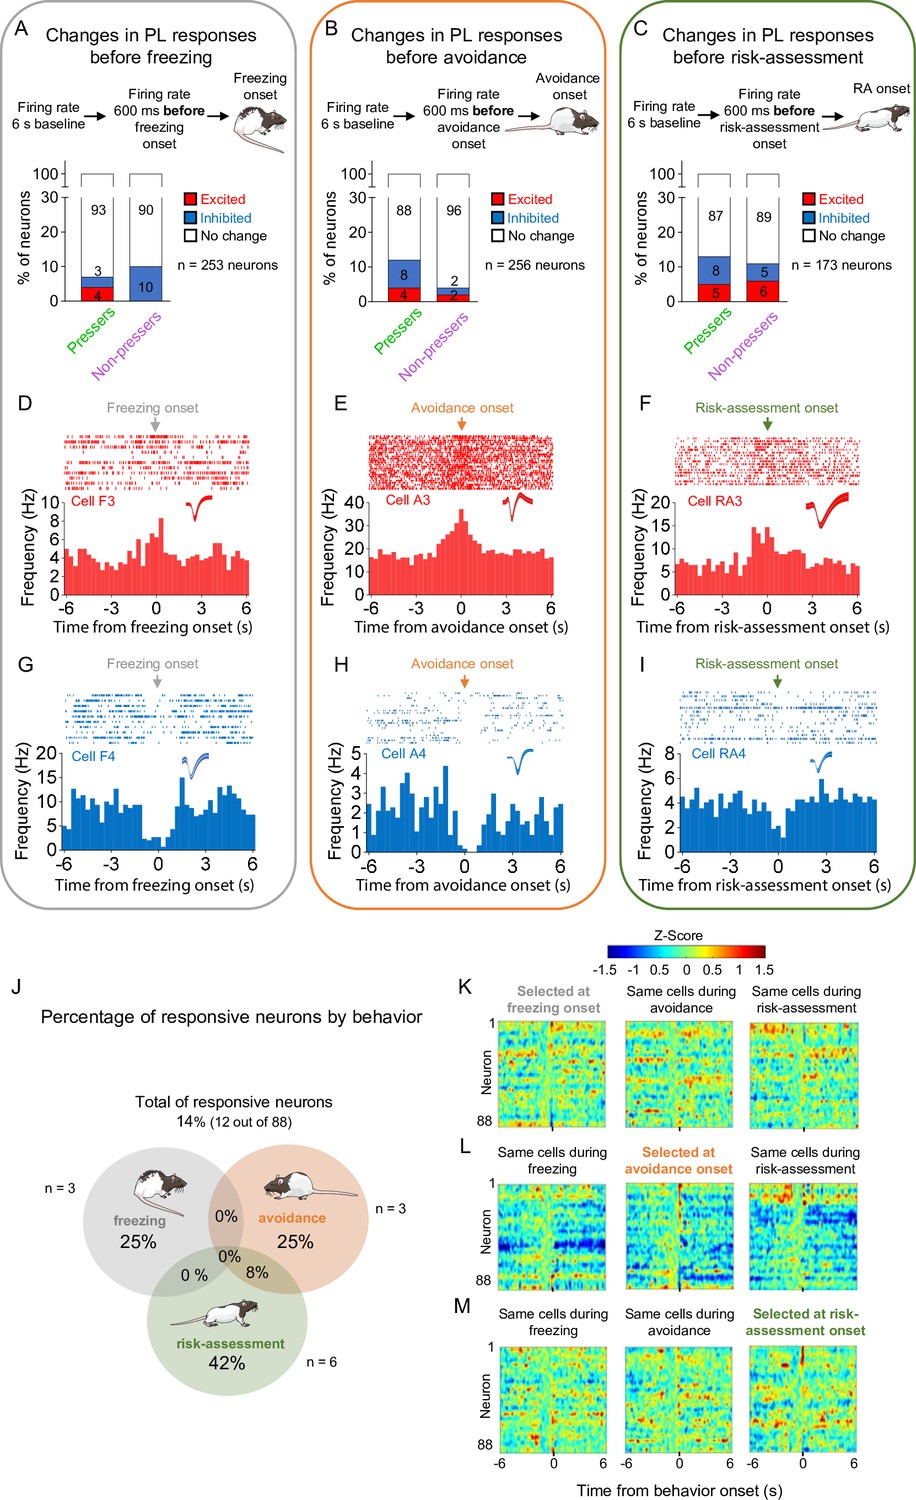
Prelimbic (PL) activity anticipates the onset of freezing, avoidance, or risk-assessment behaviors in both Pressers and Non-pressers.
Both Pressers and Non-pressers showed the same number and proportion of excitatory and inhibitory PL responses 600 ms before the onset of (A) freezing (Fisher Exact Test, p = 0.34), (B) avoidance (Fisher Exact Test, p = 0.1249), or (C) risk-assessment (RA, Fisher Exact Test, p = 0.8168) behaviors. Representative peristimulus time histograms (PSTHs for distinct PL neurons showing excitatory responses 600 ms before the onset of (D) freezing, (E) avoidance, or (F) risk-assessment behaviors). Representative PSTHs for distinct PL neurons showing inhibitory responses 600 ms before the onset of freezing (G), avoidance (H), or risk-assessment (I) behaviors. (J) Venn diagram showing the percentage of all PL responsive neurons (12 out of 88 neurons) by behavior. Most of the responsive neurons responded selectively at the onset of one of the behaviors. Heatmap of Z-scored neural activities for PL neurons selected at 600 ms before the onset of freezing (K), avoidance (L), or risk-assessment behavior (M) with the same cells tracked during the other behaviors. The threshold used to identify significant differences per neurons was Z-score >2.58 for excitation and Z-score <−1.96 for inhibition. Stack bar values were compared using Fisher Exact Test, n.s. = nonsignificant. All statistical analysis details are presented in Source data 1.
-
Figure 3—figure supplement 1—source data 1
Source data for Figure 3—figure supplement 1.
- https://cdn.elifesciences.org/articles/74950/elife-74950-fig3-figsupp1-data1-v2.xlsx
Figure 4

Pressers and Non-pressers show significant differences in prelimbic (PL) oscillations during the test session.
(A) Power spectral density (PSD) contribution at different frequency bands. Average of PSD (%) in the (B) delta (0–4 Hz) or (C) theta (4–10 Hz) bands in Pressers (green line, n = 25 rats) and Non-pressers (purple line, n = 7 rats) during the (left) reward, (center) odor, and (right) conflict phases of the test session. Pressers showed increased power in the delta band, whereas Non-pressers showed increased power in the theta band during the three phases of the test session (unpaired Student’s t-test comparing Pressers vs. Non-pressers, all p’s < 0.001). Representative time–frequency spectrogram showing changes in the log of PSD (dB) for delta and theta bands in (D) Pressers and (E) Non-pressers across the different phases of the session. All statistical analysis details are presented in Source data 1.
-
Figure 4—source data 1
Source data for Figure 4.
- https://cdn.elifesciences.org/articles/74950/elife-74950-fig4-data1-v2.xlsx
Figure 5 with 3 supplements

In pressers, PLGLUT neurons show reduced spontaneous activity during the conflict phase.
(A) Top, schematic of viral infusion. Bottom, representative immunohistochemical micrograph showing lack of colabeling (white arrows) between the ChR2 viral construct (green, AAV-CaMKII-ChR2-eYFP) and the GABA marker GAD67 (red), confirming that the use of a CaMKII promoter enables transgene expression favoring prelimbic (PL) glutamatergic neurons. Scale bars: 25 µm. (B–D) Photoidentification of PLGLUT neurons. (B) Frequency histogram showing the latency of response to laser illumination for PL neurons (n = 36 photoidentified PLGLUT neurons out of 104 recorded cells). Triangle method detection of cluster distribution revealed a separation of latency frequencies at 6ms (see details in Methods). (C) Cells with photoresponse latencies <6 ms (identified as the first bin with Z-score >3.29, p < 0.001, red dotted line) and high spike reliability during the 6 ms (Fano factor [FF] ratio >1 compared to prelaser baseline) were classified as PLGLUT neurons (see details in Methods). (D) Raster plot and peristimulus time histogram showing a representative PLGLUT neuron responding to a 5 Hz train of laser stimulation. (E) Top, schematic of viral infusion. Bottom, representative immunohistochemical micrograph showing colabeling (white arrows) between the ChR2 viral construct (red, AAV-mDlx-ChR2-mCherry) and the GABA marker GAD67 (green), confirming that the use of a mDlx promoter enables transgene expression favoring PLGABA neurons. Scale bars: 25 µm. (F–H) Photoidentification of PLGABA neurons. (F) Frequency histogram showing the latency of response to laser illumination for PL neurons (n = 69 photoidentified PLGABA neurons out of 338 recorded neurons). Triangle method detection of cluster distribution revealed a separation of latency frequencies at 6 ms (see details in Methods). (G) Cells with photoresponse latencies <6 ms (identified as the first bin with Z-score >3.29, p < 0.001, red dotted line) and high spike reliability during the 6 ms (FF, Fano factor ratio >1 compared to prelaser baseline) were classified as PLGABA neurons (see details in Methods). (H) Raster plot and peristimulus time histogram showing a representative PLGABA neuron responding to a 5 Hz train of laser stimulation. Vertical blue bars: laser onset. Bins of 1 ms. (I) Timeline of PL recordings for food-cue responses in Pressers during test (12 food cues per phase). Stacked bar showing the percentage of (J) PLGLUT neurons or (K) PLGABA neurons that changed their firing rates in response to food cues from the reward phase to the conflict phase. No significant differences were observed across the phases (Fisher Exact Test, all p’s > 0.05; n.s. = nonsignificant). (L) Timeline of PL recordings for spontaneous activity in Pressers during test. (M) Average firing rate of PLGLUT neurons across the different phases of test. (N) Venn diagram showing the percentage of responsive PLGLUT neurons (28 out of 36 neurons) by events. (O) Stacked bar showing the percentage of PLGLUT neurons that changed their spontaneous firing rates across the different phases of the test. PLGLUT neurons did not change their firing rates from the reward to the odor phase (Fisher Exact Test, inhibited in reward phase: 10 neurons, inhibited in odor phase: 3 neurons, p = 0.063), but were subsequently inhibited from the odor to the conflict phase (Fisher Exact Test, inhibited in odor phase: 3 neurons, inhibited in conflict phase: 14 neurons, p = 0.0046). (P) Average firing rate of PLGABA neurons across the different phases of test. (Q) Venn diagram showing the percentage of responsive PLGABA neurons (57 out of 69 neurons) by events. (R) Stacked bar showing the percentage of PLGABA neurons that changed their spontaneous firing rates across the different phases of the test. No significant differences were observed across the phases (Fisher Exact Test, all p’s > 0.05; n.s. = nonsignificant). All statistical analysis details are presented in Source data 1. See also Figure 5—figure supplements 1–3.
-
Figure 5—source data 1
Source data for Figure 5.
- https://cdn.elifesciences.org/articles/74950/elife-74950-fig5-data1-v2.xlsx
Figure 5—figure supplement 1
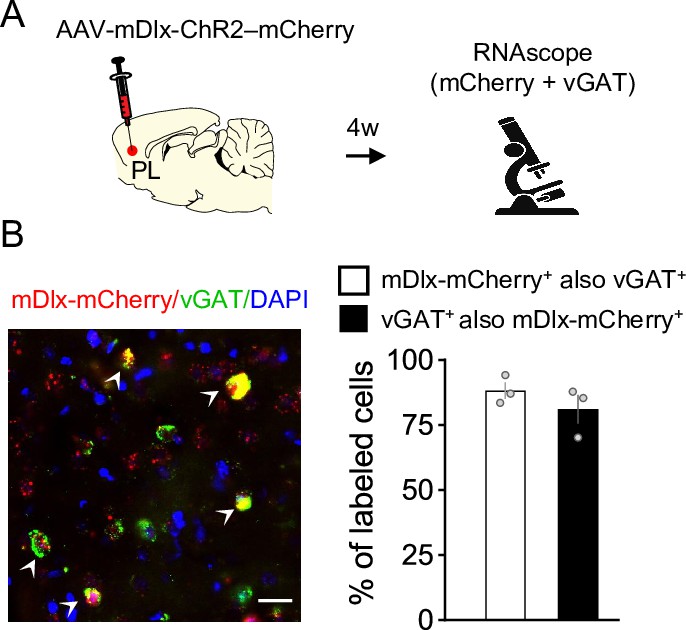
Validation of the mDlx promoter used for viral vector targeting of GABAergic neurons in prelimbic (PL).
(A) Schematic of AAV-mDlx-ChR2-mCherry infusion and fluorescent in situ hybridization in PL. (B, left) Representative micrograph of PL cells expressing mRNA for mCherry (red label), the GABAergic marker vGAT (green label), or both (white arrowheads). Blue label: DAPI. (B, right) Quantification of the total of cells expressing mDlx-mCherry that were also labeled with vGAT (white bar), or cells labeled with vGAT that also expressed mDlx-mCherry (black bar). n = 3 rats.
-
Figure 5—figure supplement 1—source data 1
Source data for Figure 5—figure supplement 1.
- https://cdn.elifesciences.org/articles/74950/elife-74950-fig5-figsupp1-data1-v2.xlsx
Figure 5—figure supplement 2
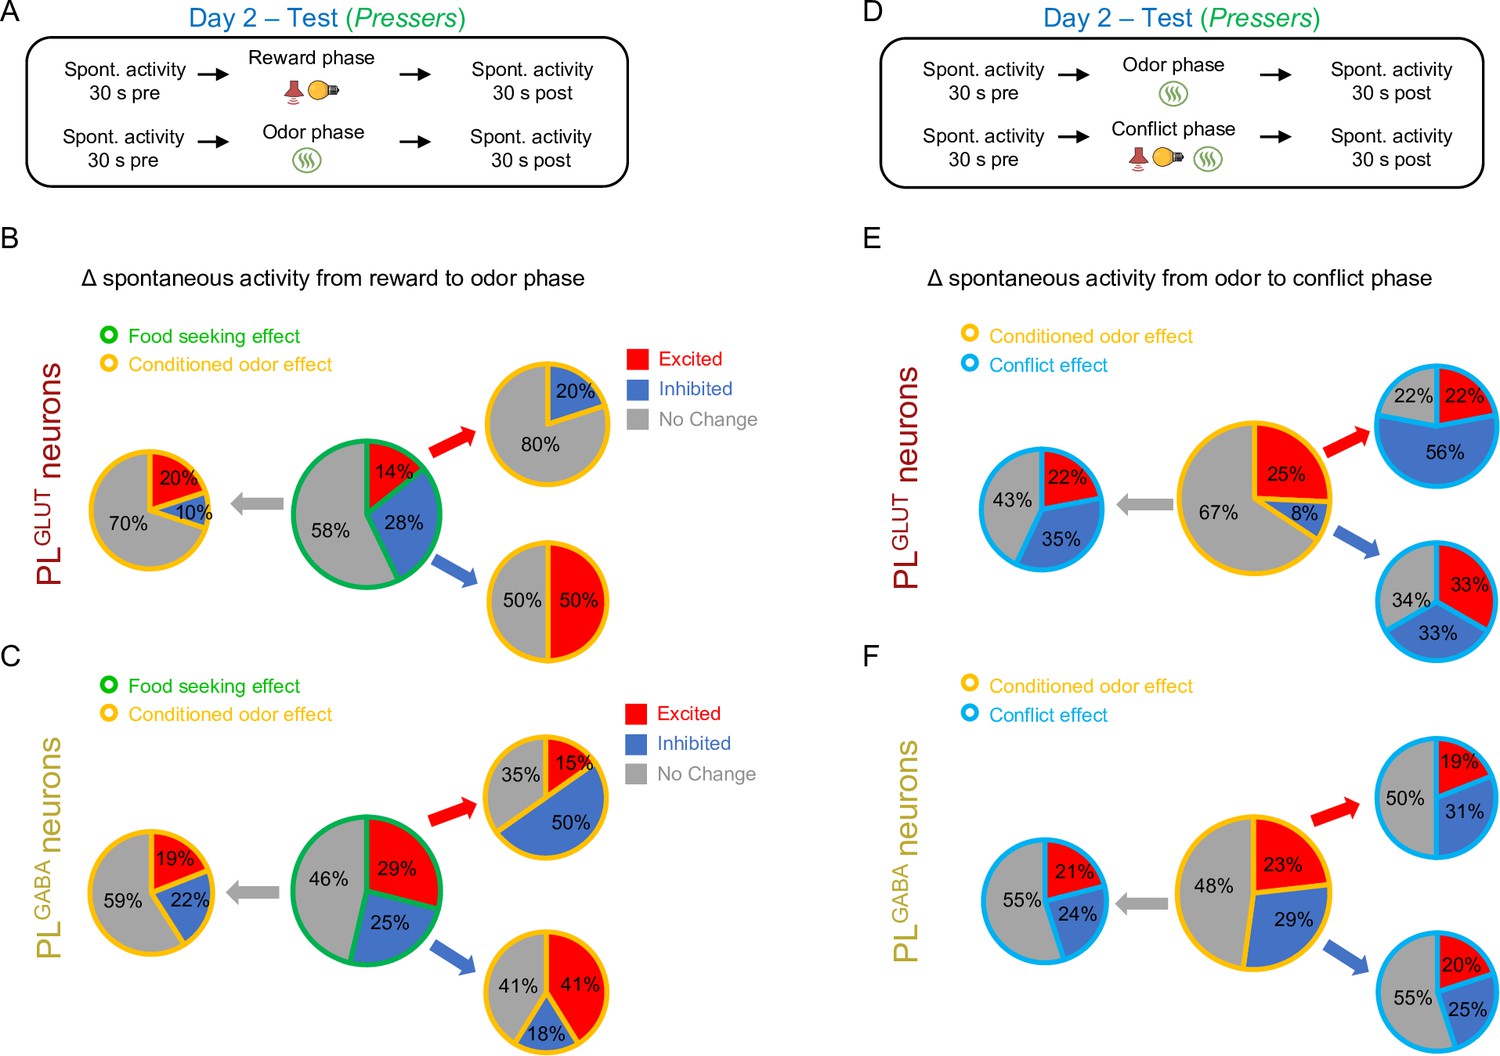
Changes in the spontaneous firing rate of PLGLUT and PLGABA neurons across the different phases of the test session.
(A) Timeline of prelimbic (PL) recordings for changes in spontaneous activity from reward to odor phase. Pie charts showing the proportion of (B) PLGLUT neurons (n = 36) and (C) PLGABA neurons (n = 69) that changed their spontaneous firing rates from baseline to reward phase (central pie charts, green borders) and from reward phase to odor phase (peripheral pie charts, yellow borders) in Pressers. All PLGLUT neurons that were excited or inhibited during the reward phase responded in opposite directions or did not respond during the odor phase. (D) Timeline of PL recordings for changes in spontaneous activity from odor to conflict phase. Pie charts showing the proportion of (E) PLGLUT neurons and (F) PLGABA neurons that changed their spontaneous firing rates from reward to odor phase (central pie charts, yellow borders) and from odor phase to conflict phase (peripheral pie charts, blue borders) in Pressers. For all the pie charts the activity of the same cells was tracked across the session.
-
Figure 5—figure supplement 2—source data 1
Source data for Figure 5—figure supplement 2.
- https://cdn.elifesciences.org/articles/74950/elife-74950-fig5-figsupp2-data1-v2.xlsx
Figure 5—figure supplement 3
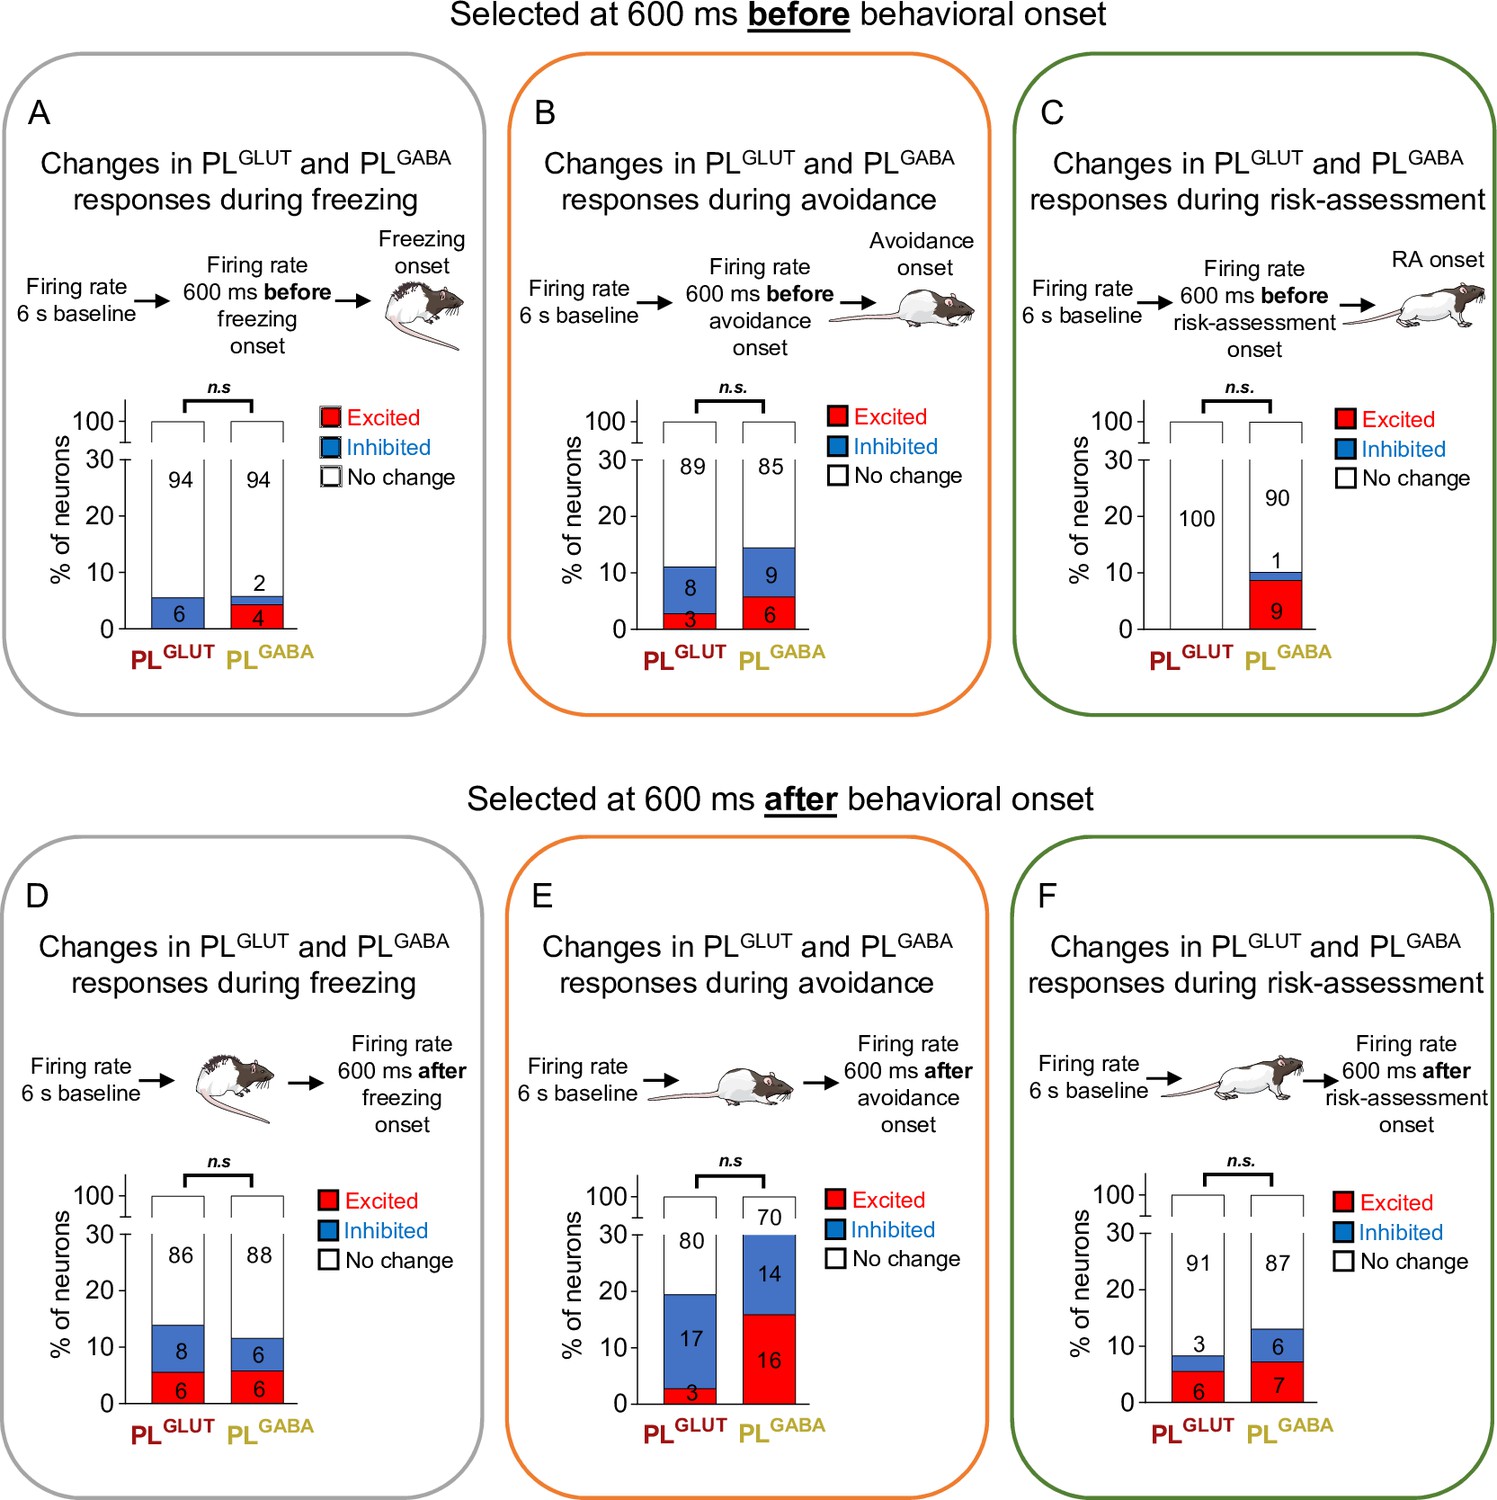
Changes in the firing rate of PLGLUT and PLGABA neurons before or after the onset of freezing, avoidance, or risk-assessment behaviors.
Both PLGLUT (n = 36) and PLGABA (n = 69) neurons showed the same number and proportion of excitatory and inhibitory responses when aligned at 600 ms before the onset of (A) freezing (Fisher Exact Test, excitatory responses p = 0.549; inhibitory p = 0.270), (B) avoidance (excitatory responses p = 0.6582; inhibitory p > 0.999), or (C) risk-assessment (excitatory responses p = 0.919; inhibitory p > 0.999) behaviors, as well as when aligned at 600 ms after the onset of (D) freezing (excitatory responses p > 0.999; inhibitory p = 0.688), (E) avoidance (excitatory responses p = 0.0544; inhibitory p = 0.768), or (F) risk-assessment (excitatory responses p = 0.741; inhibitory p = 0.490) behaviors. The threshold used to identify significant differences per neurons was Z-score >2.58 for excitation and Z-score <−1.96 for inhibition. Stack bar values were compared using Fisher Exact Test, n.s. = nonsignificant. All statistical analysis details are presented in Source data 1.
-
Figure 5—figure supplement 3—source data 1
Source data for Figure 5—figure supplement 3.
- https://cdn.elifesciences.org/articles/74950/elife-74950-fig5-figsupp3-data1-v2.xlsx
Figure 6
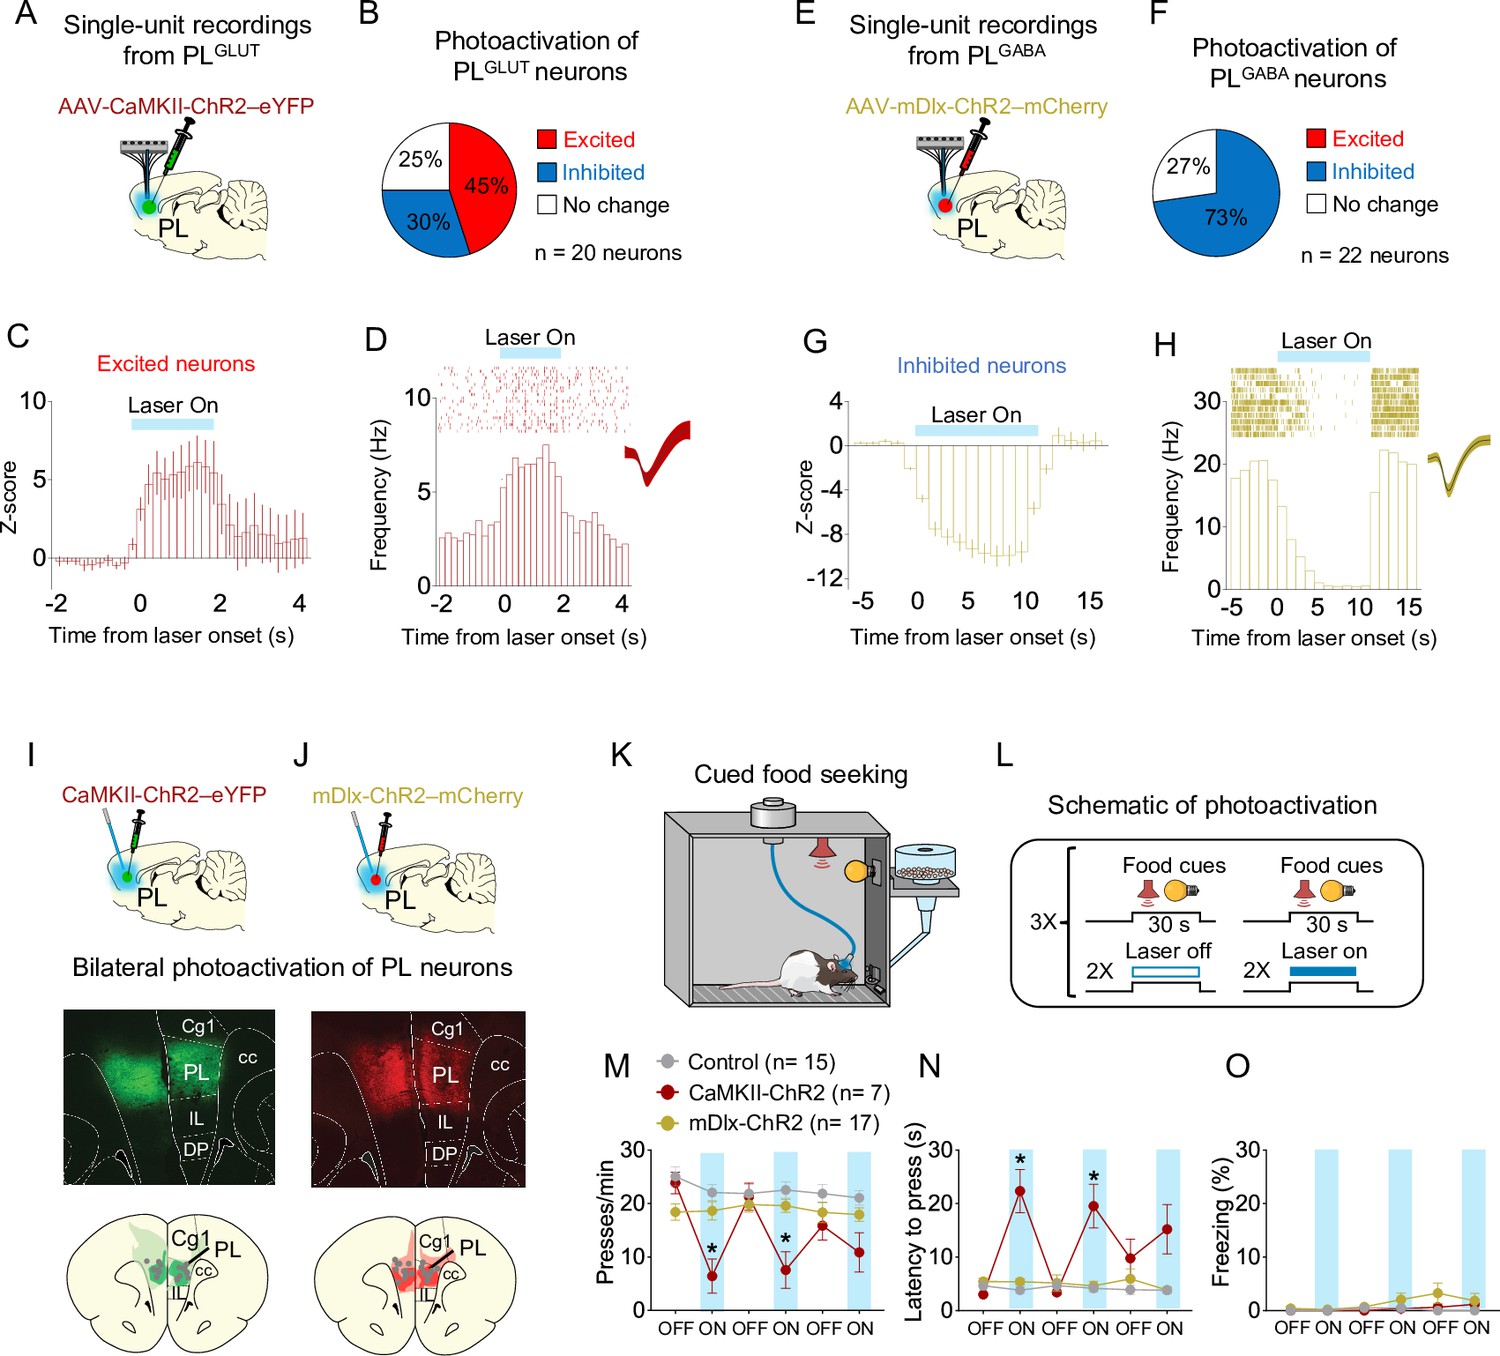
Photoactivation of PLGLUT, but not PLGABA, neurons suppresses reward seeking in a neutral context.
(A) Schematic of viral infusion and recordings in prelimbic (PL). (B) Changes in PL firing rate with illumination of PLGLUT neurons in rats expressing AAV-CaMKII-ChR2-eYFP in PL (n = 20 neurons). (C) Average peristimulus time histogram (PSTH) of PL neurons that were excited during laser illumination of PLGLUT neurons. (D) Raster plot and PSTH of representative PL neuron showing excitatory responses to illumination in rats expressing AAV-CaMKII-ChR2-eYFP in PL. (E) Schematic of viral infusion and recordings in PL. (F) Changes in PL firing rate with illumination of PLGABA neurons in rats expressing AAV-mDlx-ChR2-mCherry in PL (n = 22 neurons). (G) Average PSTH of PL neurons that were inhibited during laser illumination of PLGABA neurons. (H) Raster plot and PSTH of representative PL neuron showing inhibitory responses to illumination in rats expressing AAV-mDlx-ChR2-mCherry in PL. Representative micrograph showing the expression of (I) CaMKII-ChR2-eYFP or (J) mDlx-ChR2-mChery in PL and schematic of optical fiber location (gray dots) in the same region (compressed across different anteroposterior levels of PL). Green or red areas represent the minimum (dark) and the maximum (light) viral expression into the PL. (K, L) Schematic and timeline of PL photoactivation during the cued food-seeking test in a neutral context. Optogenetic activation of PLGLUT neurons (CaMKII-ChR2, dark red circles, n = 7), but not PLGABA neurons (mDlx-ChR2, gold circles, n = 17), reduced the (M) frequency of lever presses (F(10, 180) = 7.009, p < 0.001, Bonferroni post hoc, CaMKII-ChR2 vs. Control, all laser on periods – p < 0.01; mDlx-ChR2 vs. Control, all laser on periods – p > 0.05) and increased (N) the latency for the first press (F(10, 180) = 9.931, p < 0.001, CaMKII-ChR2 vs. Control, all laser on periods – Bonferroni post hoc, p < 0.001; mDlx-ChR2vs. Control, all laser on periods, p > 0.05). (O) Optogenetic activation of PL neurons did not alter freezing behavior (F(10, 180) = 1.124, p = 0.346). Blue shaded area represents laser-on trials (PLGLUT: 5 Hz, PLGABA: 20 Hz; 5 ms pulse width, 7–10 mW, 30-s duration). Data shown as mean ± standard error of the mean (SEM). Each circle represents the average of two consecutive trials. Two-way repeated measures analysis of variance (ANOVA) followed by Bonferroni post hoc test. All *p’s < 0.05. All statistical analysis details are presented in Source data 1.
-
Figure 6—source data 1
Source data for Figure 6.
- https://cdn.elifesciences.org/articles/74950/elife-74950-fig6-data1-v2.xlsx
Figure 7 with 2 supplements
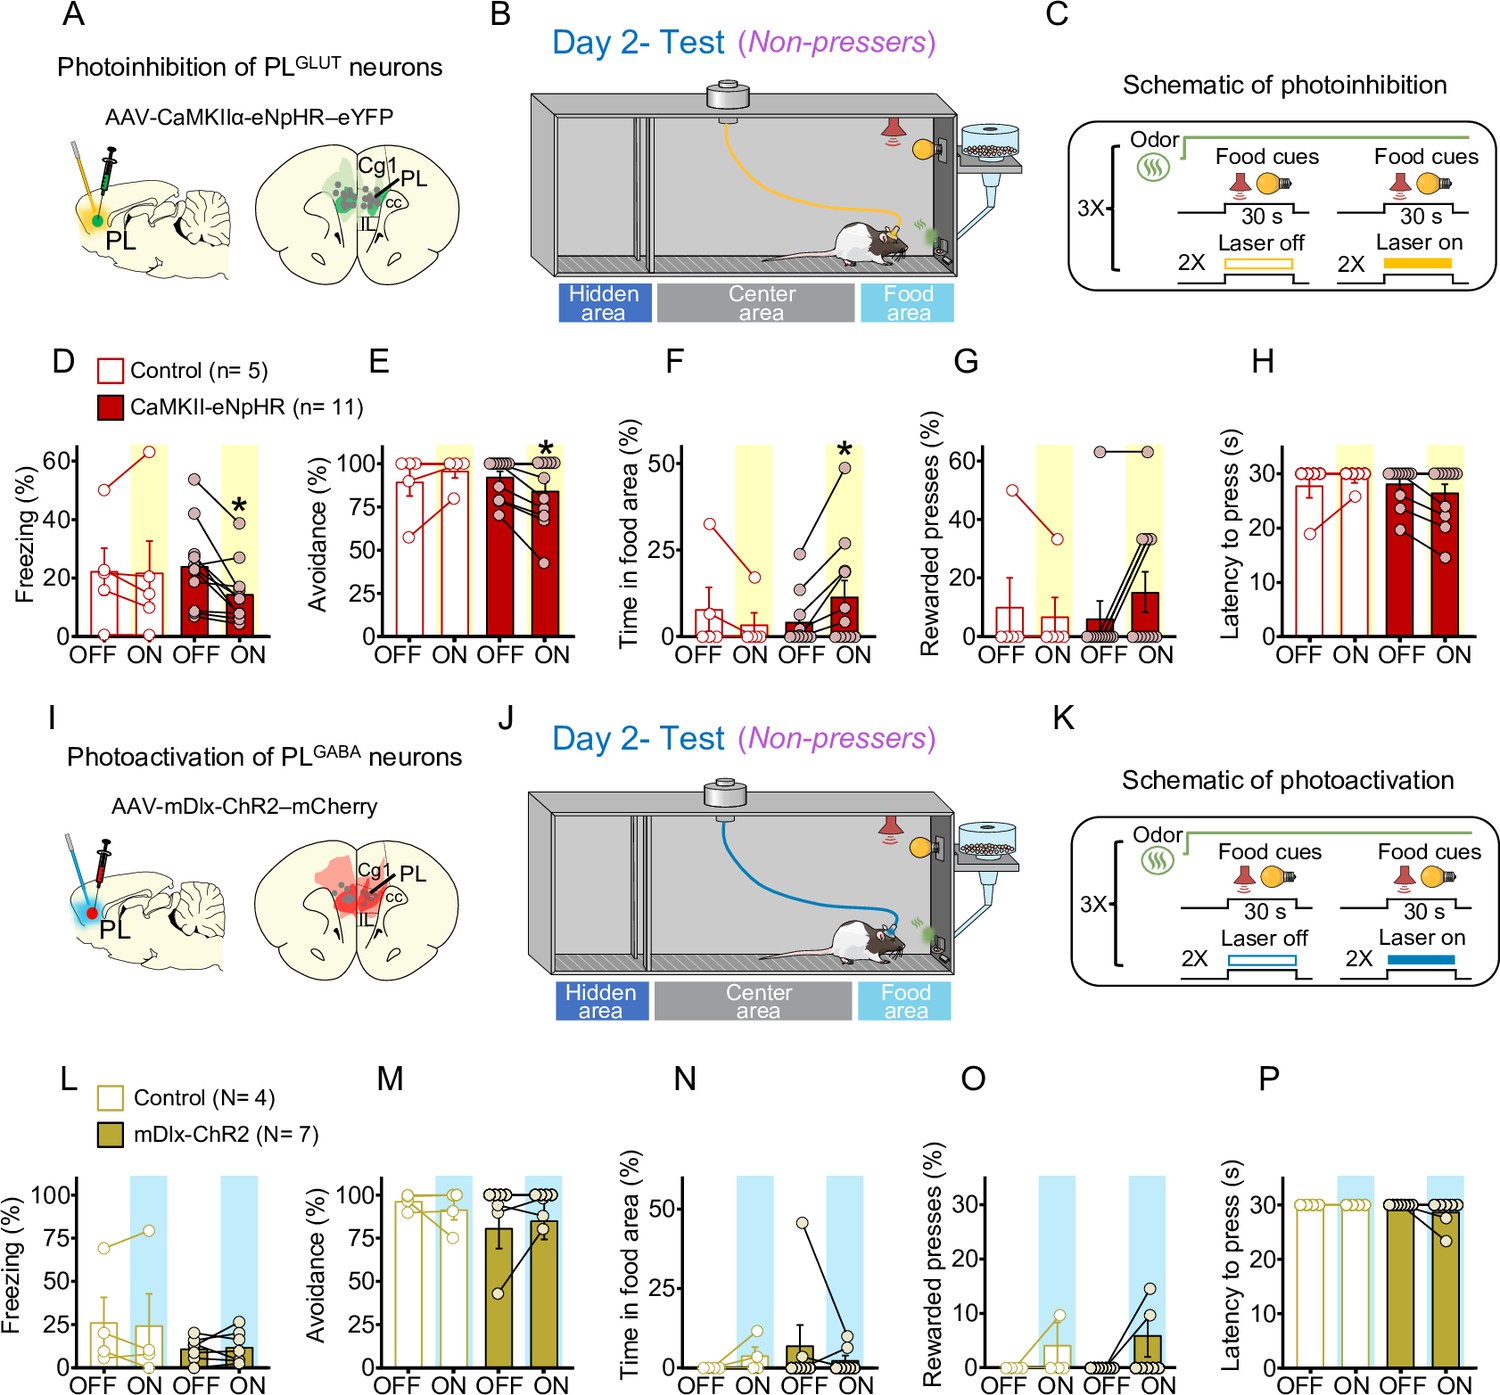
Photoinhibition of PLGLUT neurons during conflict reduces freezing and increases food approaching in Non-pressers.
(A) Schematic of AAV-CaMKII-eNpHR-eYFP virus infusion in prelimbic (PL) and location of optical fibers (gray dots) in the same region (compressed across different anteroposterior levels of PL). Green areas represent the minimum (dark) and the maximum (light) viral expression into the PL. (B, C) Schematic and timeline of the approach–avoidance conflict test during optogenetic inhibition of PLGLUT neurons. Photoinhibition of PLGLUT neurons (CaMKII-eNpHR, red bars, n = 11) during the conflict test reduced the percentage of time rats spent (D) freezing (Wilcoxon test, W = −64, laser off vs. laser on, p = 0.0020, Mann–Whitney test, U = 18 Control vs. CaMKII-eNpHR, p = 0.319) and (E) avoiding the odor area (Wilcoxon test, W = −21, laser off vs. laser on, p = 0.031; Mann–Whitney test, U = 19.5 Control vs. CaMKII-eNpHR, p = 0.365), and increased the percentage of time rats spent in the (F) food area (Wilcoxon test, W = 21, laser off vs. laser on, p = 0.031; Mann–Whitney test, U = 17 Control vs. CaMKII-eNpHR, p = 0.221) during the conflict test without altering (G) the number of lever presses (Wilcoxon test, W = 6, laser off vs. laser on, p = 0.250; Mann–Whitney test, U = 22.5 Control vs. CaMKII-eNpHR, p = 0.697) and (H) the latency to press (Wilcoxon test, W = −10, laser off vs. laser on, p = 0.125; Mann–Whitney test, U = 21 Control vs. CaMKII-eNpHR, p = 0.357). Laser stimulation did not alter behaviors in controls (eYFP-control virus, white bars, n = 5, Wilcoxon test, freezing: W = 3, p = 0.812, avoidance: W = 3, p = 0.500, food area: W = −3, p = 0.500, lever presses: W = −1, p = 0.999, latency to press: W = 1, p = 0.999). For all Shapiro–Wilk normality test, p < 0.05. (I) Schematic of AAV-mDlx-ChR-mCherry virus infusion in PL and location of optical fibers (gray dots) in the same region (compressed across different anteroposterior levels of PL). Red areas represent the minimum (dark) and the maximum (light) viral expression into the PL (J, K) Schematic and timeline of the approach–avoidance conflict test during optogenetic activation of PLGABA neurons. (L–P) Photoactivation of PLGABA neurons during the conflict test did not alter rats’ behavior in the mDlx-ChR2 group (gold bars, n = 7) or in the control group (eYFP-control virus, white bars, n = 4, Wilcoxon and Mann–Whitney tests, all p’s > 0.05). For all Shapiro–Wilk normality test, p < 0.05. PL neurons were illuminated from cue onset until the animals pressed the lever or from cue onset until the end of the 30 s cues if the animals did not press the lever (PLGLUT: 5 Hz, PLGABA: 20 Hz; 5 ms pulse width,7–10 mW). Data shown as mean ± standard error of the mean (SEM). Each bar represents the average of six trials alternated in blocks of 2. All *p’s < 0.05. All statistical analysis details are presented in Source data 1. See also Figure 7—figure supplements 1 and 2.
-
Figure 7—source data 1
Source data for Figure 7.
- https://cdn.elifesciences.org/articles/74950/elife-74950-fig7-data1-v2.xlsx
Figure 7—figure supplement 1
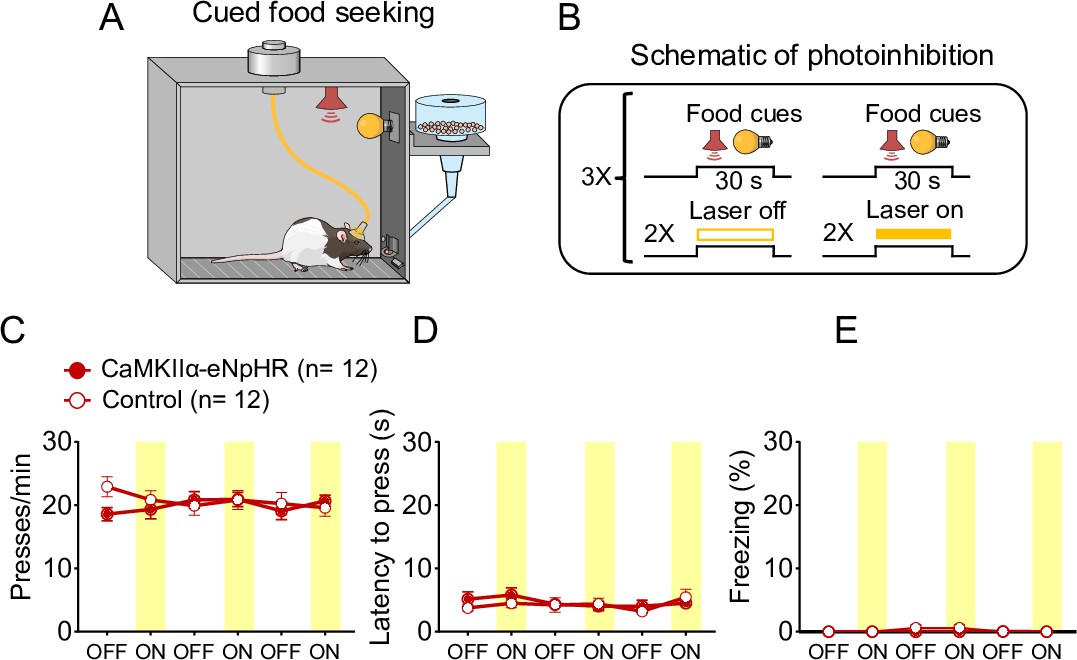
Photoinhibition of PLGLUT neurons did not affect cued food-seeking responses in a neutral context.
(A, B) Schematic and timeline of prelimbic (PL) photoinhibition during the cued food-seeking test in a neutral context. Optogenetic inhibition of PLGLUT neurons (CaMKII-ChR2, dark red circles, n = 12) had no effect on (C) frequency of lever presses (F(5,110) = 1.336, p = 0.254), (D) latency for the first press (F(5,110) = 0.637, p = 0.671), or (E) freezing responses (F(5,95) = 1.395, p = 0.231), when compared to the control group (eYFP-control virus, white circles, n = 12). Yellow laser illumination (7–10 mW) was delivered for 30 s at cue onset. Data shown as mean ± standard error of the mean (SEM). Each circle represents the average of two consecutive trials. Two-way repeated measures analysis of variance (ANOVA) followed by Bonferroni post hoc test. All statistical analysis details are presented in Source data 1.
-
Figure 7—figure supplement 1—source data 1
Source data for Figure 7—figure supplement 1.
- https://cdn.elifesciences.org/articles/74950/elife-74950-fig7-figsupp1-data1-v2.xlsx
Figure 7—figure supplement 2
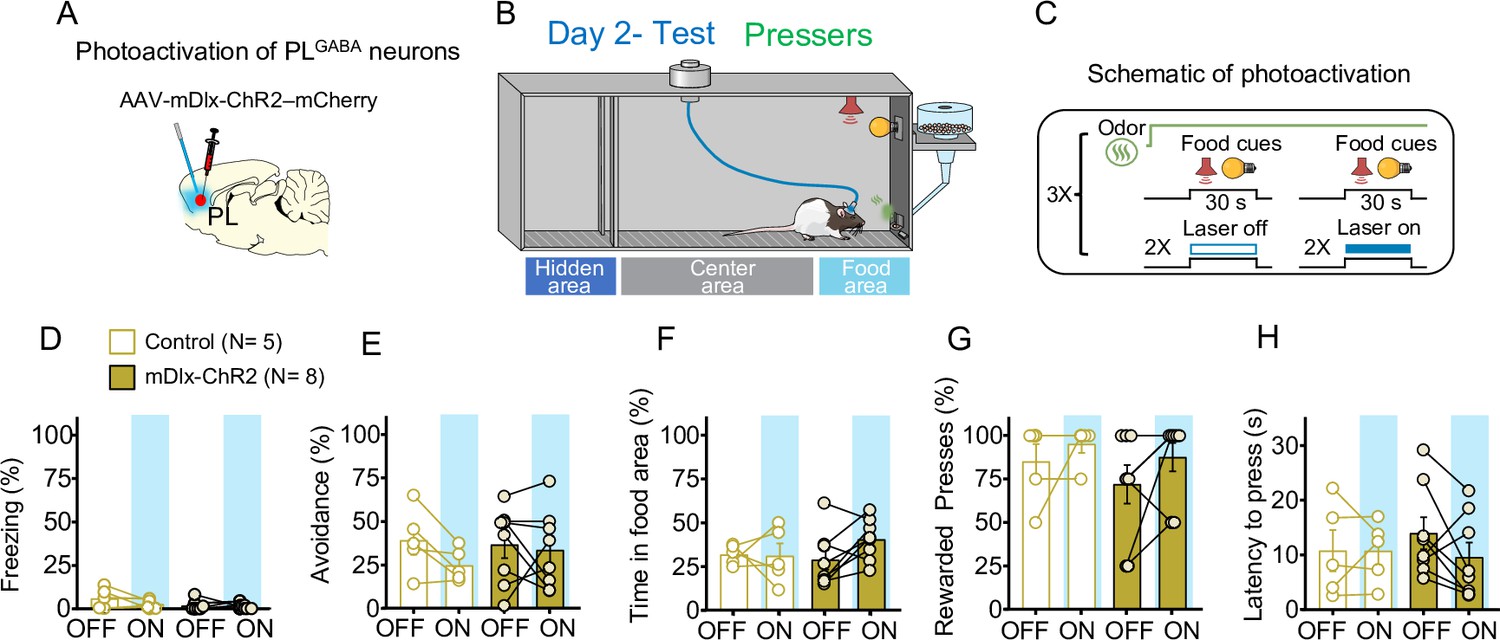
Photoinhibition of PLGABA neurons in Pressers does not alter defensive responses and food seeking during conflict.
(A) Schematic of AAV-mDlx-ChR2-mCherry virus infusion in prelimbic (PL). (B, C) Schematic and timeline of the approach–avoidance conflict test during optogenetic activation of PLGABA neurons. (D–H) Photoactivation of PLGABA neurons during the conflict test did not alter rats’ behavior (mDlx-ChR2, gold bars, n = 8, Control, white bars, n = 5; repeated measures analysis of variance (ANOVA), freezing: F(1, 11) = 2.186, p = 0.167; avoidance: F(1, 11) = 0.9568, p = 0.349; time in food area: F(1, 11) = 1.798, p = 0.207; rewarded presses: Shapiro–Wilk normality test, p < 0.05, Wilcoxon test, off vs. on – W = 19, p = 0.312, Mann–Whitney, mDlx-ChR2 vs. control – U = 18, p = 0.673; latency to press: F(1, 11) = 1.038, p = 0.330). PL neurons were illuminated from cue onset until the animals pressed the lever or from cue onset until the end of the 30 s cues if the animals didn’t press the lever (PLGABA: 20 Hz; 5 ms pulse width, 7–10 mW). Data shown as mean ± standard error of the mean (SEM). Each bar represents the average of six trials alternated in blocks of 2. All statistical analysis details are presented in Source data 1.
-
Figure 7—figure supplement 2—source data 1
Source data for Figure 7—figure supplement 2.
- https://cdn.elifesciences.org/articles/74950/elife-74950-fig7-figsupp2-data1-v2.xlsx
Figure 8
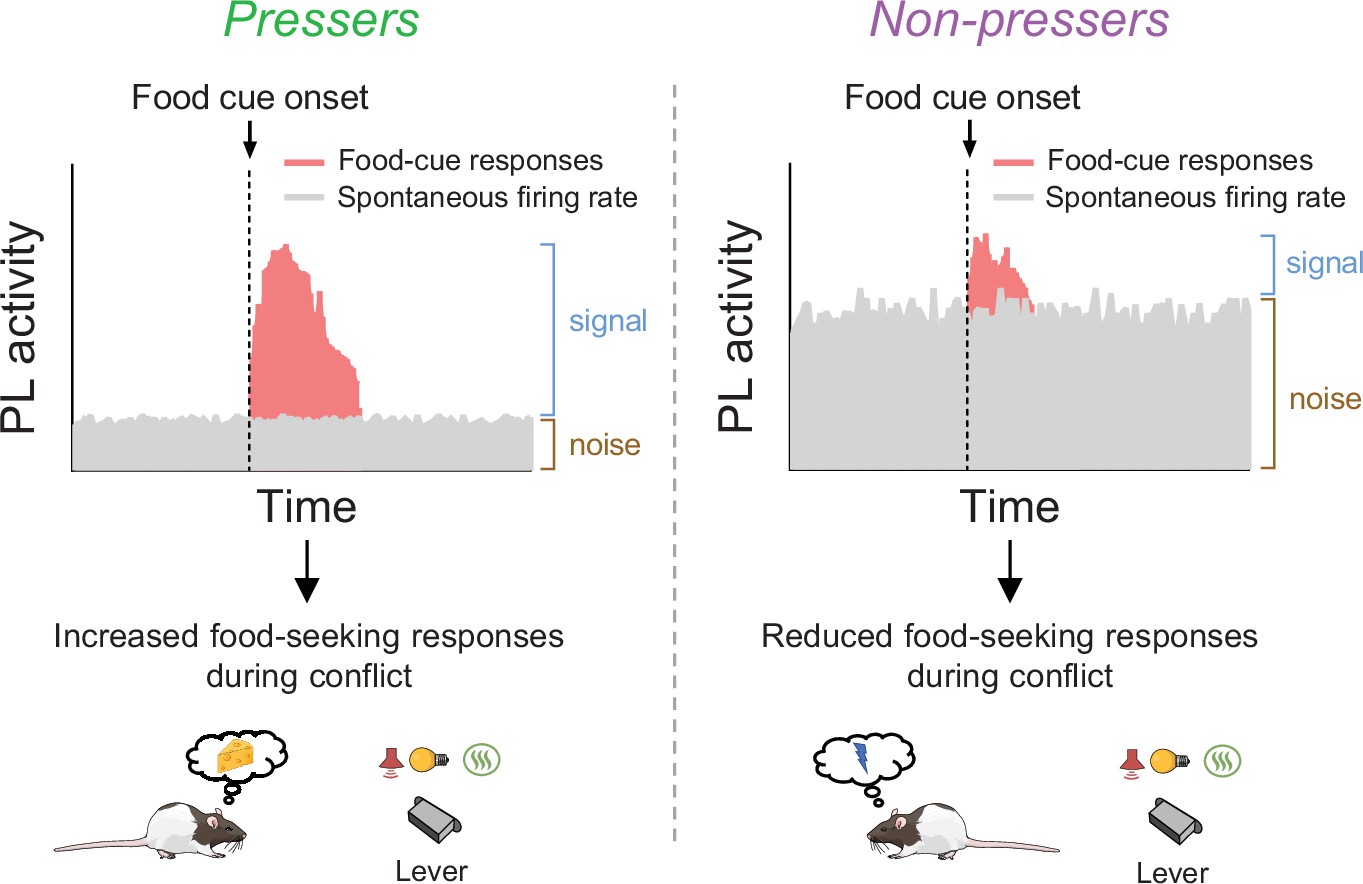
Schematic showing differences in food-cue responses and spontaneous firing rate of prelimbic (PL neurons in Pressers and Non-pressers).
Left, Pressers showed reduced spontaneous firing rate and increased food-cue responses in PL neurons during the conflict test, which may have resulted in higher signal-to-noise ratio and increased food-seeking responses. Right, Non-pressers showed increased spontaneous firing rate and reduced food-cue responses in PL neurons during the conflict test, which may have resulted in lower signal-to-noise ratio and reduced food-seeking responses.
Author response image 1
Author response image 2
Author response image 3

Author response image 4
Author response image 5
Videos
Video 1
Presser vs. Non-presser animals during approach–avoidance conflict task.
Representative video comparing the different behavioral strategies during the conflict phase. Animals’ body were label using DeepLabCut software and dots were used to track the animal position, freezing, and risk assessment.
Tables
Key resources table
| Reagent type (species) or resource | Designation | Source or reference | Identifiers | Additional information |
|---|---|---|---|---|
| Strain, strain background (rat, male) | Rattus norvegicus | Charles River | Strain code: 006 | Male Long–Evans hooded |
| Recombinant DNA reagent | AAV-CaMKIIα-eNpHR-eYFP | University of North Carolina Viral Vector Core | AAV Stock Vector Karl Deisseroth | 3rd Gen Opto Inhibition: eNpHR 3.0 |
| Recombinant DNA reagent | AAV-CaMKIIα-hChR2(H134R)-eYFP | University of North Carolina Viral Vector Core | AAV Stock Vector Karl Deisseroth | Opto Excitation: ChR2 |
| Recombinant DNA reagent | AAV-CaMKIIα-eYFP | University of North Carolina Viral Vector Core | AAV Stock Vector Karl Deisseroth | Control Fluorophores |
| Recombinant DNA reagent | pAAV-mDlx-ChR2-mCherry-Fishell-3 | Addgene and University of North Carolina Viral Vector Core | Addgene plasmid #83,898 | Packaged by UNC vector core (Serotype 5) |
| Antibody | Anti-GAD67 raised in mouse polyclonal | Millipore-Sigma | Cat No. MAB5406B | 1:400 |
| Antibody | Goat Anti-Mouse IgG H&L (Alexa Fluor 488) polyclonal | Abcam | Cat No. ab150113 | 1:200 |
| Antibody | Goat Anti-Mouse IgG H&L (Alexa Fluor 594) polyclonal | Abcam | Cat No. ab150116 | 1:200 |
| Other | Opal 520 | Akoya Biosciences | Cat No. FP1487001KT | 1:1000 Fluorescent dye |
| Other | Opal 620 | Akoya Biosciences | Cat No. FP1495001KT | 1:1000 Fluorescent dye |
| Sequence-based reagent | RNA scope probe mCherry | Advanced Cell Diagnostics | Cat No. 431201-C3 | |
| Sequence-based reagent | RNA scope probe vGAT | Advanced Cell Diagnostics | Cat No. 424,541 | |
| Commercial Assay or Kit | RNA scope Multiplex Fluorescent Detection Kit v2 | Advanced Cell Diagnostics | Cat No. 323,110 | |
| Chemical compound, drug | VECTASHIELD Antifade Mounting Medium with DAPI | Vectorlabs | Cat No. H-1200–10 | |
| Software, algorithm | Matlab | Mathworks | RRID:SCR_001622 | https://it.mathworks.com/products/matlab.html |
| Software, algorithm | NeuroExplorer | Plexon | RRID:SCR_001818 | https://plexon.com/products/neuroexplorer/ |
| Software, algorithm | Offline Sorter | Plexon | RRID:SCR_000012 | https://plexon.com/products/offline-sorter/ |
| Software, algorithm | CinePlex Behavioral Research System | Plexon | https://plexon.com/plexon-systems/cineplex-behavioral-research-system/ | |
| Software, algorithm | GraphPad Prism | GraphPad | RRID:SCR_002798 | https://www.graphpad.com/scientific-software/prism/ |
Additional files
-
Transparent reporting form
- https://cdn.elifesciences.org/articles/74950/elife-74950-transrepform1-v2.pdf
-
Source data 1
Statistical Analyses Table 1.
- https://cdn.elifesciences.org/articles/74950/elife-74950-data1-v2.xlsx
Download links
A two-part list of links to download the article, or parts of the article, in various formats.
Downloads (link to download the article as PDF)
Open citations (links to open the citations from this article in various online reference manager services)
Cite this article (links to download the citations from this article in formats compatible with various reference manager tools)
Neural correlates and determinants of approach–avoidance conflict in the prelimbic prefrontal cortex
eLife 10:e74950.
https://doi.org/10.7554/eLife.74950


