Enteroendocrine cell types that drive food reward and aversion
- Department of Physiology, University of California, San Francisco, United States
- Kavli Institute for Fundamental Neuroscience, University of California, San Francisco, United States
- Howard Hughes Medical Institute, University of California, San Francisco, United States
- Neuroscience Graduate Program, University of California, San Francisco, United States
Figures
Figure 1 with 1 supplement
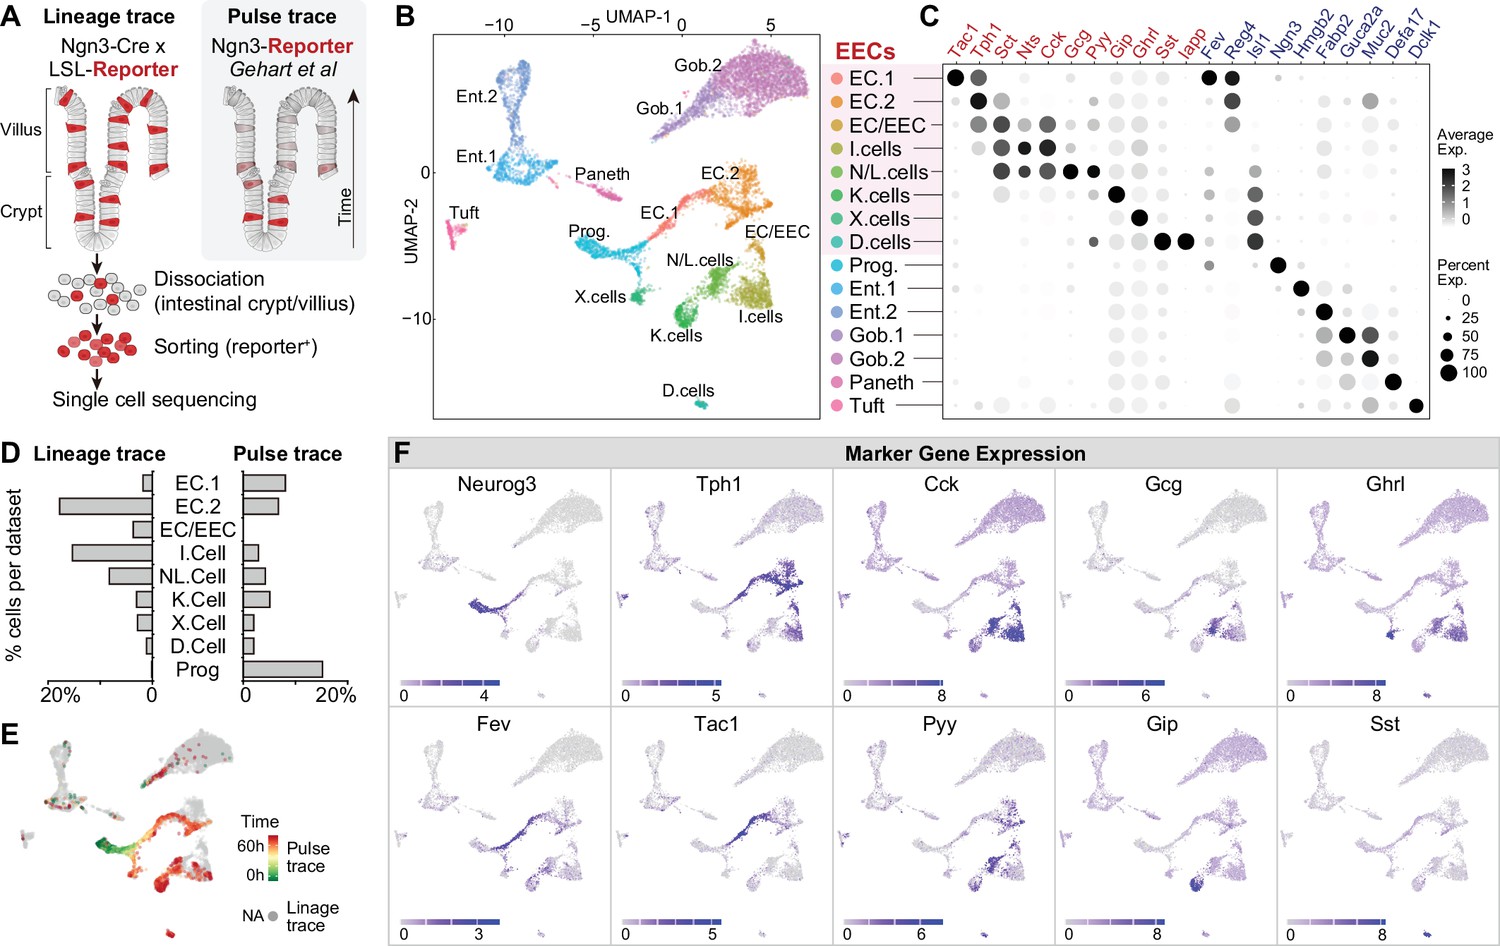
Molecular diversity of intestinal EECs.
(A) Overview of strategies to enrich EECs for the scRNA-Seq. Lineage-trace or pulse-trace strategies permanently or transiently label EECs that are derived from Neurog3 + progenitors. (B) Uniform manifold approximation and projection (UMAP) plots indicating cell subtype diversity across 9338 intestinal epithelium cells. This includes eight clusters of EEC subtypes (3412 cells, with 2168 lineage-traced cells and 1244 pulse-traced cells), progenitors, enterocytes, goblet cells, tuft cells, and Paneth cells. (C) Dot plot of expression of gut hormones (red) and cell type marker genes (blue) across different cell types in the intestinal epithelium. (D) The percentage of cells in each data set (lineage-trace and pulse-trace) that correspond to each EEC subtype. The lineage-trace strategy has comparatively fewer early stage cells (progenitors), whereas pulse-trace strategy did not label the EC-EEC cluster. (E) Differentiation time (from pulse-trace dataset) color-coded onto the UMAP map. (F) Expression of EEC cluster marker genes. UMAP plots show cells colored by gene expression using ln(TPM + 1), TPM: transcripts per million. See also Figure 1—figure supplement 1 and Figure 1—source data 1.
-
Figure 1—source data 1
Raw data for Figure 1d.
- https://cdn.elifesciences.org/articles/74964/elife-74964-fig1-data1-v2.xlsx
Figure 1—figure supplement 1
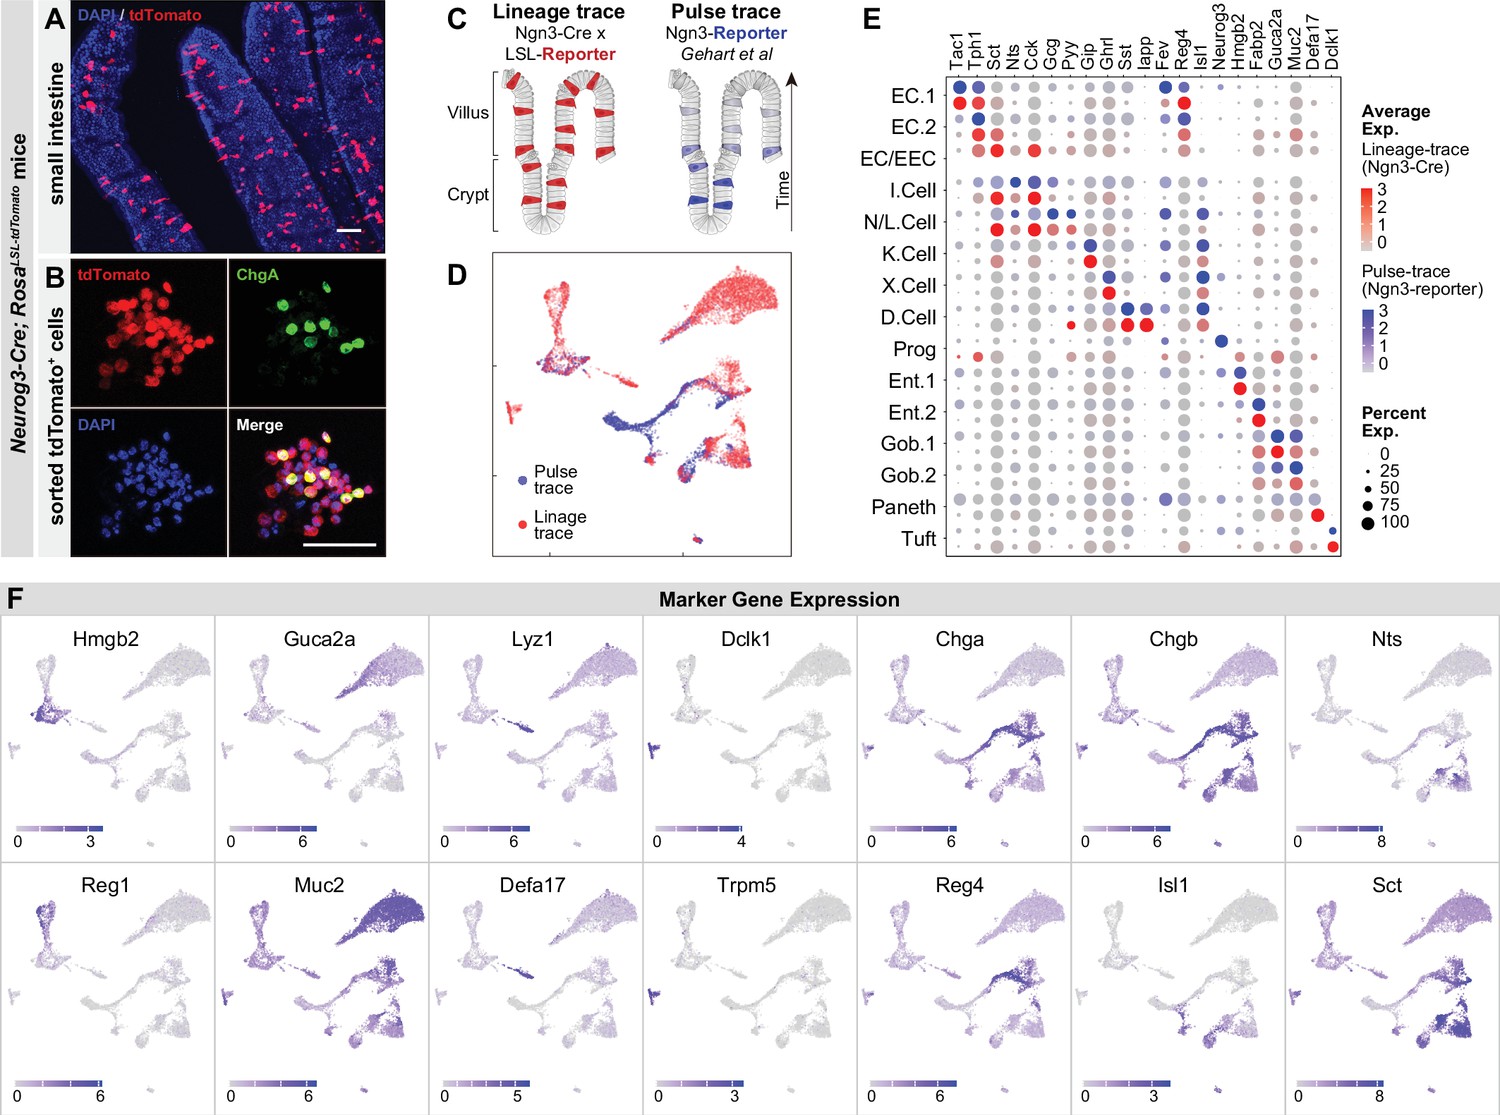
Molecular diversity of intestinal EECs.
(A–B) Using Neurog3-Cre; R26LSL-tdTomato mice, the expression of tdTomato permanently labels EECs across villi of small intestine (A) and after fluorescence-activated cell sorting (B). (C–D) Comparison of EECs enriched with the strategy of lineage-trace versus pulse-trace. UMAP plots shows cells colored by the origin of datasets (D). (E) Dot plot demonstrating that the expression of gut hormones and cell type marker genes are conserved across lineage-trace dataset (red) versus pulse-trace dataset (blue). (F) Expression of marker genes of enterocytes, goblet cells, Paneth cells, tuft cells, and EECs. UMAP plots show cells colored by gene expression using ln(TPM + 1). Scale bar: 50 μm.
Figure 2 with 2 supplements
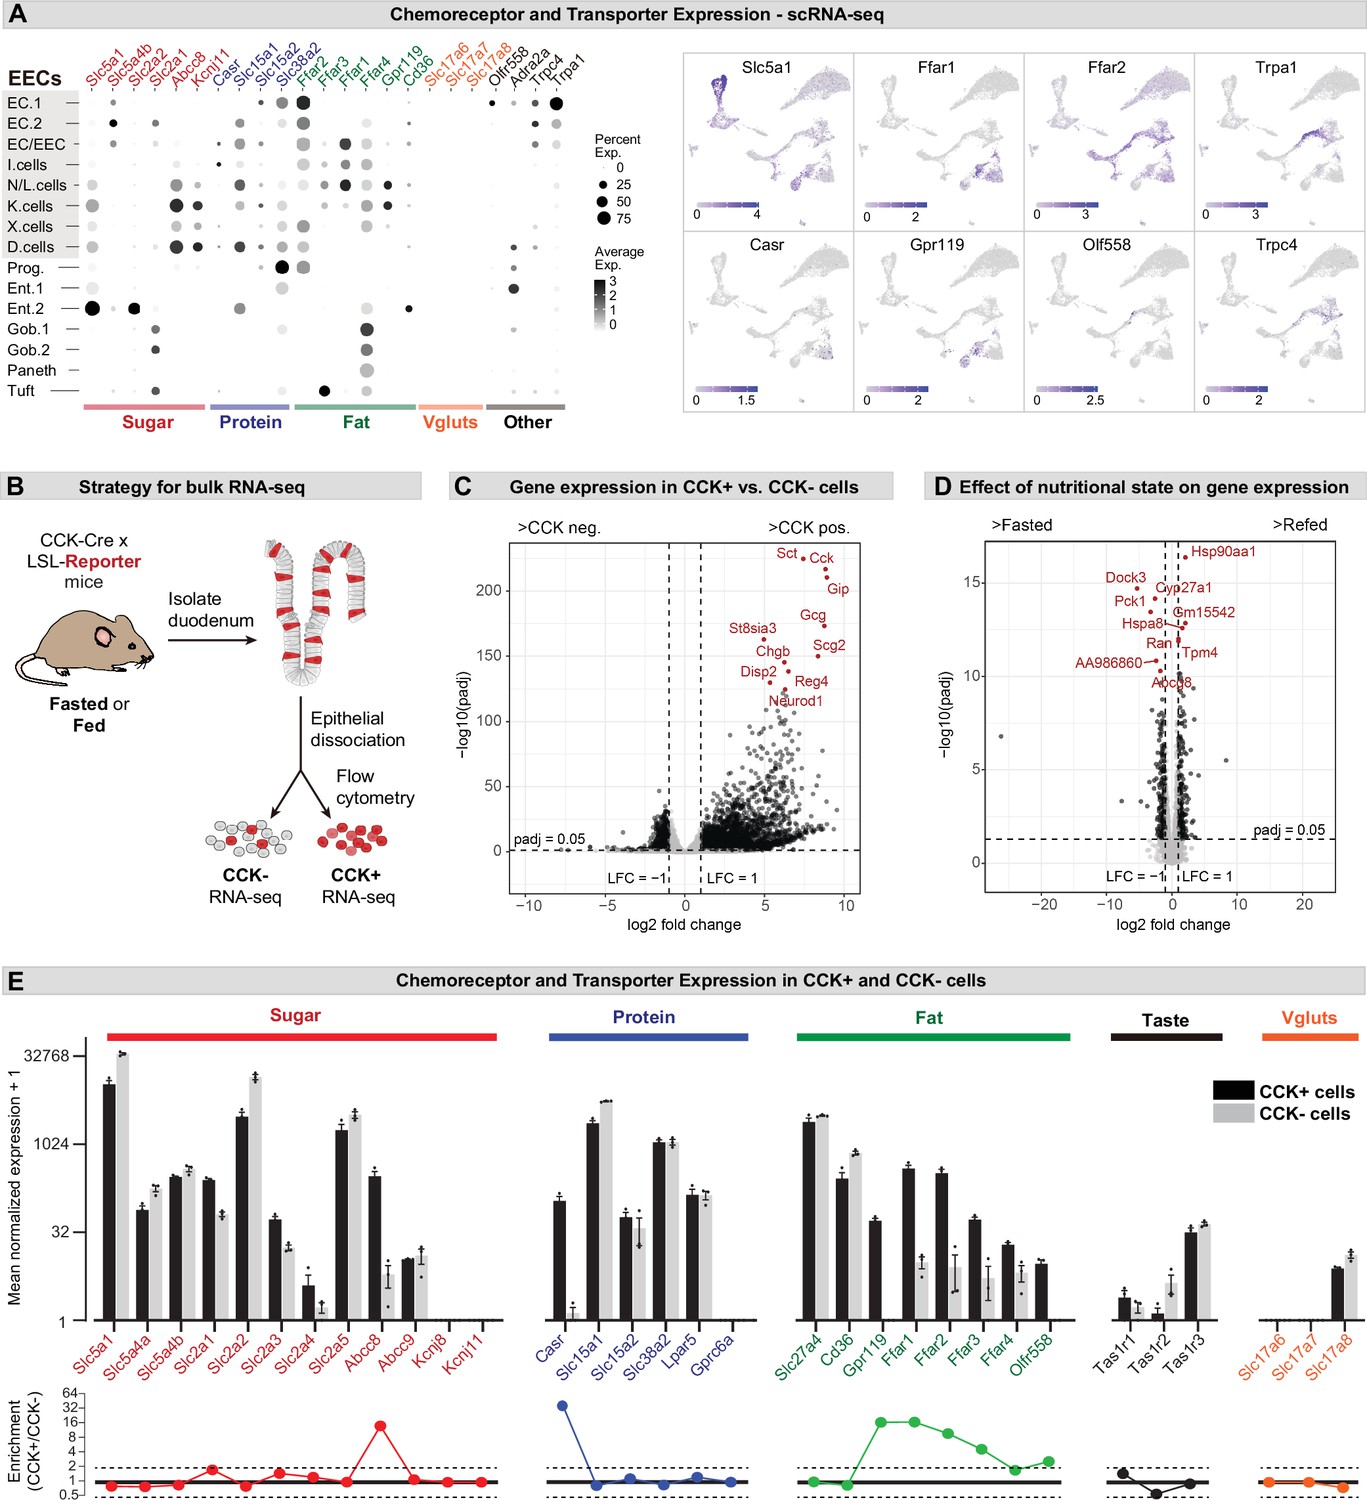
Expression of chemoreceptors and transporters in EECs.
(A) Expression of genes involved in the detection or absorption of nutrients and other chemical signals, as detected in scRNA-Seq experiments described in Figure 1. Left: dot plot shows gene expression across clusters. Right: UMAP plots show cells colored by gene expression using ln(TPM + 1). (B) Strategy for isolation of cells from duodenal epithelium labeled by CCKCre (tdTomato+) or not (tdTomato-) for pooled RNA-Seq. (C) Volcano plot showing the log2 fold change (LFC) and adjusted p-values (padj) of differentially expressed genes between CCK+ (tdTomato+) and CCK- (tdTomato-) cells. Top 10 most significant genes are highlighted in red and include many EEC markers. (D) Volcano plot showing the log2 fold change (LFC) and adjusted p-values (padj) of differentially expressed genes between refed and fasted conditions in CCK+ cells. Top 10 most significant genes are highlighted in red. Few genes involved in nutrient transport or sensing were identified as highly modulated by fasting. (E) Normalized for genes involved the detection or transport of sugar, protein and fat, as well as taste receptor genes and glutamate transporters. Note the log2 scale of the y-axis. Expression in CCK+ cells (tdTomato+) and CCK- cells (tdTomato-) from fed mice shown in black and gray. Bottom: Ratio of expression of each gene in CCK+ and CCK- cells. Values greater than 1 indicate enrichment in CCK+ cells. Values reported as mean ± SEM. See also Figure 2—figure supplement 1 and Figure 2—figure supplement 2.
Figure 2—figure supplement 1
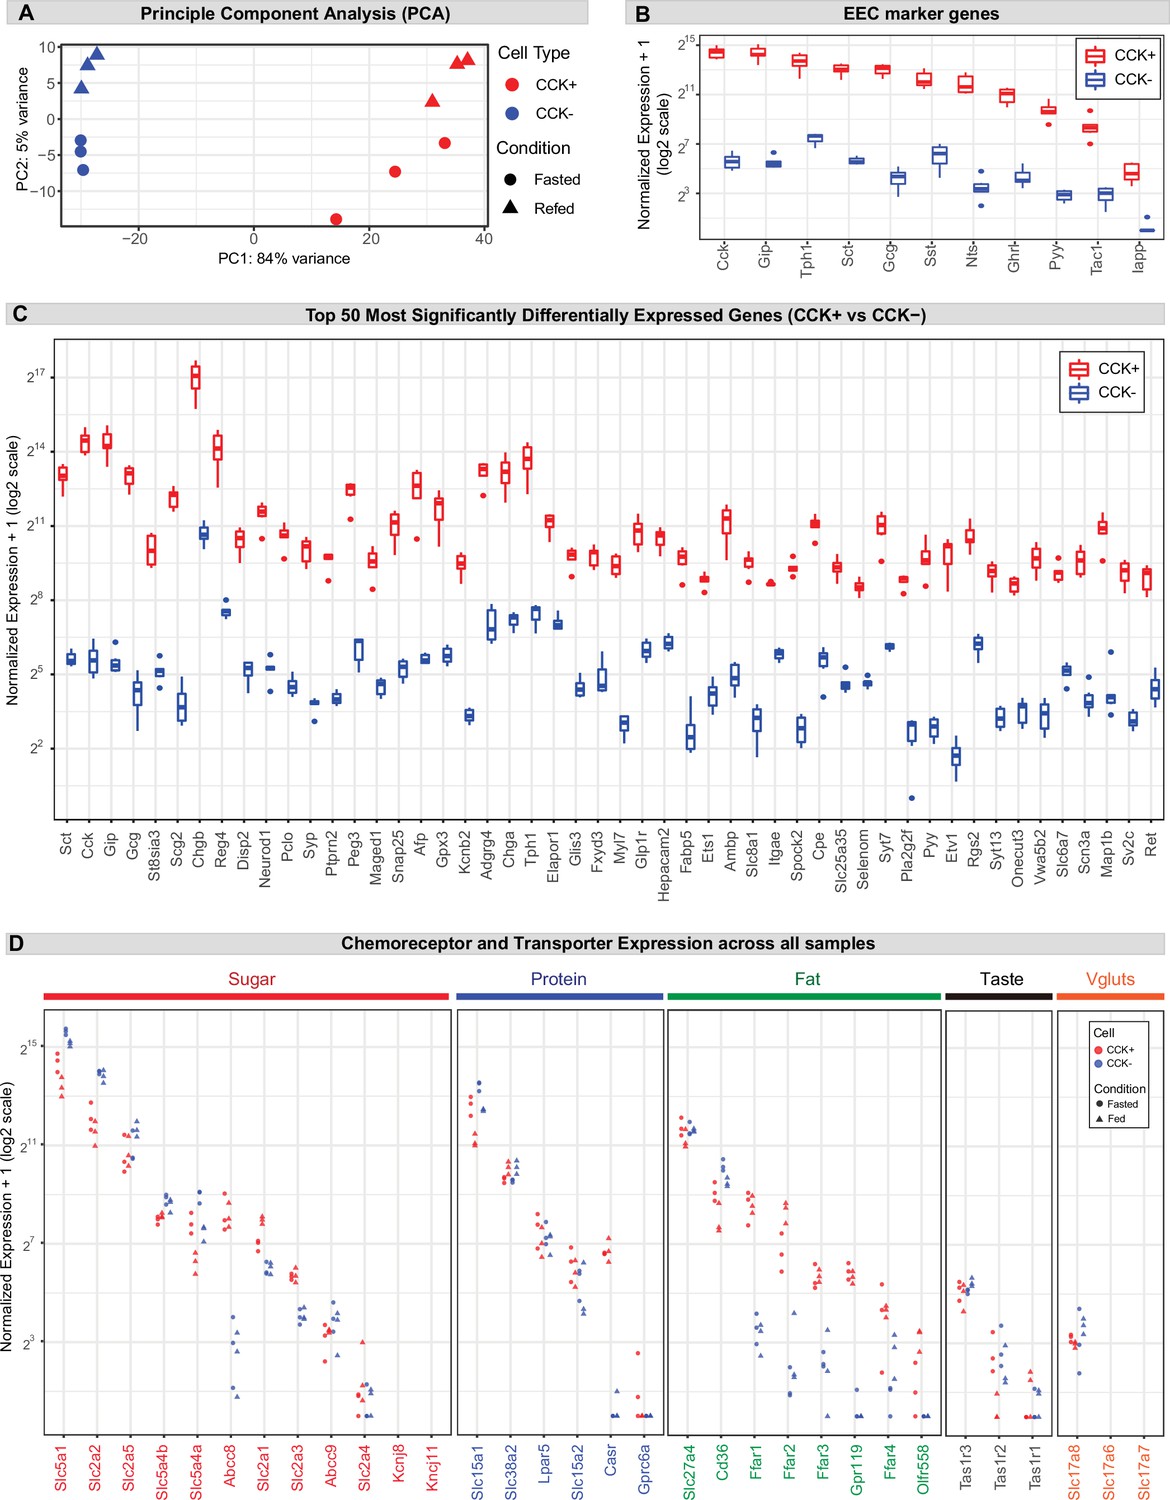
Gene expression in CCK+ EECs.
(A) Principal component analysis (PCA) of all samples based on variance stabilizing transformed (vst) count data. (B) Boxplot displaying the (normalized count + 1) of the EEC marker genes across samples. (C) Boxplot displaying the (normalized count + 1) of the 50 most significantly differentially expressed genes between CCK+ and CCK- cells. Genes are ordered by padj from lowest (most significant) to highest. (D) Dotplot displaying the (normalized count + 1) of the chemoreceptors and transporters shown in Figure 2, across all three replicates of each sample (fasted and fed, CCK+ and CCK-).
Figure 2—figure supplement 2
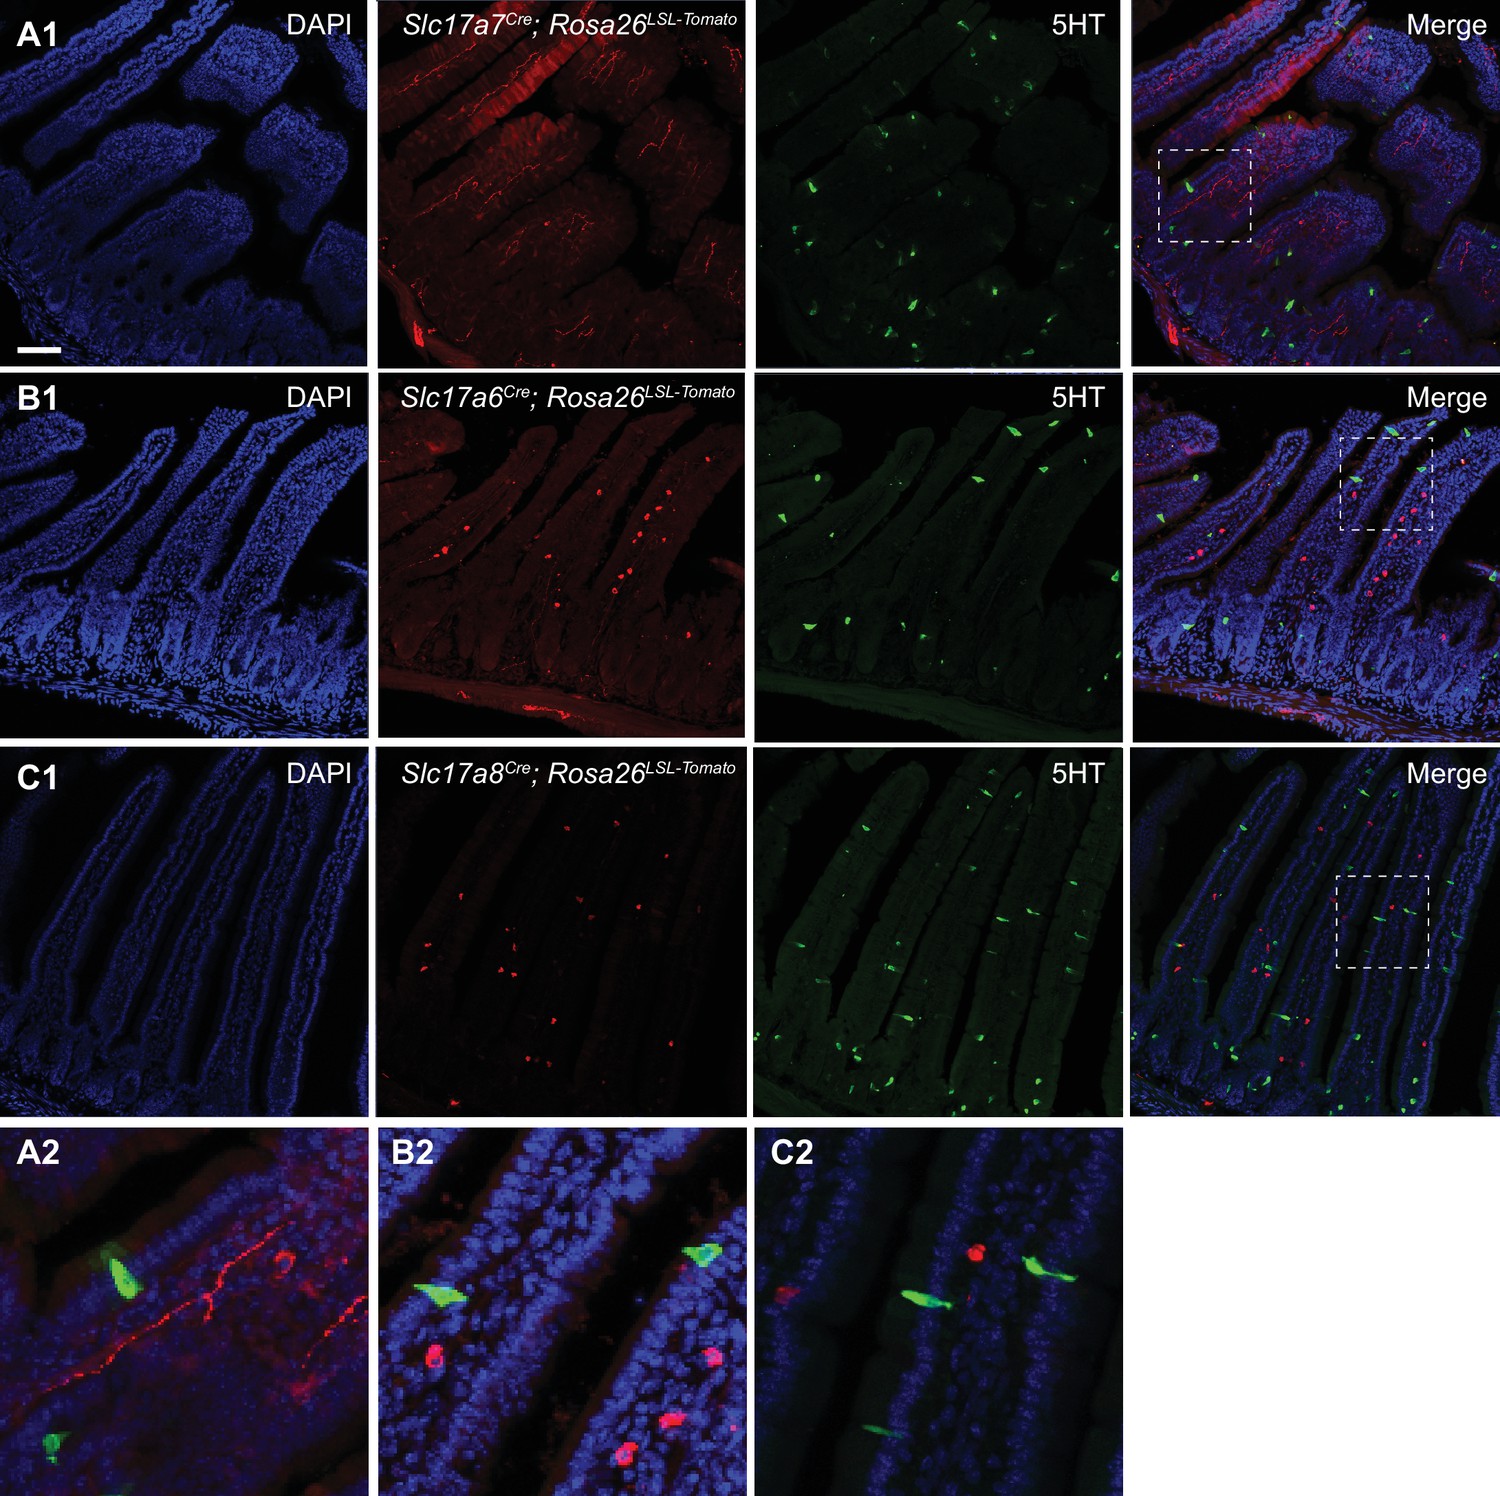
Expression of vesicular glutamate transporters in the small intestine.
(A1) Section from the small intestine of Slc17a7Cre; R26LSL-tdTomato mice, showing sites of putative VGLUT1 expression. Staining for 5-HT is shown in green. (B1) Section from the small intestine of Slc17a6Cre; R26LSL-tdTomato mice, showing sites of putative VGLUT2 expression. Note the different location and morphology of EC/EECs (5-HT, green) versus VGLUT2+ cells (red). (C1) Section from the small intestine of Slc17a8Cre; R26LSL-tdTomato mice, showing sites of putative VGLUT3 expression. Note the different location and morphology of EC/EECs (5-HT, green) versus VGLUT3+ cells (red). (A2–C2) Insets from A1-C1, showing that cells labeled by Slc17a7Cre/Slc17a6Cre/Slc17a8Cre (red) do not have the elongated, ‘flask-like’ morphology characteristic of enteroendocrine cells (green). Scale bar: 100 μm.
Figure 3 with 2 supplements
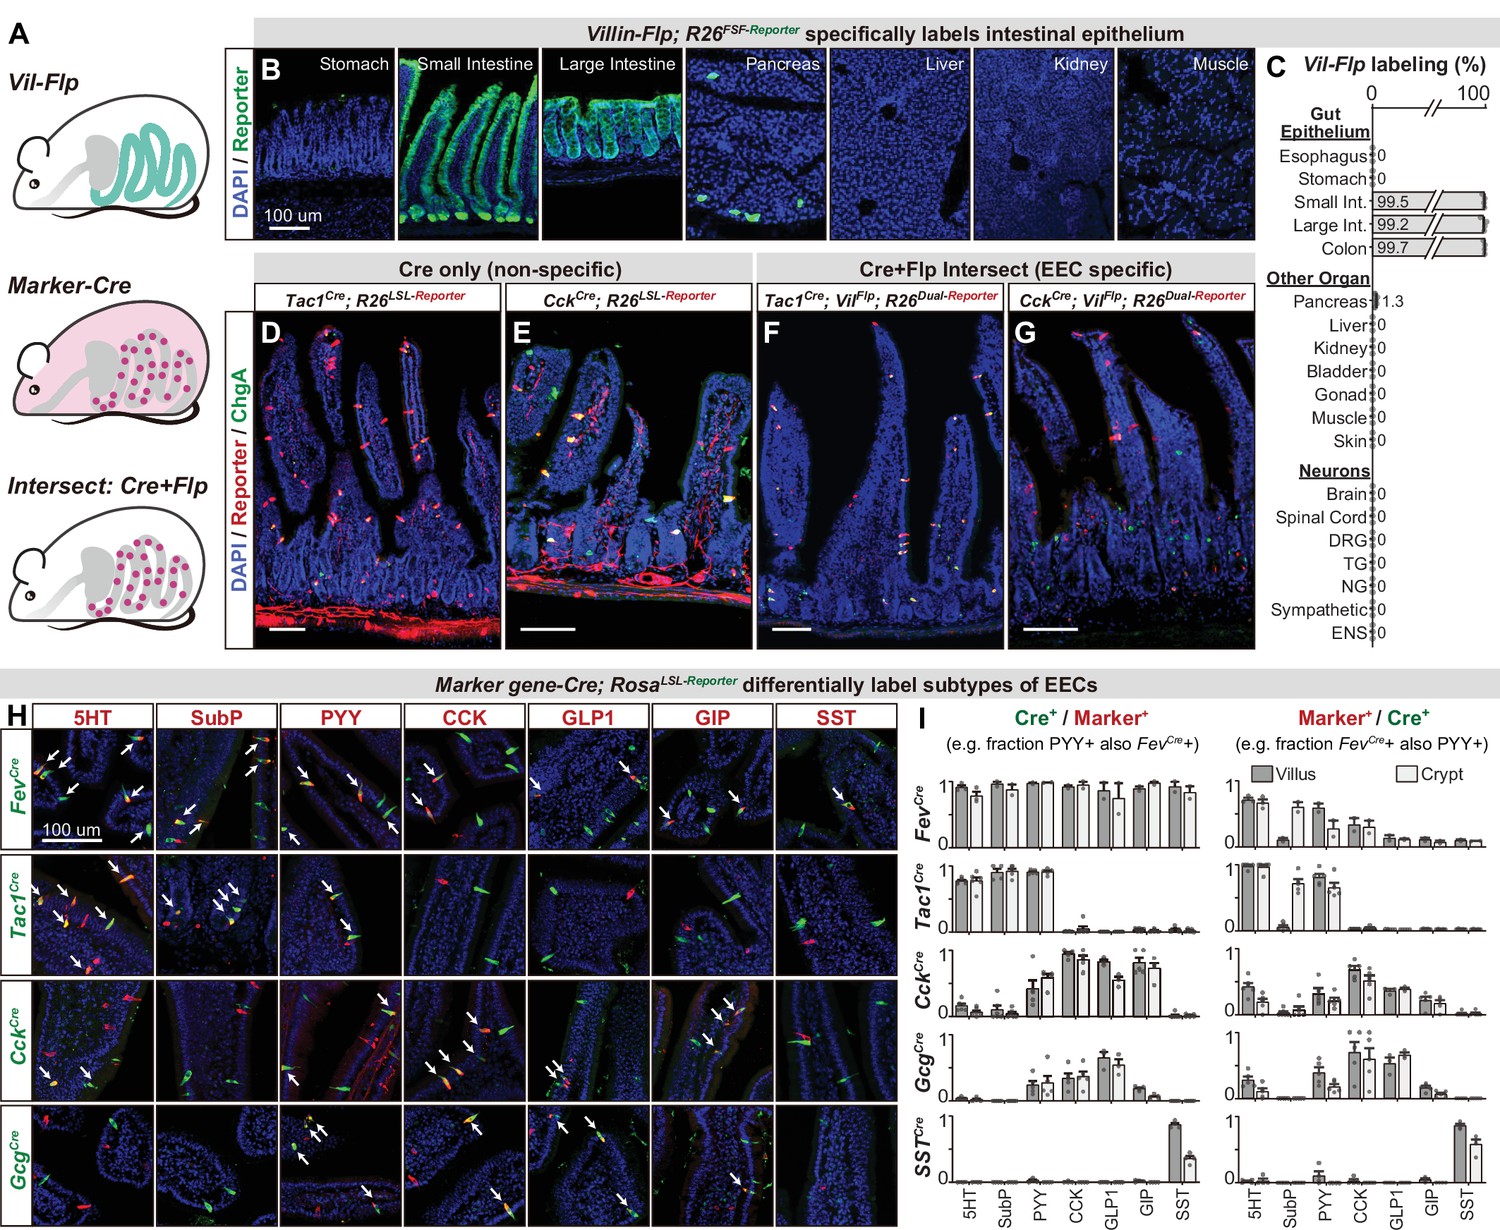
An intersectional genetic approach to selectively target EEC subtypes.
(A) Schematic illustrating the intersectional genetic approach to target EECs. Vil-Flp labels the intestinal epithelium whereas Marker gene-Cre labels diverse cells throughout the body. Their intersection defines EECs. (B) Cross-section of organs showing that Vil-Flp promotes recombination and reporter expression in the intestinal epithelium, as well as very small subsets of pancreatic cells, but not liver, kidney, muscle, or stomach. (C) Quantification of the Vil-Flp labeling across the GI tract, other visceral organs, and neuronal tissues reveals high selectivity for the intestine. (D–G) Cross-sections of the small intestines reveal the recombination pattern of single Marker gene-Cre lines (D–E) or the Marker gene-Cre; Vil-Flp intersectional strategy (F–G). Note that Tac1Cre (D) and CckCre (E) label not only EECs but also other cell types, including neuronal terminals and cell bodies in the intestine. In contrast, the labeling using the intersectional strategy is restricted to EECs (F–G). ChgA staining (green) marks the majority of enterochromaffin cells and subsets of EECs. (H) Double immunostaining of hormonal marker genes (red) and Cre-induced reporter (green) in small intestine villus sections of various Marker gene-Cre; R26LSL-Reporter mice. White arrows indicate colocalization. (I) Quantification of co-localization between different EEC subtypes and the cells labeled by various Marker gene-Cre; R26LSL-Reporter mice (example images are shown in 3H). The bar graphs on the left show the fraction of EEC subtypes (Marker+) that are labeled by each Cre line. For example, the fraction of cells that stained for PYY that are also labeled by Fev-Cre recombination. The bar graphs on the right show the fraction of the cells labeled by each Cre line that are also stained for the marker. For example, the fraction of cells labeled by Fev-Cre recombination that also stained for PYY. Comparing the left and right reveals, for example, that Fev-Cre labels a high percentage of cells for all EEC subtypes, but that each EEC subtype alone comprises only a fraction of Fev-Cre labeled cells. Each quantification is performed separately for cells in the villi (dark gray) and crypts (light gray). Values are reported as mean ± SEM. Scale bar: 100 μm. See also Figure 3—figure supplements 1 and 2, and Figure 3—source data 1.
-
Figure 3—source data 1
Raw data for Figure 3I.
- https://cdn.elifesciences.org/articles/74964/elife-74964-fig3-data1-v2.xlsx
Figure 3—figure supplement 1
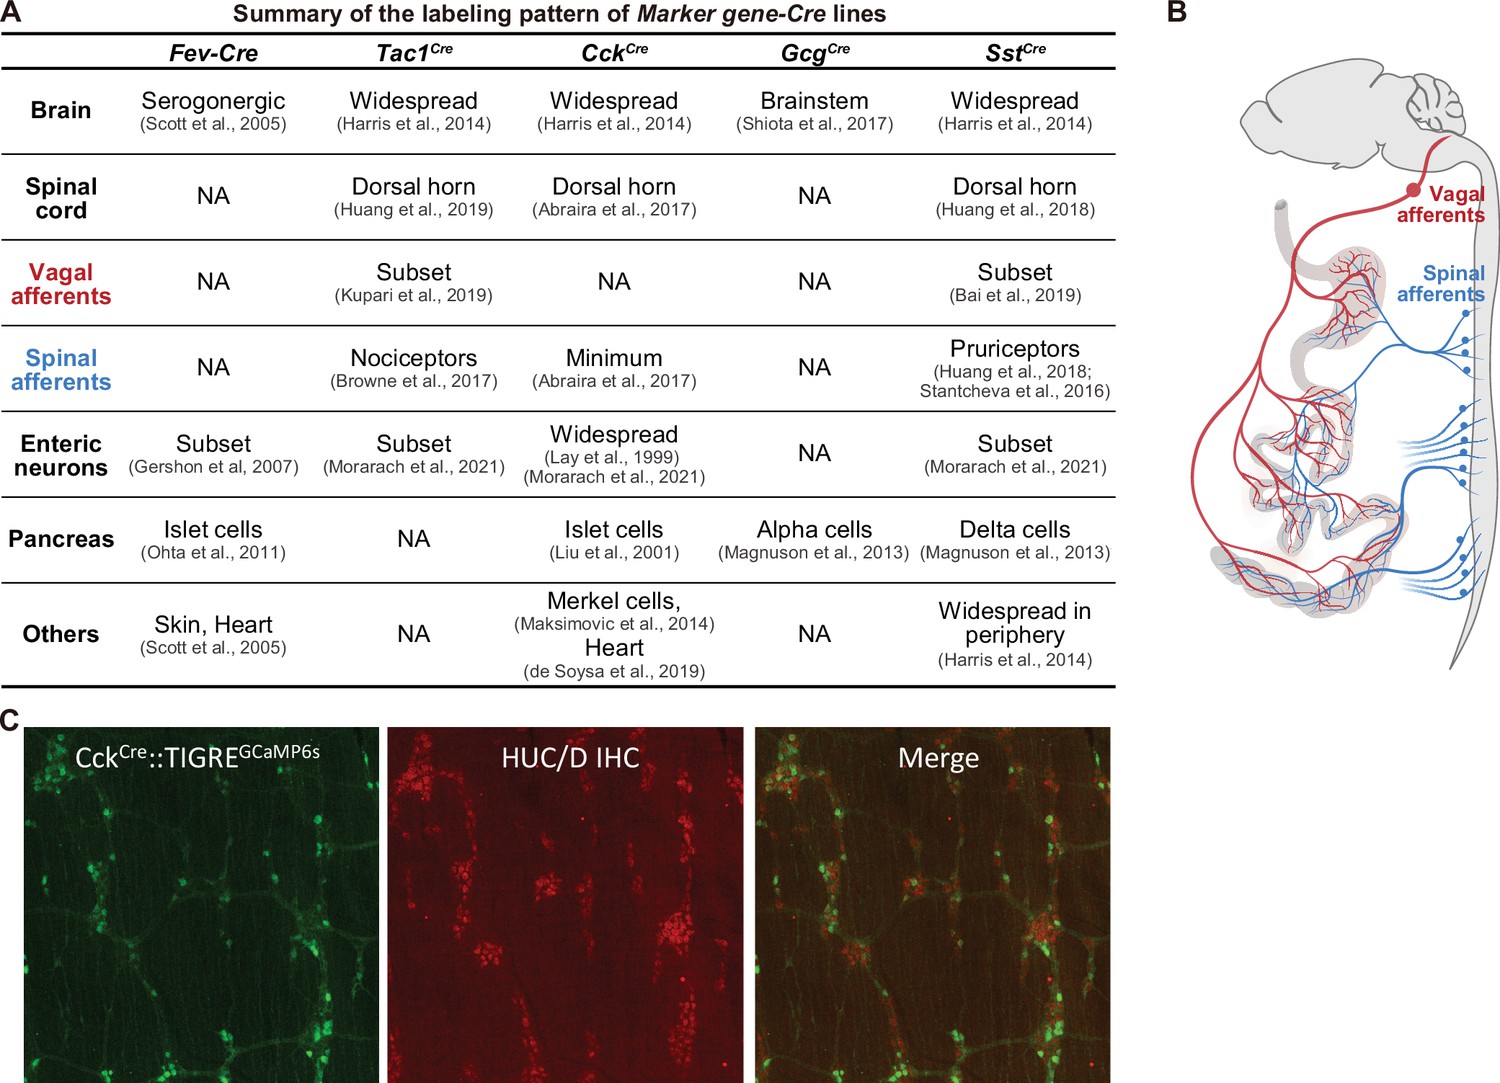
Summary of the labeling patterns of Marker gene-Cre lines.
(A) Summary of various Marker gene-Cre lines, indicating the labeling in the central nervous system (brain and spinal cord), the peripheral nervous systems (vagal afferents, spinal afferents, enteric neurons), and peripheral organ (such as pancreas). (B) Schematic showing the spinal afferents (blue) and vagal afferents (red) send axonal projections to the gut which are very close to EECs and preclude selective targeting with spatial methods (e.g. by light delivery). (C) CckCre knock-in mice (JAX 012706) induce widespread recombination throughout the enteric nervous system. Shown is a reporter for Cre recombination (GCaMP6s, green, from ai162 reporter mice) and staining for enteric neurons (HuC/D, red) in myenteric ganglia in the duodenum. A similar recombination pattern is observed with other Cre reporters.
Figure 3—figure supplement 2
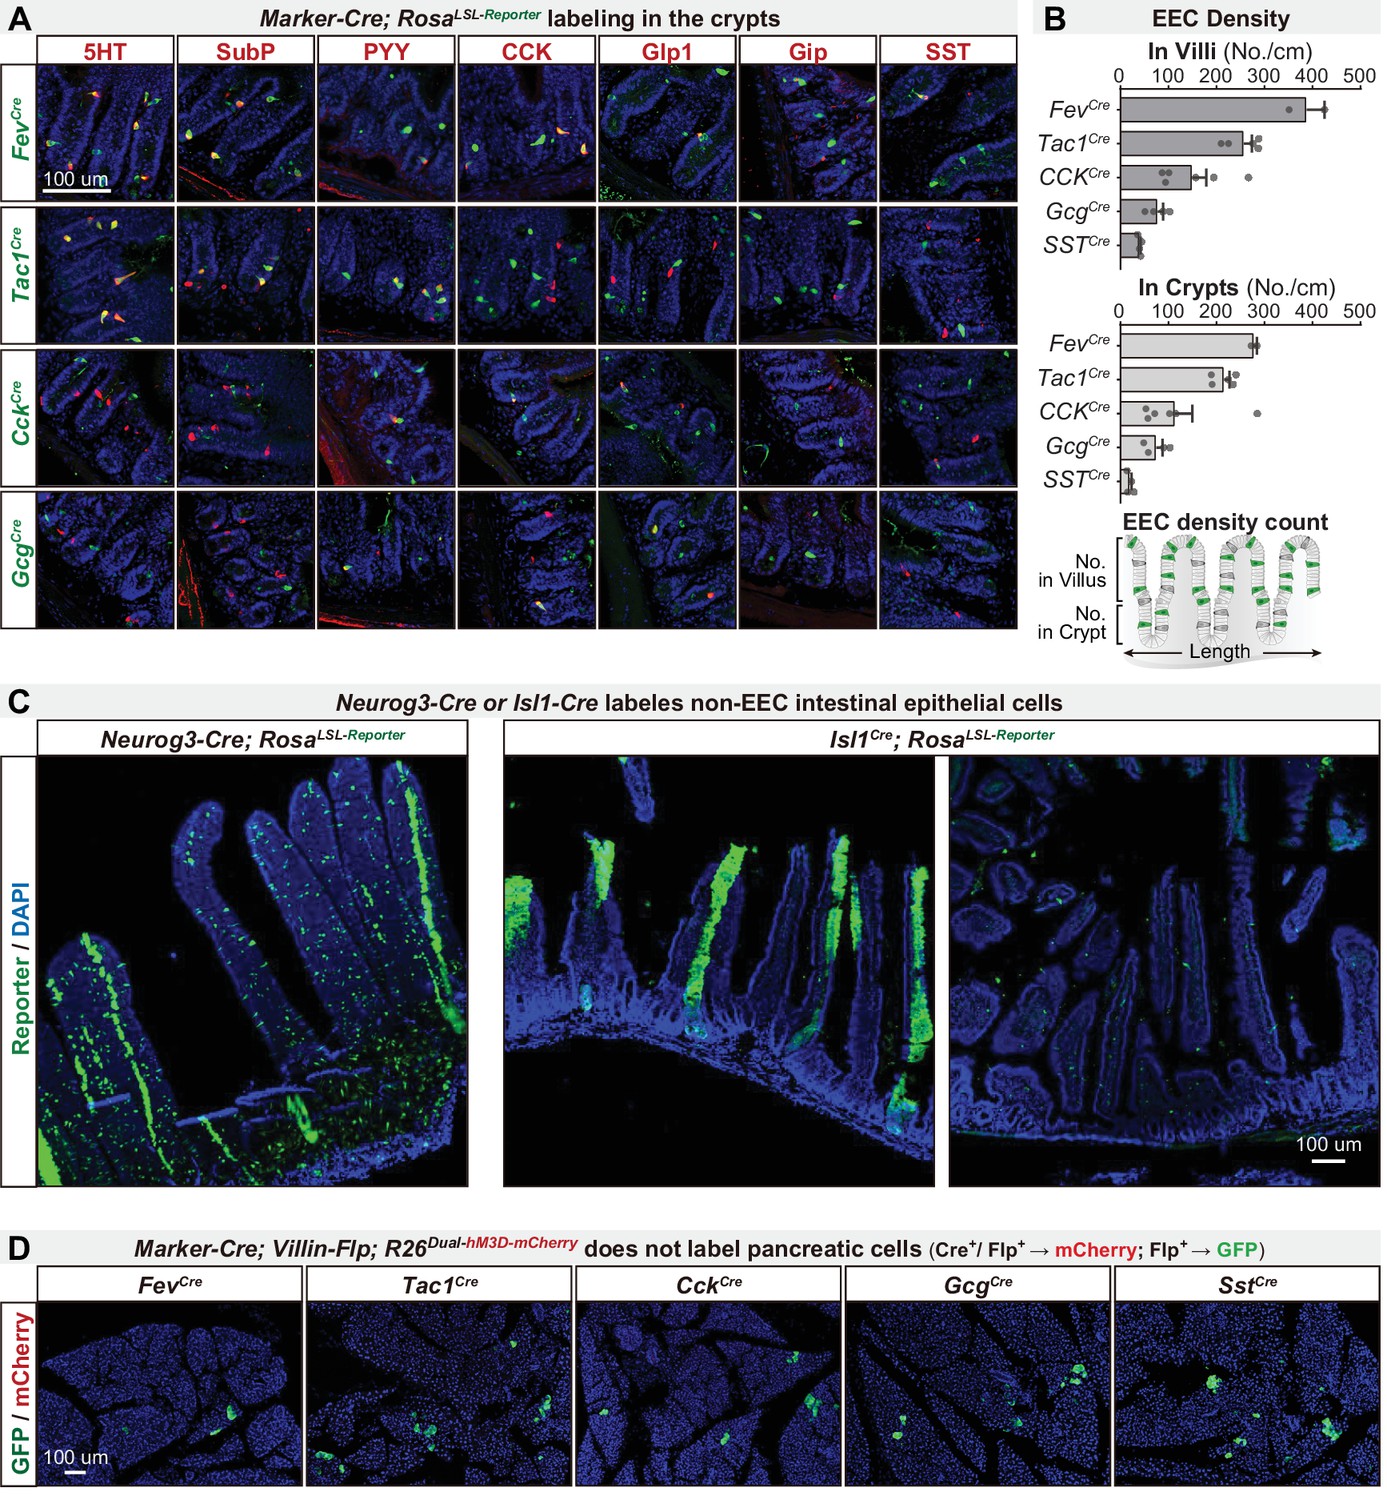
An intersectional genetic approach to selectively target EEC subtypes.
(A) Double immunostaining of hormonal marker genes (red) and Cre-induced reporter (green) on small intestine crypt sections of various Marker gene-Cre; R26LSL-Reporter mice. (B) Quantification of EEC labeling across villi and crypts using various Marker gene-Cre; R26LSL-Reporter mice. Bottom: schematic of quantification strategy, using 30 um-thick sections of small intestine. (C) Cross sections of the small intestine reveal the expression pattern of reporter using Neurog3-Cre; R26LSL-Reporter (left) or Isl1Cre; R26LSL-Reporter (right). (D) Cross-sections of the pancreas reveal the expression pattern of GFP and mCherry using various Marker-Cre; Vil-Flp; R26Dual-hM3D mice. Of note, GFP expression is induced by Flp recombination and was observed in a small subset of pancreatic cells. mCherry expression is induced by the combination of Flp and Cre and was not observed in any pancreatic cells. Values are reported as mean ± SEM. Scale bar: 100 μm. See also Figure 3—figure supplement 2—source data 1.
-
Figure 3—figure supplement 2—source data 1
Raw data.
- https://cdn.elifesciences.org/articles/74964/elife-74964-fig3-figsupp2-data1-v2.xlsx
Figure 4
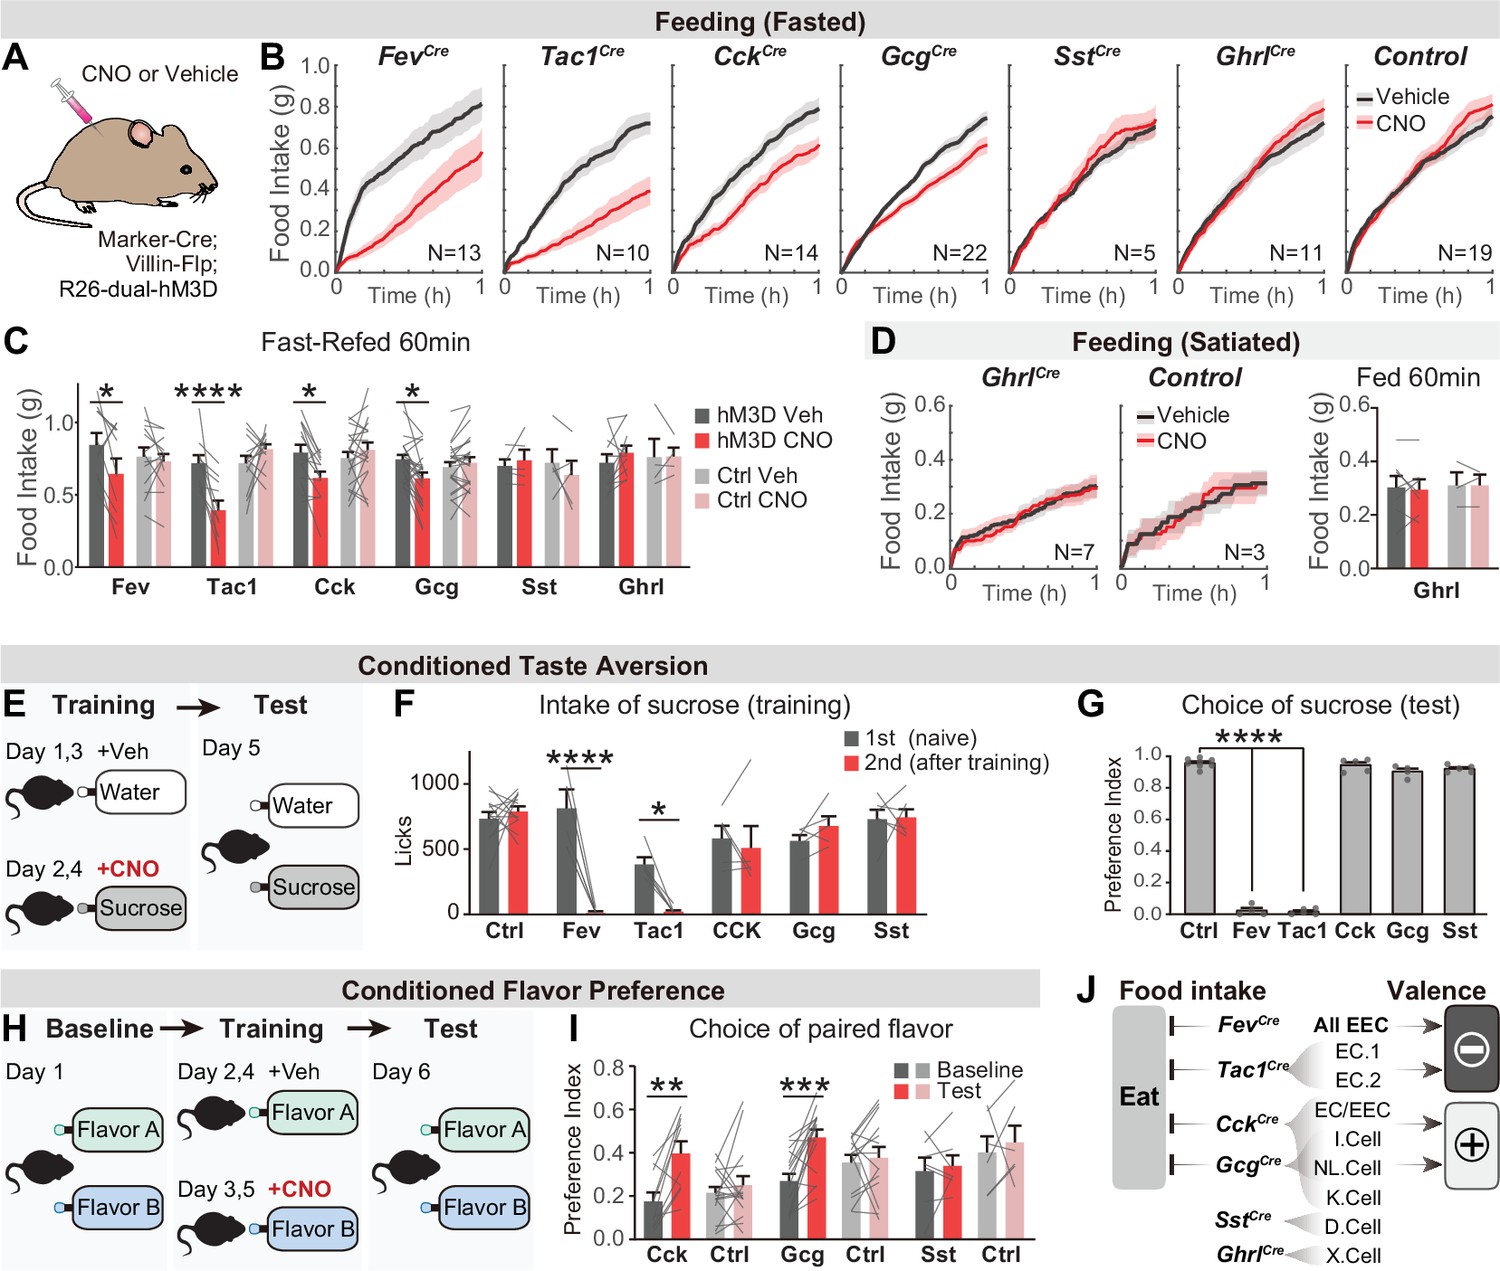
Distinct EEC subtypes signal reward and aversion.
(A) Overview of the chemogenetic approach to stimulate EEC subtypes. Littermates that were Cre or Flp negative (and therefore did not express hM3D) were used as genetic controls. (B) Cumulative food intake over one hour of overnight food-deprived mice, comparing trials with CNO or saline treatment. (C) Quantification of total food intake at 1 hr from (B), including data for both triple-mutants and littermate controls. Two-way repeated measures ANOVA. Genotype: F(11, 138)=1.508, p=0.135. Drug: F(1, 138)=8.392, p=0.0044. Interaction: F(11, 138)=5.5157, p<0.0001. (D) Cumulative food intake of satiated mice, and quantification of total food intake at 1 hr. (E) CTA paradigm. In the training trials, CNO or vehicle is delivered intraperitoneally after 20 min of sucrose or water ingestion. This is followed by a two-bottle test on day 5. (F) Total sucrose intake during training trials of CTA, comparing the 1st trial (day 1, naive mice) versus the 2nd trial (day 3, after pairing sucrose with CNO for one trial). Two-way repeated measures ANOVA. Day: F(1, 63)=16.31, p=0.0001. Genotype: F(5, 63)=3.463, p=0.0079. Interaction: F(5, 63)=3.382, p=0.0091. (G) Preference for sucrose during the two-bottle test (day 5). Ordinary one-way ANOVA. F(5, 25)=1168, p<0.0001. (H) CFP paradigm. In the training trials, CNO or vehicle is delivered in the drinking solution along with flavor A or flavor B. (I) Preference for the CNO paired in a two-bottle test at baseline (day 1) and after CFP training (day 6). Two-way repeated measures ANOVA. Genotype: F(5, 63)=3.463, p=0.0079. Day: F(1, 63)=16.31, p=0.0001. Interaction: F(5, 63)=3.382, p=0.0091. (J) Summary of EEC subtypes labeled by each Cre line, and their effects on food intake and food learning. Values are reported as mean ± SEM. N mice is annotated within figures. *p<0.05, **p<0.01, ***p<0.001, ****p<0.0001, two-way ANOVA (C, D, G, and I) or Ordinary one-way ANOVA (F). See also Source data 1 and Figure 4—source data 1, Figure 4—source data 2, Figure 5—source data 3, Figure 4—source data 4.
-
Figure 4—source data 1
Raw data for Figure 4C.
- https://cdn.elifesciences.org/articles/74964/elife-74964-fig4-data1-v2.xlsx
-
Figure 4—source data 2
Raw data for Figure 4F.
- https://cdn.elifesciences.org/articles/74964/elife-74964-fig4-data2-v2.xlsx
-
Figure 4—source data 3
Raw data for Figure 4G.
- https://cdn.elifesciences.org/articles/74964/elife-74964-fig4-data3-v2.xlsx
-
Figure 4—source data 4
Raw data for Figure 4I.
- https://cdn.elifesciences.org/articles/74964/elife-74964-fig4-data4-v2.xlsx
Figure 5 with 1 supplement
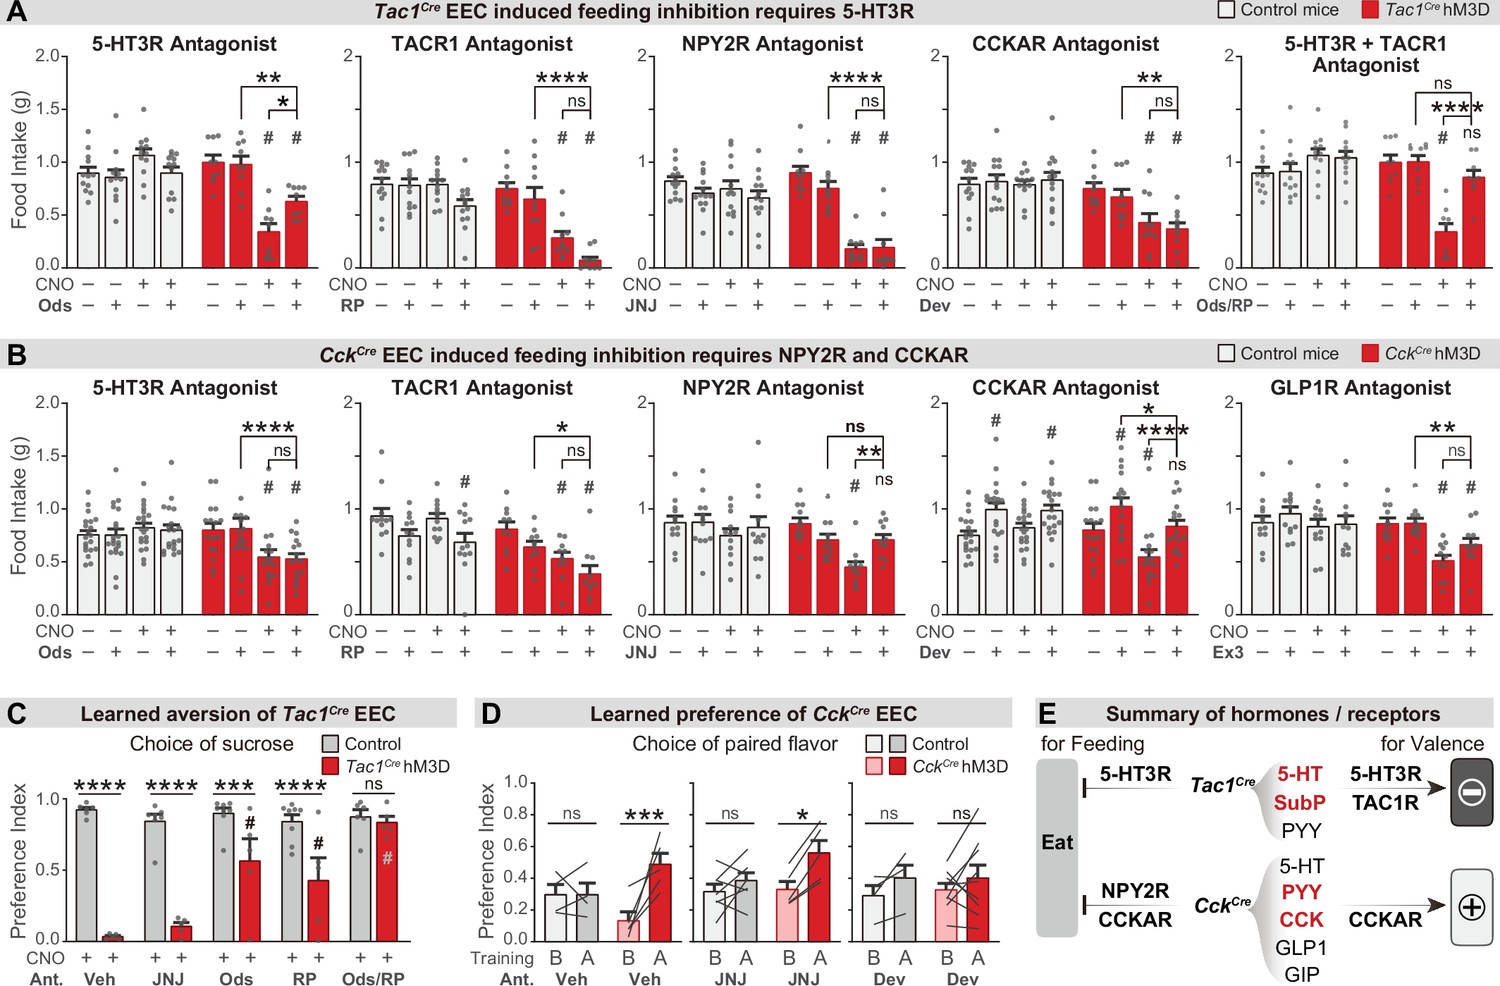
Different neurotransmitters regulate food consumption and learning.
(A–B) One-hour food intake of overnight food-deprived mice treated with either CNO or vehicle, and the receptor antagonist or vehicle, immediately before food access. Experimental Tac1Cre; Vil-Flp; R26Dual-hM3D mice (A), CckCre; Vil-Flp; R26Dual-hM3D mice mice (B) are shown in red. Littermate control mice that do not express hM3D are shown in gray (A,B). The key comparison is the last two red bars in each set, which reports whether the receptor antagonist can block the ability of CNO to reduce food intake. Statistics for (A): Two-way repeated measures ANOVA. Ods. Genotype: F(1, 19)=14.25, p=0.0013. Drug: F(3, 57)=6.741, p=0.0006. Interaction: F(3, 57)=19.00, p<0.0001. RP. Genotype: F(1, 21)=34.88, p<0.0001. Drug: F(3, 63)=21.57, p<0.0001. Interaction: F(3, 63)=8.333, p<0.0001. JNJ. Genotype: F(1, 21)=21.84, p=0.0001. Drug: F(3, 63)=24.65, p<0.0001. Interaction: F(3, 63)=16.17, p<0.0001. Dev. Genotype: F(1, 21)=23.33, p<0.0001. Drug: F(3, 63)=4.295, p=0.0081. Interaction: F(3, 63)=5.032, p=0.0034. Ods RP. Genotype: F(1, 19)=8.406, p=0.0092. Drug: F(3, 57)=8.835, p<0.0001. Interaction: F(3, 57)=21.44, p<0.0001. Statistics for (B): Two-way repeated measures ANOVA. Ods. Genotype: F(1, 34)=2.679, p=0.1109. Drug: F(3, 102)=4.382, p=0.0061. Interaction: F(3, 102)=10.11, p<0.0001. RP. Genotype: F(1, 20)=14.75, p=0.0010. Drug: F(3, 60)=10.02, p<0.0001. Interaction: F(3, 60)=2.394, p=0.0772. JNJ. Genotype: F(1, 21)=4.676, p=0.0423. Drug: F(3, 63)=8.661, p<0.0001. F(3, 63)=2.446. Interaction: p=0.0720. Dev. Genotype: F(1, 34)=1.694, p=0.2018. Drug: F(3, 102)=24.64, p<0.0001. Interaction: F(3, 102)=7.190, p=0.0002. Ex. Genotype: F(1, 21)=4.407, p=0.0481. Drug: F(3, 63)=12.92, p<0.0001. Interaction: F(3, 63)=5.193, p=0.0029. See Source data 1 for exact p values of all post-hoc tests. (C) Tac1Cre; Vil-Flp; R26Dual-hM3D mice (red) were subjected to CTA training as in Figure 4, except that they were treated with the indicated antagonist or vehicle prior to each training session. Littermate controls that lack hM3D expression (gray) were treated identically. Shown is the preference for sucrose during the two-bottle test on day 5. Note that all mice received CNO during CTA training. Two-way repeated measures ANOVA. Drug: F(4, 50)=10.62, p<0.0001. Genotype: F(1, 50)=117.6, p<0.0001. Interaction: F(4, 50)=11.15, p<0.0001. (D) CckCre; Vil-Flp; R26Dual-hM3D mice mice (red) were subjected to CFP training as in Figure 4, except that they were treated with the indicated antagonist or vehicle prior to each training session. Littermate controls that lack hM3D expression (gray) were treated identically. Results are shown for the two-bottle tests on day 1 (before training, ‘B’) and day 6 (after training, ‘A’). Preference index indicates the preference for the CNO paired flavor, as in Figure 4. Note that all animals received CNO during training. Two-way repeated measures ANOVA. Time: F(1, 28)=22.71, p<0.0001. Genotype-Treatment: F(5, 28)=0.7891, p=0.5664. Interaction: F(5, 28)=2.895, p=0.0314. (E) Summary of gut hormones expressed in the Tac1Cre EECs or CckCre EECs, and the corresponding receptors required for the regulation of feeding behavior or learned preferences, based on the pharmacological data presented in this figure. Values are reported as mean ± SEM. *p<0.05, **p<0.01, ***p<0.001, ****p<0.0001; # or ns above bars indicate p-value comparing with the vehicle control treatment of the same genotype (#p<0.05); two-way ANOVA. See also Figure 5—figure supplement 1, figure , Figure 5—source data 1, Figure 5—source data 2, Figure 5—source data 3.
-
Figure 5—source data 1
Raw data for Figure 5A.
- https://cdn.elifesciences.org/articles/74964/elife-74964-fig5-data1-v2.xlsx
-
Figure 5—source data 2
Raw data for Figure 5B.
- https://cdn.elifesciences.org/articles/74964/elife-74964-fig5-data2-v2.xlsx
-
Figure 5—source data 3
Raw data for Figure 5C.
- https://cdn.elifesciences.org/articles/74964/elife-74964-fig5-data3-v2.xlsx
-
Figure 5—source data 4
Raw data for Figure 5D.
- https://cdn.elifesciences.org/articles/74964/elife-74964-fig5-data4-v2.xlsx
Figure 5—figure supplement 1
Different neurotransmitters regulate food consumption and learning.
(A–B) Cumulative food intake of overnight food-deprived mice. Each plot compares trials with CNO, antagonist, or vehicle treatment, using either Tac1Cre; Vil-Flp; R26Dual-hM3D mice (A), CckCre; Vil-Flp; R26Dual-hM3D mice (B), or control mice (A–B). (C–D) Quantification of CTA comparing Fev-Cre; Vil-Flp; R26Dual-hM3D mice and control mice that are treated with antagonist or vehicle before CTA training. All mice received CNO during CTA training. (C) Choice of sucrose during the test trial of CTA. (D) Ratio of total sucrose intake in the second sucrose trial (day 3, after pairing with CNO for one trial) versus 1st sucrose trial (day 1, naïve mice). (E) Quantification of CTA comparing Tac1Cre; Vil-Flp; R26Dual-hM3D mice and control mice that are treated with antagonist or vehicle before CTA training. All mice received CNO during CTA training. Plot shows the ratio of total sucrose intake in the second sucrose trial (day 3, after pairing with CNO for one trial) versus first sucrose trial (day 1, naive mice). Values are reported as mean ± SEM. *p<0.05, **p<0.01, ***p<0.001, ****p<0.0001; # or ns above the bar indicate p-value comparing with the vehicle control treatment of the same genotype (#P<0.05); two-way ANOVA. See also Source data 1 and Figure 5—figure supplement 1—source data 1.
-
Figure 5—figure supplement 1—source data 1
Raw data.
- https://cdn.elifesciences.org/articles/74964/elife-74964-fig5-figsupp1-data1-v2.xlsx
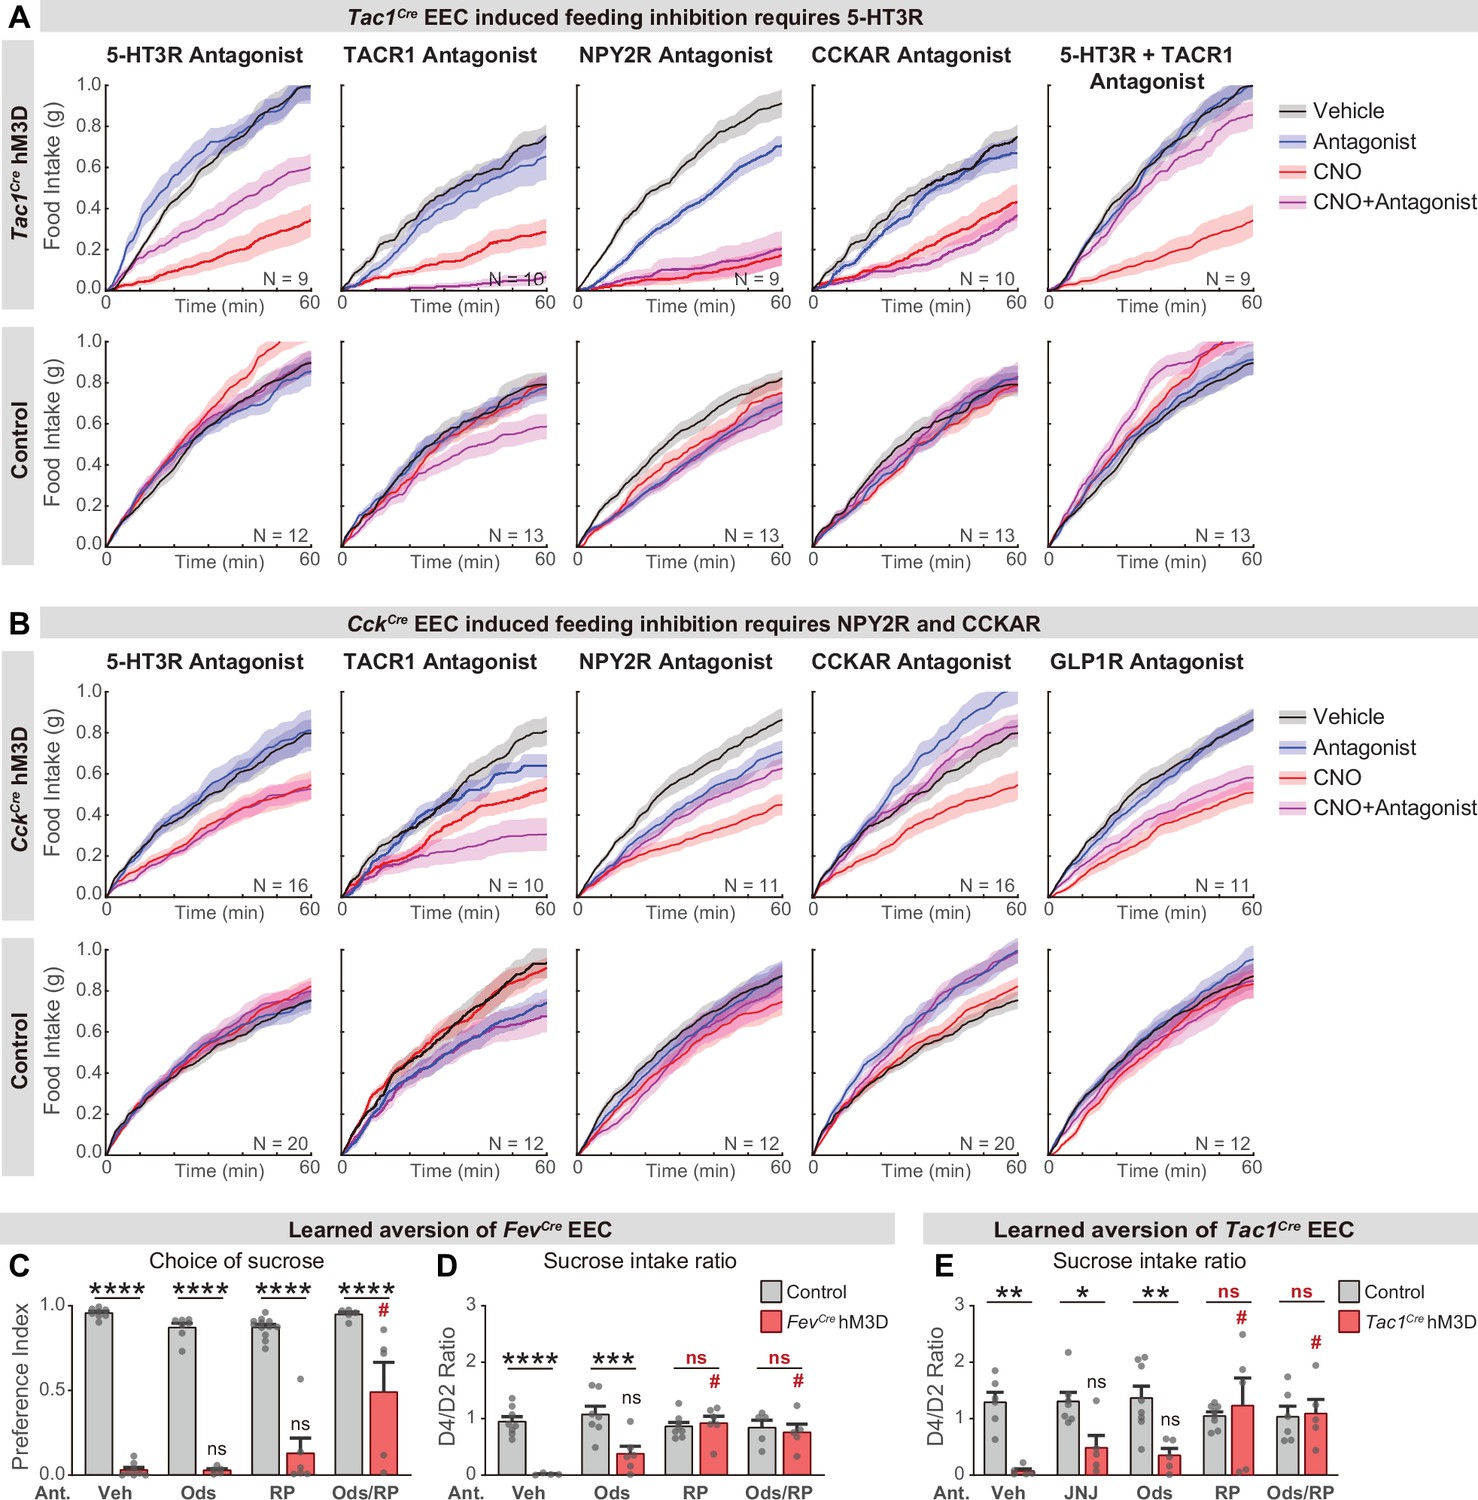
Figure 6 with 1 supplement

Parallel neuronal pathways convey EEC signals to the brain.
(A) Experimental design. Triple-transgenic mice expressing hM3D in CCK or TAC1 EECs, or littermate controls, were subjected to either surgical vagotomy to remove subdiaphragmatic vagal afferents, or treatment with intrathecal RTX to ablate spinal afferents, or sham surgery. They were then treated with CNO or vehicle and the effect on feeding behavior and learned preferences was measured. (B,D) Tac1Cre; Vil-Flp; R26Dual-hM3D mice and littermate controls were subjected to either subdiaphragmatic vagotomy or sham surgery (B) or IT-RTX or sham surgery (D). Animals were then food deprived overnight, injected with CNO or vehicle, and one-hour food intake was recorded. Right: ratio of feeding inhibition after treatment with CNO versus vehicle. Statistics for (B, left): Two-way repeated measures ANOVA. Drug: F(1, 14)=15.03, p=0.0017. Subject: F(2, 14)=0.7452, p=0.4925. Interaction: F(2, 14)=6.480, p=0.0102. (B, right): Ordinary one-way ANOVA. F(2, 14)=6.926, p=0.0081.(D, left): Two-way repeated measures ANOVA. Drug: F(1, 16)=20.25, p=0.0004. Subject: F(2, 16)=4.673, p=0.0252. Interaction: F(2, 16)=13.38, P=0.0004. (D, right): Ordinary one-way ANOVA. F(2, 16)=13.40, p=0.0004. (C,E) CckCre; Vil-Flp; R26Dual-hM3D mice and littermate controls were subjected to either subdiaphragmatic vagotomy or sham surgery (C) or IT-RTX or sham surgery (E). Animals were then food deprived overnight, injected with CNO or vehicle, and one-hour food intake was recorded. Right: ratio of feeding inhibition after treatment with CNO versus vehicle. Statistics for (C, left): Two-way repeated measures ANOVA. Drug: F(1, 12)=32.50, p<0.0001. Subject: F(2, 12)=0.6638, p=0.5328. Interaction: F(2, 12)=15.33, p=0.0005. (C, right): Ordinary one-way ANOVA. F(2, 12)=7.267, p=0.0086. (E, left): Two-way repeated measures ANOVA. Drug: F(1, 16)=34.54, p<0.0001. Subject: F(2, 16)=1.036, p=0.3774. Interaction: F(2, 16)=7.123, p=0.0061. (E, right): Ordinary one-way ANOVA. F(2, 16)=11.03, p=0.0010. (F) Tac1Cre; Vil-Flp; R26Dual-hM3D mice (red) and littermate controls (gray) underwent sham treatment, vagotomy, or IT-RTX before CTA training as in Figure 4. All mice received CNO during CTA training. Left: Preference for sucrose in the two-bottle test after CTA training. Ordinary two-way ANOVA. Genotype: F(1, 24)=154.1, p<0.0001. Treatment: F(2, 24)=12.83, p=0.0002. Interaction: F(2, 24)=7.792, p=0.0025. Right: Ratio of total sucrose intake in the second sucrose training session (day 3, after pairing with CNO for one trial) versus first sucrose session (day 1, naive mice). Ordinary two-way ANOVA. Genotype: F(1, 30)=35.61, p<0.0001. Treatment: F(2, 30)=4.673, p=0.0171. Interaction: F(2, 30)=2.398, p=0.1081. Of note, the apparent increased preference for sucrose after vagotomy is largely due to the low ingestion of water; see also Figure 6—figure supplement 1I. (G) CckCre; Vil-Flp; R26Dual-hM3D mice and littermate controls underwent sham treatment, vagotomy, or IT-RTX and then were subjected to CFP training as in Figure 4. Shown is the preference for the CNO paired flavor in the two-bottle test before training (gray bars, day 1) and after training (red bars, day 6). Control: Two-way repeated measure ANOVA. Genotype: F(1, 10)=16.95, p=0.0021. Time: F(1, 10)=9.746, p=0.0108. Interaction: F(1, 10)=5.771, p=0.0372.Vagotomy: Two-way repeated measure ANOVA. Genotype: F(1, 12)=1.866, p=0.1970. Time: F(1, 12)=1.213, p=0.2923. Interaction: F(1, 12)=0.4892, p=0.4976. IT-RTX: Two-way repeated measure ANOVA. Genotype: F(1, 13)=0.08803, p=0.7714. Time: F(1, 13)=5.795, 0.0316. Interaction: F(1, 13)=6.671, p=0.0227. (H) Summary of neuronal pathways required for Tac1Cre EECs or CckCre EECs to regulate food intake and drive food learning. Values are reported as mean ± SEM. *p<0.05, **p<0.01, ***p<0.001, ****p<0.0001; # or ns above bars indicate p-value comparing with the vehicle control treatment of the same genotype (#P<0.05); two-way ANOVA (left of B-E; F, G), or ordinary one-way ANOVA (right of B-E). See also Figure 6—figure supplement 1, Figure 6—source data 1, Source data 1, Figure 6—source data 2, Figure 6—source data 3, Figure 6—source data 4, Figure 6—source data 5, .
-
Figure 6—source data 1
Raw data for Figure 6B.
- https://cdn.elifesciences.org/articles/74964/elife-74964-fig6-data1-v2.xlsx
-
Figure 6—source data 2
Raw data for Figure 6C.
- https://cdn.elifesciences.org/articles/74964/elife-74964-fig6-data2-v2.xlsx
-
Figure 6—source data 3
Raw data for Figure 6D.
- https://cdn.elifesciences.org/articles/74964/elife-74964-fig6-data3-v2.xlsx
-
Figure 6—source data 4
Raw data for Figure 6E.
- https://cdn.elifesciences.org/articles/74964/elife-74964-fig6-data4-v2.xlsx
-
Figure 6—source data 5
Raw data for Figure 6F.
- https://cdn.elifesciences.org/articles/74964/elife-74964-fig6-data5-v2.xlsx
-
Figure 6—source data 6
Raw data for Figure 6G.
- https://cdn.elifesciences.org/articles/74964/elife-74964-fig6-data6-v2.xlsx
Figure 6—figure supplement 1
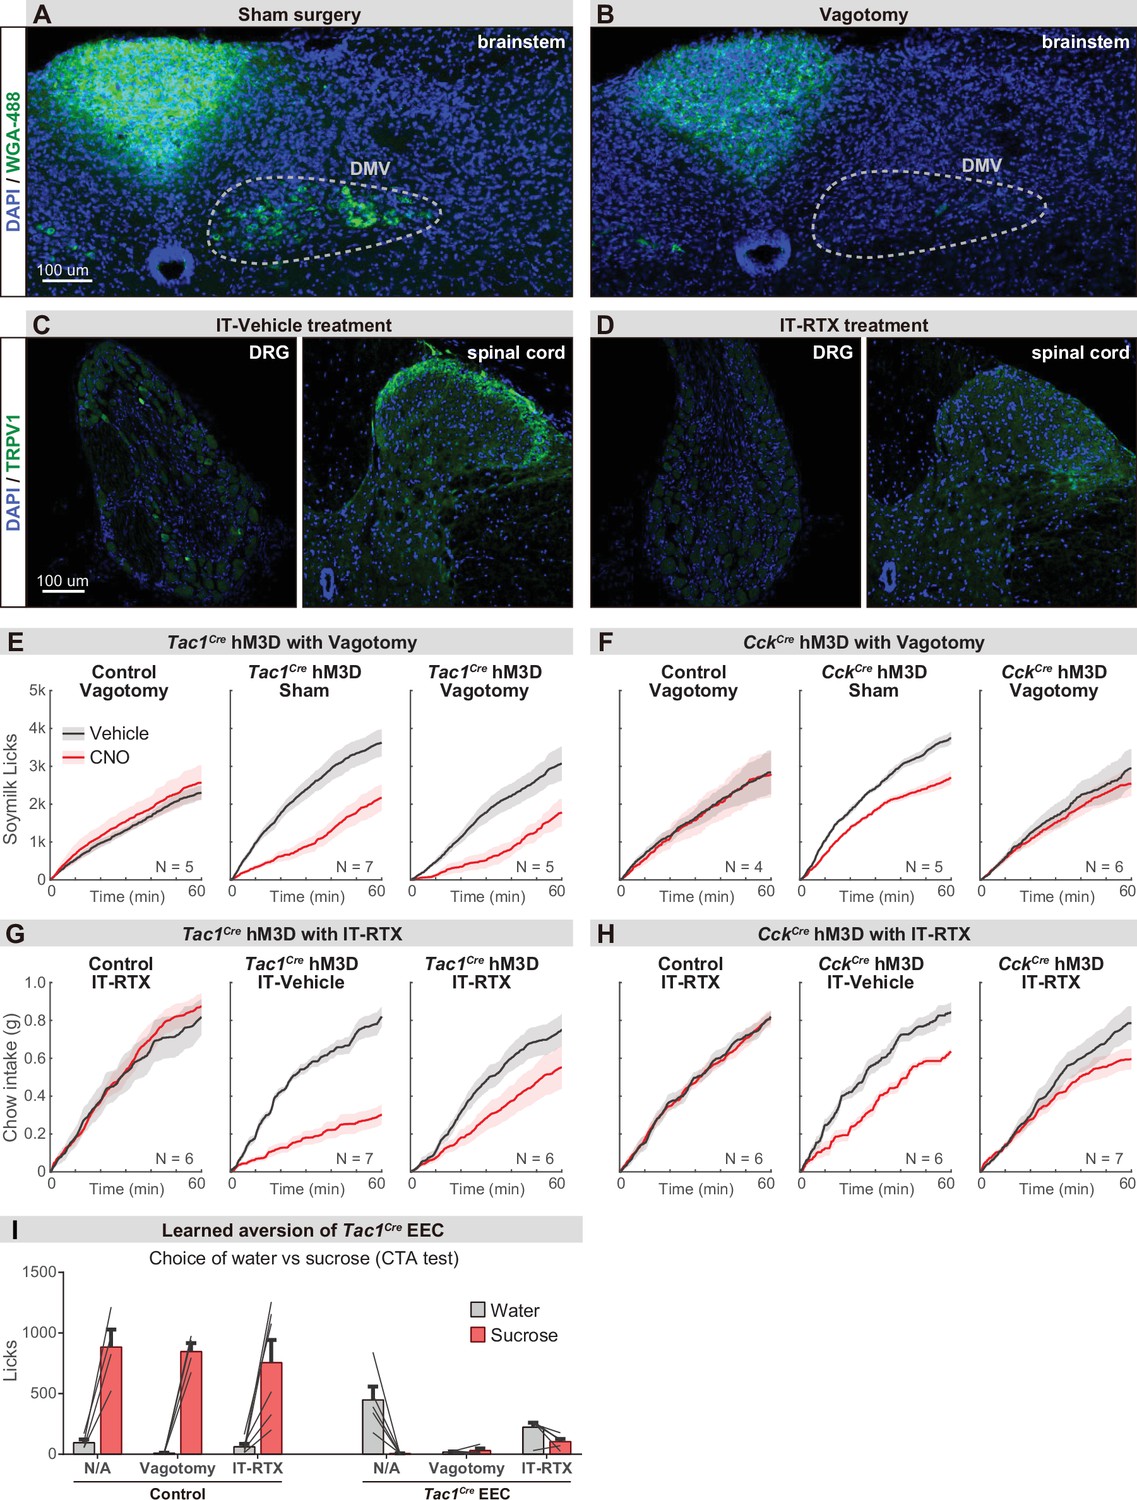
Parallel neuronal pathways convey EEC signals to the brain.
(A–B) Brainstem sections showing the vagal motor neurons that are labeled by intraperitoneal injection of wheat germ agglutinin (WGA-488). Labeling was largely absent following subdiaphragmatic vagotomy (B) compared with sham control (A). (C–D) Immunostaining of TRPV1 on DRG and spinal cord sections. The TRPV1+ DRG neurons (left) and axonal terminals in spinal cord (right) are greatly diminished following the intrathecal injection of RTX (D) compared with vehicle injection (C). (E–H) Cumulative food intake over time after overnight food deprivation. Each plot compares trials with CNO or vehicle treatment, using either Tac1Cre; Vil-Flp; R26Dual-hM3D mice (E, G), CckCre; Vil-Flp; R26Dual-hM3D mice (F, H), or control mice (E–H), with vagotomy versus sham treatment (E–F), or IT-RTX versus IT-vehicle treatment (G–H). (I) Licks of sucrose versus water during CTA choice test, using Tac1Cre; Vil-Flp; R26Dual-hM3D mice or control mice with sham treatment, vagotomy, or IT-RTX. Of note, stimulation of Tac1Cre EEC in the vagotomy mice reduced the intake of both sucrose and water, suggesting vagotomy is not sufficient to block the aversion induced by Tac1Cre EECs. Values are reported as mean ± SEM. Scale bar: 100 μm. See also Figure 6—figure supplement 1—source data 1.
-
Figure 6—figure supplement 1—source data 1
Raw data.
- https://cdn.elifesciences.org/articles/74964/elife-74964-fig6-figsupp1-data1-v2.xlsx
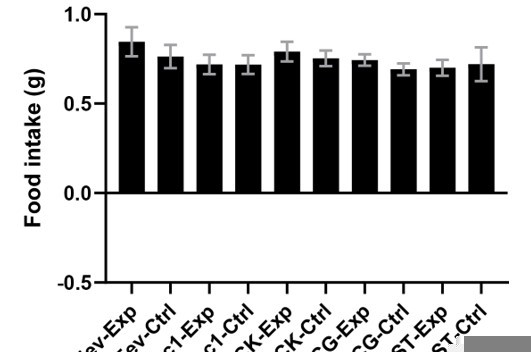
Author response image 1
Additional files
-
Source data 1
Summary statistics.
- https://cdn.elifesciences.org/articles/74964/elife-74964-data1-v2.xlsx
-
Transparent reporting form
- https://cdn.elifesciences.org/articles/74964/elife-74964-transrepform1-v2.pdf
Download links
A two-part list of links to download the article, or parts of the article, in various formats.
Downloads (link to download the article as PDF)
Open citations (links to open the citations from this article in various online reference manager services)
Cite this article (links to download the citations from this article in formats compatible with various reference manager tools)
Enteroendocrine cell types that drive food reward and aversion
eLife 11:e74964.
https://doi.org/10.7554/eLife.74964


