Transcriptional regulation of cyclophilin D by BMP/Smad signaling and its role in osteogenic differentiation
- Center for Musculoskeletal Research, University of Rochester, United States
- Department of Pathology, University of Rochester, United States
- Department of Pediatrics, Division of Cardiology, University of Rochester, United States
- Department of Biomedical Engineering, University of Rochester, United States
- Department of Pharmacology & Physiology, University of Rochester, United States
Figures
Figure 1
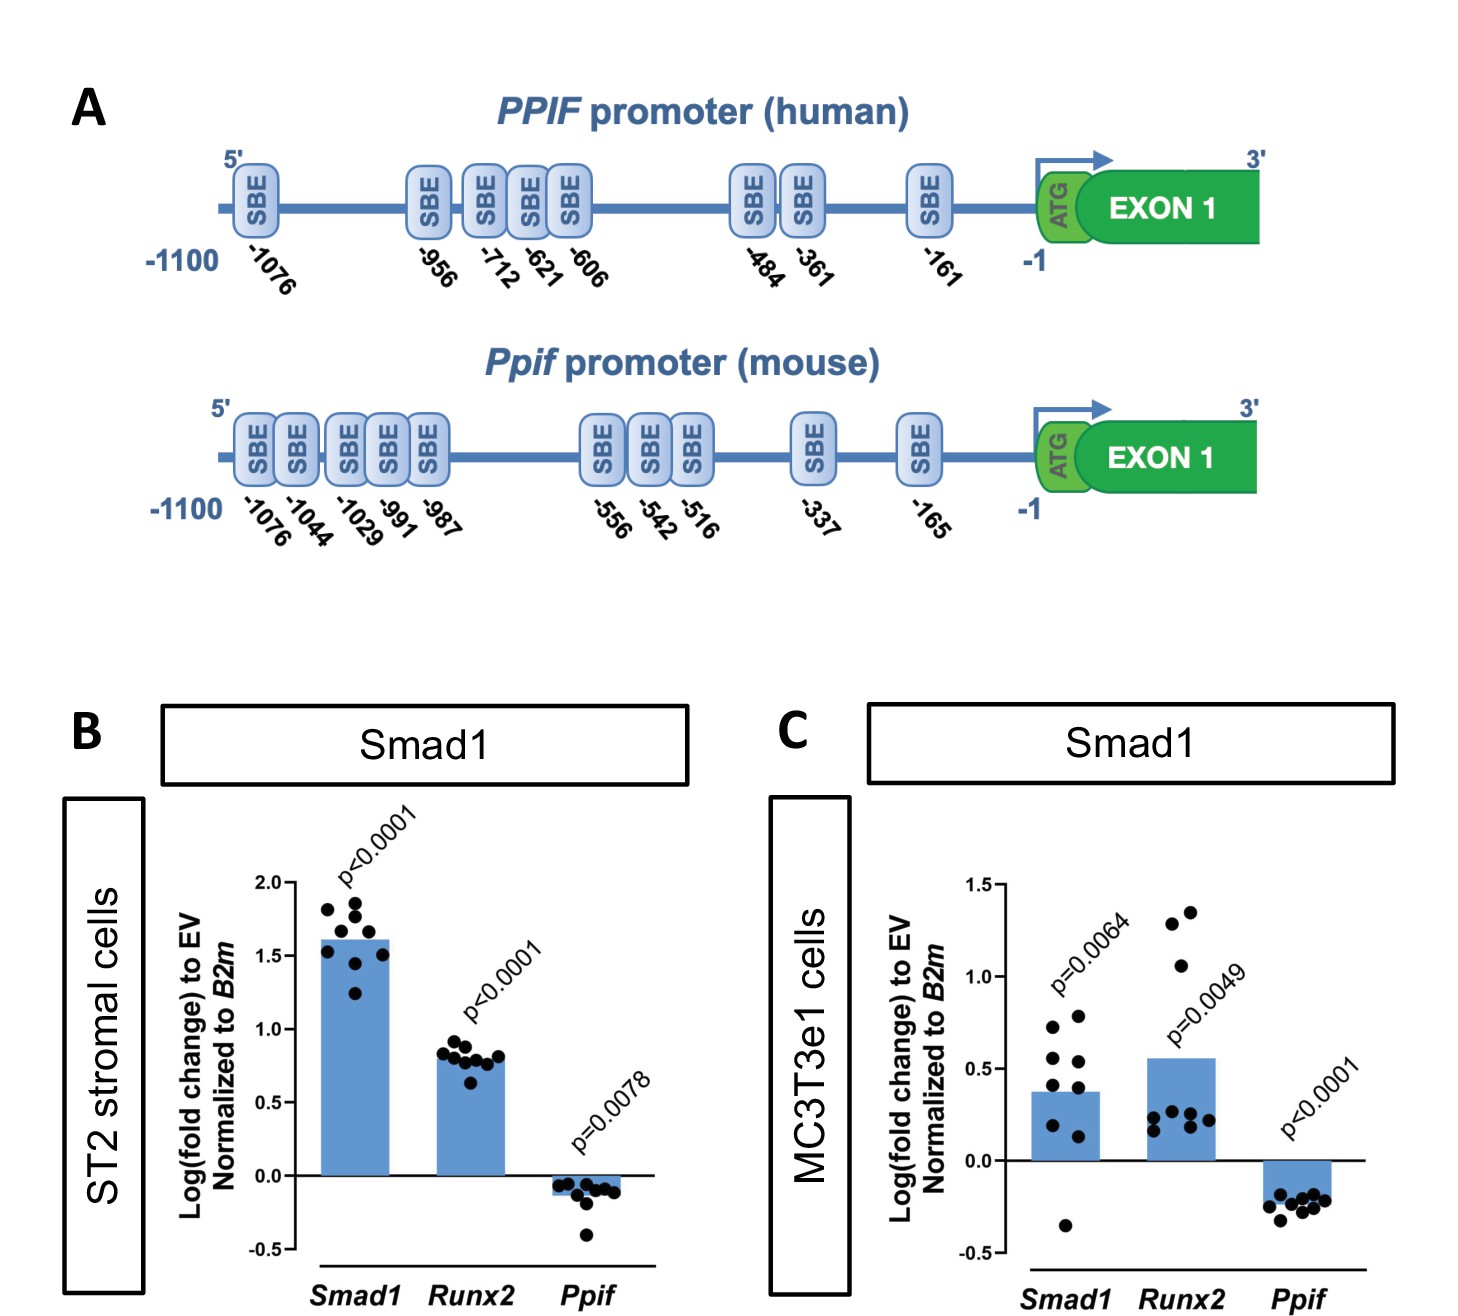
Cyclophilin D (CypD) gene, Ppif, promoter contains multiple Smad-binding elements (SBEs) and Smad1 overexpression leads to downregulation of CypD.
(A) Several SBEs were found on both human (PPIF) and mouse (Ppif) CypD gene promoter. ST2 or MC3T3e1 cells were transfected with pCMV-Smad1 vector or empty vector (EV) control. (B) and (C) Real-time RT-PCR data demonstrating the efficiency of Smad1 transfection and that Smad1 overexpression upregulated Runx2 and downregulated Ppif mRNA expression. Plot shows the actual data points (biological replicates), calculated means and p value vs. EV controls determined by an unpaired t-test.
Figure 2
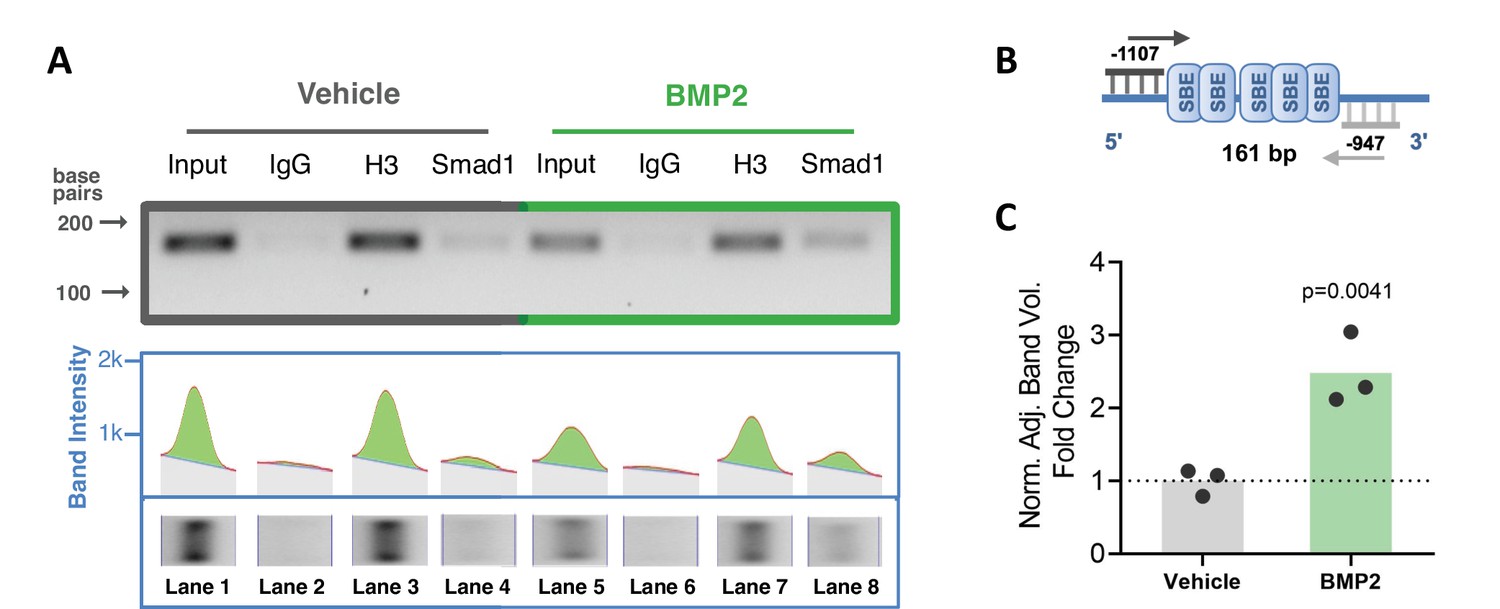
Smad1 binds Ppif promoter and bone morphogenic protein (BMP) signaling promotes Smad1 interaction with Ppif promoter.
Chromatin immunoprecipitation (ChIP) assay of nuclear fractions from ST2 cells incubated either in the presence of 50 ng/ml BMP2 for 24 hr, or vehicle. (A) PCR analysis of the ChIP assay was performed using primers to amplify the distal Smad-binding elements (SBE)-containing region within the Ppif promoter (B) .Positive control histone H3 signal showing that proper DNA fragmentation was achieved (A). (C) Band density quantification for Smad1 immunoprecipitation in both conditions was adjusted by background subtraction and normalized to total DNA input. Unspecific signal from IgG band was also subtracted from Smad1-specific signal. Plot shows the actual data points representing the mean of two technical replicates from three independent experiments, calculated means and p value determined by an unpaired t-test.
-
Figure 2—source data 1
Chromatin immunoprecipitation (ChIP) assay of nuclear fractions from ST2 cells incubated either in the presence of 50 ng/ml bone morphogenic protein 2 (BMP2) for 24 hr, or vehicle.
PCR analysis of the ChIP assay was performed using primers to amplify the distal Smad-binding elements (SBE)-containing region within the Ppif promoter or the positive control Intron2 primers. Original gel image showing three independent experiments and an extra replicate.
- https://cdn.elifesciences.org/articles/75023/elife-75023-fig2-data1-v2.zip
-
Figure 2—source data 2
PCR analysis of the ChIP assay for Smad binding of Ppif promoter.
PCR analysis of the ChIP assay was performed using primers to amplify the distal Smad-binding elements (SBE)-containing region within the Ppif promoter or the positive control Intron2 primers. Labeled gel image. Input: total DNA; IgG: negative control; H3: positive control; Smad1: Smad1 antibody.
- https://cdn.elifesciences.org/articles/75023/elife-75023-fig2-data2-v2.zip
Figure 3 with 1 supplement
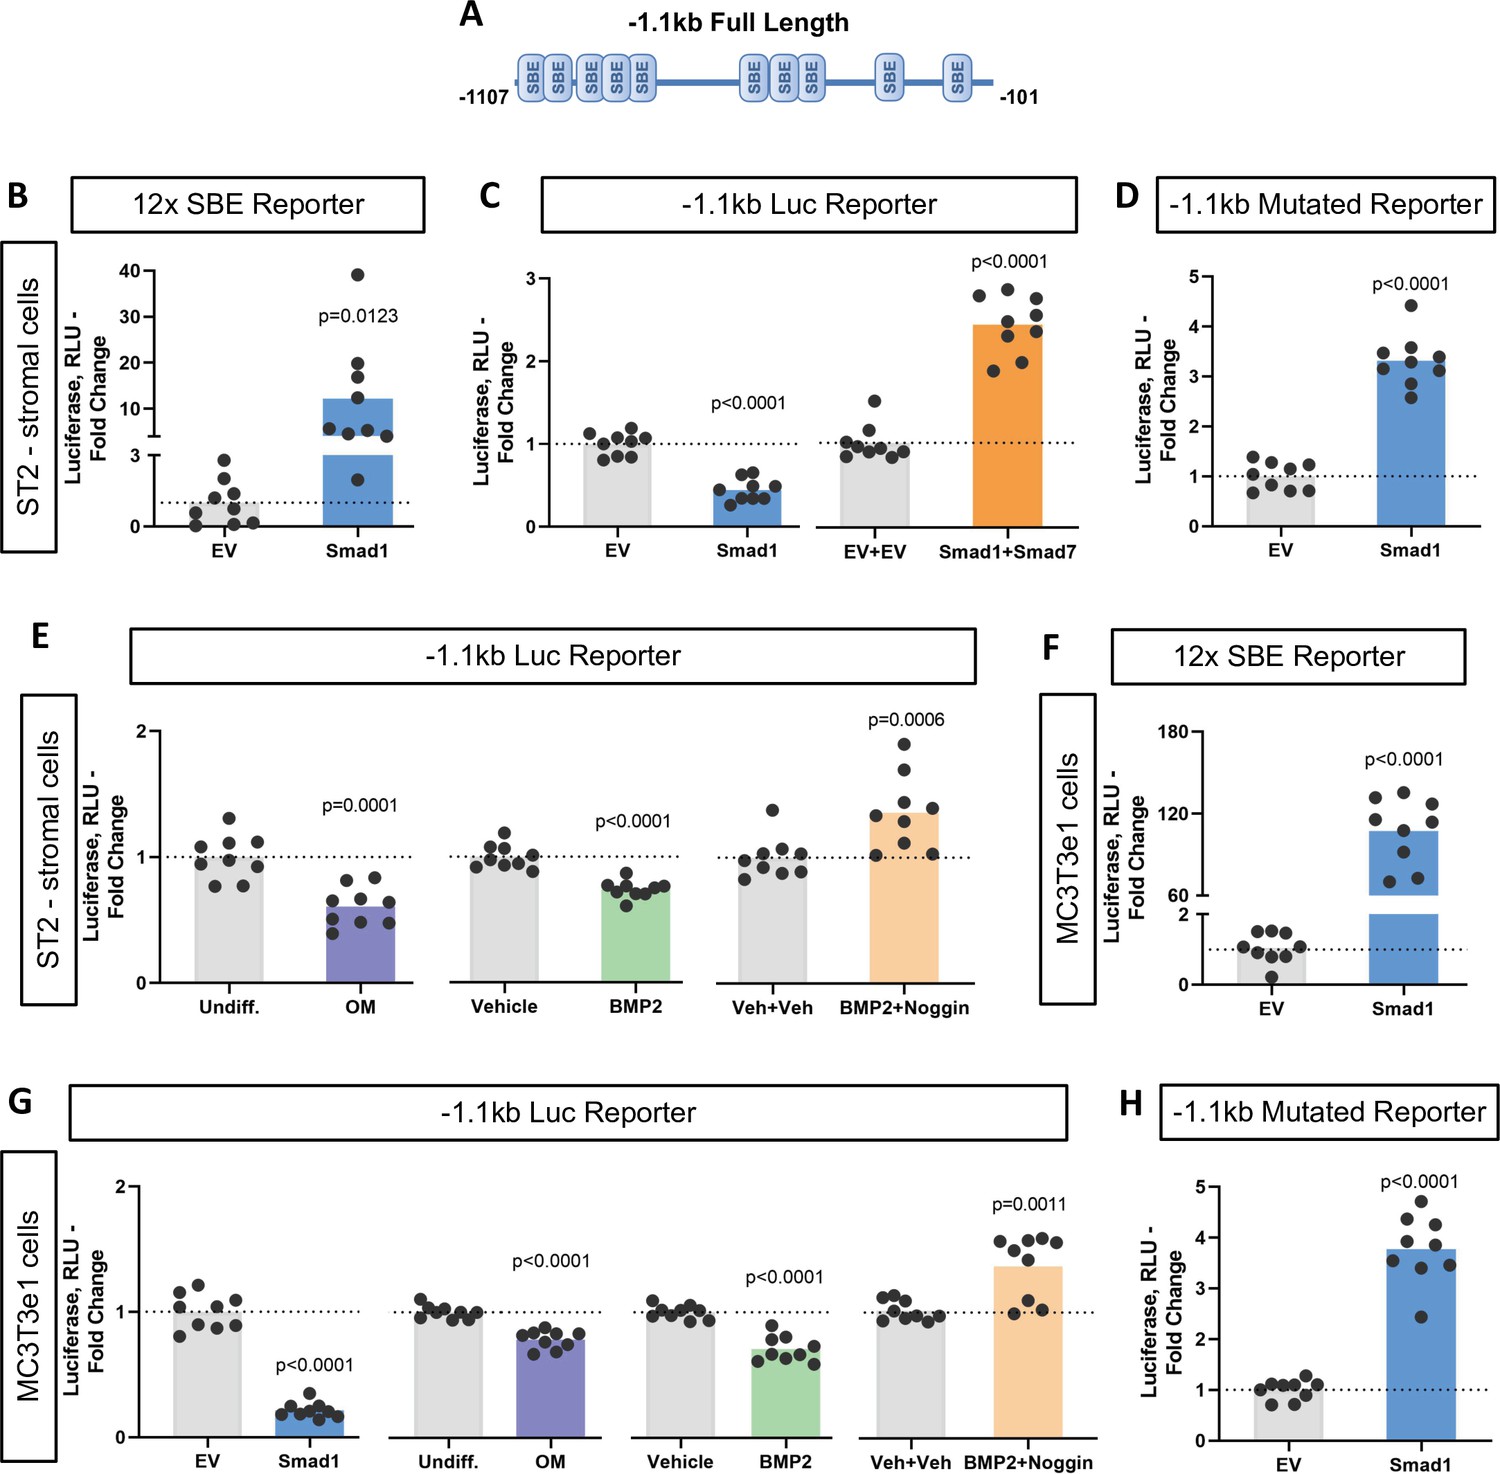
Bone morphogenic protein (BMP)-dependent Smad1 transcriptionally represses Ppif promoter activity.
Dual luciferase reporter assay was performed on either ST2 or MC3T3e1 cells 48 hr after luciferase (Luc) reporter transfection. (A) Diagram: 1.1 kb full-length Ppif promoter region containing several Smad-binding elements (SBEs) was cloned into the pGL4.10 vector. (B) and (F) pCMV-Smad1 co-transfection highly activated the BMP/Smad signaling reporter 12xSBE. (C) pCMV-Smad1 co-transfected with the 1.1 kb Ppif full-length luc reporter downregulated the luciferase signal. Inhibitory Smad7 rescued Ppif promoter activity. (D) and (H) pCMV-Smad1 co-transfected with the 1.1 kb SBE-mutated Ppif full-length luc reporter rescued luciferase signal. (E) Osteogenic media or 50 ng/ml BMP2 was used to activate BMP/Smad signaling. The BMP inhibitor, Noggin, rescued Ppif promoter activity. (G) MC3T3e1 cells showed similar effects on Ppif promoter activity after BMP/Smad signaling activation. Plot shows the actual data points (biological replicates), calculated means and p value vs. EV controls determined by an unpaired t-test.
Figure 3—figure supplement 1
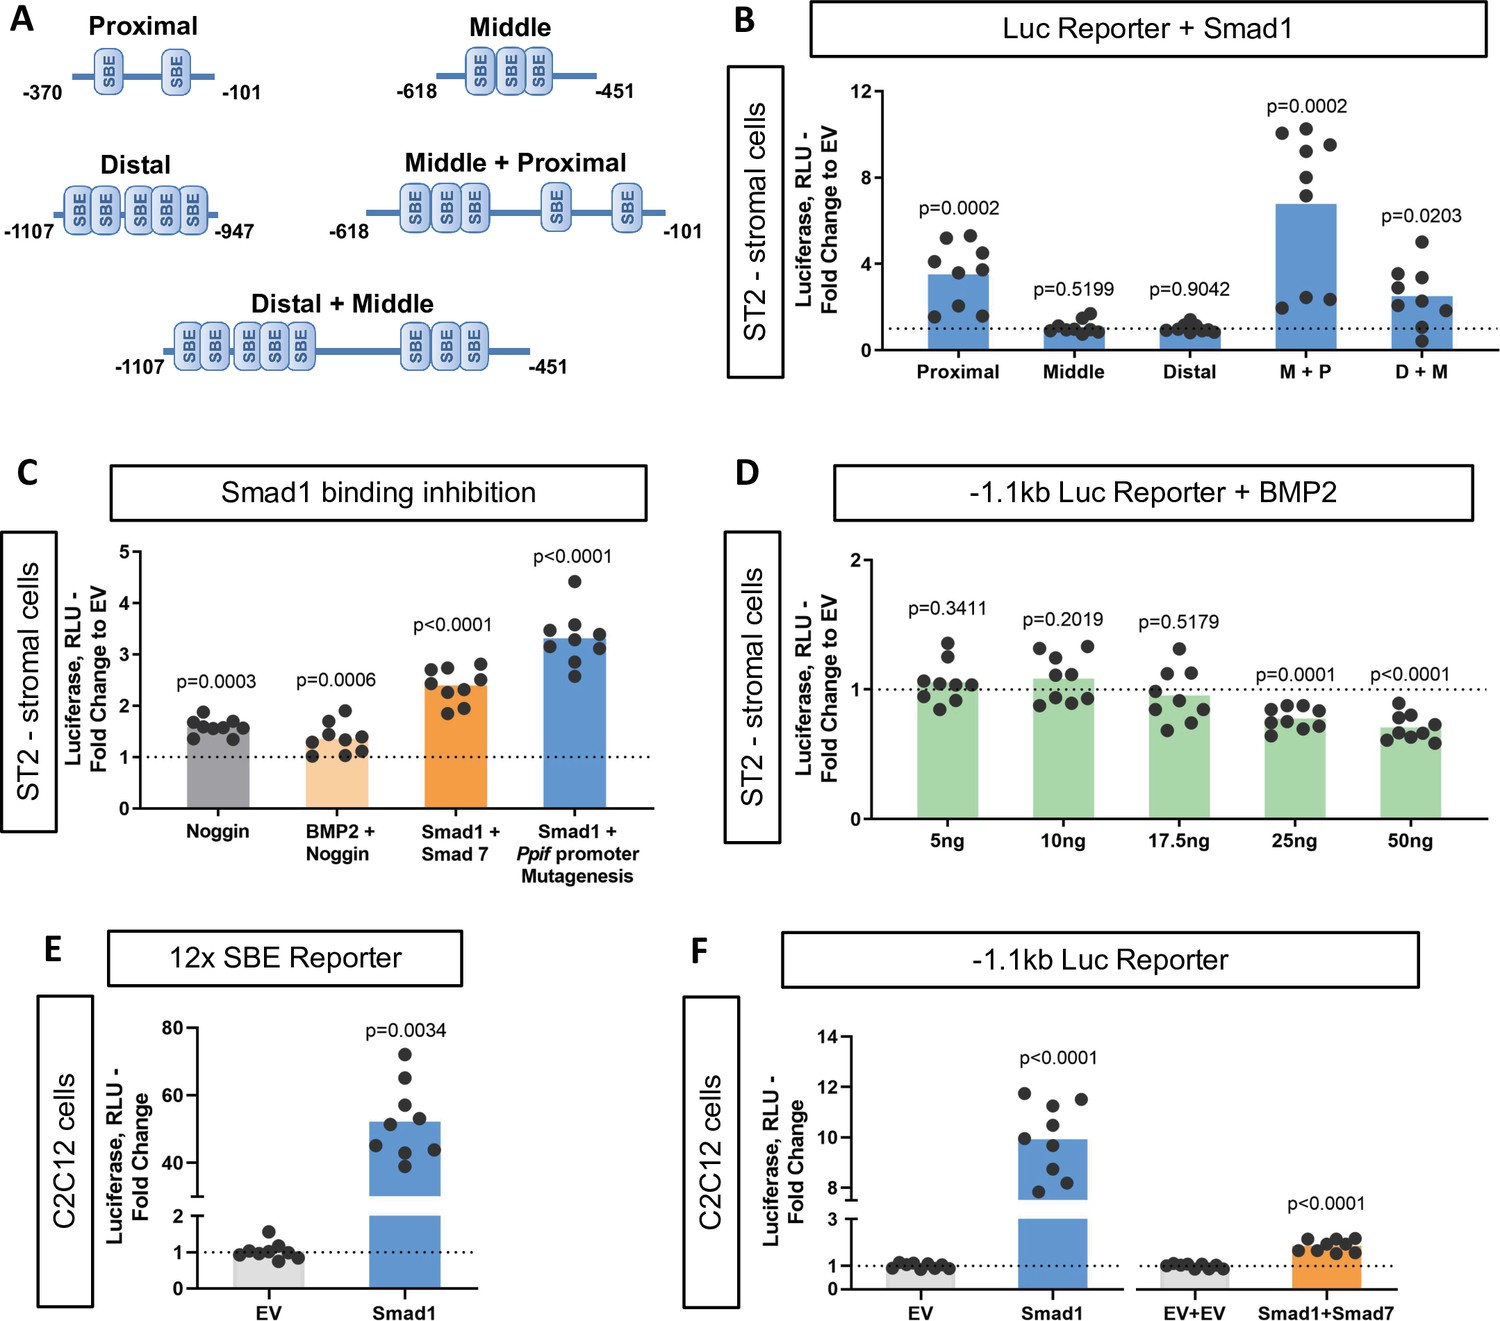
Bone morphogenic protein (BMP)-dependent Smad1 transcriptionally represses only full-length Ppif promoter activity.
Dual luciferase reporter assay was performed on ST2 and C2C12 cells. (A) Diagram: distinct Ppif promoter mutant constructs containing several Smad-binding elements (SBEs) were cloned into the pGL4.10 vector. (B) pCMV-Smad1 was co-transfected with the proximal (P), distal (D), middle (M), M+P, or D+M Ppif luc reporter. (C) BMP-dependent Smad1-binding inhibition rescued Ppif promoter activity using the 1.1 kb Ppif full-length uc reporter. Mutated SBEs in the Ppif promoter showed no affinity to Smad1 rescuing Ppif promoter activity. (D) Dose-response effect of BMP2 treatment in ST2 cells transfected with 1.1 kb Ppif full-length luc reporter. (E) pCMV-Smad1 co-transfection highly activated the BMP/Smad signaling reporter 12xSBE in C2C12 myogenic cells. (F) pCMV-Smad1 co-transfected with the 1.1 kb Ppif full-length luc reporter upregulated the luciferase signal in C2C12 myogenic cells. Inhibitory Smad7 decreased Ppif promoter activity. Plot shows the actual data points (biological replicates), calculated means and p value vs. EV or vehicle controls determined by an unpaired t-test.
Figure 4 with 2 supplements
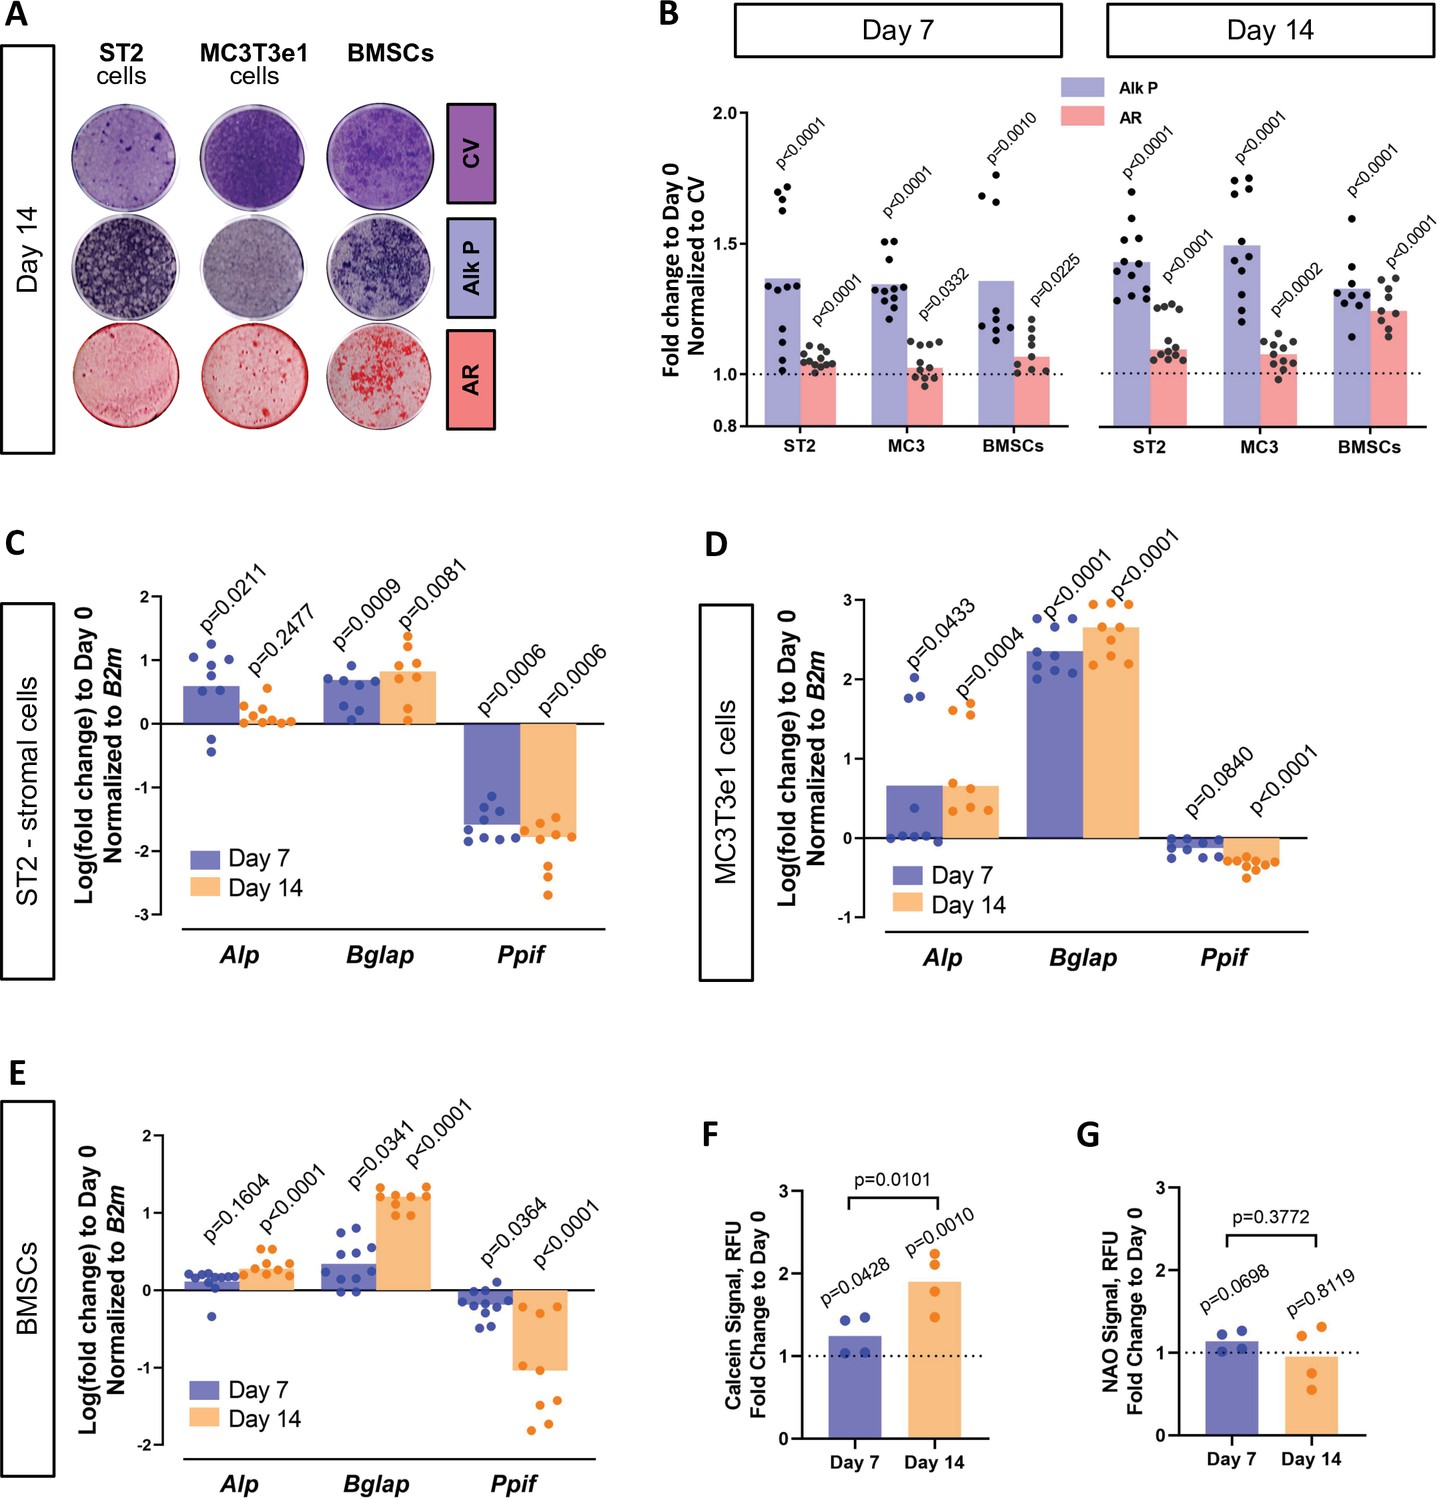
Cyclophilin D (CypD) expression and mitochondrial permeability transition pore (MPTP) activity are downregulated during osteogenic differentiation.
ST2 stromal cells, MC3T3e1, or mouse bone marrow stromal cells (BMSCs) were cultured in osteogenic media; RNA collected, and staining done at day 0, day 7, and day 14. (A) Staining representative image at day 14 for crystal violet (CV) a proxy of total cell content, alkaline phosphatase (Alk P), and alizarin red (AR). (B) Staining quantification confirming osteogenic commitment. (C), (D), and (E) Real-time RT-PCR data: osteogenic markers (Alp and Bglap) are upregulated, whereas Ppif mRNA expression is downregulated. (F) BMSCs subjected to calcein-cobalt assay showed decreased MPTP activity upon osteogenic differentiation. (G) BMSCs stained with nonyl acridine orange (NAO) show no difference in mitochondrial mass. Plot shows the actual data points (biological replicates), calculated means, and p value vs. D0 determined by an unpaired t-test.
Figure 4—figure supplement 1
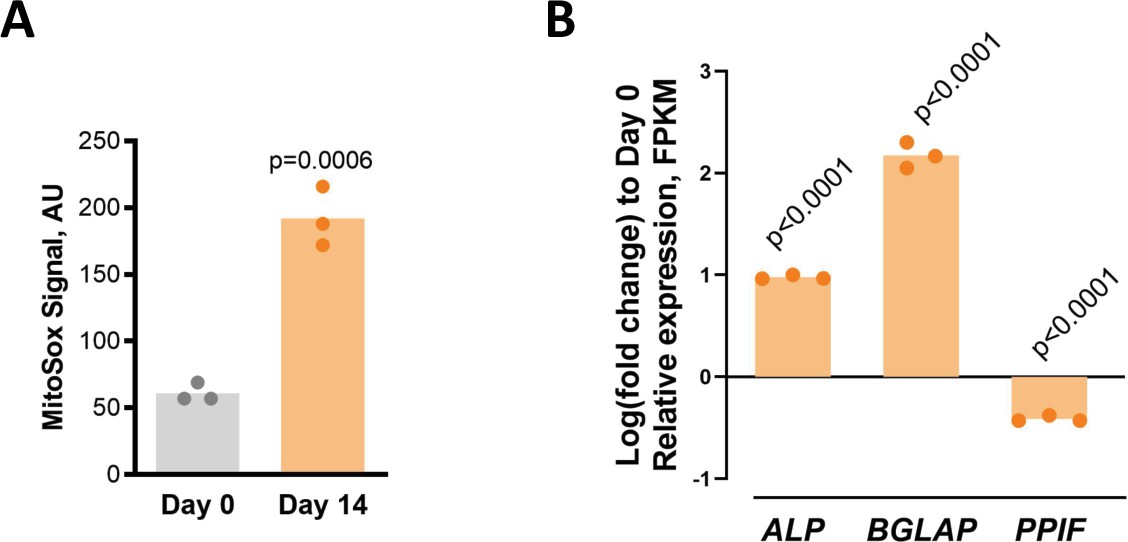
Human bone marrow stromal cell (BMSC) osteogenic differentiation increases mitochondrial ROS while downregulating PPIF relative expression.
Human BMSCs were cultured in osteogenic media. RNAseq was performed and MitoSox mitochondrial ROS staining done at day 0 and 14. (A) D14 differentiated osteoblasts (OBs) show increased ROS production compared to D0 undifferentiated BMSCs. (B) RNAseq data shows downregulation of cyclophilin D (CypD) gene PPIF relative expression in osteoinduced human BMSCs, confirmed by ALP, and BGLAP osteogenic markers, when compared to undifferentiated cells. Plot shows the actual data points from three independent samples/experiments, calculated means, and p value determined by an unpaired t-test.
Figure 4—figure supplement 2
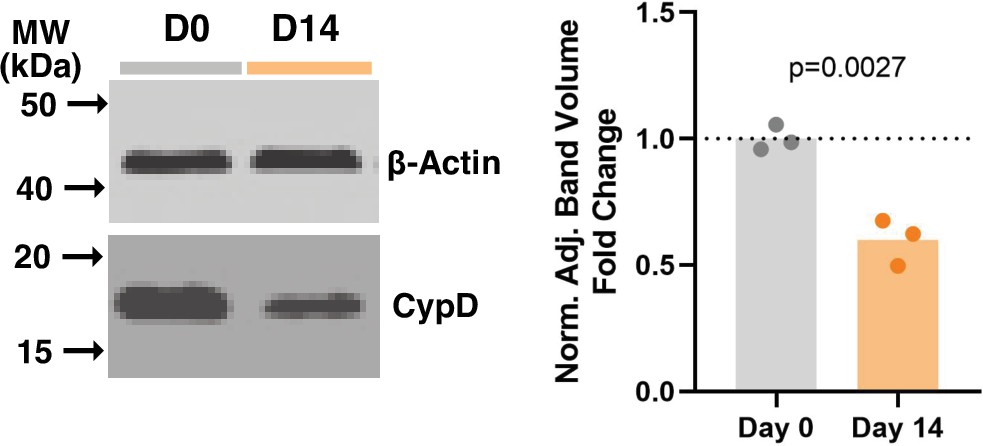
Mouse bone marrow stromal cells (BMSCs) osteogenic differentiation downregulates cyclophilin D (CypD) protein expression.
Mouse BMSCs were cultured in osteogenic media and protein lysates collected at day 0 and day 14. Shown is the western blot (representative of 3) and band density quantification demonstrating decreased CypD protein level for osteoinduced vs. undifferentiated BMSCs. Plot shows the actual data points, calculated means, and p value determined by an unpaired t-test.
-
Figure 4—figure supplement 2—source data 1
Mouse bone marrow stromal cells (BMSCs) were cultured in osteogenic media and protein lysates collected at day 0 and day 14.
Shown is the original western blot image probed for B-actin and cyclophilin D (CypD) (representative of 3).
- https://cdn.elifesciences.org/articles/75023/elife-75023-fig4-figsupp2-data1-v2.zip
Figure 5 with 1 supplement
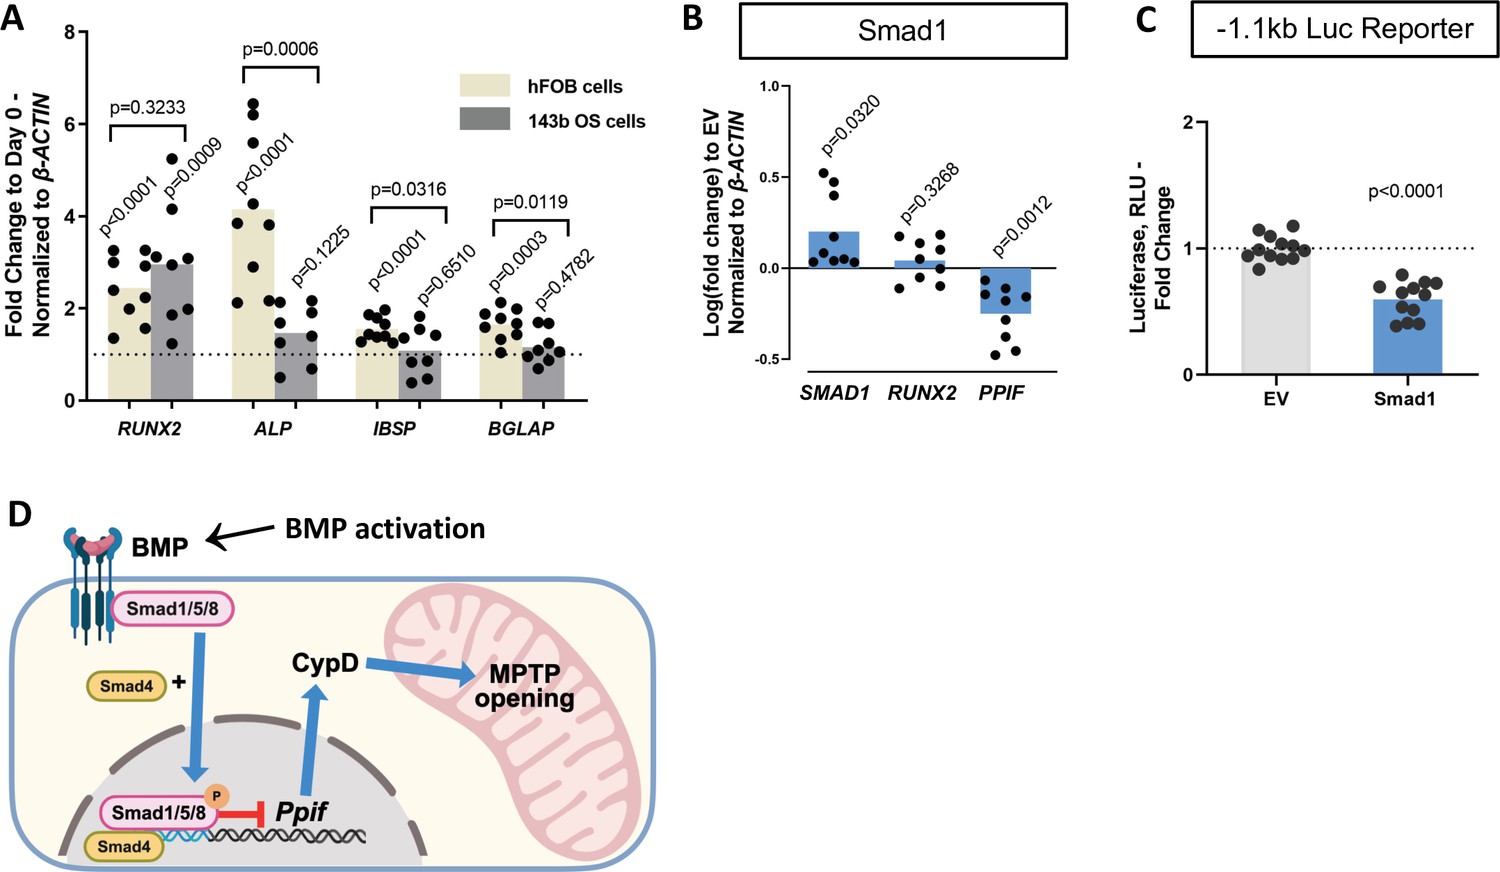
Smad1-mediated CypD/Ppif repression is not dependent on signaling downstream of BMP/Smad.
Immortalized human osteoblastic cells (hFOB) or osteosarcoma cells (143b) were treated with 50 ng BMP2 for 5 days to induce osteogenic differentiation. BMP2 induced early (RUNX2) but not late (IBSP, BGLAP) OB markers in 143b-OS cells, reflecting differentiation-arrested phenotype. (B) Real-time RT-PCR data demonstrating the efficiency of Smad1 transfection and that Smad1 overexpression downregulated Ppif mRNA expression in 143b cells. (C) pCMV-Smad1 co-transfected with the –1.1 kb Ppif full-length luc reporter downregulated the luciferase signal. (D) Schematic representation of our summary of results. To maintain bone marrow stromal cell (BMSC) commitment to the osteogenic lineage, closure of the mitochondrial permeability transition pore (MPTP) is required, which is achieved by CypD downregulation through Smad1 transcriptional repression of Ppif gene. Plots show the actual data points (biological replicates), calculated means, and p value vs. D0 (A) or empty vector (EV) controls (B) determined by an unpaired t-test. BMP, bone morphogenic protein; CypD, cyclophilin D.
Figure 5—figure supplement 1
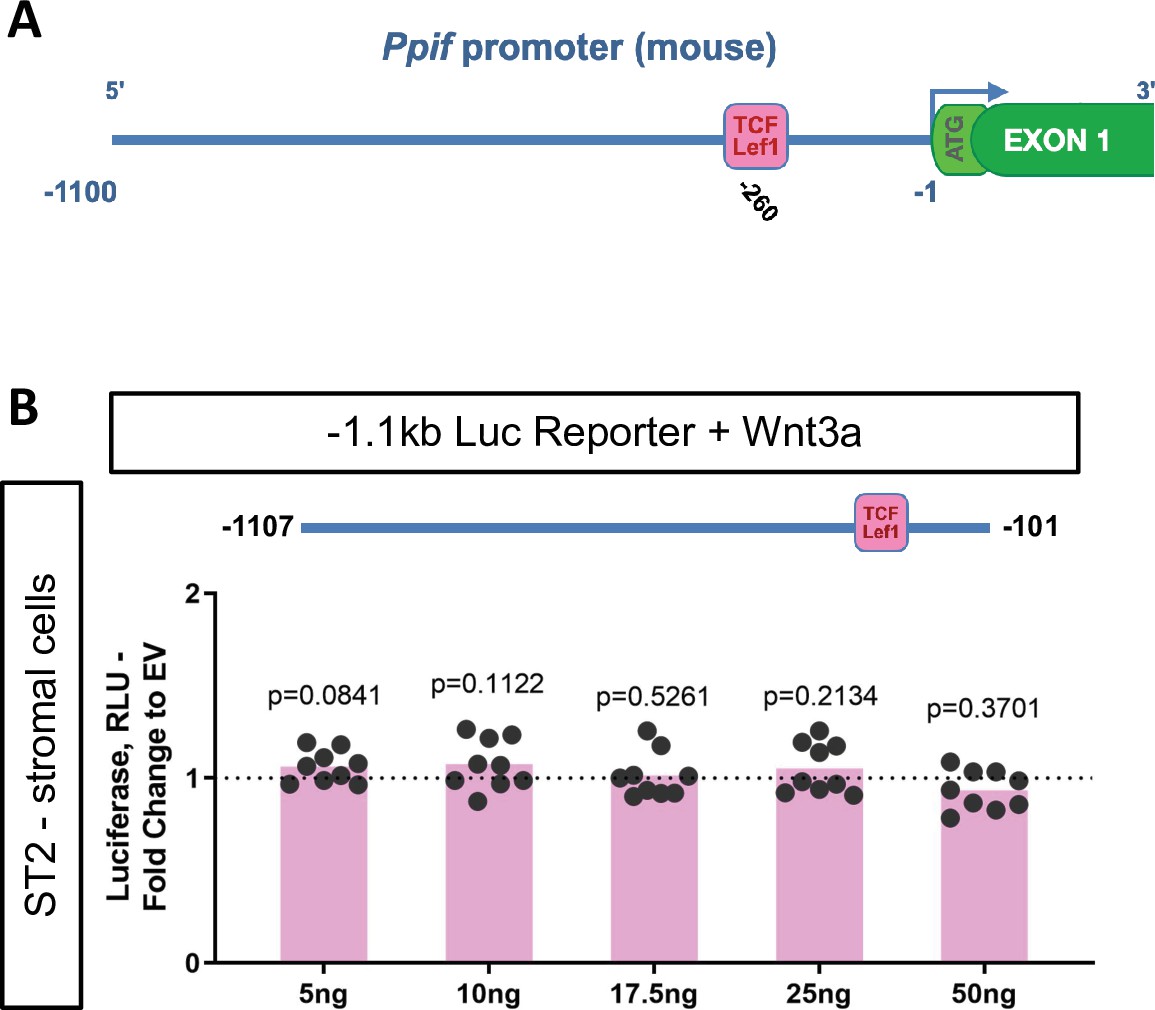
Wnt-activated TCF/Lef1 binding site has no effect on Ppif promoter activity.
(A) Diagram: 1.1 kb full-length Ppif promoter region containing TCF/Lef1 (Wnt) binding element. (B) Dose-response treatment using Wnt3a in ST2 cells transfected with 1.1 kb Ppif full-length luc reporter showed no effect on Ppif activity. Plot shows the actual data points (biological replicates), calculated means, and p value vs. vehicle control determined by an unpaired t-test.
Figure 6 with 1 supplement

Cyclophilin D (CypD) re-expression and gain-of-function impair osteogenic differentiation and mitochondrial function.
MC3T3e1 were stably transfected cells with pCMV6-caPpif vector to express constitutively active CypD K166Q mutant and thus achieve CypD gain-of-function (GOF). Bone marrow stromal cells (BMSCs) from either osteoblast (OB)-specific, inducible 2.3 kb Col1CreERt2;R26caPpif/+ mice or R26caPpif/+ mice were cultured in osteogenic media for 11–14 days. (A) Representative western blot of stably transfected MC3T3e1 cells (EV: pCMV6-empty vector; KQ: pCMV6- caPpif vector; VDAC1: loading control; caCypD: mutant CypD; CypD: endogenous CypD). (B) and (F) Real-time RT-PCR data of osteogenic markers: CypD GOF MC3T3 cells and OB-specific, inducible 2.3 kb Col1CreERt2;R26caPpif/+ BMSCs were incapable to complete OB differentiation. (C) Diagram showing the caPpif mouse transgene construct. Images show eGFP signal in cell culture confirming recombination induced in vitro. (D) Representative western blot of BMSCs from 2.3 kb Col1CreERt2;R26caPpif/+ mice. (E) Staining representative image at day 14 for crystal violet, alkaline phosphatase, and alizarin red: CypD GOF (tamoxifen-induced Cre+) BMSCs showed decreased OB activity and mineralization capacity. (G) Representative images from R26caPpif/+ BMSCs infected with adeno-Cre virus, culture in osteogenic media during 11 days. (H) and (J) Osteoinduced R26caPpif/+ BMSCs infected with adeno-Cre collected at day 0 or day 11 showed decreased TMRE ΔF signal for infected (Cre+) cells compared to non-infected (Cre-) cells. (I) and (K) Osteoinduced R26caPpif/+ BMSCs infected with adeno-eGFP collected at day 0 or day 11 showed no difference in TMRE ΔF signal between infected (Cre+) and non-infected (Cre-) cells. Plot shows the actual data points (biological replicates), calculated means, and p value vs. D0 (B, F) or Cre- (H–K) controls determined by an unpaired t-test.
-
Figure 6—source data 1
Original western blot image of stably transfected MC3T3e1 cells probed for cyclophilin D (CypD).
- https://cdn.elifesciences.org/articles/75023/elife-75023-fig6-data1-v2.zip
-
Figure 6—source data 2
Labeled western blot image of stably transfected MC3T3e1 cells probed for cyclophilin D (CypD) (EV: pCMV6-empty vector; KQ: pCMV6-caPpif vector; caCypD: mutant CypD; CypD: endogenous CypD).
- https://cdn.elifesciences.org/articles/75023/elife-75023-fig6-data2-v2.zip
-
Figure 6—source data 3
Original western blot image of stably transfected MC3T3e1 cells probed for VDAC1.
- https://cdn.elifesciences.org/articles/75023/elife-75023-fig6-data3-v2.zip
-
Figure 6—source data 4
Labeled western blot image of stably transfected MC3T3e1 cells probed for VDAC1 (EV: pCMV6-empty vector; KQ: pCMV6-caPpif vector; VDAC1: loading control).
- https://cdn.elifesciences.org/articles/75023/elife-75023-fig6-data4-v2.zip
-
Figure 6—source data 5
Bone marrow stromal cells (BMSCs) from either osteoblast (OB)-specific, inducible 2.3 kb Col1CreERt2;R26caPpif/+ mice or R26caPpif/+ mice were cultured in osteogenic media for 11–14 days.
(A) Original western blot image of BMSCs from 2.3 kb Col1CreERt2;R26caPpif/+ mice.
- https://cdn.elifesciences.org/articles/75023/elife-75023-fig6-data5-v2.zip
-
Figure 6—source data 6
Bone marrow stromal cells (BMSCs) from either osteoblast (OB)-specific, inducible 2.3 kb Col1CreERt2;R26caPpif/+ mice or R26caPpif/+ mice were cultured in osteogenic media for 11–14 days.
(A) Labeled western blot image of BMSCs from 2.3 kb Col1CreERt2;R26caPpif/+ mice (VDAC1: loading control; caCypD: mutant CypD; CypD: endogenous CypD).
- https://cdn.elifesciences.org/articles/75023/elife-75023-fig6-data6-v2.zip
Figure 6—figure supplement 1
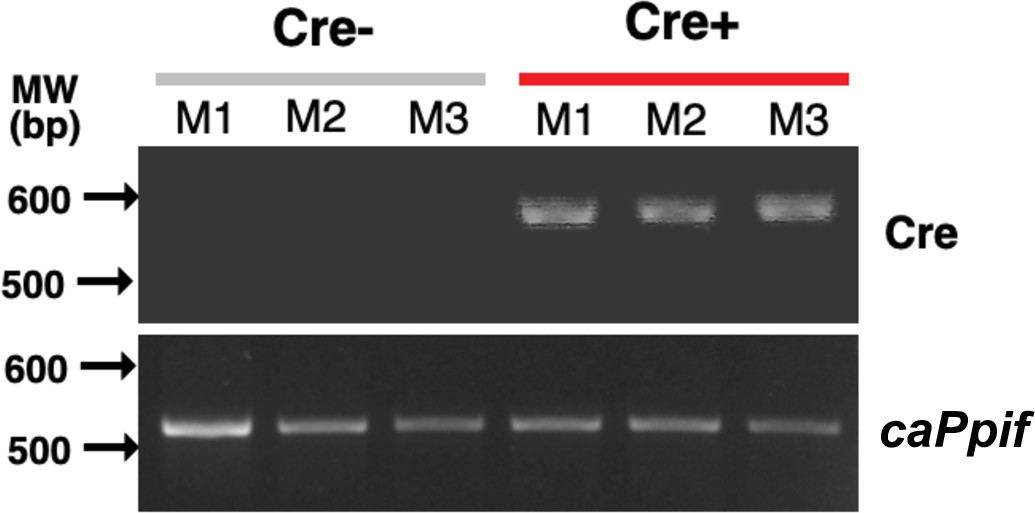
Cyclophilin D (CypD) gain-of-function (GOF) mice genotyping.
F1 generation for osteoblast (OB)-specific inducible 2.3 kb Col1CreERt2;R26caPpif/+ mice were genotyped to confirm the presence of caCypD (K166Q mutant) insert. Cre primer was used to allocate control and experimental groups. Electrophoresed gel shows DNA target amplified from three independent mice per group: Cre- control and Cre+ experimental mice.
-
Figure 6—figure supplement 1—source data 1
F1 generation for osteoblast (OB)-specific inducible 2.3 kb Col1CreERt2;R26caPpif/+ mice genotyping.
- https://cdn.elifesciences.org/articles/75023/elife-75023-fig6-figsupp1-data1-v2.zip
-
Figure 6—figure supplement 1—source data 2
F1 generation for osteoblast (OB)-specific 2.3 kb Col1CreERt2;R26caPpif/+ mice genotyping.
Cre primer was used to allocate control and experimental groups. Labeled electrophoresed gel image shows DNA target amplified for Cre from three independent mice per group: Cre- control and Cre+ experimental mice.
- https://cdn.elifesciences.org/articles/75023/elife-75023-fig6-figsupp1-data2-v2.zip
-
Figure 6—figure supplement 1—source data 3
F1 generation for osteoblast (OB)-specific 2.3 kb Col1CreERt2;R26caPpif/+ mice were genotyped to confirm the presence of caCypD (K166Q) insert.
Original electrophoresed gel image shows DNA target amplified for mutant CypD gene (caCypD) from three independent mice group: Cre- control and Cre+ experimental mice.
- https://cdn.elifesciences.org/articles/75023/elife-75023-fig6-figsupp1-data3-v2.zip
-
Figure 6—figure supplement 1—source data 4
F1 generation for osteoblast (OB)-specific inducible 2.3 kb Col1CreERt2;R26caPpif/+ mice were genotyped to confirm the presence of caCypD (K166Q) insert.
Labeled electrophoresed gel image shows DNA target amplified for mutant CypD gene (caCypD) from three independent mice group: Cre- control and Cre+ experimental mice.
- https://cdn.elifesciences.org/articles/75023/elife-75023-fig6-figsupp1-data4-v2.zip
Figure 7 with 3 supplements
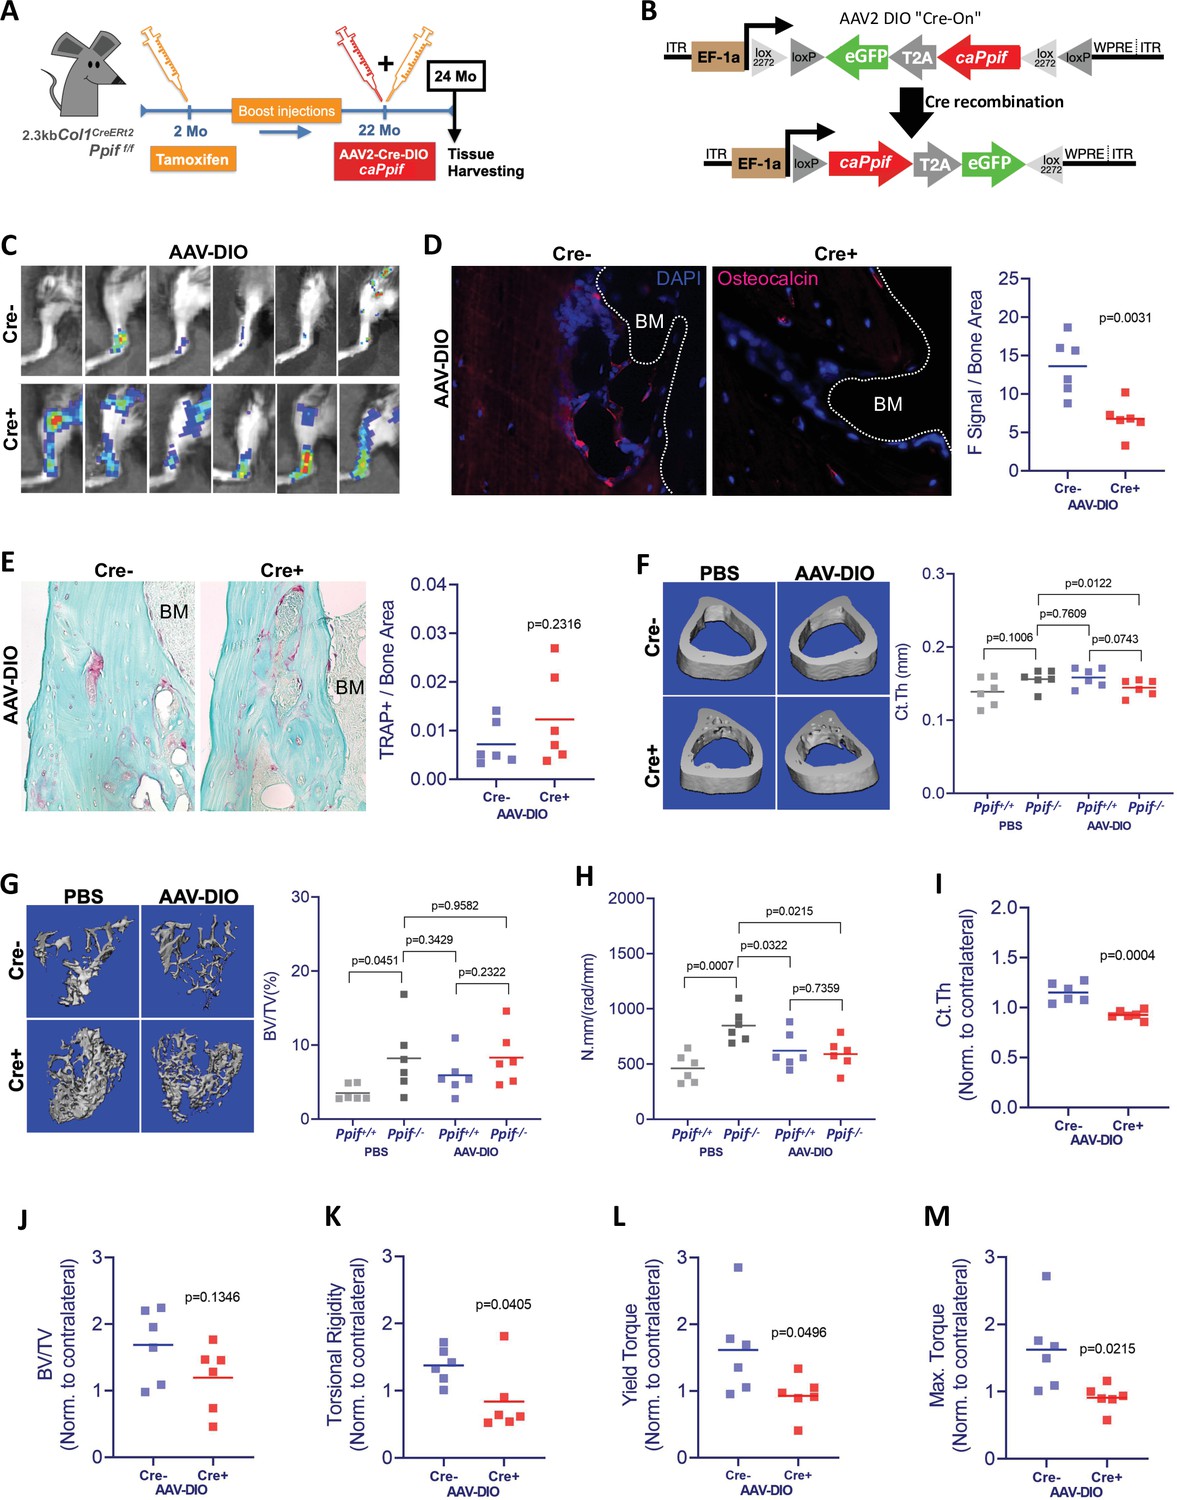
Cyclophilin D (CypD) re-expression and gain-of-function in vivo decreases bone mechanical properties.
(A) Experimental design: CypD deletion was induced in 2-month-old OB-specific inducible (2.3 kb Col1CreERt2;Ppiff/f) CypD loss-of-function (LOF) mice. Virus intra-bone marrow injection performed in the right tibia at 22 months. (B) Diagram showing the AAV2-Cre-DIO-caPpif-eGFP construct. The gene of interest is inserted in the vector in antisense orientation and is flanked by double floxed sites. In cells expressing Cre recombinase, the gene of interest and eGFP reporter are flipped and ‘turned-on’. (C) eGFP signal captured by IVIS in vivo confirming the successful viral infection and recombination in the tibia of Cre+ mice 2 months after intra-bone marrow injection; CypD re-expression decreased osteocalcin immunofluorescence signal (D) but it did not change osteoclast activity measured by tartrate-resistant acid phosphatase (TRAP) staining (E) (BM: bone marrow). Bone volumes and biomechanical properties of CypD deletion and CypD re-expressing bones were measured by micro-computed tomography (μCT) and a torsion test, respectively. CypD conditional deletion did not affect cortical thickness (F) however, it showed protective effect against trabecular bone volume loss in aging (G) and improved torsional rigidity (H) (PBS: Ppif+/+ X Ppif-/-). For analysis of bones with AAV-DIO-delivered CypD re-expression, data was normalized to the contralateral PBS-injected limb to account for differences in bone phenotype between animals. Cre+ mice showed decreased bone volumetric parameters and mechanical properties when compared to Cre- mice. (I) Cortical thickness (Ct Th). (J) Bone over total volume (BV/TV). (K) Torsional rigidity. (L) Yield torque. (M) Maximum torque. Plots show the actual data points from six independent mice per group, calculated means, and p value determined by an unpaired t-test. Paired t-test was used when left and right tibia from the same mouse were compared. Specimens' genotype guide: PBS_Ppif+/+: wild type; PBS_Ppif-/-: CypD conditional KO; AAV-DIO_Ppif+/+: wild type caCypD rescue; AAV-DIO_Ppif-/-: CypD conditional KO caCypD rescue.
Figure 7—figure supplement 1
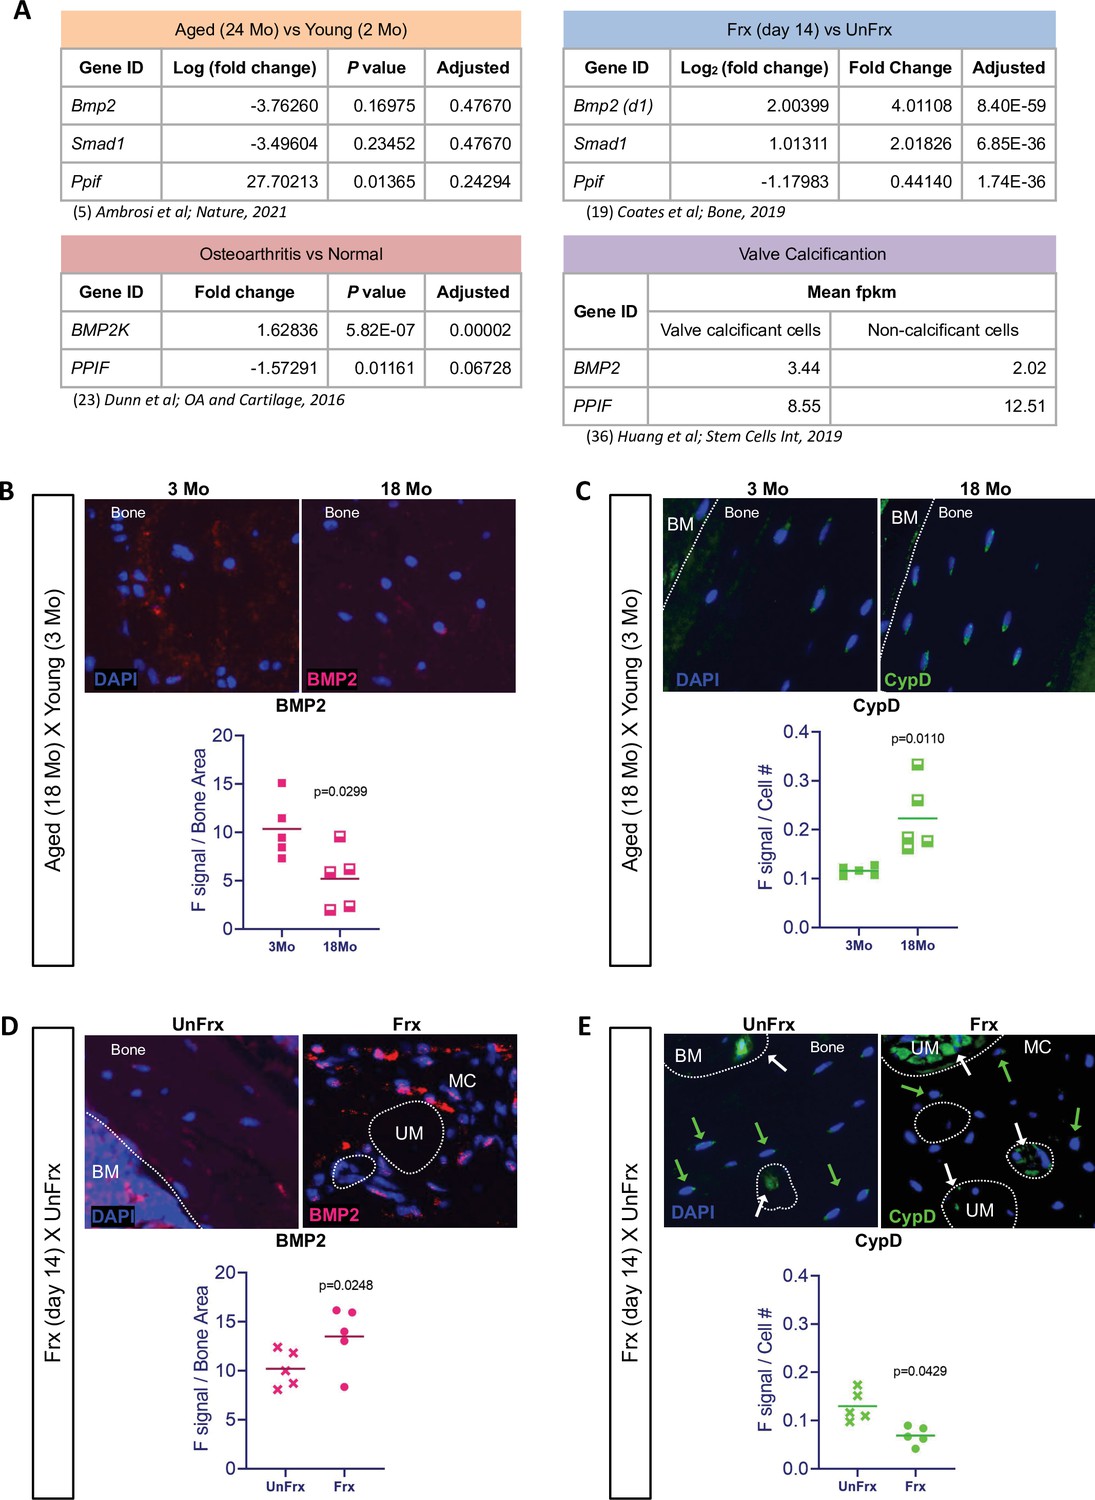
Physiological role of PPIF transcriptional regulation controlled by BMP/Smad signaling.
(A) Tables presenting unmodified RNAseq data from four different studies. Physiological and pathological conditions related to osteogenesis or mineralization outcomes show inverse correlation between BMP signaling and PPIF expression (Frx: fractured, UnFrx: unfractured, d1: day 1 post-fracture). (B) and (C) Secondary immunofluorescence comparing bones from aged (18-month-old) vs. young (3-month-old) mice; or (D) and (E) post-fracture callus at day 14 vs. unfractured tibiae confirming the inverse correlation between BMP2 and cyclophilin D (CypD) levels in vivo (BM: bone marrow, MC: mineralized callus, UM: unmineralized matrix). Note the higher CypD levels in undifferentiated cells (white arrows) compared to osteoblasts (OBs) in the mineralized matrix (green arrows) in the callus, confirming our in vitro results described in Figure 4. Plot shows the actual data points from five independent mice, calculated means, and p value determined by an unpaired t-test. Paired t-test was used when left (UnFrx) and right (Frx) tibia from the same mouse were compared. BMP, bone morphogenic protein.
Figure 7—figure supplement 2
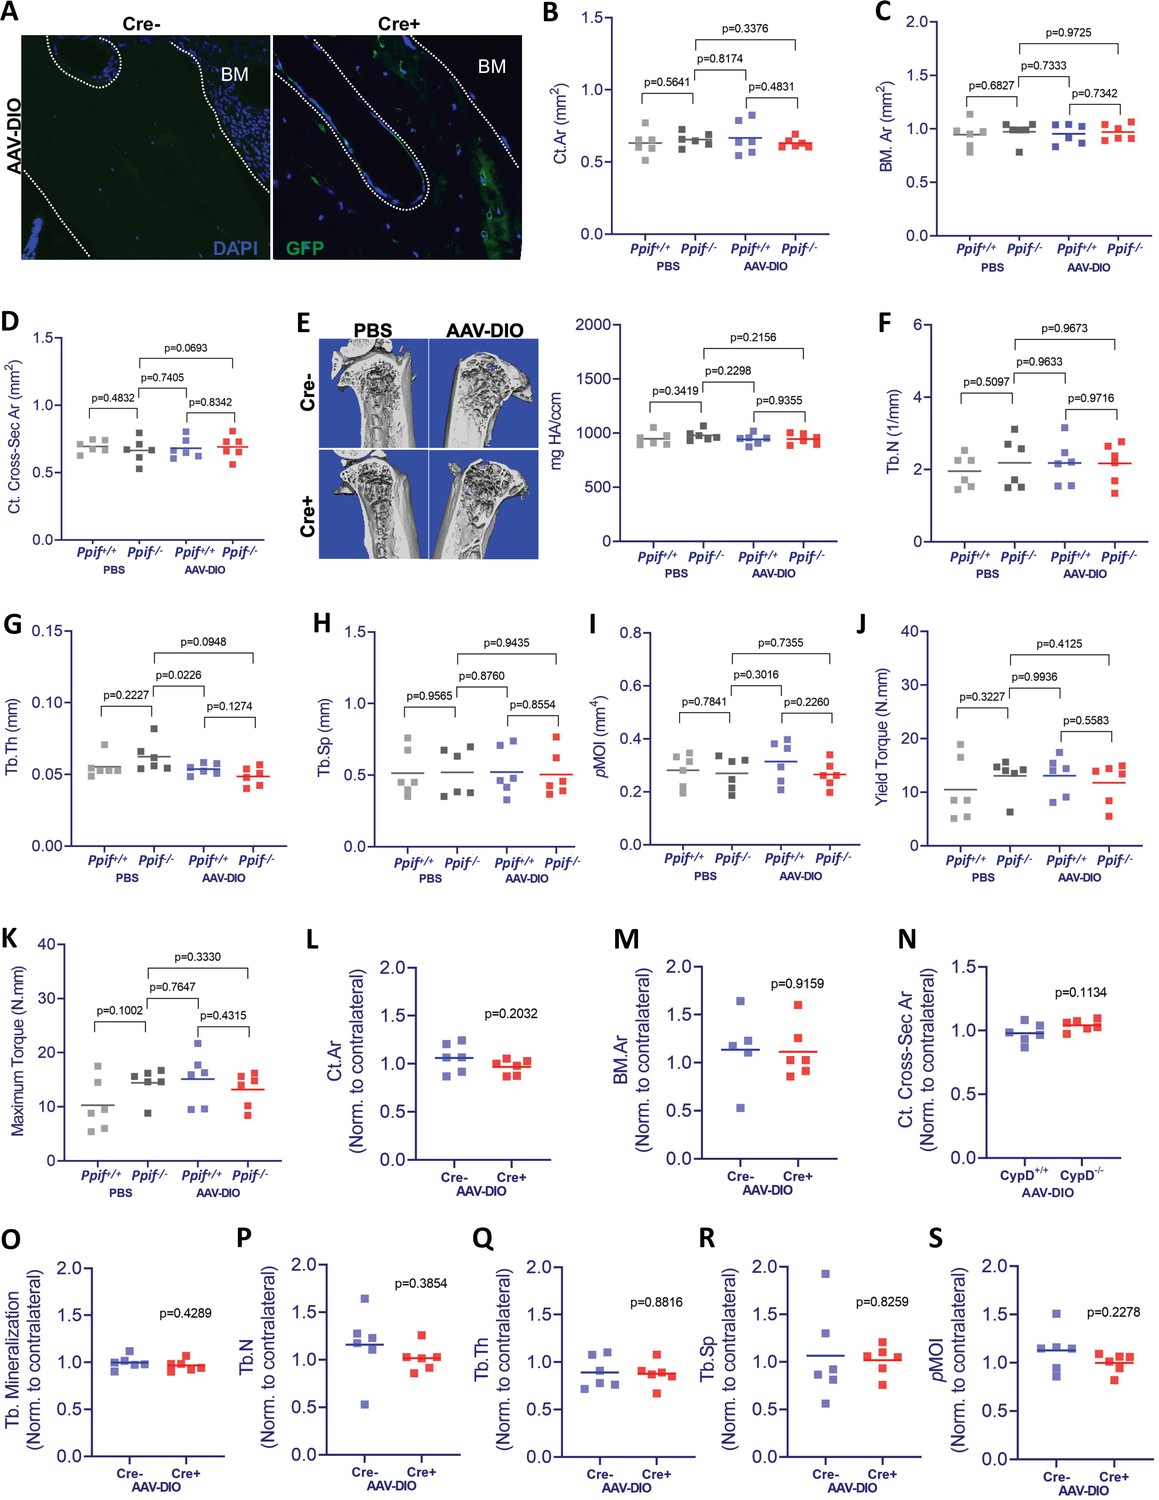
Bone volumetric parameters and biomechanical properties in mice with osteoblast-specific cyclophilin D (CypD) conditional deletion with or without CypD re-expression.
(A) Immunofluorescence eGFP signal confirming the successful viral infection and recombination in the tibia of Cre+ mice 2 months after intra-bone marrow injection (BM: bone marrow). Bone volumetric and biomechanical properties of 2.3 kb Col1CreERt2;Ppiff/f mice with or without CypD re-expression were measured by micro-computed tomography (μCT) and a torsion test, respectively. No differences on the following bone morphological and biomechanical parameters were found between groups – non-normalized data: (B) cortical area; (C) bone marrow area; (D) cortical cross-sectional area; (E) trabecular bone mineralization density; (F) trabecular number; (G) trabecular thickness; (H) trabecular space; (I) polar moment of inertia; (J) yield torque; (K) maximum torque. For analysis of bones with AAV-DIO-delivered CypD re-expression, data was normalized to the contralateral PBS-injected limb to account for differences in bone phenotype between animals. No differences on the following bone morphological parameters were found between Cre- and Cre+ mice – normalized data: (L) cortical area; (M) bone marrow area; (N) cortical cross-sectional area; (O) trabecular bone mineralization density; (P) trabecular number; (Q) trabecular thickness; (R) trabecular space; (S) polar moment of inertia. Plot shows the actual data points, calculated means, and p value determined by an unpaired t-test. Paired t-test was used when left and right tibia from the same mouse were compared. Specimens' genotype guide: PBS_Ppif+/+: wild type; PBS_ Ppif-/-: CypD conditional KO; AAV-DIO_ Ppif+/+: wild type caCypD rescue; AAV-DIO_ Ppif-/-: CypD conditional KO caCypD rescue.
Figure 7—figure supplement 3
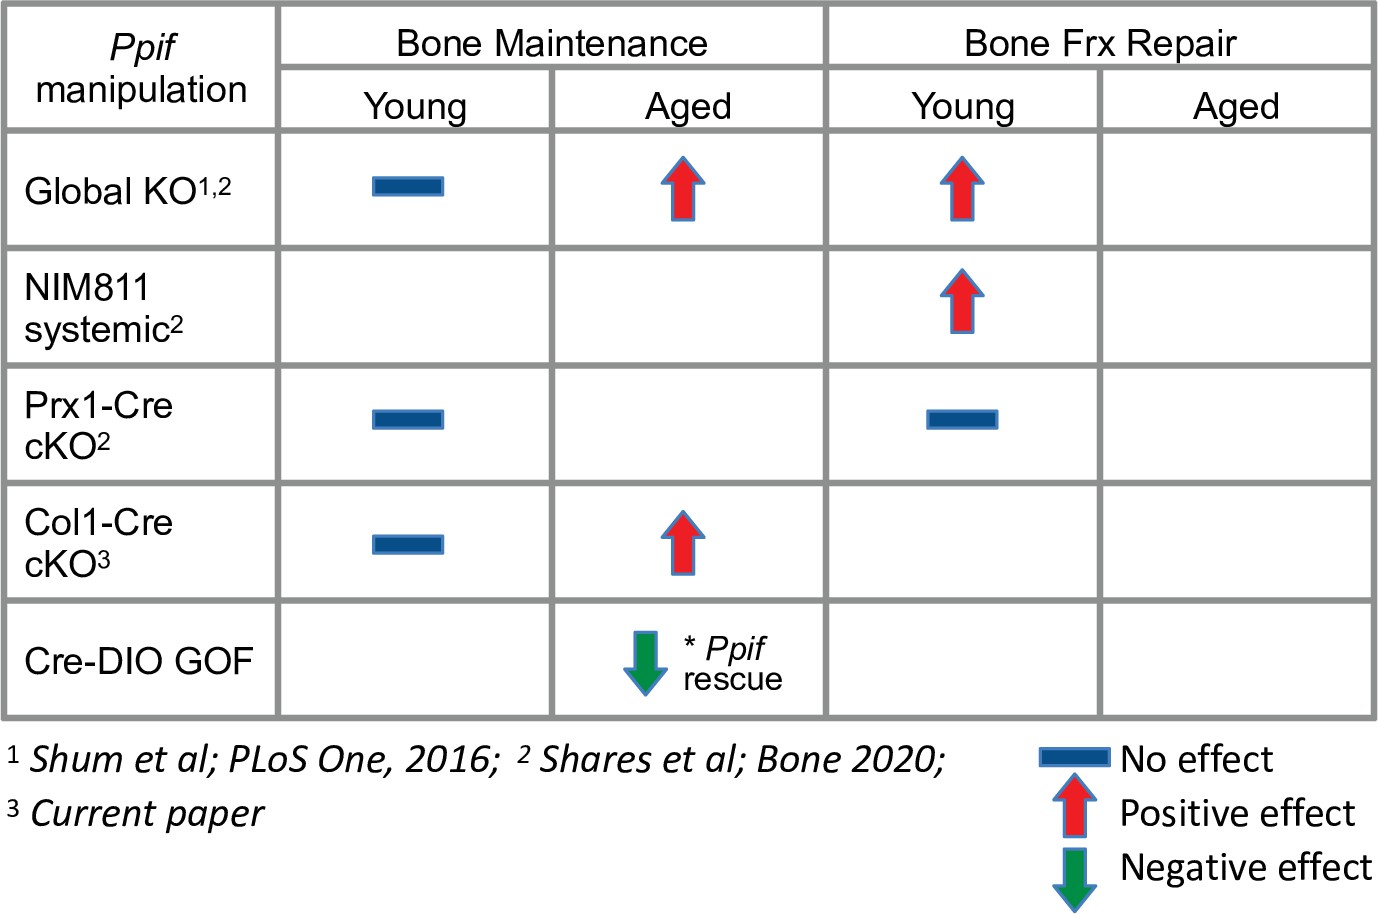
Summary of the effects of Ppif manipulation in different mouse models from previous and current publication.
KO: knock-out, NIM811: CypD inhibitor, cKO: conditional knock-out, GOF: gain-of-function model of CypD, Frx: fracture.
Tables
Appendix 1—key resources table
| Reagent type (species) or resource | Designation | Source or reference | Identifiers | Additional information |
|---|---|---|---|---|
| Gene (Mus musculus) | Ppif promoter (–1110…–1 bp) | NCBI | NM_005729.3 | |
| Gene (Homo sapiens) | PPIF promoter (–1110…–1 bp) | NCBI | NC_000080.6 | |
| Strain, strain background (Mus musculus, male) | C57BL6/J | Jackson Laboratories | RRID: IMSR_JAX:000664 | |
| Genetic reagent (Mus musculus, male) | R26caPpif | This paper | Global CypD GOF or caPpif mouse (C57Bl/6 background) | |
| Genetic reagent (Mus musculus, male) | 2.3 kb Col1CreERt2;R26caPpif/+ | This paper | Col1-specific CypD GOF or caPpif mouse (C57Bl/6 background) | |
| Genetic reagent (Mus musculus, male) | (Ppiff/f) Ppif tm1Mmos/J, C57Bl/6 | Jackson Laboratories | RRID: IMSR_JAX:005737 | Originated in the Korsmeyer lab at Dana Farber Cancer Institute |
| Cell line (Mus musculus) | ST2 | DMSZ | RRID:CVCL_2205 | Gift from Dr Clifford Rosen (Maine Medical Center) |
| Cell line (Mus musculus) | MC3T3-E1 subclone 14 | ATCC | RRID:CVCL_5437 | |
| Cell line (Mus musculus) | C2C12 | ATCC | RRID:CVCL_0188 | Gift from Dr Calvin Cole (University of Rochester) |
| Cell line (Homo sapiens) | hFOB 1.19 | ATCC | RRID:CVCL_3708 | |
| Cell line (Homo sapiens) | 143b | ATCC | RRID:CVCL_2270 | |
| Transfected construct (Mus musculus) | pCMV6-caPpif | Origene | MR202183 | Plasmid construct to transfect and express caCypD |
| Transfected construct (Enterobacteria phage P1) | Ad5-CMV-Cre | Vector Biolabs | No:1045 | Viral particle construct to transfect and express Cre recombinase |
| Transfected construct (Aequorea Victoria) | Ad5-CMV-eGFP | Vector Biolabs | No:1060 | Viral particle construct to transfect and express eGFP |
| Transfected construct (Mus musculus) | AAV2-Cre-DIO-caPpif-eGFP | UNC GTC Vector Core | #AV8154 | Viral particle construct to transfect and express caCypD in vivo |
| Biological sample (Mus musculus) | Primary BMSCs from C57BL6/J mice | Jackson Laboratories | Freshly isolated from Mus musculus | |
| Biological sample (Mus musculus) | Primary BMSCs from R26caPpif/+ mice | This paper | Freshly isolated from Mus musculus | |
| Antibody | Anti-CypD (mouse monoclonal) a.k.a Cyclophilin F | Abcam | RRID: AB_10864110 | WB (1:1000) IF (1:400) |
| Antibody | Anti-β-actin (mouse monoclonal) | Abcam | RRID: AB_476697 | (1:2000) |
| Antibody | Anti-VDAC1 (mouse monoclonal) | Santa Cruz Biotechnology | RRID: AB_632587 | (1:2000) |
| Antibody | Goat anti-mouse (goat polyclonal, HRP conjugate) | Abcam | RRID: AB_478283 | (1:3000) to (1:5000) |
| Antibody | Anti-osteocalcin (rabbit polyclonal) | Enzo Life Sciences | RRID: AB_10540992 | (1:400) |
| Antibody | Anti-GFP (rabbit polyclonal) | Abcam | RRID: AB_303395 | (1:500) |
| Antibody | Anti-BMP2 (rabbit polyclonal) | Abcam | RRID: AB_2243574 | (1:500) |
| Antibody | Goat anti-rabbit IgG (goat polyclonal, Alexa Fluor647 conjugate) | Abcam | RRID: AB_2722623 | (1:2000) |
| Antibody | Goat anti-rabbit IgG (goat polyclonal, Alexa Fluor488 conjugate) | Abcam | RRID: AB_2630356 | (1:2000) |
| Antibody | Anti-Smad1 (mouse monoclonal) | Santa Cruz Biotechnology | RRID: AB_628261 | (1:2000) |
| Recombinant DNA reagent | pCMV5-Smad1 (plasmid) | Addgene | #14045 | |
| Recombinant DNA reagent | pCMV5-Smad7 (plasmid) | Addgene | #11733 | |
| Recombinant DNA reagent | pCMV6-empty backbone (plasmid) | Origene | PS100001 | |
| Recombinant DNA reagent | pGL4.10 (plasmid) | Promega | PR-E6651 | |
| Recombinant DNA reagent | pRL (plasmid) | Promega | PR-E2241 | |
| Recombinant DNA reagent | XhoI (restriction enzyme) | New England BioLabs | R0146S | |
| Recombinant DNA reagent | HindIII (DNA ligase) | New England BioLabs | R3104S | |
| Recombinant DNA reagent | T4 (restriction enzyme) | New England BioLabs | M0202S | |
| Recombinant DNA reagent | CAG-STOP-eGFP-ROSA26TV (plasmid) | Addgene | # 15912 | Plasmid construct for gene knock-in engineering |
| Recombinant DNA reagent | caPpif | Bochaton et al., 2015 | caCypD construct (CypD GOF) | |
| Recombinant DNA reagent | pAAV-Ef1a-DIO-eGFP-WPRE-pA (plasmid) | Addgene | # 37084 | Plasmid construct to create recombinant AAV |
| Sequence-based reagent | B2m_Fwd | IDT | RT q-PCR primer | AATGGGAAGCCGAACATAC |
| Sequence-based reagent | B2m_Rev | IDT | RT q-PCR primer | CCATACTGGCATGCTTAACT |
| Sequence-based reagent | Smad1_Fwd | IDT | RT q-PCR primer | GACAAGTTTATTTTCCTTTACAGGTCC |
| Sequence-based reagent | Smad1_Rev | IDT | RT q-PCR primer | CCACACACGGCAGTAAATG |
| Sequence-based reagent | Runx2_Fwd | IDT | RT q-PCR primer | CCGGGAATGATGAGAACTAC |
| Sequence-based reagent | Runx2_Rev | IDT | RT q-PCR primer | CCGTCCACTGTCACTTTAATA |
| Sequence-based reagent | Ppif_Fwd | IDT | RT q-PCR primer | CATGTACCC GAACAGAAC |
| Sequence-based reagent | Ppif_Rev | IDT | RT q-PCR primer | CATGTACCC GAACAGAAC |
| Sequence-based reagent | Alp_Fwd | IDT | RT q-PCR primer | CATGTACCC GAACAGAAC |
| Sequence-based reagent | Alp_Rev | IDT | RT q-PCR primer | GGGCTCAAA GAGACCTAAGA |
| Sequence-based reagent | Bglap_Fwd | IDT | RT q-PCR primer | GACCTCACAGATGCCAAG |
| Sequence-based reagent | Bglap_Rev | IDT | RT q-PCR primer | CAAGCCATACTGGTCTGATAG |
| Sequence-based reagent | GAPDH_Fwd | IDT | RT q-PCR primer | GAGTCAACGGATTTGGTCGT |
| Sequence-based reagent | GAPDH_Rev | IDT | RT q-PCR primer | GACAAGCTTCCCGTTCTCAG |
| Sequence-based reagent | RUNX2_Fwd | IDT | RT q-PCR primer | TCCGGAATGCCTCTGCTGTTATGA |
| Sequence-based reagent | RUNX2_Rev | IDT | RT q-PCR primer | ACTGAGGCGGTCAGAGAACAAACT |
| Sequence-based reagent | ALP_Fwd | IDT | RT q-PCR primer | TGCAGTACGAGCTGAACAGGAACA |
| Sequence-based reagent | ALP_Rev | IDT | RT q-PCR primer | TCCACCAAATGTGAAGACGTGGGA |
| Sequence-based reagent | IBSP_Fwd | IDT | RT q-PCR primer | AACGAACAAGGCATAAACGGCACC |
| Sequence-based reagent | IBSP_Rev | IDT | RT q-PCR primer | CCCACCATTTGGAGAGGTTGTTGT |
| Sequence-based reagent | BGLAP_Fwd | IDT | RT q-PCR primer | CCCTCACACTCCTCGCCCTATT |
| Sequence-based reagent | BGLAP_Rev | IDT | RT q-PCR primer | ATAGGCCTCCTGAAAGCCGATGT |
| Sequence-based reagent | SMAD1_Fwd | IDT | RT q-PCR primer | GACAAGTTTATTTTCCTTTACCCGTCC |
| Sequence-based reagent | SMAD1_Rev | IDT | RT q-PCR primer | CCACACAGGGCAGTAAAT |
| Sequence-based reagent | PPIF_Fwd | IDT | RT q-PCR primer | GCCGCAACACAAACGGTTCTC |
| Sequence-based reagent | PPIF_Rev | IDT | RT q-PCR primer | CCCGTCATCTCCTTCCTTCAATTCTC |
| Sequence-based reagent | Distal SBE_Fwd (CTCGAG XhoI 5′ flanking sequence) | This paper (IDT) | PCR cloning primer | AAGACTCGAGTGGAGATTCCCCGCTAT |
| Sequence-based reagent | Distal SBE_Rev (AAGCTT HindIII 3′ flanking sequence) | This paper (IDT) | PCR cloning primer | GGTAATTTCTCATCGCTTCCTTGAAGCTTAAGA |
| Sequence-based reagent | Middle SBE_Fwd (CTCGAG XhoI 5′ flanking sequence) | This paper (IDT) | PCR cloning primer | AAGACTCGAGATTCCAGGGGGTGTAAATCTA |
| Sequence-based reagent | Middle SBE_Rev (AAGCTT HindIII 3′ flanking sequence) | This paper (IDT) | PCR cloning primer | AGGATCTGGTCTCTAGAAGCAAAAAAGCTTAAGA |
| Sequence-based reagent | Proximal SBE_Fwd (CTCGAG XhoI 5′ flanking sequence) | This paper (IDT) | PCR cloning primer | AAGACTCGAGTTCTGTTATCTCTCCCTTTCTG |
| Sequence-based reagent | Proximal SBE_Rev (AAGCTT HindIII 3′ flanking sequence) | This paper (IDT) | PCR cloning primer | AAGCCAGCCGACCAATAAAAAGCTTAAGA |
| Sequence-based reagent | Cre_Fwd | IDT | PCR primer | CCTGGAAAATGCTTCTGTCCGTTTGCC |
| Sequence-based reagent | Cre_Rev | IDT | PCR primer | GAGTTGATAGCTGGCTGGTGGCAGAT |
| Sequence-based reagent | caCypD (TetIRES)_Fwd | IDT | PCR primer | AATGGCTCTCCTCAAGCG |
| Sequence-based reagent | caCypD (TetGFP)_Rev | IDT | PCR primer | GCGGATCTTGAAGTTCACCTTGATGCCGT |
| Peptide, recombinant protein | BMP2 | R&D Systems | 355-BM-050/CF | |
| Peptide, recombinant protein | Wnt3a | R&D Systems | 5036-WN-010 | |
| Peptide, recombinant protein | Noggin | R&D Systems | 1967 NG-025/CF | |
| Commercial assay or kit | SimpleChIP Enzymatic Chromatin IP Kit (Magnetic Beads) | Cell Signaling Technology | #9003 | |
| Commercial assay or kit | Dual Luciferase Reporter Assay System | Promega | E1960 | |
| Chemical compound, drug | L-Ascorbic Acid 2-Phosphate Sesquimagnesium Salt | TCI America | TCI A2521 | |
| Chemical compound, drug | Alkaline phosphatase substrate | Thermo Fisher | 34042 | 1-Step NBT/BCIP Substrate Solution |
| Chemical compound, drug | Calcein-AM | BD Biosciences | 354216 | |
| Chemical compound, drug | Cobalt chloride | Sigma-Aldrich | 232696 | |
| Chemical compound, drug | Ionomycin | Invitrogen | 124222 | |
| Chemical compound, drug | NAO | Invitrogen | A1372 | |
| Chemical compound, drug | Hoechst 33343 | Molecular Probes | H 1339 | |
| Chemical compound, drug | TMRE | Invitrogen | T669 | |
| Chemical compound, drug | FCCP | Abcam | Ab120081 | |
| Chemical compound, drug | Tamoxifen | Sigma-Aldrich | T5648 | |
| Chemical compound, drug | 4-OH-tamoxifen | Sigma-Aldrich | H7904 |
Additional files
Download links
A two-part list of links to download the article, or parts of the article, in various formats.
Downloads (link to download the article as PDF)
Open citations (links to open the citations from this article in various online reference manager services)
Cite this article (links to download the citations from this article in formats compatible with various reference manager tools)
Transcriptional regulation of cyclophilin D by BMP/Smad signaling and its role in osteogenic differentiation
eLife 11:e75023.
https://doi.org/10.7554/eLife.75023


