A guanosine tetraphosphate (ppGpp) mediated brake on photosynthesis is required for acclimation to nitrogen limitation in Arabidopsis
- Aix-Marseille University, CEA, CNRS, BIAM, LGBP Team, France
- University of Tunis El Manar, Faculty of Sciences of Tunis, Laboratory of Molecular Genetics, Immunology and Biotechnology, Tunisia
- Aix-Marseille University, CEA, CNRS, BIAM, SAVE Team, France
- Institut Jean-Pierre Bourgin, UMR1318 INRA-AgroParisTech, INRAE Centre de Versailles-Grignon, Université Paris-Saclay, France
- Université Paris-Saclay, CNRS, INRAE, Univ Evry, Institute of Plant Sciences Paris-Saclay (IPS2), France
- Université de Paris, CNRS, INRAE, Institute of Plant Sciences Paris-Saclay (IPS2), France
- University of Carthage, Faculty of Sciences of Bizerte, Tunisia
Figures
Figure 1 with 2 supplements
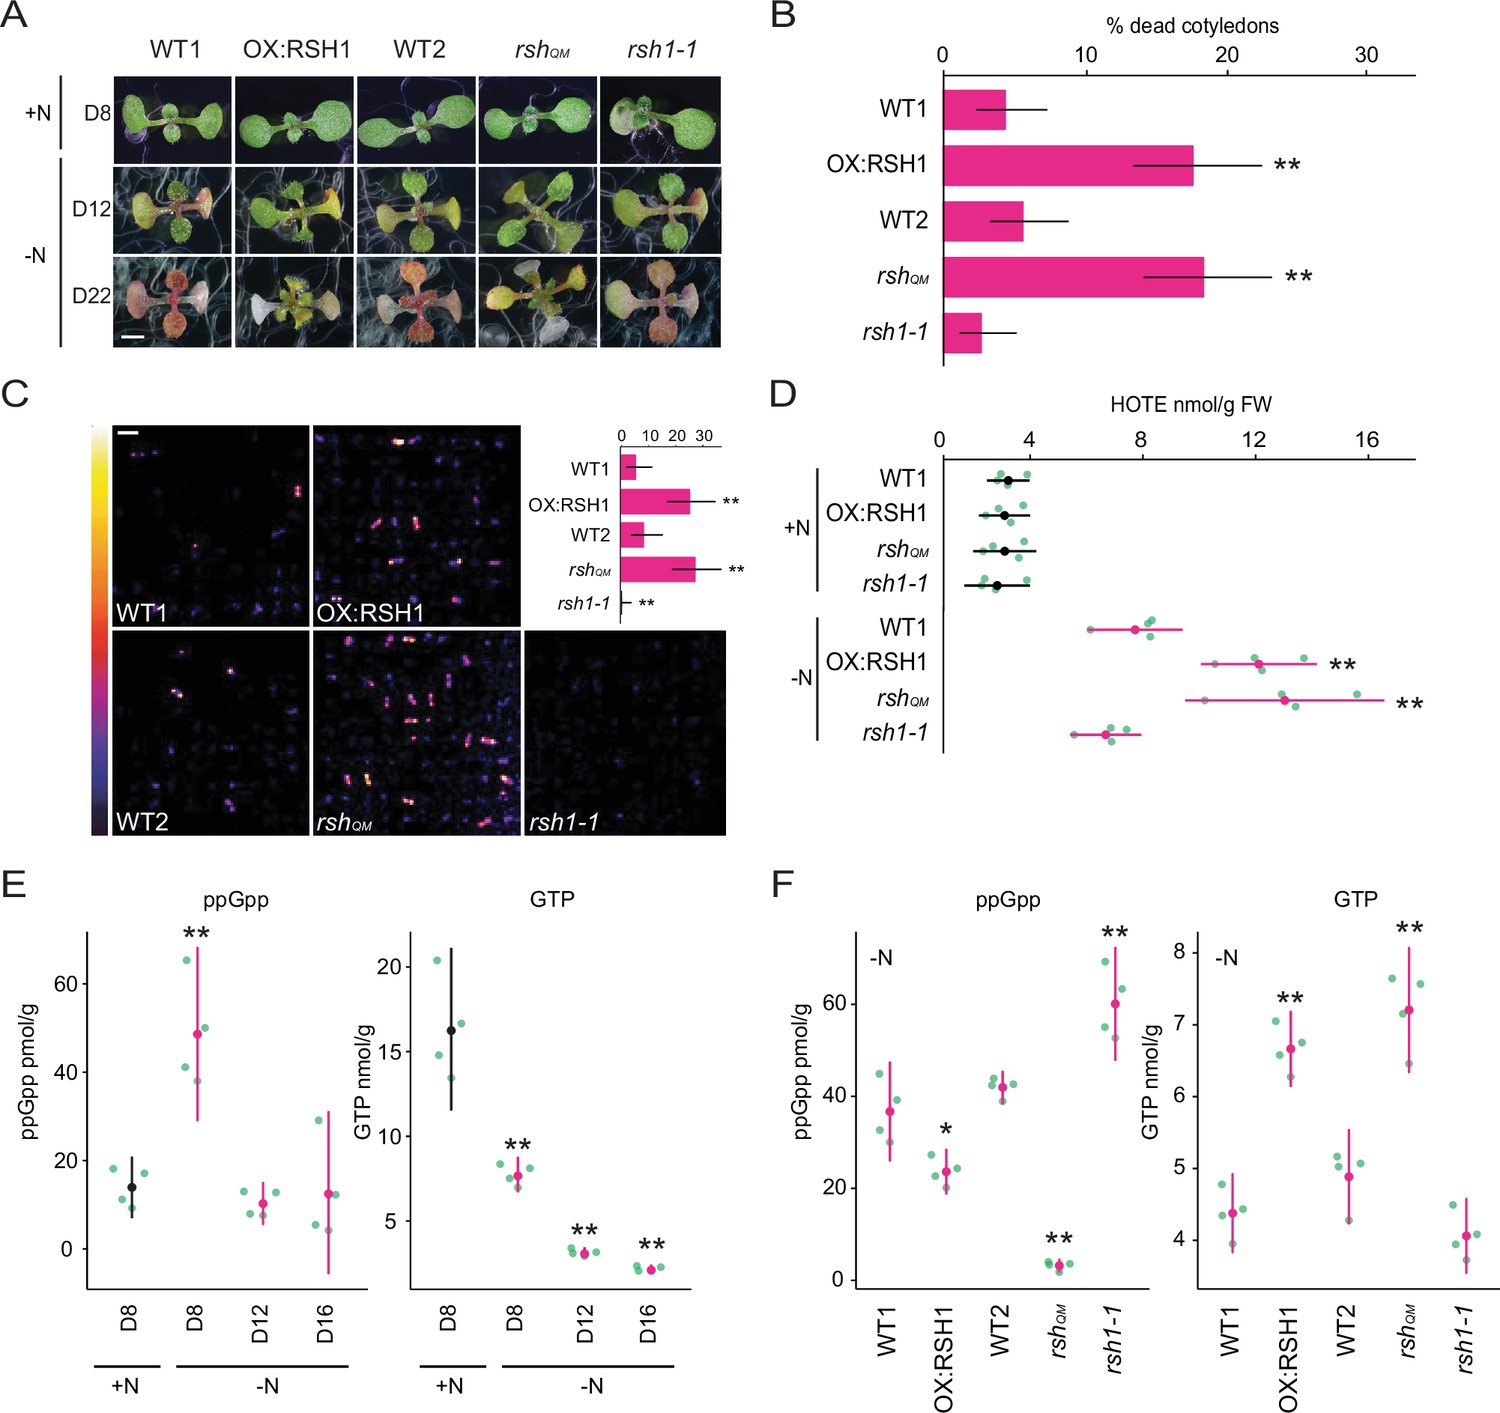
ppGpp is required for acclimation to nitrogen deprivation.
(A) Images of seedlings grown on nitrogen replete (+N) or nitrogen limiting (−N) medium for 8 (D8), 12 (D12), and 22 (D22) days. Scale, 3 mm. WT1 (Col-0) and WT2 (qrt1-2) are the wild type for OX:RSH1 and rshQM/rsh1-1, respectively. See Figure 1—figure supplement 1 for additional images. (B) Percentage of plants with dead cotyledons (completely white with collapsed tissue) for different genotypes grown on −N medium for 22 days. Three pooled experimental replicates, median ± 95% confidence interval (CI), n = 285–298 seedlings per genotype. (C) Bioluminescence emission from lipid peroxides in seedlings grown on −N medium for 16 days. Inset graph shows median number of luminescent seedlings ± 95% CI, n = 100 seedlings. Scale, 1.1 cm. (D) Quantification of hydroxy-octadecatrienoic acids (HOTEs) from seedlings grown in −N for 12 days or +N for 8 days where the developmental stage is similar. Mean ± 95% CI, n = 4 experimental replicates. Concentrations of ppGpp and GTP in wild-type plants were determined (E) at the indicated time points during growth on +N and −N medium and (F) in different genotypes after 12 days of growth in −N medium (equivalent to 10 days in the experiment in panel E). The ppGpp/GTP ratio is shown in Figure 1—figure supplement 2. Mean ± 95% CI, n = 4 experimental replicates. Statistical tests shown against respective wild-type controls, *p < 0.05, **p < 0.01. Source data and statistical test reports are shown in Figure 1—source data 1.
-
Figure 1—source data 1
Source data and statistical test reports for Figure 1 and supplements.
- https://cdn.elifesciences.org/articles/75041/elife-75041-fig1-data1-v2.zip
Figure 1—figure supplement 1
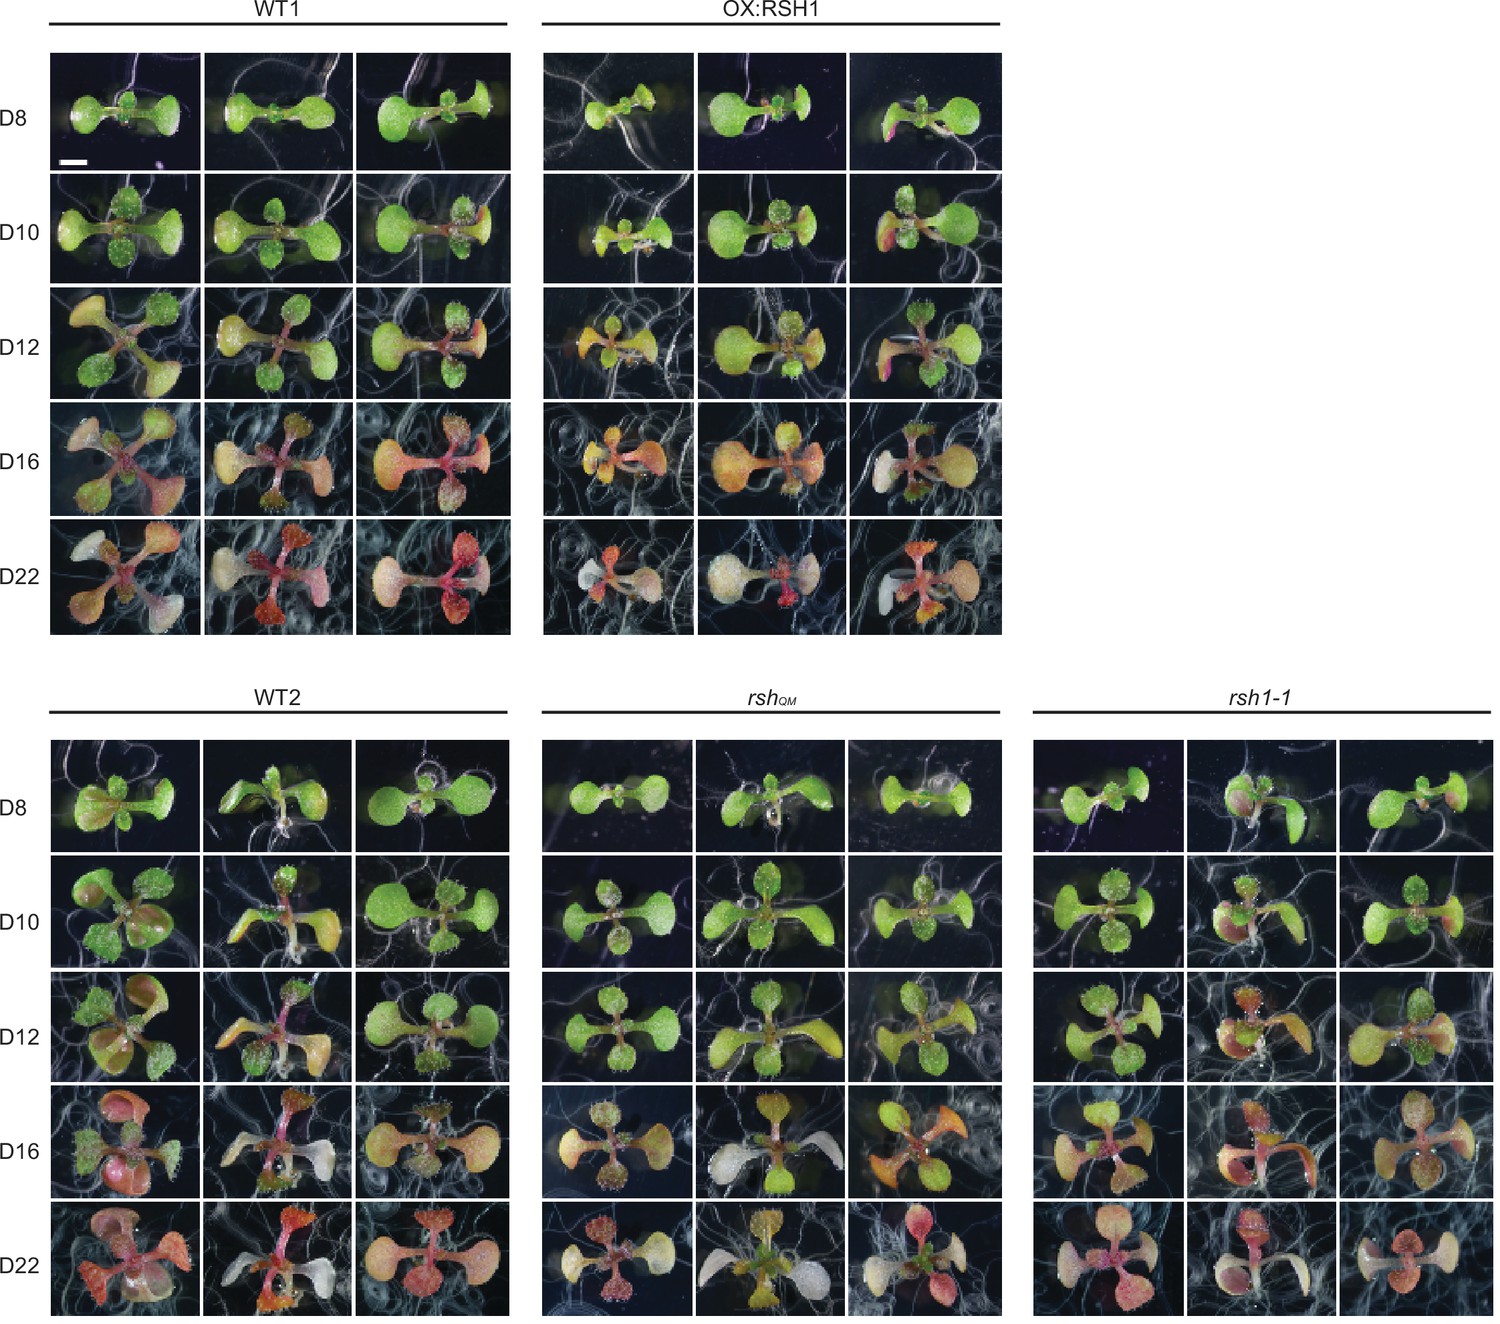
Extended timecourse of nitrogen deprivation.
Images of seedlings grown on nitrogen limiting medium for the indicated number of days. Scale, 3 mm.
Figure 1—figure supplement 2

GTP/ppGpp ratios in RSH lines.
The ratio of ppGpp to GTP concentration in seedlings grown for 10 days on nitrogen limiting media. Mean ± 95% CI, n = 4 experimental replicates. Statistical tests shown against respective wild-type controls, **p < 0.01.
Figure 2 with 4 supplements

Nitrogen deprivation promotes a ppGpp-dependent drop in photosynthetic capacity.
Seedlings were grown 8 days on nitrogen replete media (+N) or 12 days on nitrogen limiting (−N) media and (A) the maximal yield of PSII (Fv/Fm) measured by fluorescence imaging individual seedlings. Median ± 95% confidence interval (CI), n = 95–100 seedlings. (B) Fv/Fm images of whole seedlings grown on +N and −N media for 12 days. (C) Relative electron transport rate (ETR) measurements in different lines grown 8 days on +N media or 12 days on −N media. Median ± 95% CI, n = 95–100 seedlings. (D) Fv/Fm timecourses from seedlings grown on −N media and transferred to three different light intensities (photosynthetic photon flux density, 10, 80, and 150 µmol m−2 s−1) after 6 days. Median ± 95% CI, n = 95–100 seedlings. Tests shown against respective wild-type controls, *p < 0.05, **p < 0.01. Additional supporting data are presented in Figure 2—figure supplement 2, Figure 2—figure supplement 3 and Figure 2—figure supplement 4. Source data and statistical test reports are shown in Figure 2—source data 1.
-
Figure 2—source data 1
Source data and statistical test reports for Figure 2 and supplements.
- https://cdn.elifesciences.org/articles/75041/elife-75041-fig2-data1-v2.zip
Figure 2—figure supplement 1
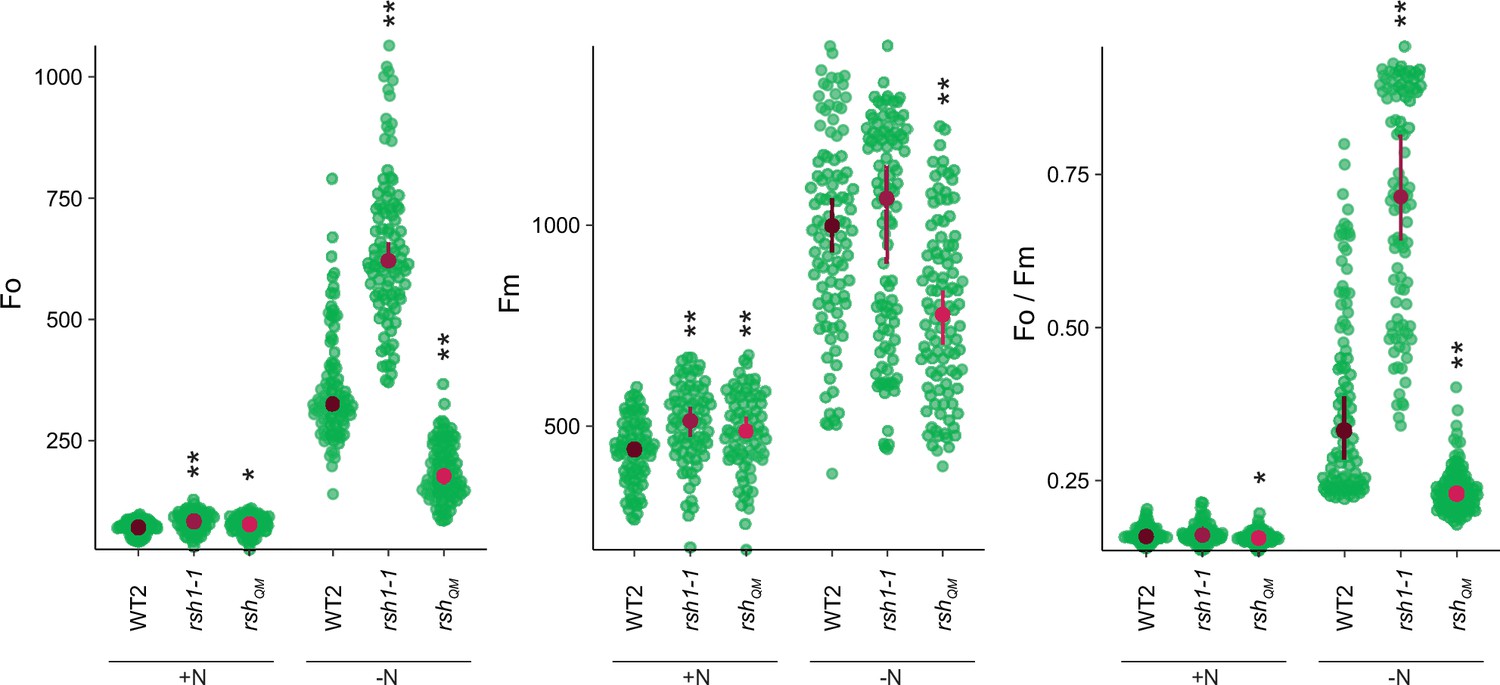
Changes in additional photosynthetic parameters (Fo, Fm, and Fo/Fm) for lines shown in panel 2A.
Seedlings were grown 8 days on nitrogen replete media (+N) or 12 days on nitrogen limiting (−N) media. Median ± 95% confidence interval (CI), n = 95–100 seedlings. Statistical tests shown against respective wild-type controls, *p < 0.05, **p < 0.01, Kruskal–Wallis test with post hoc Dunn tests.
Figure 2—figure supplement 2
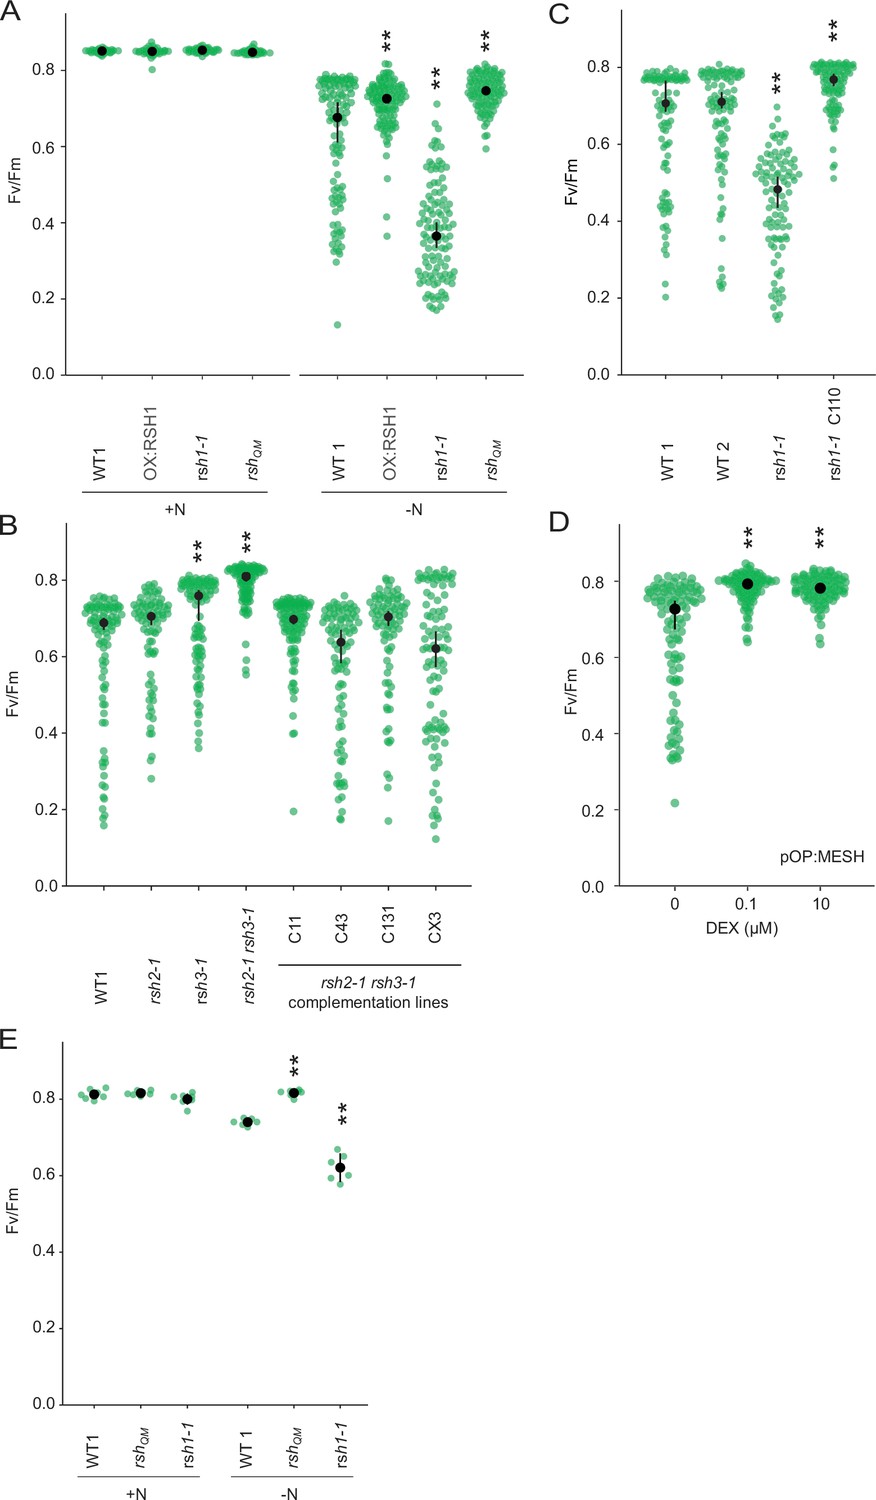
Role of ppGpp in the nitrogen deprivation induced decrease in PSII maximal yield.
(A) Fv/Fm in seedlings of indicated lines grown 8 days on nitrogen replete media (+N) or 12 days on nitrogen limiting (−N) media. (B–D) Fv/Fm in seedlings of indicated lines grown 12 days on −N. rsh1-1 C110 is complementation line complemented with the full-length RSH1 (pRSH1:RSH1). pOP:MESH is a dexamethasone (DEX) inducible line that expresses a chloroplast targeted ppGpp hydrolase MESH. (E) Fv/Fm in mature plants grown on quartz sand supplemented with nitrogen replete media (+N) or nitrogen-free (−N) media. Median ± 95% confidence interval (CI), n = 95–100 seedlings (A–D), 6 plants (E). Statistical tests shown against respective wild-type controls, **p < 0.01.
Figure 2—figure supplement 3
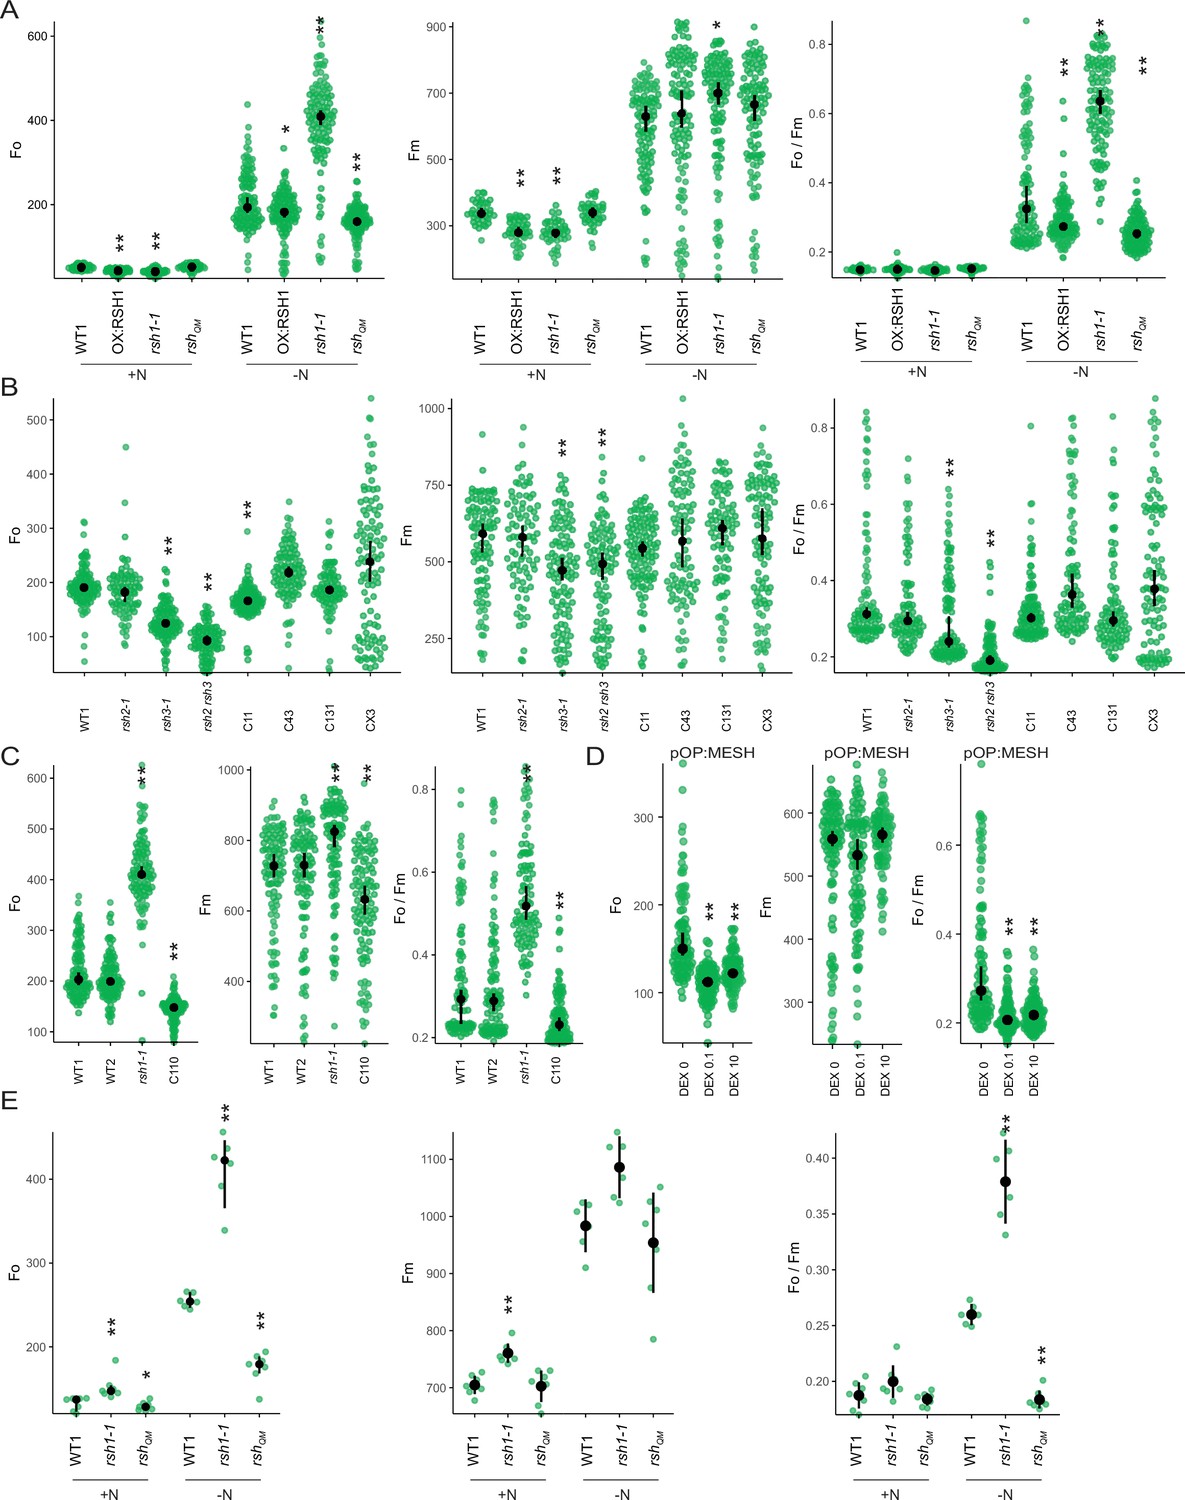
Changes in additional photosynthetic parameters (Fo, Fm, and Fo/Fm) for Figure 2—figure supplement 2.
(A) In seedlings of indicated lines grown 8 days on nitrogen replete media (+N) or 12 days on nitrogen limiting (−N) media. (B–D) In seedlings of indicated lines grown 12 days on −N. C110 is an rsh1-1 complementation line complemented with the full-length RSH1 (pRSH1:RSH1). pOP:MESH is a dexamethasone (DEX) inducible line that expresses a chloroplast targeted ppGpp hydrolase MESH. (E) In mature plants grown on quartz sand supplemented with nitrogen replete media (+N) or nitrogen-free (−N) media. Median ± 95% confidence interval (CI), n = 95–100 seedlings (A–D), 6 plants (E). Statistical tests shown against respective wild-type controls, *p < 0.05, **p < 0.01. Kruskal–Wallis test with post hoc Dunn tests (A–D), one-way analysis of variance (ANOVA) with post hoc Tukey test (E).
Figure 2—figure supplement 4
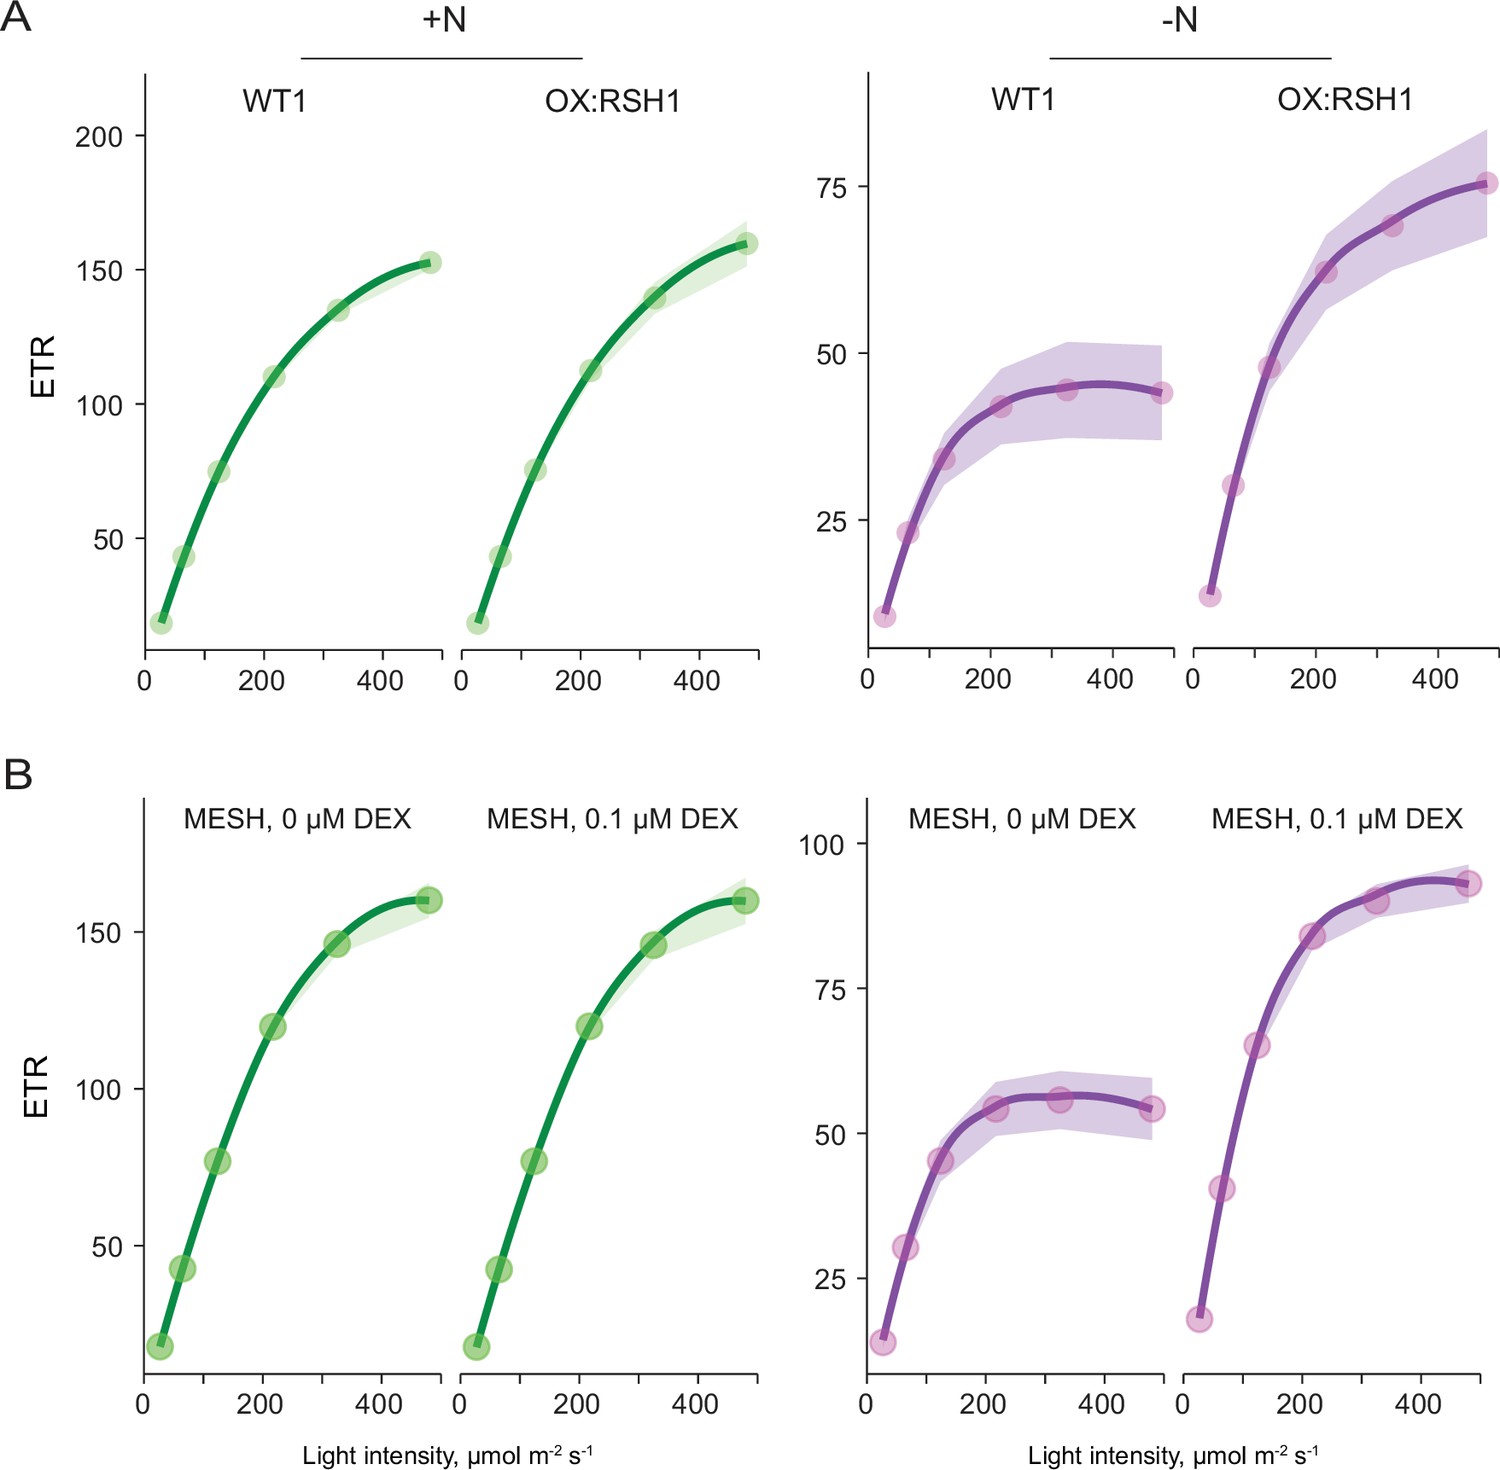
ppGpp is required for reducing electron transport rate (ETR) during nitrogen deprivation.
Relative ETR measurements in different lines grown 8 days on +N media (left) or 12 days on −N media (right). (A) A comparison between OX:RSH1 and the wild-type control. (B) ETR in the dexamethasone (DEX) inducible pOP:MESH line grown on noninducing medium (0 µM DEX), or inducing medium (10 µM DEX). MESH is a chloroplast targeted ppGpp hydrolase. Median ± 95% confidence interval (CI), n = 95–100 seedlings.
Figure 3 with 2 supplements
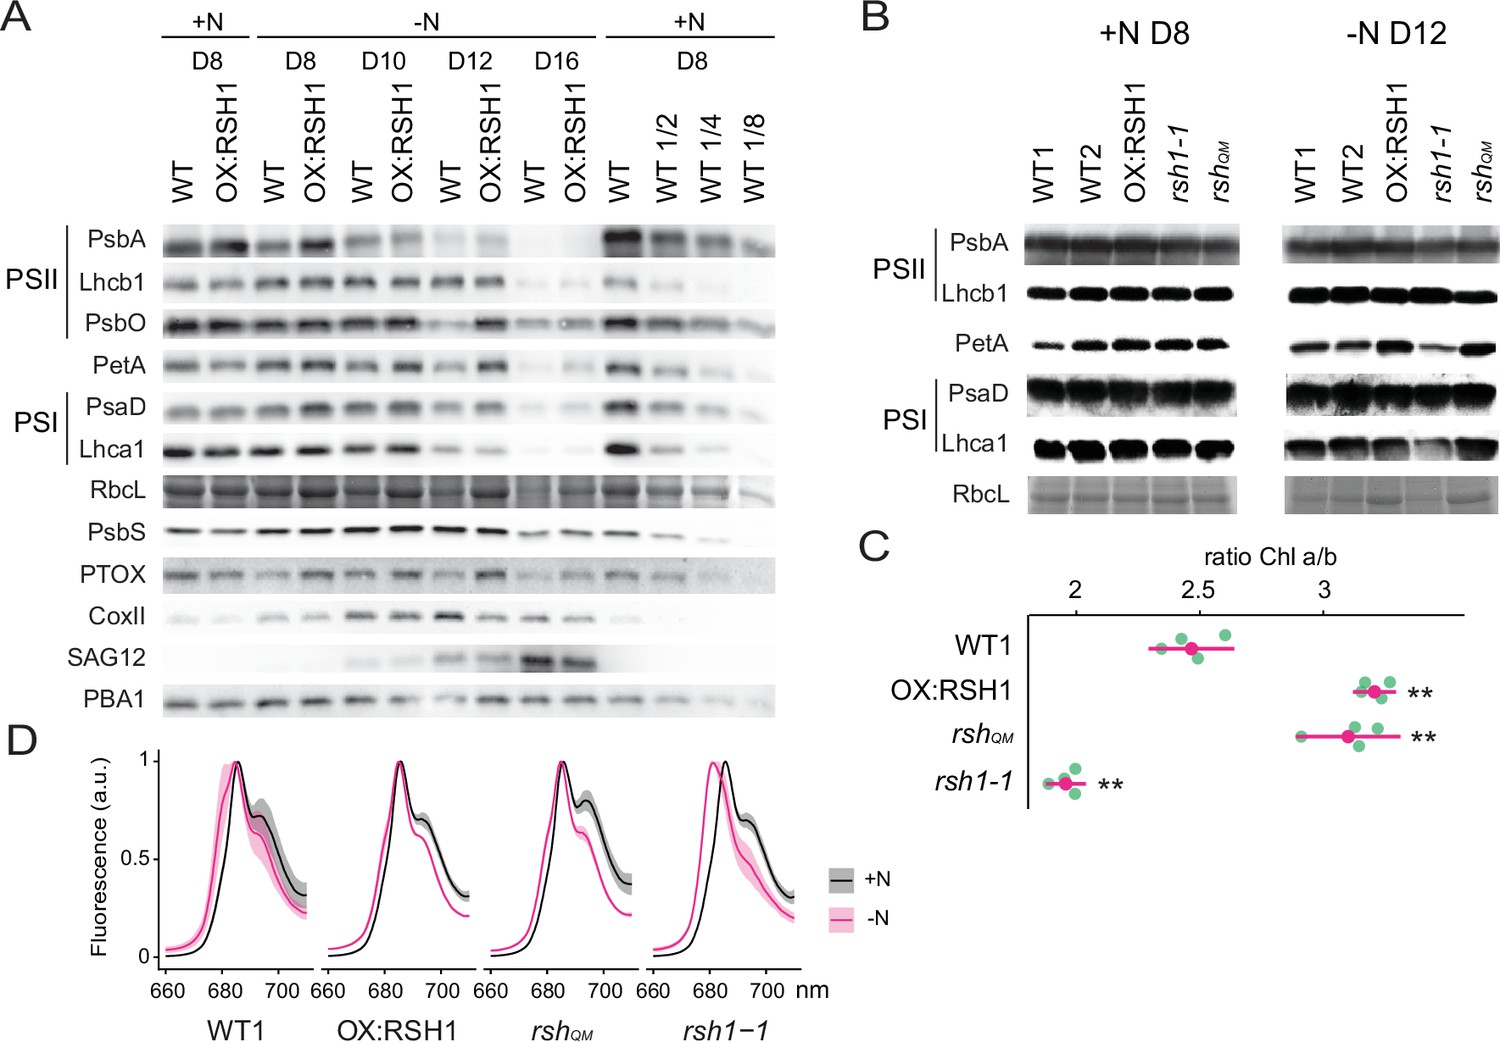
ppGpp-dependent alterations in the photosynthetic machinery during nitrogen deficiency.
(A) Immunoblots showing evolution in abundance of the indicated proteins in seedlings grown in nitrogen replete (+N) or nitrogen limiting (−N) media for the indicated number of days. RbcL was revealed by Coomassie Brilliant Blue. Equal quantities of total proteins were loaded and PBA1, a subunit of the proteasome, was used as a protein normalization control (B). Immunoblots showing the abundance of the indicated proteins in purified thylakoid membranes from seedlings grown in +N for 8 days or −N for 12 days. RbcL was revealed by Coomassie Brilliant Blue staining. Equal quantities of total chlorophyll were loaded. Immunoblots after ppGpp depletion by induction of chloroplastic MESH are shown in Figure 3—figure supplement 1. (C) Chlorophyll a/b ratios in extracts from seedlings subjected to −N for 12 days. Means ± 95% confidence interval (CI), data from four experimental replicates. (D) Emission spectrum of chlorophyll fluorescence at 77 K between 660 and 720 nm, normalized to the PSII peak at 685 nm. The full spectra are shown in Figure 2—figure supplement 2. Measurements were made on seedlings grown in +N for 8 days or −N for 12 days. Means ± 95% CI; data from four experimental replicates. Statistical tests, **p < 0.01. Uncropped immunoblots are available in Figure 3—source data 1 for 3A and Figure 3—source data 2 for 3B. Numeric data and statistical test reports are shown in Figure 3—source data 3.
-
Figure 3—source data 1
Uncropped immunoblots for 3A.
- https://cdn.elifesciences.org/articles/75041/elife-75041-fig3-data1-v2.zip
-
Figure 3—source data 2
Uncropped immunoblots for 3B.
- https://cdn.elifesciences.org/articles/75041/elife-75041-fig3-data2-v2.zip
-
Figure 3—source data 3
Source data and statistical test reports for Figure 3 and supplements.
- https://cdn.elifesciences.org/articles/75041/elife-75041-fig3-data3-v2.zip
Figure 3—figure supplement 1

ppGpp depletion by MESH also affects abundance of chloroplast proteins.
Immunoblots showing the abundance of the indicated proteins in extracts from 100 bulked seedlings grown in −N for 12 days from two experimental replicates. MESH seedlings were induced by inclusion of dexamethasone (DEX) or not in the growth medium. RbcL was revealed by Coomassie Brilliant Blue. Equal quantities of total protein were loaded. Uncropped immunoblots are shown in Figure 3—source data 3.
Figure 3—figure supplement 2
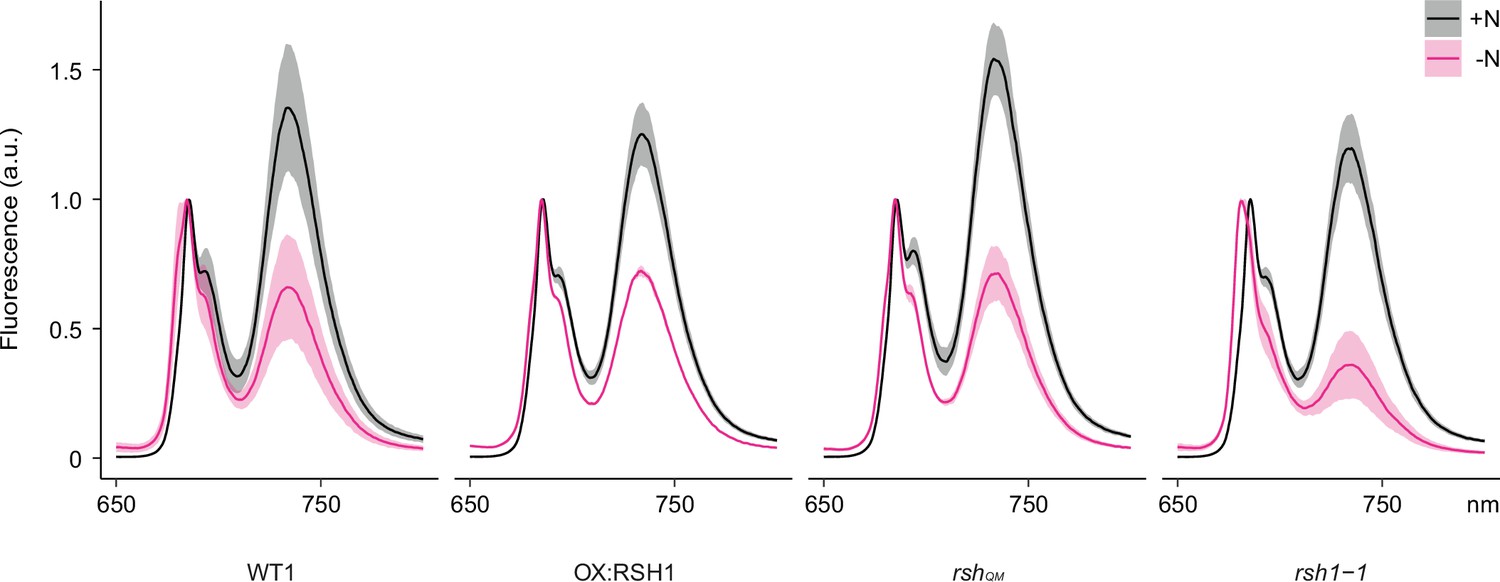
Full 77°K chlorophyll fluorescence spectra under nitrogen deprivation.
Emission spectrum of chlorophyll fluorescence at 77°K normalized to the PSII peak at 685 nm. Measurements made on 8- or 12-day-old seedlings grown under +N or −N. Means ± 95% confidence interval (CI); data from four experimental replicates.
Figure 4
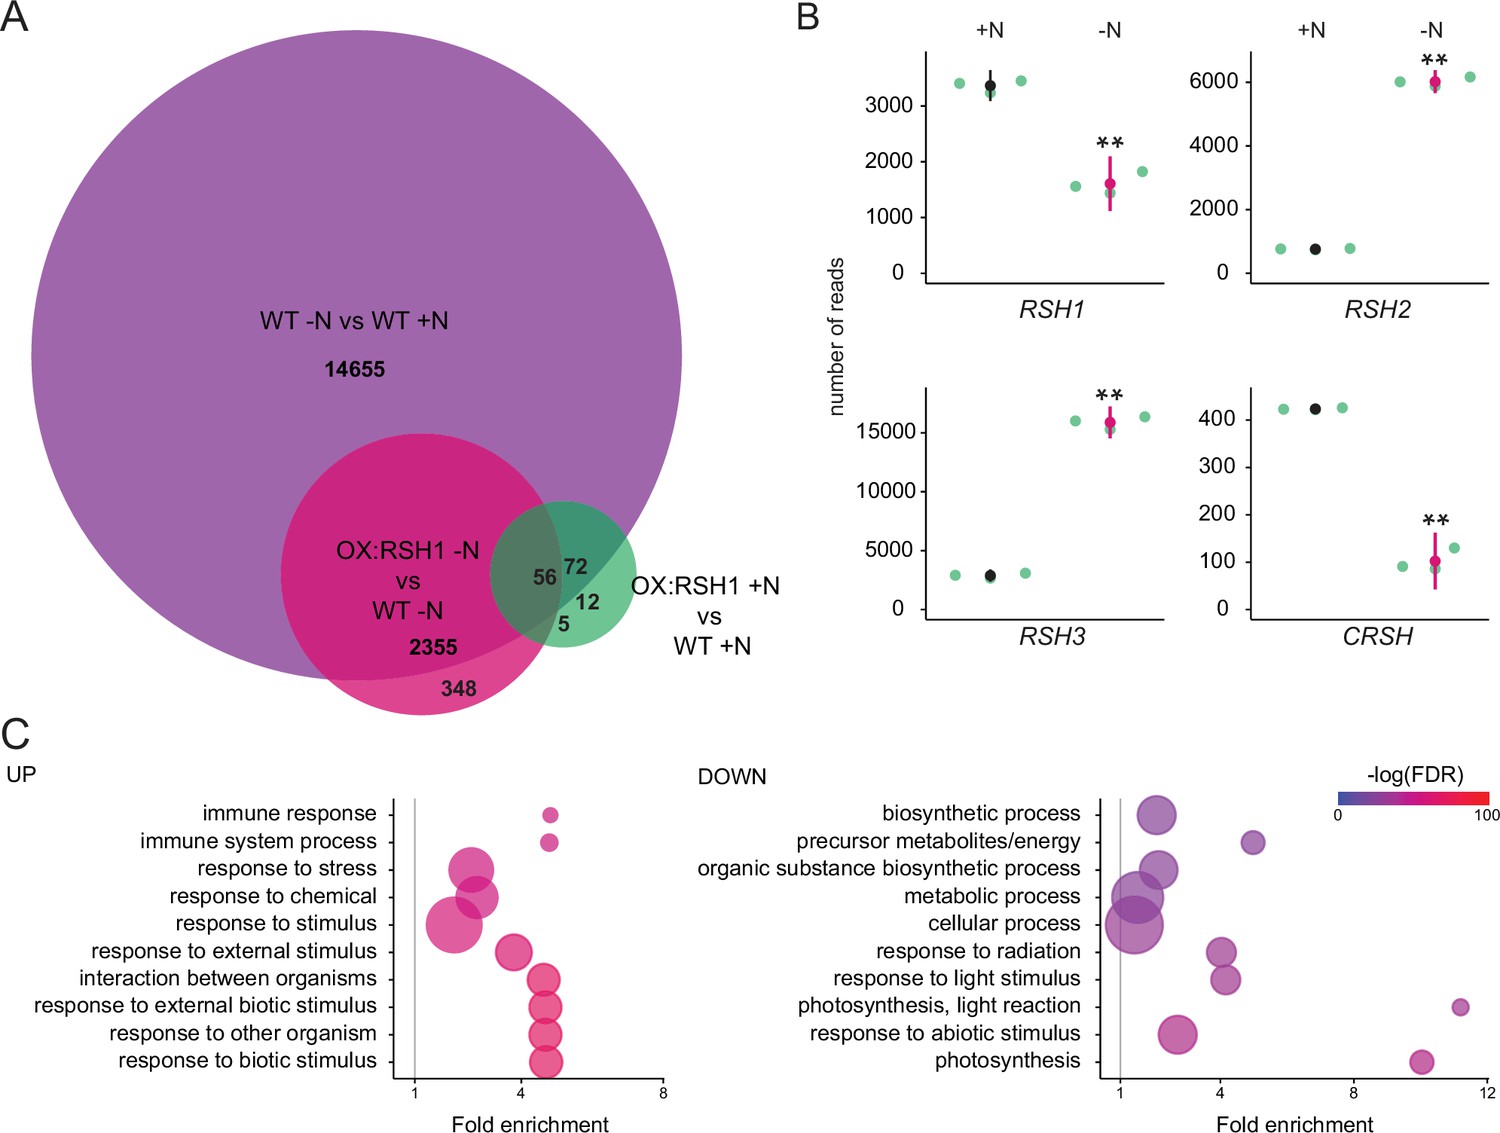
ppGpp plays a major role during acclimation to nitrogen deprivation.
RNA-seq experiments were performed on WT and OX:RSH1 seedlings grown 8 days on nitrogen replete media (+N) or 12 days on nitrogen limiting (−N) media, n = 3 experimental replicates. (A) Venn diagram for transcripts showing differential accumulation for each of three comparisons. All differentially accumulating transcripts are listed in Figure 4—source data 1. (B) RNA-seq transcript levels for the four RSH genes in the WT, +N vs −N. Mean ± 95% confidence interval (CI), **p < 0.01. (C) Enriched gene ontology terms among significantly up- and downregulated transcripts in OX:RSH1 vs WT under −N. The 10 most significant terms are shown, point size is proportional to gene number. FDR, false discovery rate. The full GO analysis is presented in Figure 4—source data 2. Source data and statistical test reports are shown in Figure 4—source data 3.
-
Figure 4—source data 1
Differentially accumulating transcripts.
- https://cdn.elifesciences.org/articles/75041/elife-75041-fig4-data1-v2.xlsx
-
Figure 4—source data 2
GO enrichment analysis.
- https://cdn.elifesciences.org/articles/75041/elife-75041-fig4-data2-v2.xlsx
-
Figure 4—source data 3
Source data and statistical test reports for Figure 4B.
- https://cdn.elifesciences.org/articles/75041/elife-75041-fig4-data3-v2.zip
Figure 5
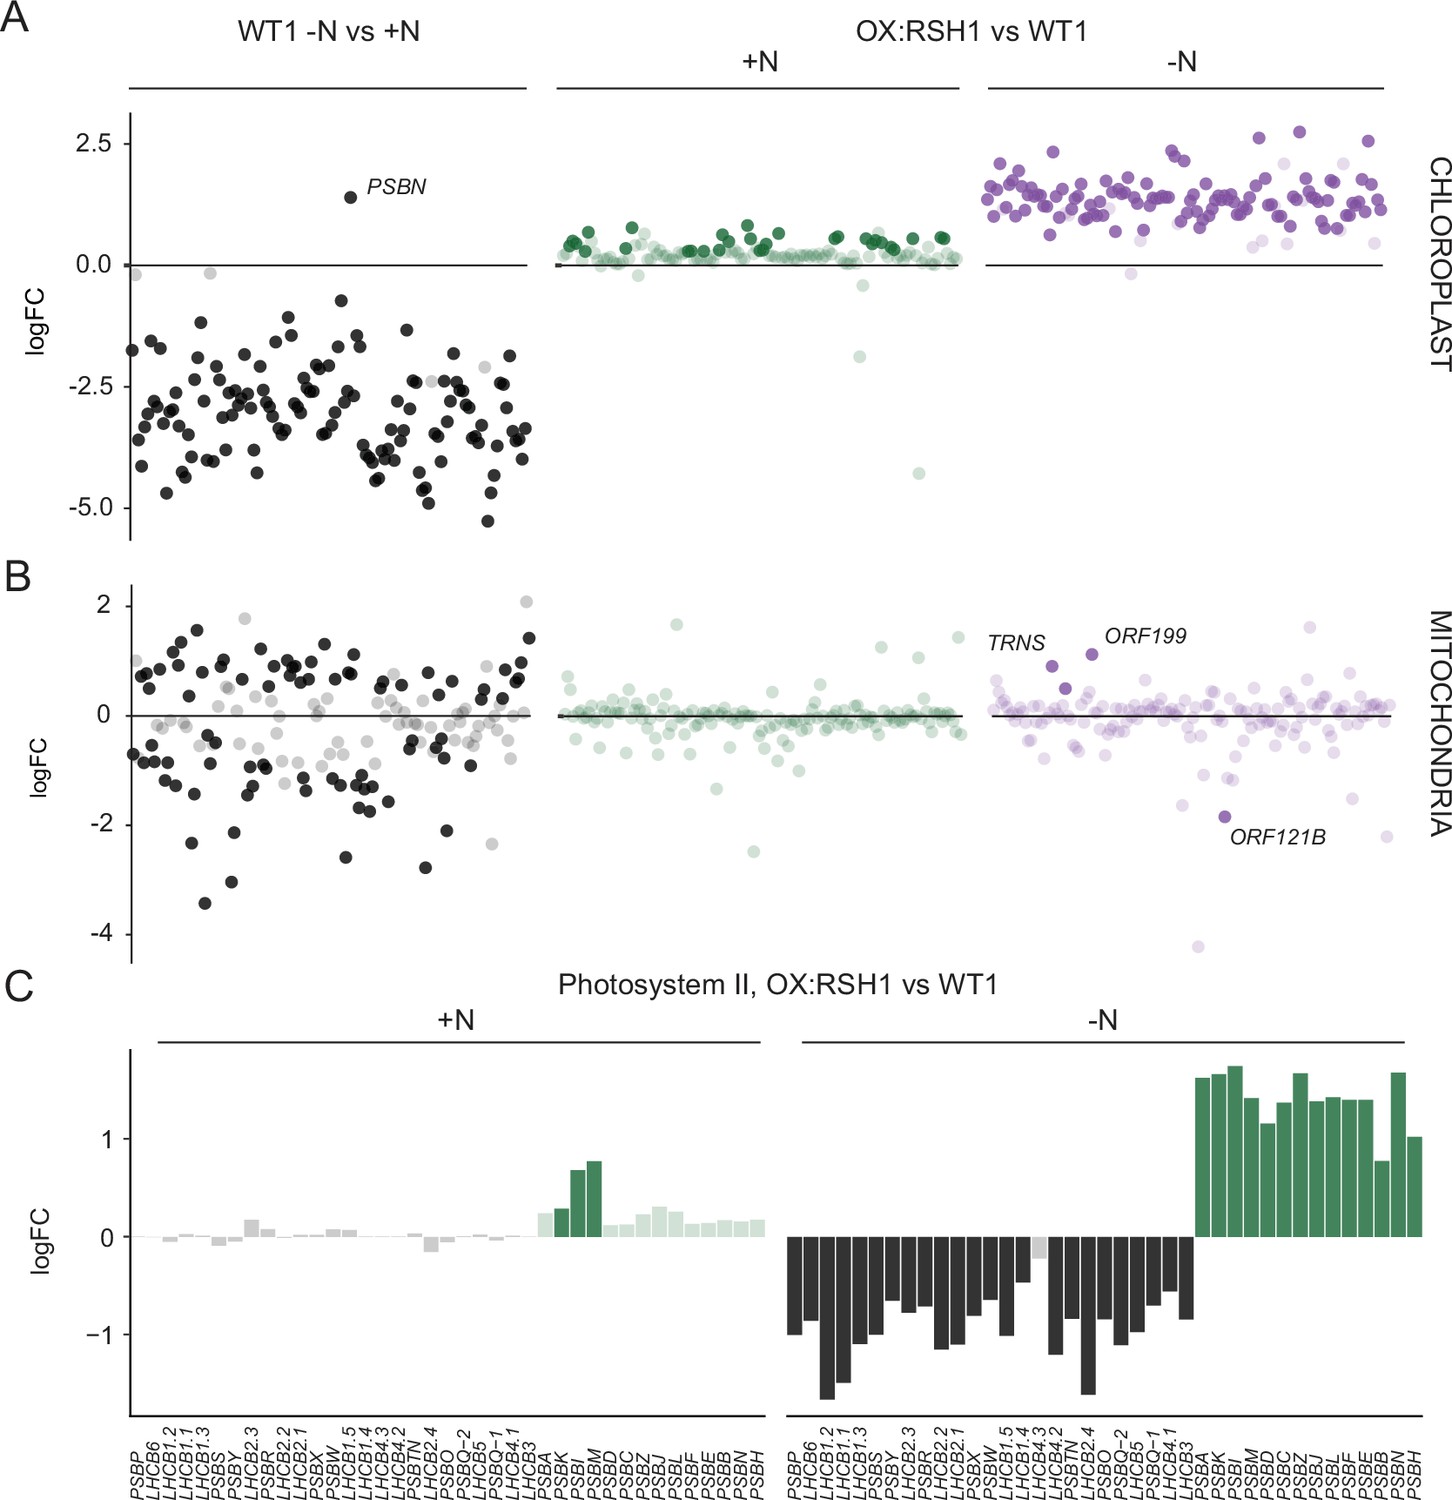
ppGpp is required for the downregulation of chloroplast gene expression during nitrogen deficiency.
(A) The differential expression of chloroplast transcripts ordered along the chloroplast genome (Figure 5—source data 1). (B) The differential expression of mitochondrial transcripts ordered along the mitochondrial genome (Figure 5—source data 2). (C) Relative transcript levels in OX:RSH1 vs the wild-type control for nuclear (black) and chloroplast (green) genes encoding subunits of the photosystem II complex. Solid colors indicate significantly different changes in expression (p < 0.05), transparent colors indicate nonsignificant changes. Source data for 5C are shown in Figure 5—source data 3.
-
Figure 5—source data 1
Chloroplast gene expression.
- https://cdn.elifesciences.org/articles/75041/elife-75041-fig5-data1-v2.xlsx
-
Figure 5—source data 2
Mitochondrial gene expression.
- https://cdn.elifesciences.org/articles/75041/elife-75041-fig5-data2-v2.xlsx
-
Figure 5—source data 3
Source data for Figure 5C including extended figures for multiple photosynthetic complexes.
- https://cdn.elifesciences.org/articles/75041/elife-75041-fig5-data3-v2.zip
Tables
Key resources table
| Reagent type (species) or resource | Designation | Source or reference | Identifiers | Additional information |
|---|---|---|---|---|
| Genetic reagent (Arabidopsis thaliana) | Col-0 | Nottingham Arabidopsis Stock Centre (NASC) | WT1, Columbia, N1093 (NASC) | |
| Genetic reagent (Arabidopsis thaliana) | qrt1-2 | Nottingham Arabidopsis Stock Centre (NASC), Copenhaver et al., 2000 | WT2, N8846 (NASC) | Col-3 ecotype |
| Genetic reagent (Arabidopsis thaliana) | qrt1-2/rsh1-1 | Nottingham Arabidopsis Stock Centre (NASC), Sugliani et al., 2016; Sessions et al., 2002 | TDNA insertion SAIL_391_E11, N818025 (NASC) | RSH mutant |
| Genetic reagent (Arabidopsis thaliana) | qrt1-2/rsh2-1 | Nottingham Arabidopsis Stock Centre (NASC), Sugliani et al., 2016; Sessions et al., 2002 | TDNA insertion SAIL_305_B12, N814119 (NASC) | RSH mutant |
| Genetic reagent (Arabidopsis thaliana) | qrt1-2/rsh3-1 | Nottingham Arabidopsis Stock Centre (NASC), Sugliani et al., 2016; Sessions et al., 2002 | TDNA insertion SAIL_99_G05, N862398 (NASC) | RSH mutant |
| Genetic reagent (Arabidopsis thaliana) | qrt1-2/rsh2-1 rsh3-1 | Sugliani et al., 2016 | DM-23 | RSH mutant |
| Genetic reagent (Arabidopsis thaliana) | qrt1-2/rshQM | Sugliani et al., 2016 | rsh1-1, rsh2-1, rsh3-1, crsh-ami/Qmaii | RSH mutant |
| Genetic reagent (Arabidopsis thaliana) | Col-0/OX:RSH1 | Sugliani et al., 2016 | OX:RSH1-GFP (10.4) | Overexpression line |
| Genetic reagent (Arabidopsis thaliana) | qrt1-2/rsh2-1 rsh3-1pRSH3:RSH3 | Sugliani et al., 2016 | C11 | Complementation line |
| Genetic reagent (Arabidopsis thaliana) | qrt1-2/rsh2-1 rsh3-1pRSH3:RSH3 | Sugliani et al., 2016 | C43 | Complementation line |
| Genetic reagent (Arabidopsis thaliana) | qrt1-2/rsh2-1 rsh3-1pRSH3:RSH3 | Sugliani et al., 2016 | C131 | Complementation line |
| Genetic reagent (Arabidopsis thaliana) | qrt1-2/rsh2-1 rsh3-1pRSH3:RSH3 | Sugliani et al., 2016 | CX3 | Complementation line |
| Genetic reagent (Arabidopsis thaliana) | Col-0/pOP:MESH | Sugliani et al., 2016 | MESH | DEX inducible MESH |
| Genetic reagent (Arabidopsis thaliana) | qrt1-2/rsh1-1pRSH1:RSH1 | This study | C110 | Materials and methods: creation of rsh1-1 complementation lines |
| Antibody | anti-COXII (rabbit polyclonal) | Agrisera | AS04 053A | Dilution (1:2000) |
| Antibody | anti-LHCA1 (rabbit polyclonal) | Agrisera | Ref. AS01 005 | Dilution (1:2000) |
| Antibody | anti-LHCB1 (rabbit polyclonal) | Agrisera | Ref. AS01 004 | Dilution (1:2000) |
| Antibody | anti-PBA1 (rabbit polyclonal) | Abcam | Ref. ab98861 | Dilution (1:2000) |
| Antibody | anti-PetA (rabbit polyclonal) | Agrisera | Ref. AS08 306 | Dilution (1:2000) |
| Antibody | anti-PsaD (rabbit polyclonal) | Agrisera | Ref. AS04 046 | Dilution (1:2000) |
| Antibody | anti-PsbA (rabbit polyclonal) | Agrisera | Ref. AS05 084 | Dilution (1:2000) |
| Antibody | anti-PsbO (rabbit polyclonal) | Agrisera | Ref. AS05 092 | Dilution (1:2000) |
| Antibody | anti-PsbS (rabbit polyclonal) | Agrisera | Ref. AS09 533 | Dilution (1:1000) |
| Antibody | anti-PTOX (rabbit polyclonal) | Uniplastomic | Kindly provided by X.Johnson | Dilution (1:2000) |
| Antibody | anti-SAG12 (rabbit polyclonal) | Agrisera | Ref. AS14 2771 | Dilution (1:2000) |
| Chemical compound, drug | 13C-ppGpp | Kindly provided by J.Bartoli and E.Bouveret | Internal standard for ppGpp quantification | |
| Chemical compound, drug | 13C-GTP | Sigma-Aldrich | 710687 | Internal standard for GTP quantification |
| Chemical compound, drug | 15-HEDE | Cayman Chemical | Item No. 37700 | Internal standard for HOTE quantification |
| Commercial assay or kit | Oasis WAX 1 cc Vac Cartridge | Waters | Ref. 186002491 | Nucleotide quantification |
| Chemical compound, drug | Nucleozol | Macherey Nagel | Ref. 740404.200 | RNA extraction |
| Chemical compound, drug | 4-Bromoanisole | Sigma-Aldrich | B56501 | RNA extraction |
| Commercial assay or kit | Clean & Concentrator-25 kit | Zymo Research | Cat. No. R1017 | RNA extraction |
| Commercial assay or kit | Ribo-Zero rRNA Removal Kit (Plant) | Illumina | Ref. MRZPL116 | RNA treatment |
| Other | Open FluorCam | Photon System Instruments | FC 800-O/2020-GFP | Chlorophyll fluorescence |
| Software, algorithm | R | R Development Core Team, 2020 | Data analysis | |
| Software, algorithm | ggplot2 package | Wickham, 2009 | Data analysis | |
| Software, algorithm | Rmisc package | Hope, 2013 | Data analysis | |
| Software, algorithm | boot package | Canty and Ripley, 2021; Davison and Hinkley, 1997 | Data analysis | |
| Software, algorithm | rstatix package | Kassambara, 2021 | Data analysis | |
| Software, algorithm | Rcompanion package | Salvatore, 2021 | Data analysis | |
| Software, algorithm | prepare_gene_ ontology.pl script | This study | Data analysis, available at: https://github.com/cecile-lecampion/gene-ontology-analysis-and-graph |
Additional files
-
Supplementary file 1
Media composition.
- https://cdn.elifesciences.org/articles/75041/elife-75041-supp1-v2.xlsx
-
Supplementary file 2
RNA-seq analysis reports.
Related to Figure 4.
- https://cdn.elifesciences.org/articles/75041/elife-75041-supp2-v2.zip
-
Supplementary file 3
R markdown scripts.
Related to all figures.
- https://cdn.elifesciences.org/articles/75041/elife-75041-supp3-v2.zip
-
Transparent reporting form
- https://cdn.elifesciences.org/articles/75041/elife-75041-transrepform1-v2.pdf
Download links
A two-part list of links to download the article, or parts of the article, in various formats.
Downloads (link to download the article as PDF)
Open citations (links to open the citations from this article in various online reference manager services)
Cite this article (links to download the citations from this article in formats compatible with various reference manager tools)
A guanosine tetraphosphate (ppGpp) mediated brake on photosynthesis is required for acclimation to nitrogen limitation in Arabidopsis
eLife 11:e75041.
https://doi.org/10.7554/eLife.75041


