Cold protection allows local cryotherapy in a clinical-relevant model of traumatic optic neuropathy
- The Eye Hospital, School of Ophthalmology & Optometry, Wenzhou Medical University, China
- Beijing Engineering Research Center of Mixed Reality and Advanced Display, School of Optics and Photonics, Beijing Institute of Technology, China
- Department of Ophthalmology, Stanford University School of Medicine, United States
- School of Laboratory Medicine and Life Sciences, Wenzhou Medical University, China
- School of Computer Science & Technology, Beijing Institute of Technology, China
- Medical Radiology Department, 2nd Affiliated Hospital, Wenzhou Medical University, China
- Animal Facility Center, Wenzhou Medical University, China
- School of Biomedical Engineering, The Eye Hospital, School of Ophthalmology & Optometry, Wenzhou Medical University, China
- Department of Hepatic Surgery and Liver Transplantation Center of the Third Affiliated, Hospital, Guangdong Province Engineering Laboratory for Transplantation Medicine, China
- Guangdong Key Laboratory of Liver Disease Research, the Third Affiliated Hospital of Sun Yat-sen University, China
- Retinal Neurophysiology Section, National Eye Institute, National Institute of Health, NIH, United States
Figures
Figure 1 with 1 supplement

Trans-nasal endoscopic-mediated exposure of pre-chiasmatic ON in goat is feasible and safe.
(A) Scheme of anatomic segments of ON and sphenoid sinus (green circle) in human. The pre-chiasmatic ON was shown in the dashed box. (B) CT scan of TON patient with optic canal fracture (blue circle). (C) Endoscopic view of human’s pre-chiasmatic ON (blue rectangle) within the large sphenoid sinus (shown in the green circle). (D) Representative skull CT scans of pre-chiasmatic ON (blue rectangle) in pigs, beagles, rhesus macaques and goats. Number sign indicated the nasal cavity. Asterisk indicated the dropping frontal cortex in pigs and beagles. Red circle indicates the sphenoid bone body in beagles, rhesus macaques and goats. Scale bar = 10 mm. (E) Endoscopic image of a goat’s sphenoid bone body, which is made of cortical bone (left panel) and trabecular bone with myeloid tissue (right panel). (F) Endoscopic image of a goat’s chiasmatic ON (blue dashed rectangle) and pre-chiasmatic ON (blue rectangle) with bony wall unremoved. (G) Endoscopic exposure of a goat’s pre-chiasmatic ON (blue rectangle) with its anterior bony wall removed. (H) Illustration of GCC thickness measurement by OCT retinal imaging around the optic nerve head in six regions (T: temple, N: nasal; S: superior; I: inferior). (I) Representative OCT images of the eye with its pre-chiasmatic ON exposed (sham surgery eye) (left panel) and quantification of GCC thickness ratio of the sham eyes to the contralateral naïve eyes before and after pre-chiasmatic ON exposure. n = 4. Scheirer-Ray-Hare test with Dunn’s multiple comparison (compared with the baseline). (J) Representative immunostaining images of the RBPMS positive RGCs in the retinal flat-mounts (left panel) and quantification of RGCs densities of the sham eyes and the contralateral eyes at 3 months after pre-chiasmatic ON exposure (right panel). n = 4. Wilcoxon test. Scale bar = 100 μm. (K) Representative microscopic images of semi-thin cross sections of ON (left panel) and quantification of axonal densities of the sham eyes and the contralateral eyes at 3 months after pre-chiasmatic ON exposure (right panel). n = 3–4. Unpaired t-test. Scale bar = 5 μm. Data were presented as mean ± s.e.m. ns: p > 0.05, not significant. CL: contralateral, mps: month post-surgery (post sham surgery). The source data is in ‘Figure 1—source data 1’.
-
Figure 1—source data 1
Endoscopic exposure of pre-chiasmatic ON is safe in goats.
- https://cdn.elifesciences.org/articles/75070/elife-75070-fig1-data1-v2.xlsx
Figure 1—figure supplement 1
Endoscopic exposure of pre-chiasmatic ON is safe in goats.
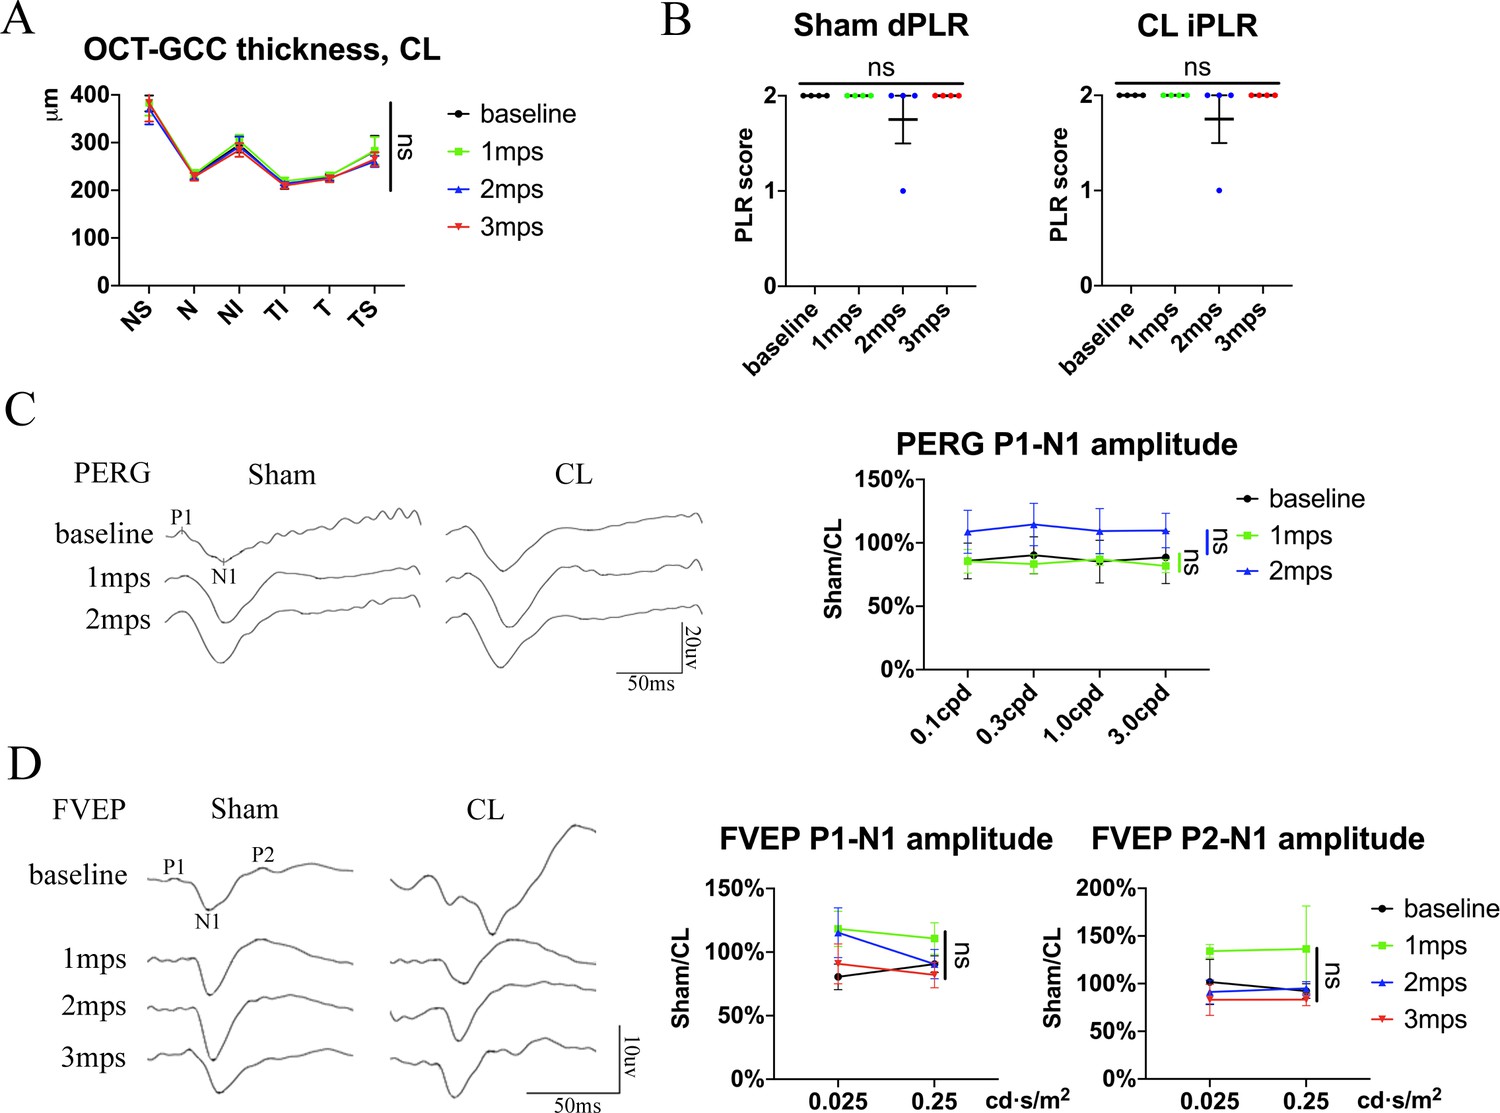
(A) Quantification of GCC thickness of the contralateral eyes before and after pre-chiasmatic ON exposure in goats. Scheirer-Ray-Hare test with Dunn’s multiple comparison (compared with baseline). n = 4. (B) Quantification of direct pupillary light response (dPLR) in the sham eyes (left panel) and indirect PLR (iPLR) in the contralateral eyes (right panel) after pre-chiasmatic ON exposure. n = 4. Friedman test with Dunn’s multiple comparison (compared with baseline), p > 0.9999. (C) Representative PERG waveforms of the sham surgery eye and the contralateral eye at spatial frequency of 0.1 cpd (left panel) and quantification of P1-N1 amplitude ratios of PERG in the sham eyes to the contralateral eyes (right panel) before and after pre-chiasmatic ON exposure. n = 4. Two-way ANOVA with Sidak’s multiple comparison (compared with the baseline). (D) Representative FVEP waveforms of the sham eyes and the contralateral eyes at light intensity of 0.025 cd·s/m2 (left panel) and quantification of P1-N1 and P2-N1 amplitudes ratios of FVEP in the sham eyes to the contralateral eyes at light intensities of 0.025 and 0.25 cd·s/m2 (right panel) before and after pre-chiasmatic ON exposure. n = 3–4. Two-way ANOVA with Sidak’s multiple comparison (compared with the baseline). Data were presented as mean ± s.e.m. ns: not significant, CL: contralateral, mps: month post-surgery (post sham surgery). The source data is in ‘Figure 1—figure supplement 1—source data 1’.
-
Figure 1—figure supplement 1—source data 1
Source data for Figure 1—figure supplement 1.
- https://cdn.elifesciences.org/articles/75070/elife-75070-fig1-figsupp1-data1-v2.xlsx
Figure 2 with 1 supplement
Trans-nasal endoscopy-mediated pre-chiasmatic ON crush in goat leads to loss of visual function.
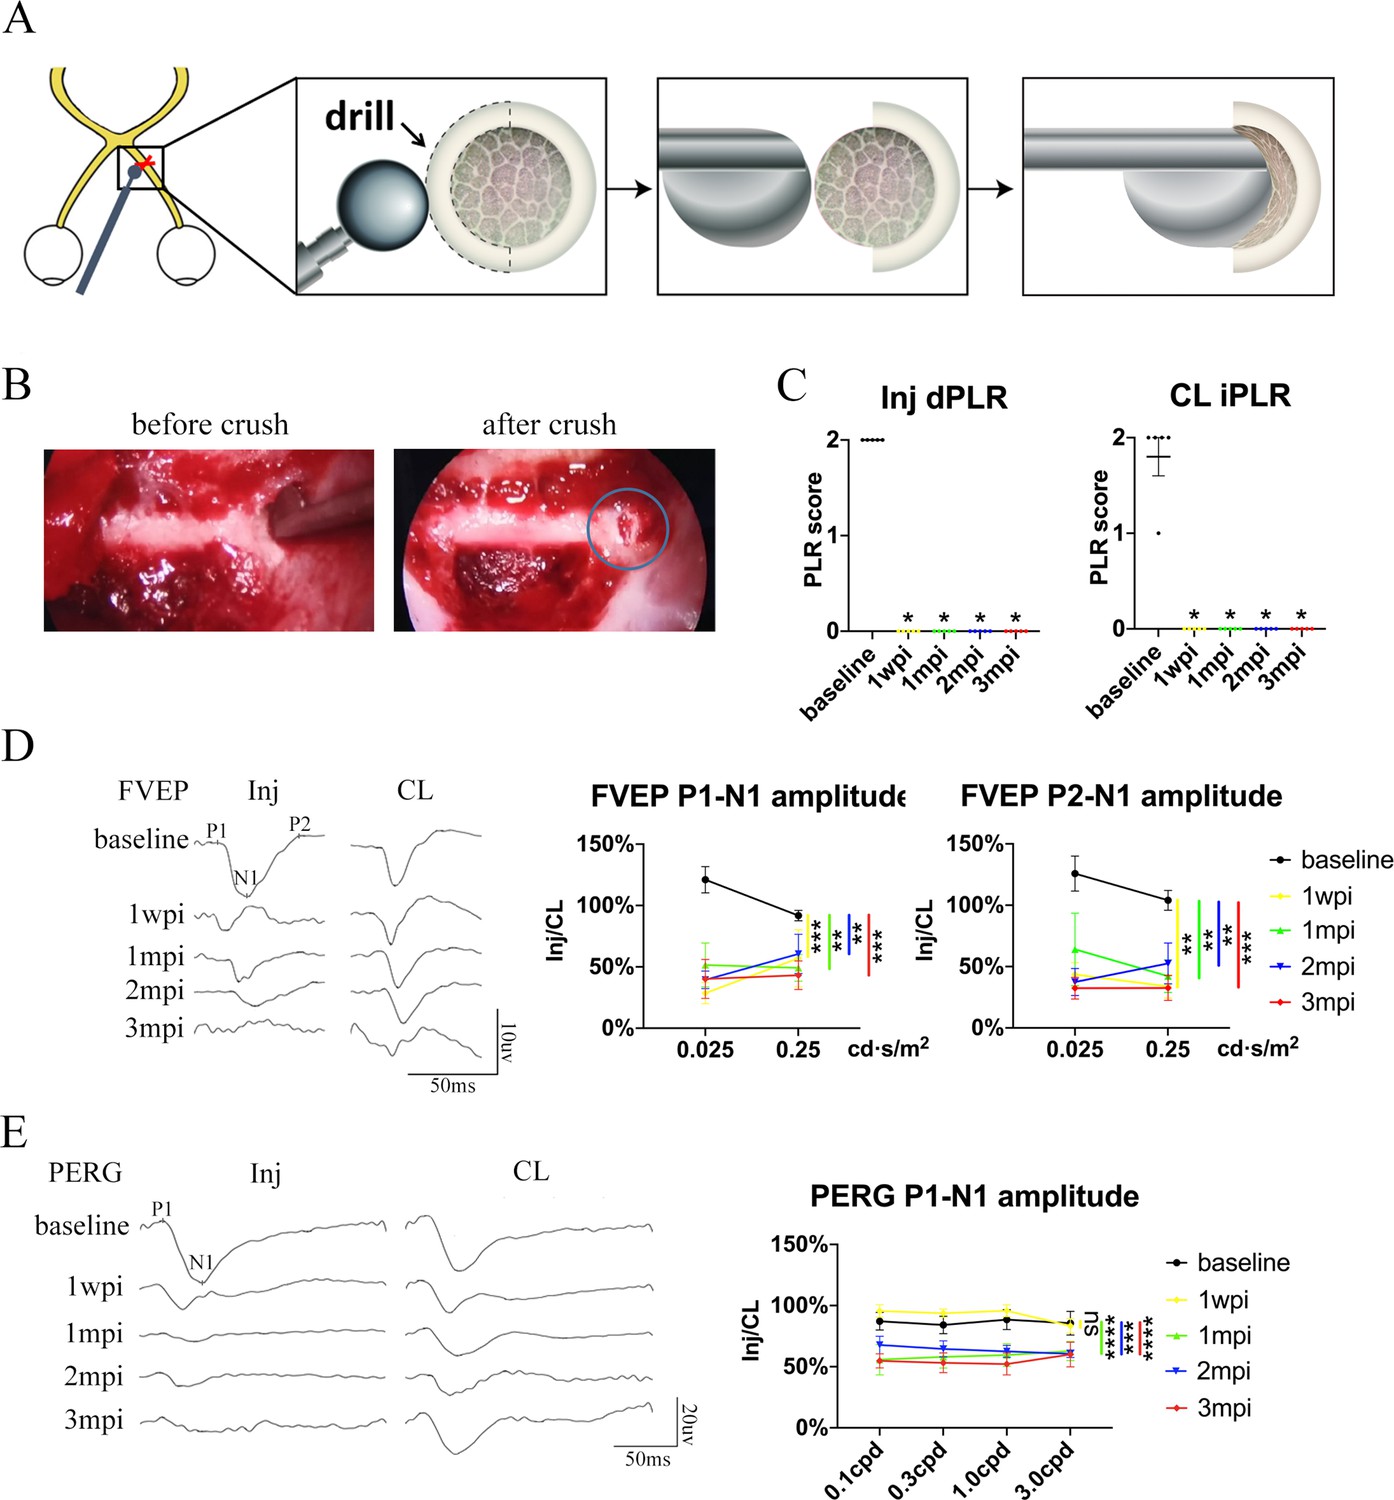
(A) Schematic illustration of pre-chiasmatic ON exposure and crush injury. (B) Endoscopic views before (left panel) and after pre-chiasmatic ON crush (right panel). Crush site was shown in the blue circle. (C) Loss of direct pupillary light response (dPLR) in the injured eyes (left panel) and indirect PLR (iPLR) in the contralateral eyes (right panel) after crush. Friedman test with Dunn’s multiple comparison (compared with baseline), p = 0.0497. (D) Representative FVEP waveforms of the injured eye and the contralateral eye at light intensity of 0.025 cd·s/m2 (left panel) and quantification of FVEP P1-N1 and P2-N1 amplitudes ratios of the injured eyes to the contralateral eyes (right panel) at different time points before and after pre-chiasmatic ON crush. Left panel: Two-way ANOVA with Tukey’s multiple comparison. Right panel: Scheirer-Ray-Hare test with Dunn’s multiple comparison (compared with the baseline). (E) Representative PERG waveforms of the injured eye and contralateral eye at spatial frequency of 0.1 cpd (left panel) and quantification of PERG P1-N1 amplitude ratios of the injured eyes to the contralateral eyes at spatial frequencies of 0.1, 0.3, 1.0, 3.0 cpd (right panel) before and after pre-chiasmatic ON crush. Two-way ANOVA with Tukey’s multiple comparison (compared with the baseline). Data were presented as mean ± s.e.m, n = 5. ns: not significant, * p < 0.05, ** p < 0.01, *** p < 0.001, **** p < 0.0001. Inj: injured, CL: contralateral, wpi: week post-injury, mpi: month post-injury. The source data is in ‘Figure 2—source data 1’.
-
Figure 2—source data 1
Source data for Figure 2.
- https://cdn.elifesciences.org/articles/75070/elife-75070-fig2-data1-v2.xlsx
Figure 2—figure supplement 1
Contralateral eyes are intact functionally and structurally after ON crush injury.
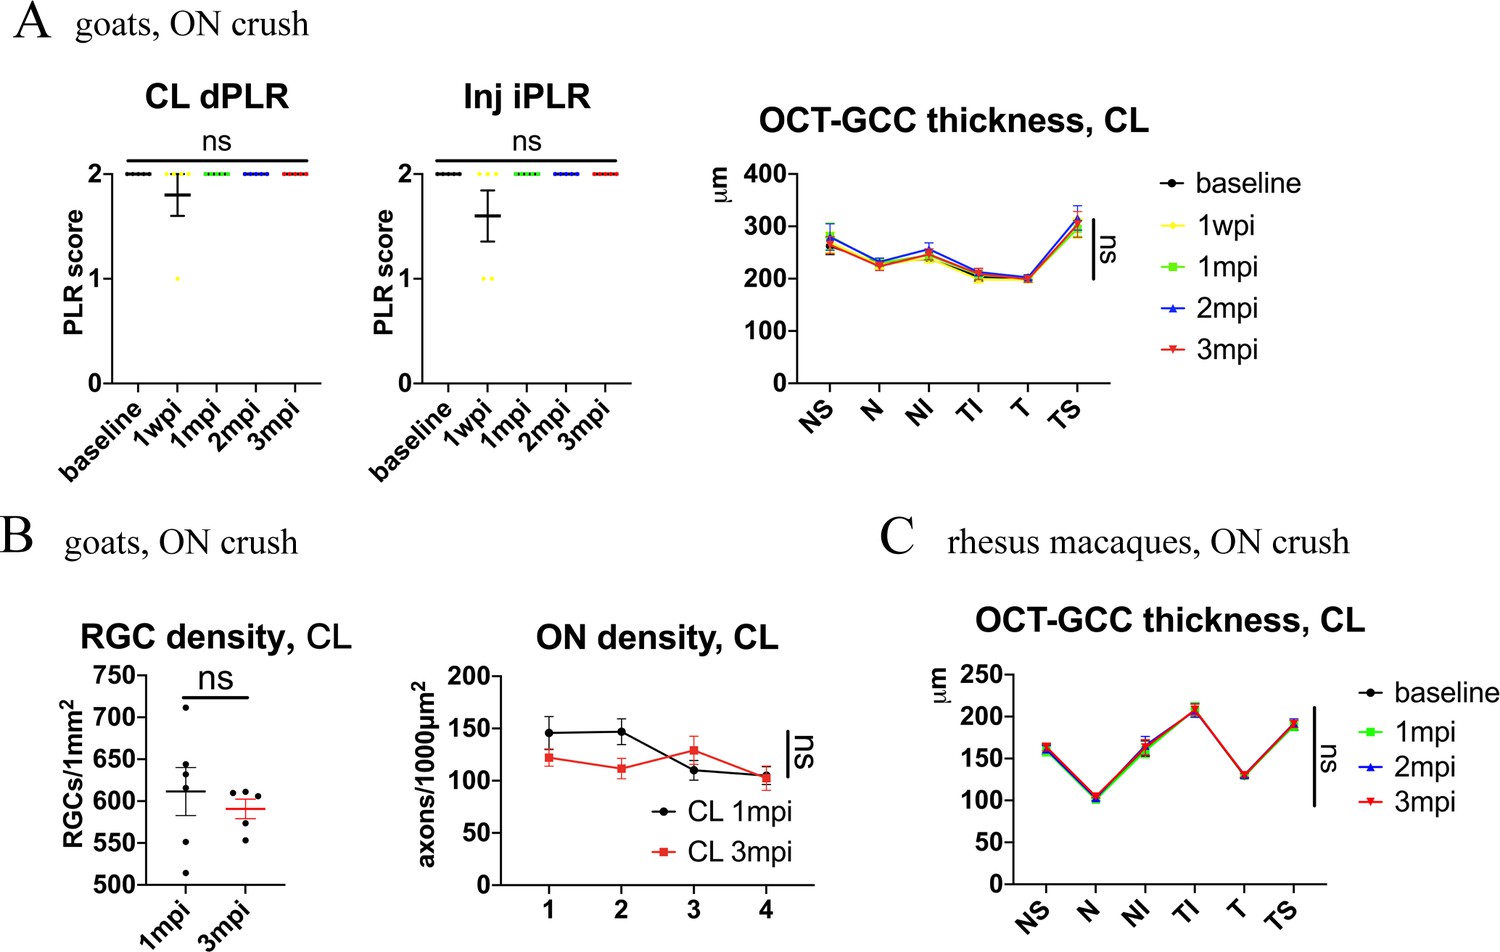
(A) Left panel: Quantification of dPLR in the contralateral eyes and iPLR in the injured eyes after pre-chiasmatic ON crush in goats. Friedman test with Dunn’s multiple comparison (compared with baseline). Right panel: quantification of GCC thickness of the contralateral eyes after pre-chiasmatic ON crush in goats. Two-way ANOVA with Tukey’s multiple comparison (compared with baseline). n = 5. (B) Left panel: quantification of RGCs densities of the contralateral eyes at 1, 3 mpi after pre-chiasmatic ON crush in goats. Unpaired t-test. n = 5–6. Right panel: quantification of axonal densities of the contralateral eyes at different ON segments at 1, 3 mpi after pre-chiasmatic ON crush in goats. Two-way ANOVA. n = 3–6. (C) Quantification of GCC thickness of the contralateral eyes after pre-chiasmatic ON crush in rhesus macaques. Scheirer-Ray-Hare test with Dunn’s multiple comparison (compared with baseline). n = 4. Data were presented as mean ± s.e.m, ns: not significant, CL: contralateral, wpi: week post-injury, mpi: month post-injury. The source data is in ‘Figure 2—figure supplement 1—source data 1’.
-
Figure 2—figure supplement 1—source data 1
Source data for Figure 2—figure supplement 1.
- https://cdn.elifesciences.org/articles/75070/elife-75070-fig2-figsupp1-data1-v2.xlsx
Figure 3
Spatiotemporal pattern of RGC and ON degeneration in goat TON model.
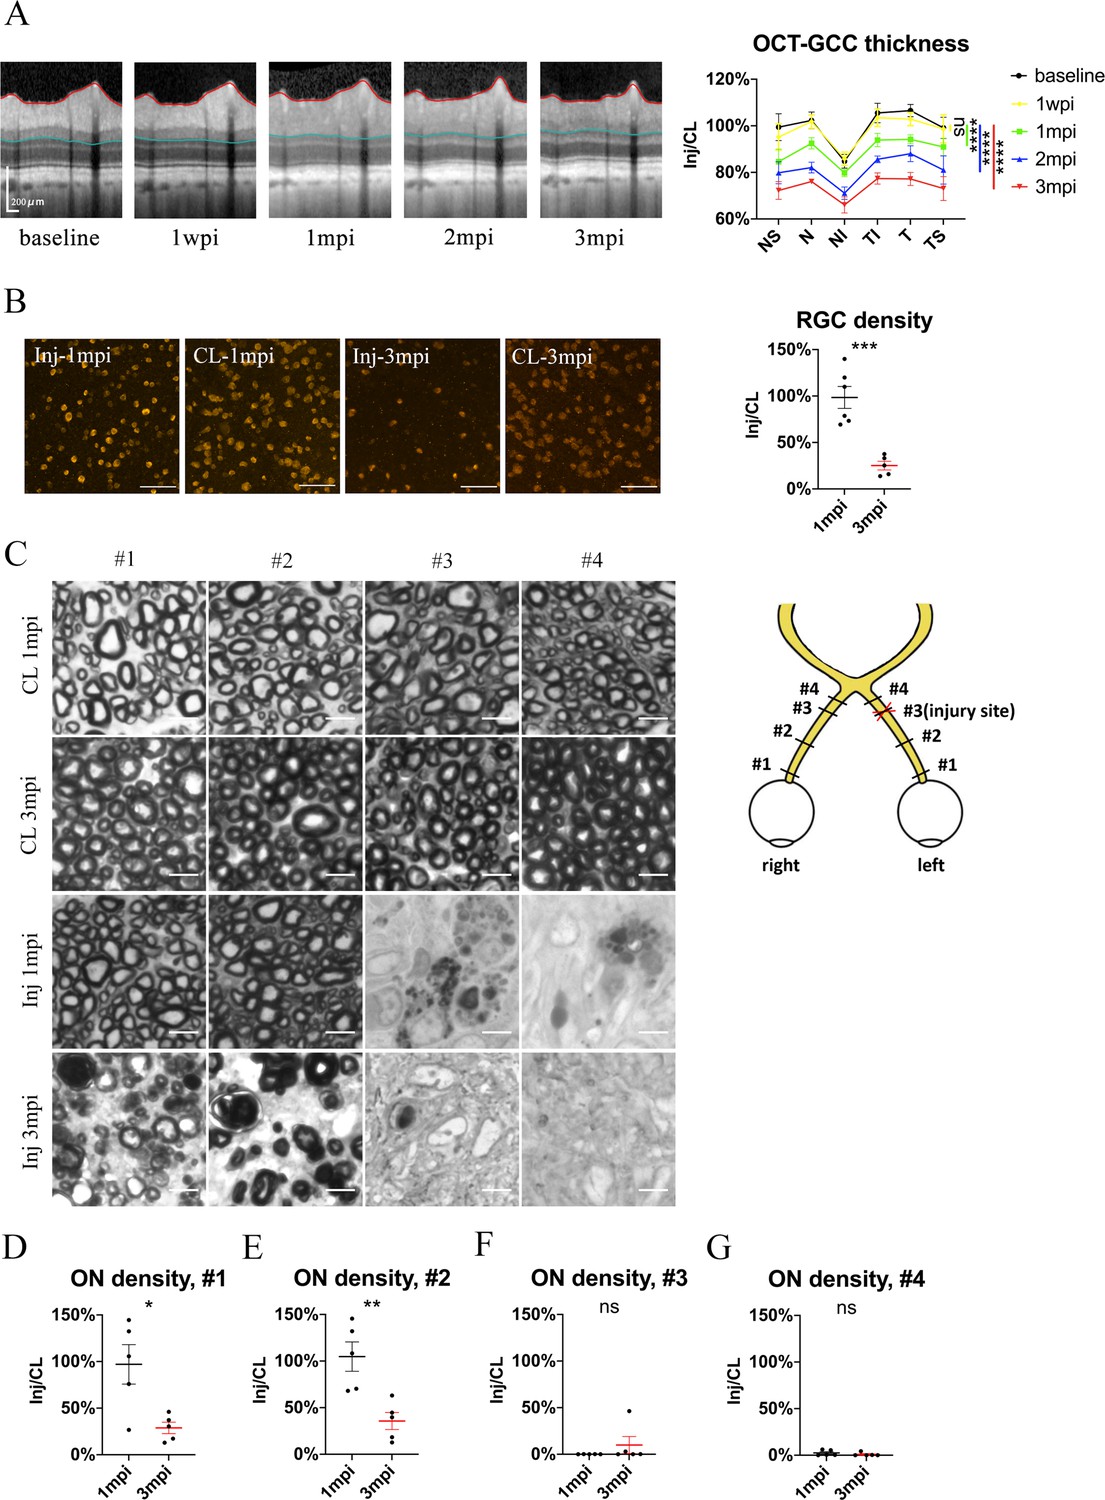
(A) Representative OCT images of the injured eye (left panel) and quantification of GCC thickness ratios of the injured eyes to that of the contralateral eyes at six regions around ON head (right panel) before and after pre-chiasmatic ON crush. n = 5. Two-way ANOVA with Tukey’s multiple comparison (compared with the baseline). (B) Representative immunostaining images of the RBPMS positive retinal ganglion cells (RGCs) in the retinal flat-mounts (left panel) and quantification of RGCs densities ratios of the injured eyes to the contralateral eyes at 1, 3 mpi (right panel). n = 5–6. Unpaired t-test. Scale bar = 100 μm. (C) Left panel: representative microscopic images of semi-thin cross sections of ON stained by PPD at different ON segments of the injured eye and its contralateral eye at 1, 3 mpi. Scale bar = 5 μm. Right panel: scheme of sampling sites at different ON segments (#1, 2, 3, 4). (D–G) Quantification of axonal densities ratios of the injured eyes to the contralateral eyes at different ON segments at 1 and 3 mpi. n = 5. (D, E) Unpaired t-test. (E, F) Mann-Whitney test. Data were presented as mean ± s.e.m. ns: not significant, * p < 0.05, ** p < 0.01, *** p < 0.001, **** p < 0.0001. Inj: injured, CL: contralateral, wpi: week post-injury, mpi: month post-injury. The source data is in ‘Figure 3—source data 1’.
-
Figure 3—source data 1
Source data for Figure 3.
- https://cdn.elifesciences.org/articles/75070/elife-75070-fig3-data1-v2.xlsx
Figure 4 with 2 supplements
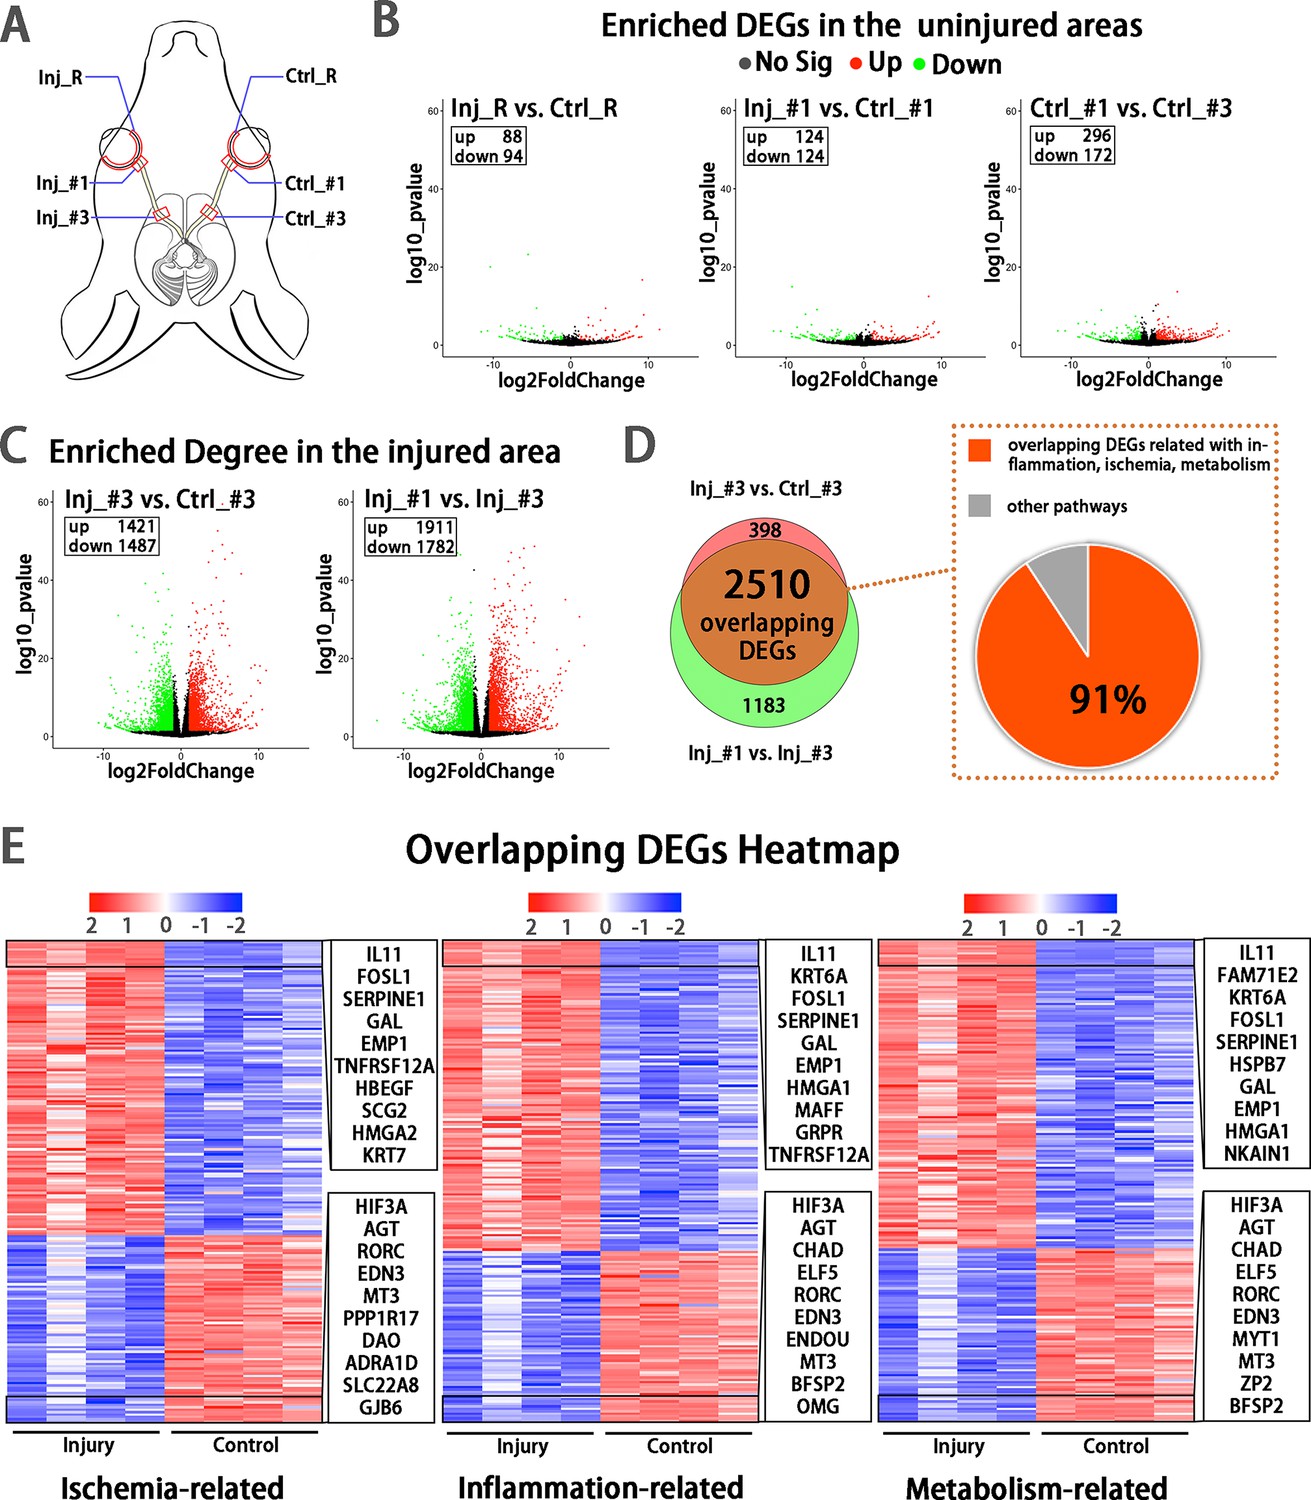
Early transcriptomic changes are confined to the injury site and mostly enriched in the pathways of ischemia, inflammation and metabolism.
(A) Scheme of sampling sites at the retina (R), retrobulbar (#1) and pre-chiasmatic ON (#3) of the injury eye (Inj) and its contralateral eye (Ctrl). (B, C) Volcano plots showing differential expression genes (DEGs) in the non-injured areas (B) and the injured areas (C). Red dots: significant upregulated genes, green dots: significant downregulated genes, adjusted P < 0.05. log2FC is 1. (D) Venn diagram indicating the overlapping DEGs between Inj_#3 vs. Ctrl_#3 (ipsilateral-contralateral comparison) and Inj_#3 vs. Inj_#1 (proximal-distal comparison of the ipsilateral eye) (left panel), 91% of which were clustered in the pathways of inflammation, ischemia and metabolism (right panel). (E): Heatmap showing TOP 200 overlapping DEGs related with pathways of ischemia (left panel), inflammation (mid panel) and metabolism (right panel) based on the DEGs of Inj_#3 vs. Ctrl_#3. Ranking was determined by the magnitude of fold change. Upper box shows the top 10 up-regulated genes, and the below one shows the top 10 down-regulated genes.
Figure 4—figure supplement 1
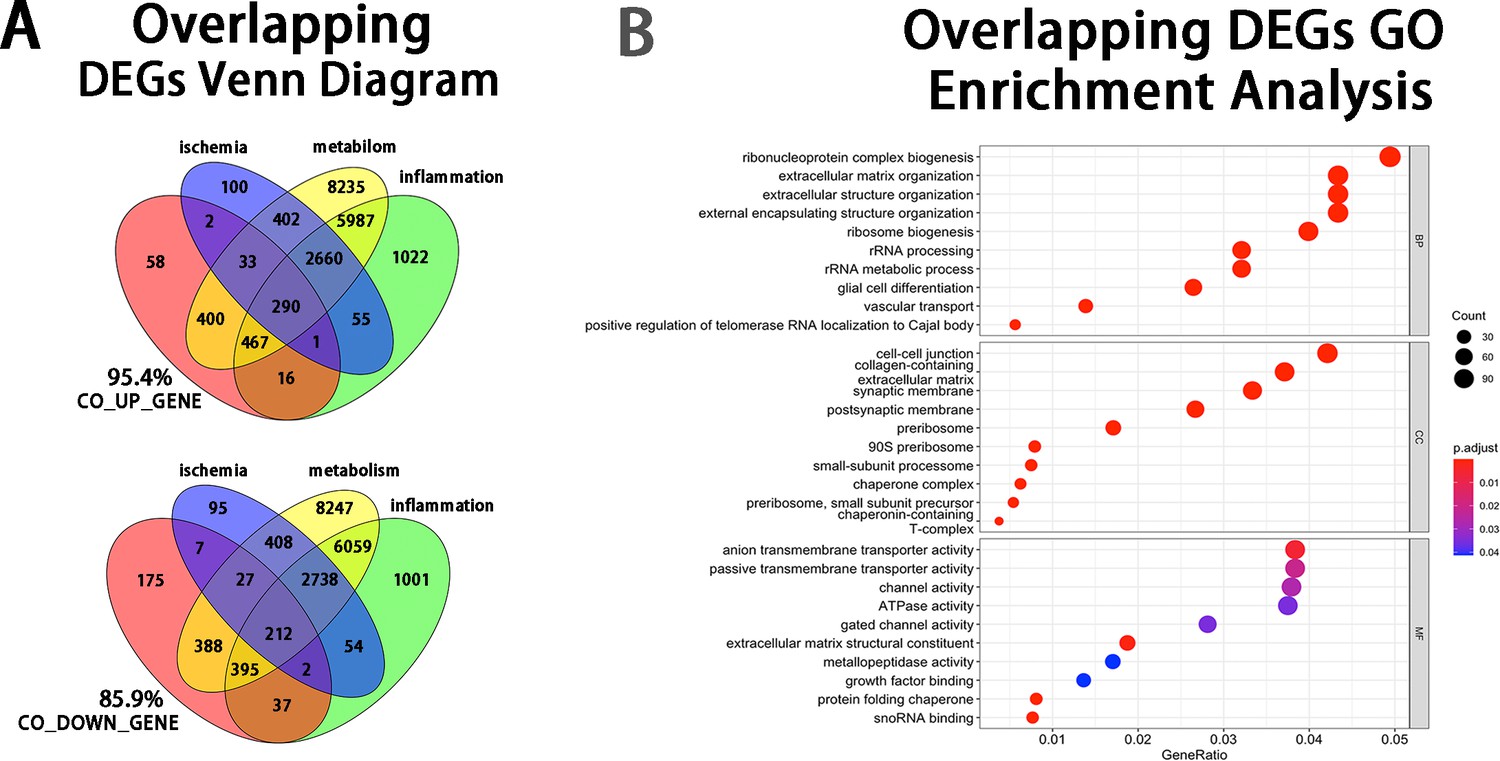
Bioinformatic analyses of the overlapping DEGs at the injury site.
(A) Venn diagram showing that 95.4% of the up-regulated and 85.9% of the down-regulated overlapping DEGs at the injury sit were enriched in the pathways of ischemia, inflammation, metabolism. (B) Enrichment analysis of overlapping DEGs using the Gene Ontology.
Figure 4—figure supplement 2
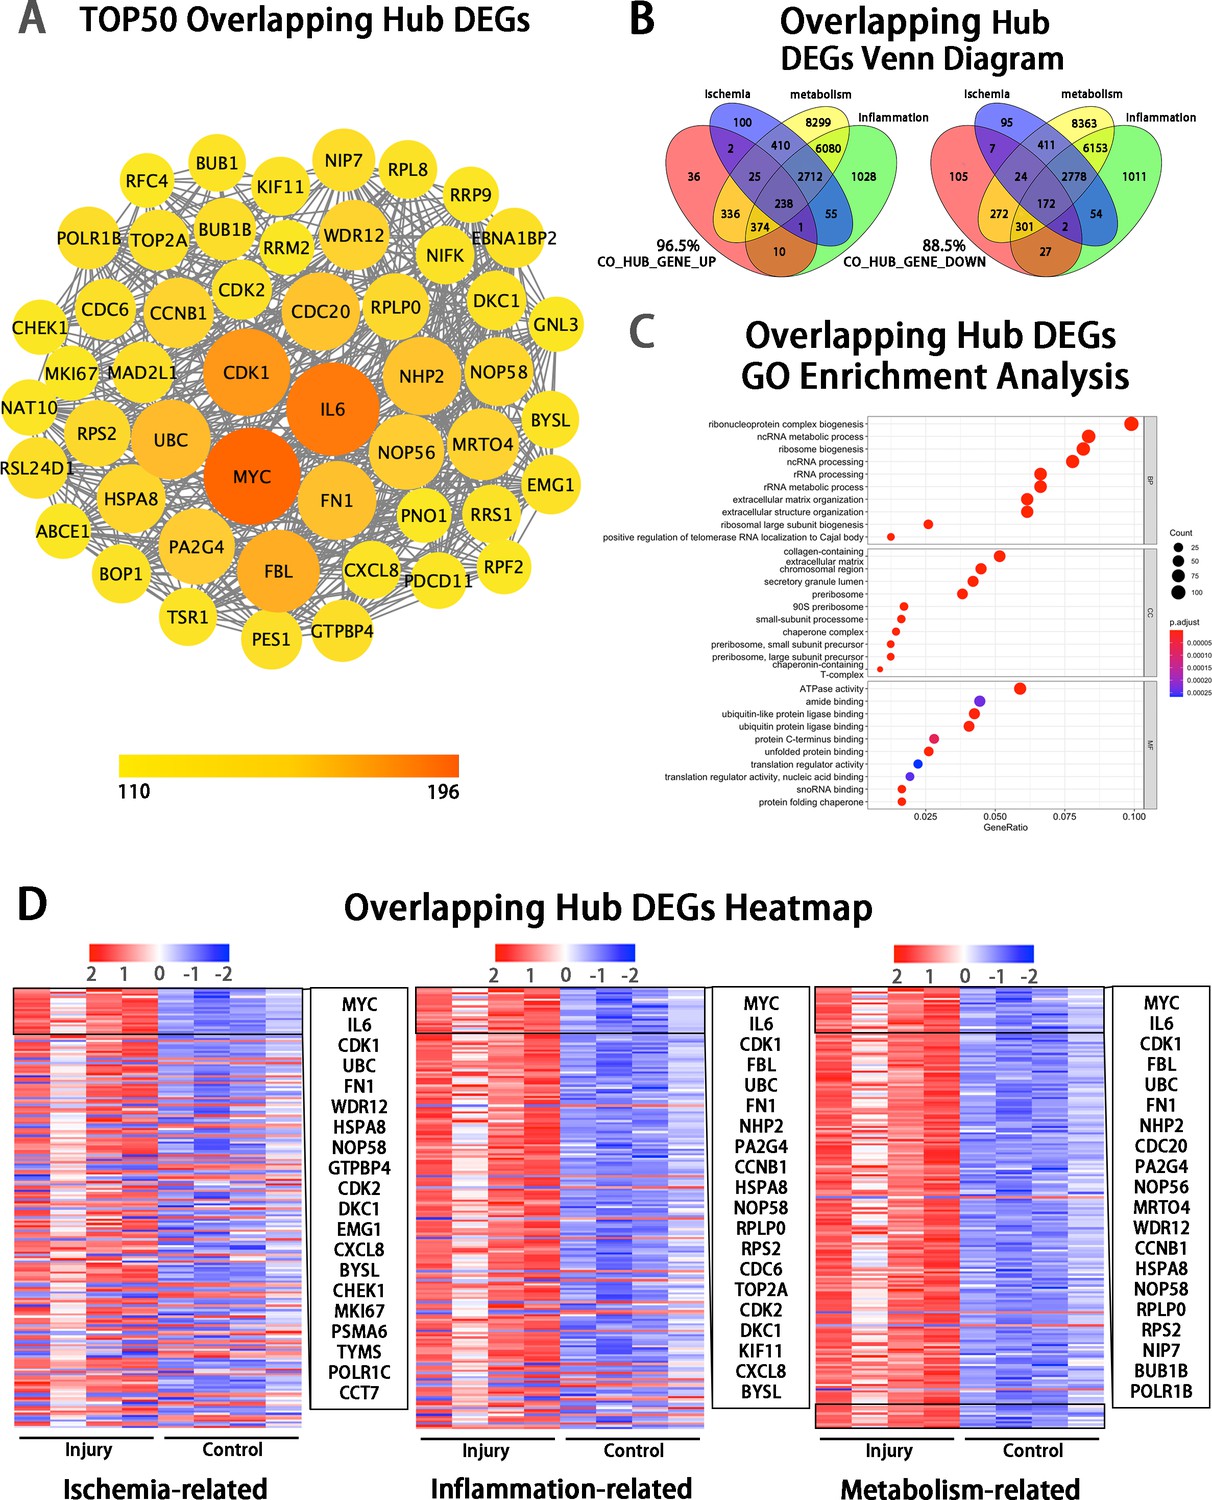
Bioinformatic analyses of the overlapping hub DEGs at the injury site.
(A) Protein–protein interactions diagram of TOP 50 overlapping hub gene (DEGs with highest connectivity). (B) Venn diagram showing that 96.5% of the up-regulated and 88.5% of the down-regulated hub genes were enriched in the pathways of ischemia, inflammation, metabolism. (C) Enrichment analysis of hub genes using the Gene Ontology (GO). (D) Heatmap showing TOP overlapping hub genes enriched in the pathways of ischemia (left panel), inflammation (mid panel) and metabolism (right panel) based on the hub genes of Inj_#3 vs. Ctrl_#3 group. Ranking was determined by the magnitude of fold change.
Figure 5 with 1 supplement
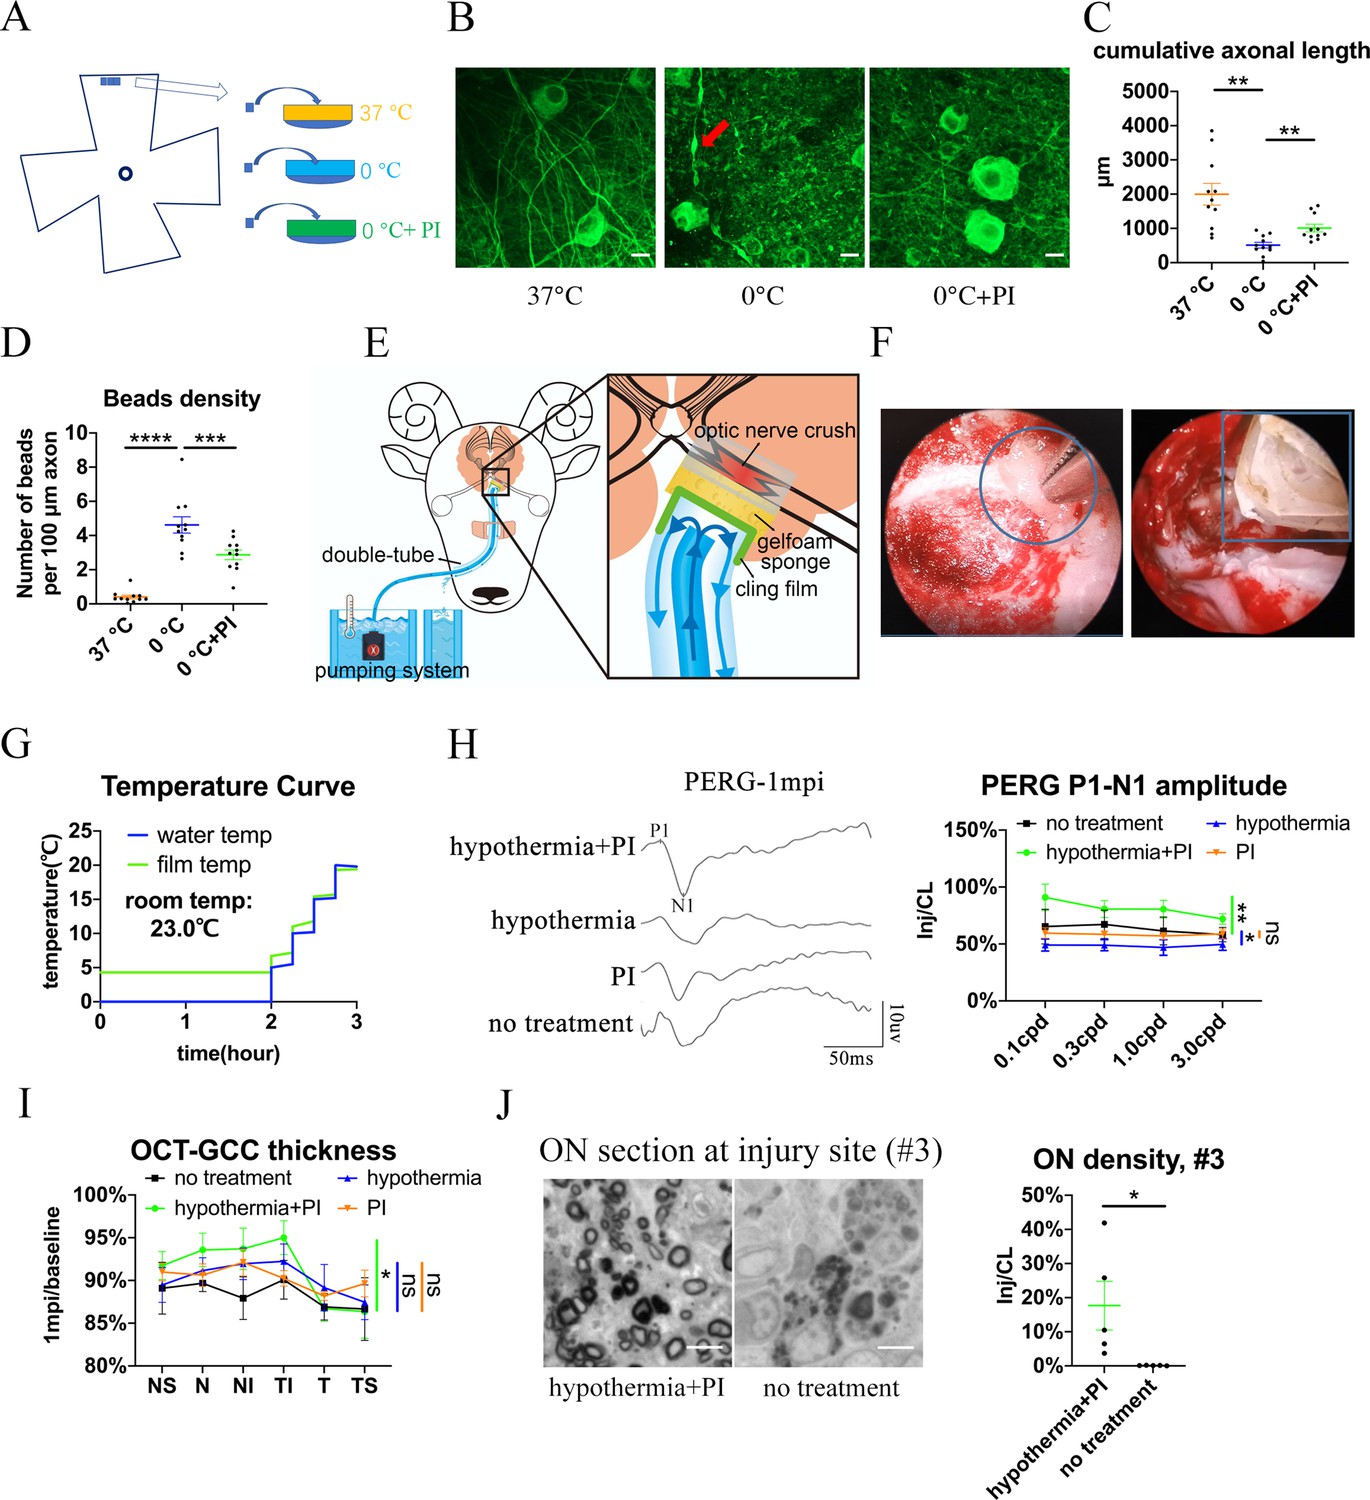
Local delivery of hypothermia combined with cold-protective reagent, but neither treatment alone, achieved significant neural protection.
(A) Scheme for the ex vivo experiments shown in (A)- (D). (B) Representative confocal images of retinal explants immunostained with beta-3 tubulin (TUBB3) at 37 °C, at 0 °C, or at 0 °C with PI. A typical axonal bead was labeled by a red arrow. Scale bar: 10 μm. (C, D) Quantification of cumulative axonal length (C) and axonal beads density (D) at 37 °C, at 0 °C, and at 0 °C with PI. n = 11 retinal explants from 4 goats for each group. (C) One-way ANOVA with Dunnett’s multiple comparisons test. (D) One-way ANOVA with Holm-Šídák’s multiple comparisons test. (E) Scheme of local delivery of hypothermia and protease inhibitors (PI) at the injury site of the pre-chiasmatic ON. (F) Endoscopic image showing placement of a piece of sponge (shown within a circle) (left panel) and a cooling tube (shown within a rectangle) (right panel) at the injured pre-chiasmatic ON. (G) Temperature curves of the cooling water and the cling film during local hypothermia. (H) Representative PERG waveforms at spatial frequency of 0.1 cpd (left panel) and comparison of PERG P1-N1 amplitude ratios at 1 mpi in the following groups: hypothermia combined with PI, hypothermia alone, PI alone, no treatment. n = 5–6 in each group. Scheirer-Ray-Hare test with Dunn’s multiple comparison. (I) Comparison of GCC thickness ratio of the injured eyes to the contralateral eyes at six different regions around ON head among each group at 1 mpi. n = 5–6 in each group. Two-way ANOVA and Scheirer-Ray-Hare test. (J) Representative images of ON semi-section (left panel) and comparison of axonal densities at the injury site in hypothermia combined with PI, and in a group with no treatment. n = 5–6 for each group. Unpaired t-test, p = 0.0398. Data were presented as mean ± s.e.m. ns: not significant, * p < 0.05, ** p < 0.01, *** p < 0.001, **** p < 0.0001. Inj: injured, CL: contralateral. The source data is in ‘Figure 5—source data 1’.
-
Figure 5—source data 1
Source data for Figure 5.
- https://cdn.elifesciences.org/articles/75070/elife-75070-fig5-data1-v2.xlsx
Figure 5—figure supplement 1
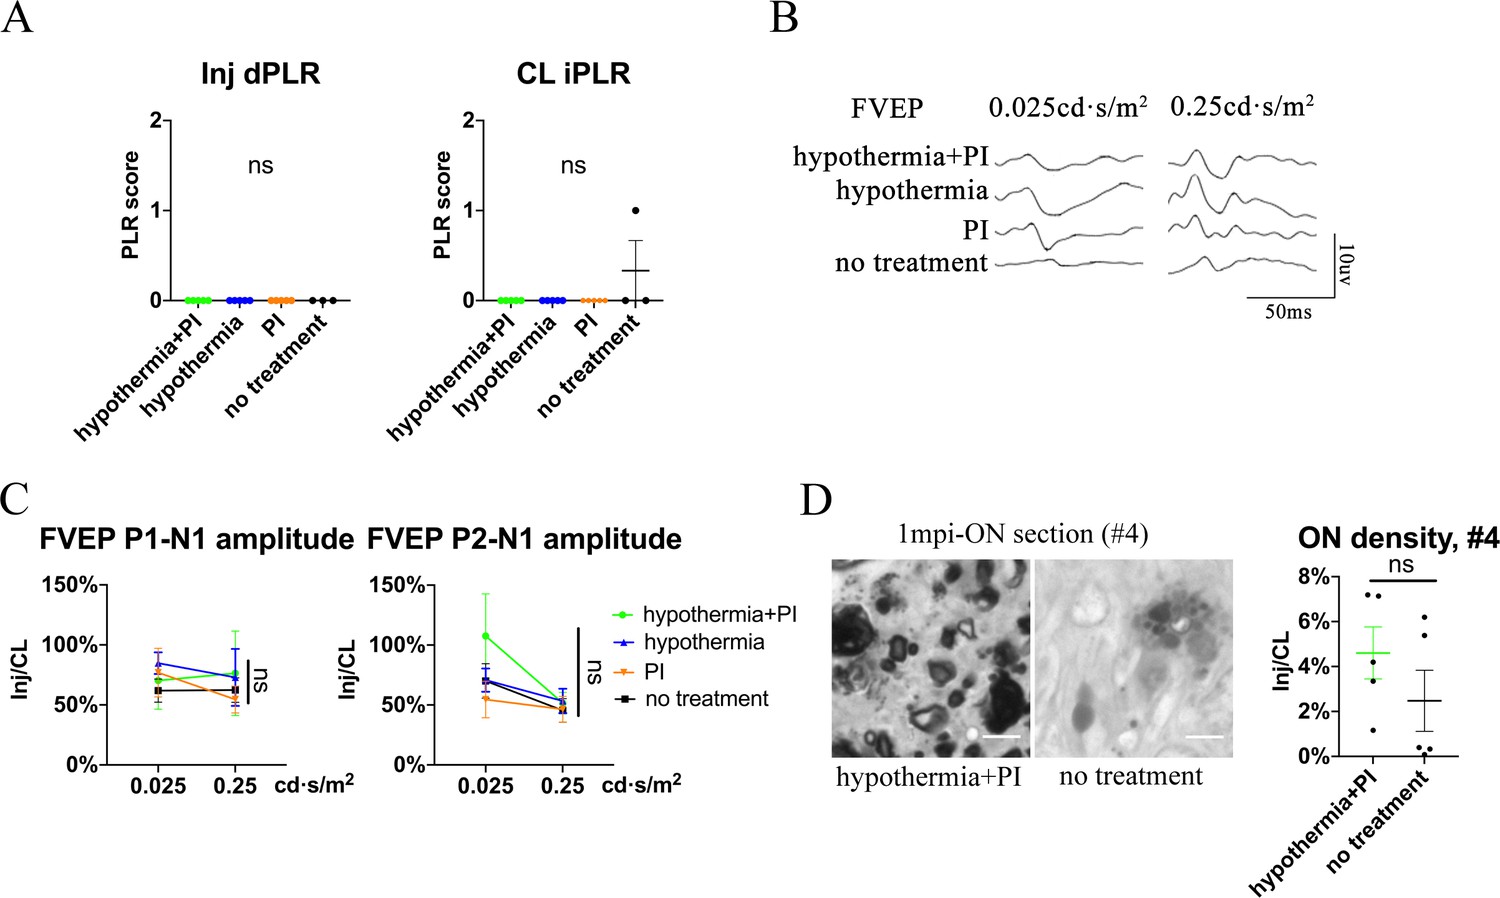
Local hypothermia combined with PI does not show significant rescue of PLR, FVEP and axonal density at distal ON segment (#4 region).
(A) Quantification of dPLR in the injured eyes (left panel) and iPLR in the contralateral eyes (right panel) in the groups of hypothermia combined with PI, hypothermia alone, PI alone and no treatment. n = 5–6 in each group. (B, C) Representative FVEP waveform and quantification of the P1-N1 and P2-N1 amplitudes ratios of FVEP in the injured eyes to the contralateral eyes in each group at 1 mpi. n = 5–6 in each group. Two-way ANOVA. (D) Representative images of ON semi-section (left panel) and comparison of axonal densities (right panel) in the groups of hypothermia combined with PI and no treatment at the #4 segment at 1 mpi. n = 5–6 for each group.Mann Whitney test. Data were presented as mean ± s.e.m. ns: not significant. Inj: injured, CL: contralateral. The source data is in ‘Figure 5—figure supplement 1—source data 1’.
-
Figure 5—figure supplement 1—source data 1
Source data for Figure 5—figure supplement 1.
- https://cdn.elifesciences.org/articles/75070/elife-75070-fig5-figsupp1-data1-v2.xlsx
Figure 6
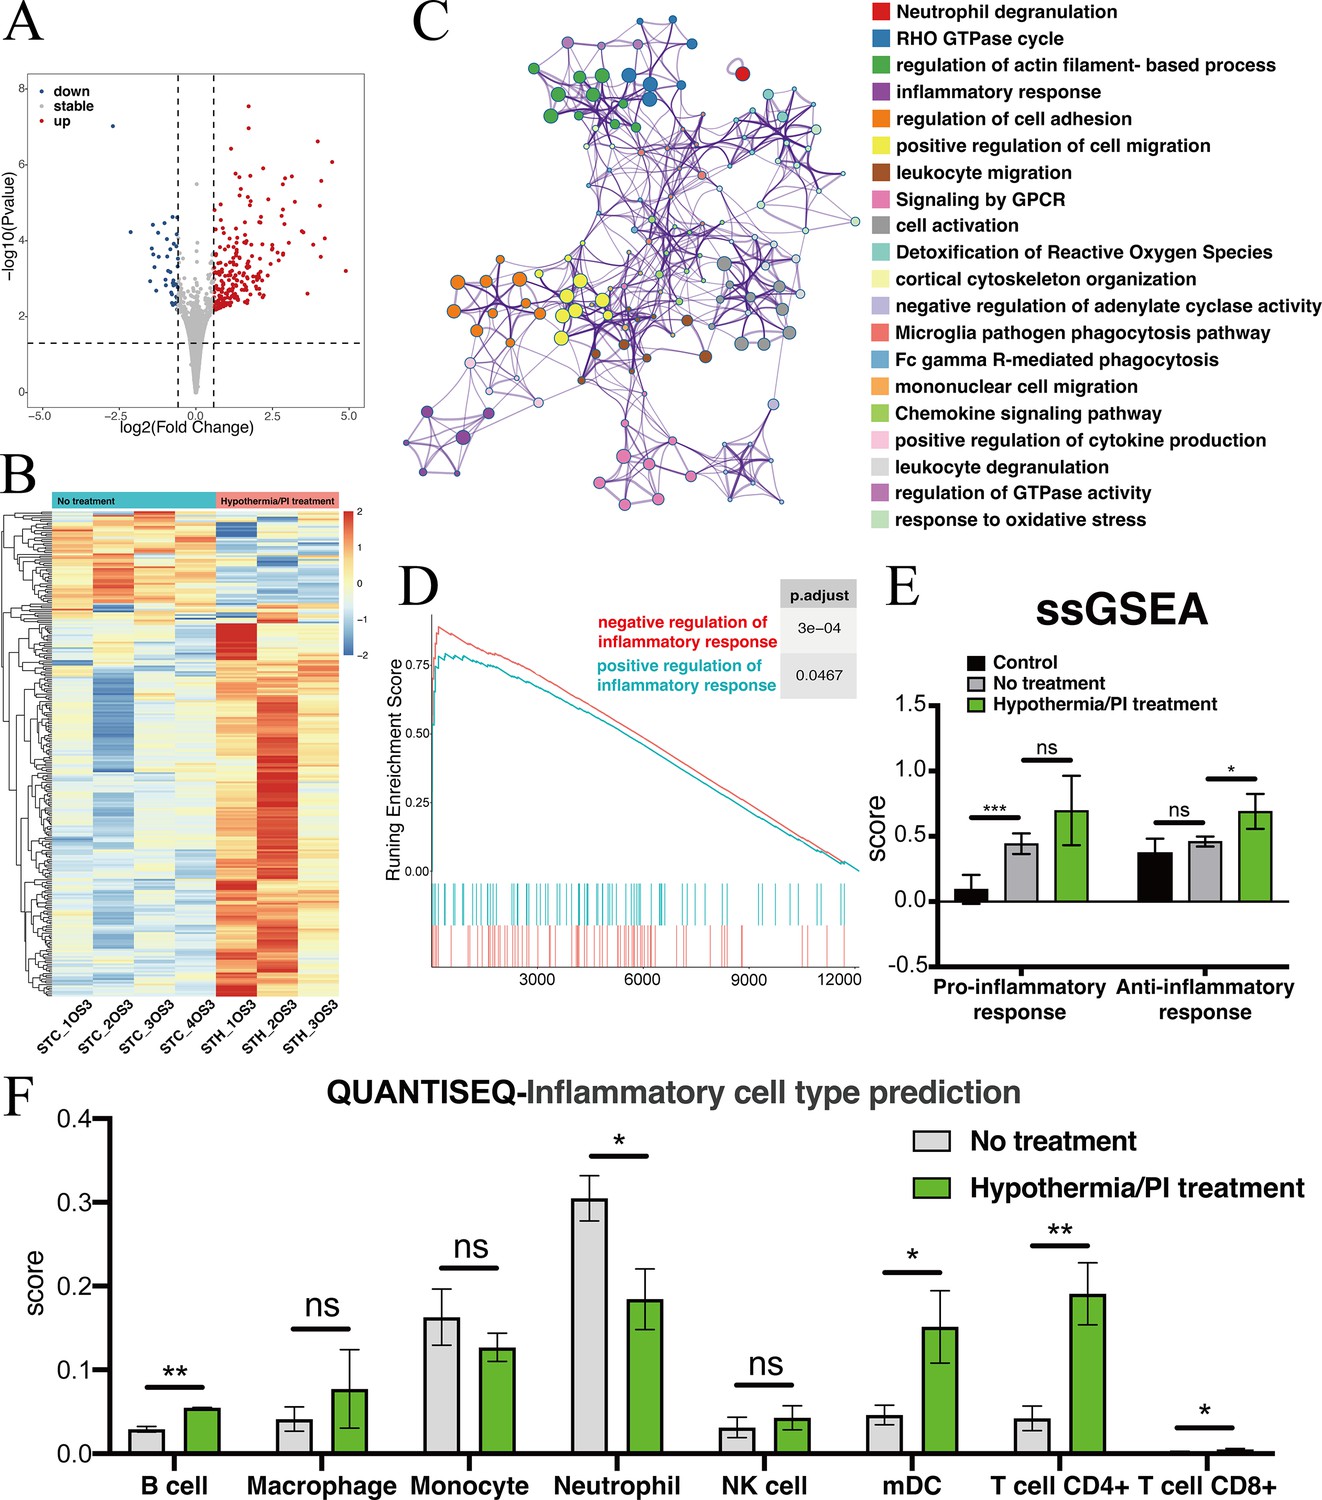
Transcriptomic changes at the injured pre-chiasmatic ON after local hypothermia/PI treatment.
(A) Volcano plot showing the differential expression genes in the injured pre-chiasmatic ON between hypothermia/PI treatment group and no treatment group. (Threshold of p-value is 0.05, foldchange is 1.5.) (B) Heat map showing the inter-sample distribution of all differential genes from the difference analysis between the treatment and no-treatment groups. (C) Gene ontology analysis of differential genes. (D) GSEA enrichment profiles of two pathways: positive regulation of inflammatory response, negative regulation of inflammatory response. (E) Pro-inflammatory response (GO:0050729: positive regulation of inflammatory response) and Anti-inflammatory response (GO:0050728: negative regulation of inflammatory response) ssGSEA distribution among three groups (Control (contralateral pre-chiasmatic ON), no treatment, and hypothermia/PI treatment). (F) quanTIseq immune cell densities prediction analysis (mDC: Myeloid dendritic cell).
Figure 7 with 1 supplement
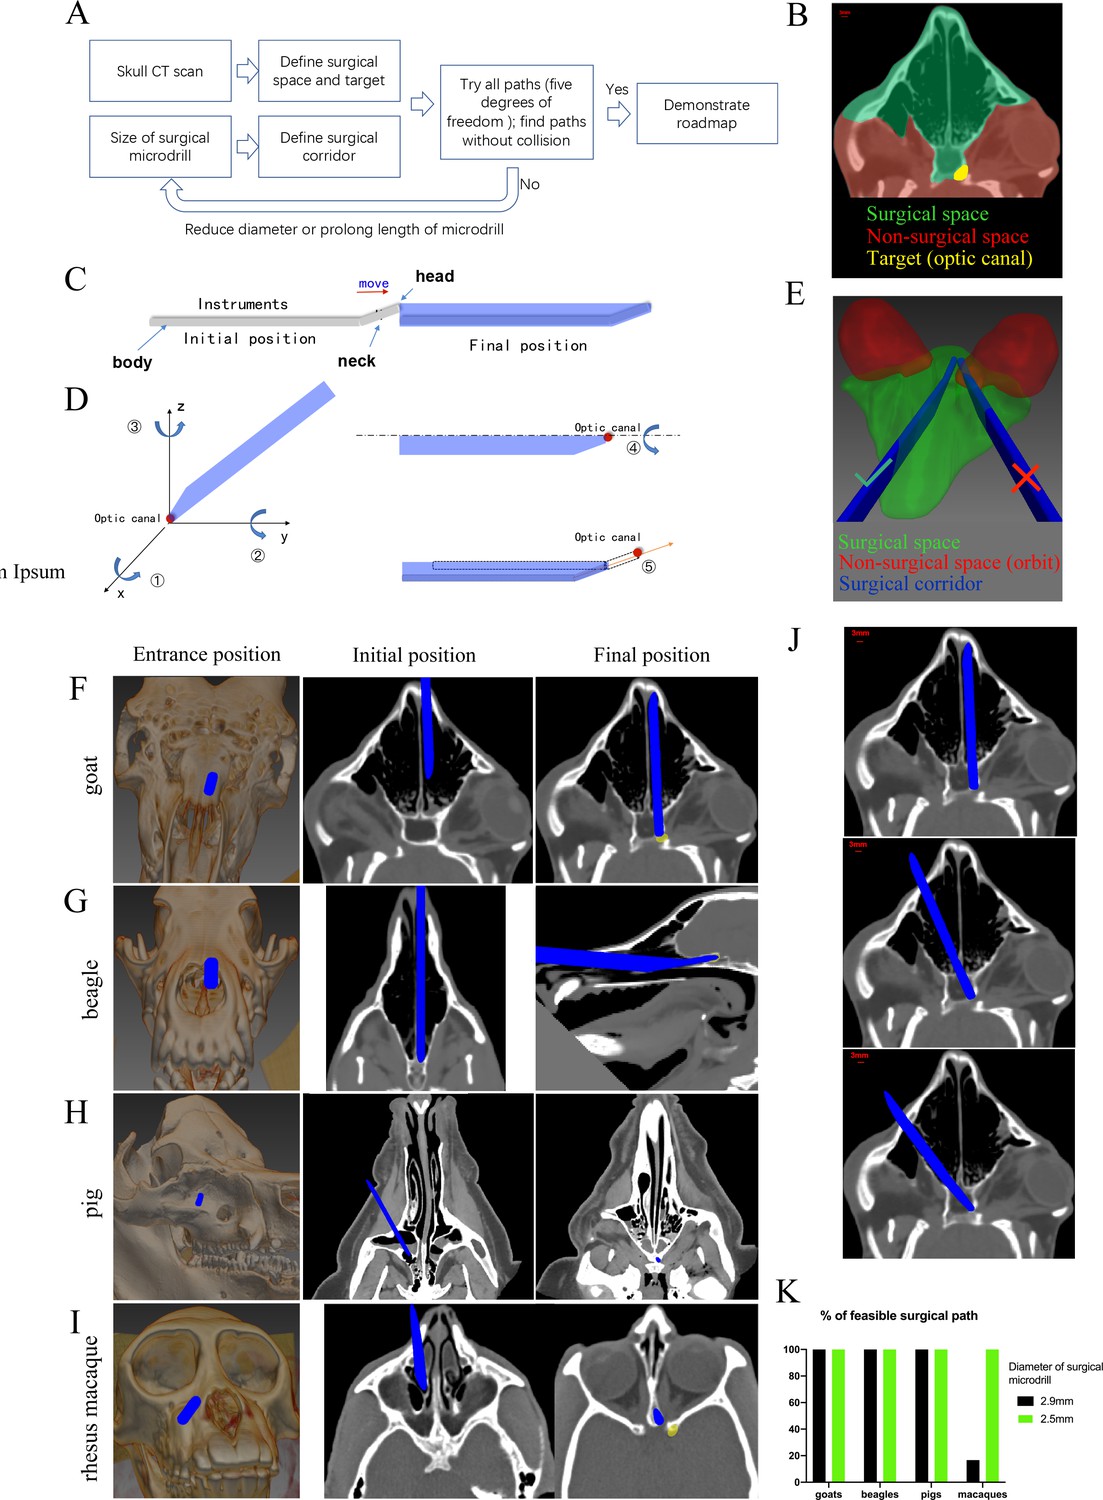
Computer program-aided optimization of trans-nasal endoscopic surgery in multiple species of large animals.
(A) Flowchart of the computer program. (B) Segmentation of surgical space (in green), non-surgical space (in red) and surgical target (in yellow) in the program. (C) Scheme of surgical corridor (in blue) outlined by the surgical microdrill’s movement along its major axis. (D) Demonstration of five degrees of freedom of the surgical corridor. (E) Demonstration of a feasible surgical corridor (on the left) and an infeasible surgical corridor colliding with orbital cavity (on the right). (F–I) Representatives of virtual surgical paths in goats, beagles, domestic pigs, and rhesus macaques, respectively. Surgical entries were shown on the surface of three-dimensional reconstructed skull (left panels) and on the horizontal CT plane (middle panels). Right panels: projection of the surgical corridor on the CT plane through the pre-chiasmatic ON (surgical target). (J) Representatives of multiple feasible virtual surgical paths in goats. Scale bar = 3 mm. (K) Quantification of percentages of feasible surgical paths in goats, beagles, domestic pigs and rhesus macaques by using different sizes of surgical microdrills (diameter = 2.5 and 2.9 mm).
Figure 7—figure supplement 1
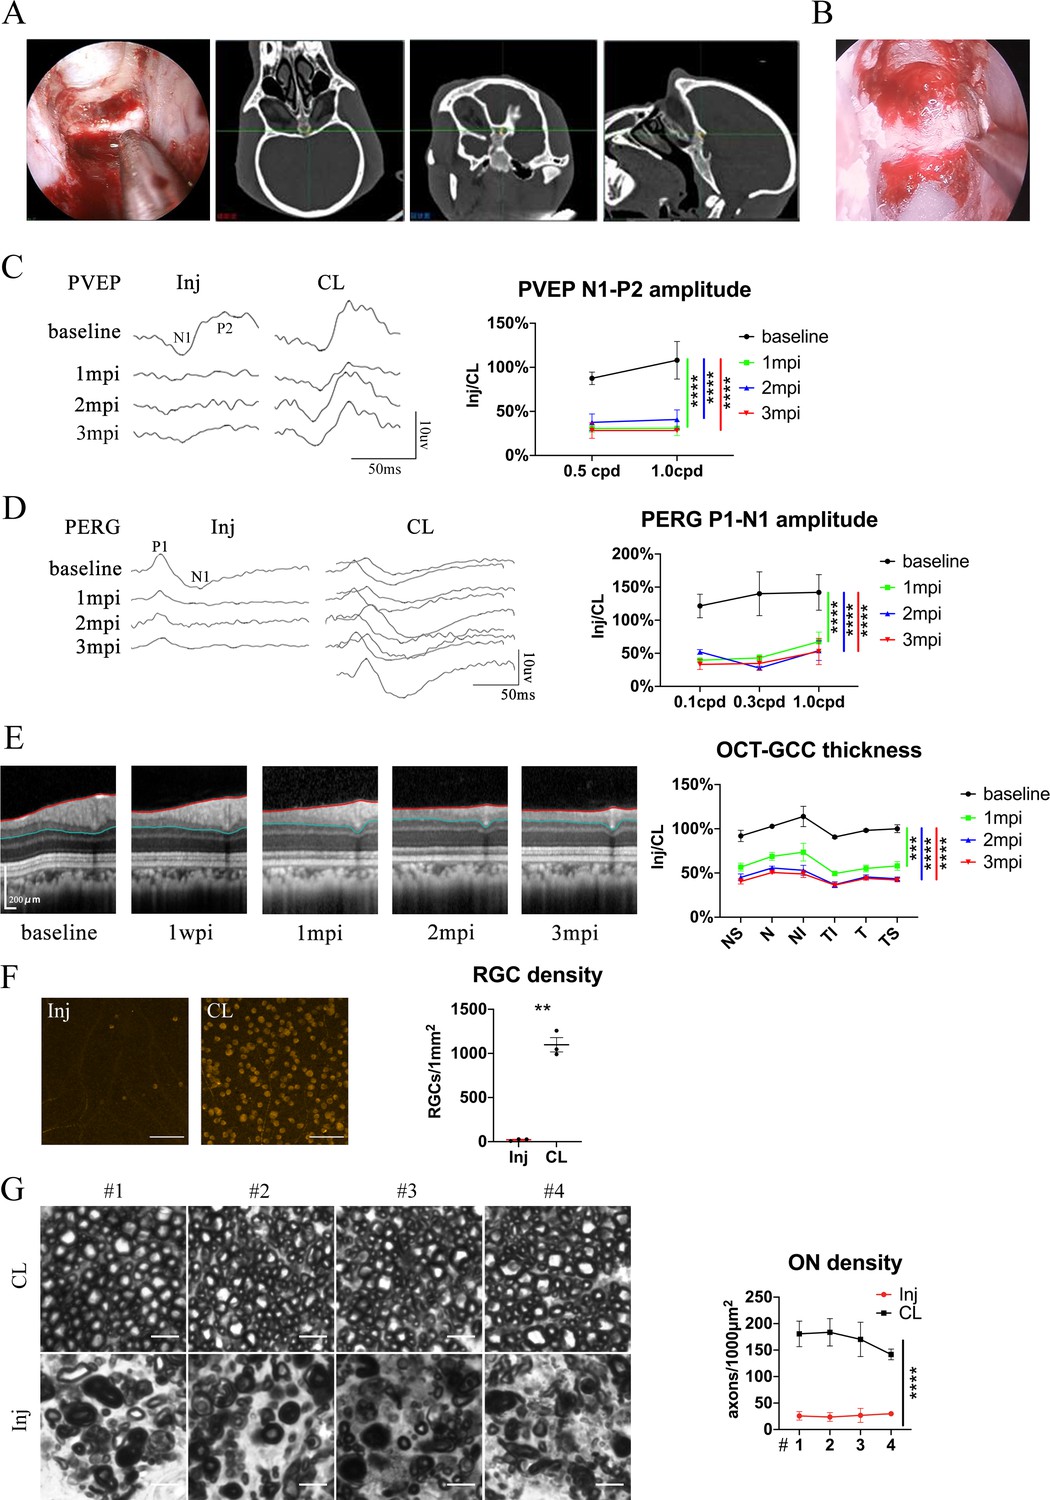
Pre-chiasmatic TON model in rhesus macaque (A) Confirmation of the pre-chiasmatic ON in rhesus macaques (left panel) using the surgical navigation system on the horizontal, coronal and sagittal CT planes (right panel).
(B) Endoscopic image of pre-chiasmatic ON crush. (C) Representative PVEP waveforms of the injured eye and the contralateral eye at spatial frequencies of 0.5 cpd (left panel) and quantification of the N1-P2 amplitude ratios of the injured eyes to the contralateral eyes at spatial frequencies of 0.5 and 1.0 cpd before and after crush (right panel). n = 4. Two-way ANOVA with Tukey’s multiple comparison (compared with the baseline). (D) Representative PERG waveforms of the injured eye and the contralateral eye at spatial frequency of 0.1 cpd (left panel) and quantification of P1-N1 amplitude ratios of the injured eyes to the contralateral eyes at spatial frequencies of 0.1, 0.3, 1.0 cpd (right panel) before and after crush. n = 3–4. Two-way ANOVA with Tukey’s multiple comparison (compared with the baseline). (E) Representative OCT images of the injured eye (left panel) and quantification of GCC thickness ratios of the injured eyes to the contralateral eyes at six regions around ON head before and after crush (right panel). n = 4. Mann Whitney test with Dunn’s multiple comparison (compared with the baseline). (F) Representative immunostaining images of the RBMPS positive RGCs in the retinal flat-mounts (left panel) and quantification of RGCs densities of the injured eyes and the contralateral eyes at 3 mpi (right panel). n = 3. Paired t-test. Scale bar = 100 μm. (G) Left panel: representative microscopic images of semi-thin cross sections of ON stained by PPD at different ON segments (#1, 2, 3, 4) of the injured eyes and its contralateral eyes at 3 mpi. Scale bar = 5 μm. Right panel: comparison of axonal densities at different ON sites between the injured eyes and the contralateral eyes at 3 mpi. n = 3. Two-way ANOVA. Data were presented as mean ± s.e.m. ns: not significant, *:p < 0.05, **:p < 0.01, ***:p < 0.001, ****: p < 0.0001. Inj: injured, CL: contralateral, mpi: month post-injury. The source data is in ‘Figure 7—figure supplement 1—source data 1’.
-
Figure 7—figure supplement 1—source data 1
Source data for Figure 7—figure supplement 1.
- https://cdn.elifesciences.org/articles/75070/elife-75070-fig7-figsupp1-data1-v2.xlsx
Videos
Video 1
Surgical settings for trans-nasal endoscopic exposure of the pre-chiasmatic optic nerve in a goat.
Video 2
Exposure of the pre-chiasmatic optic nerve via trans-nasal endoscopy in a goat.
Video 3
Crush of the pre-chiasmatic optic nerve via trans-nasal endoscopy in a goat.
Video 4
Trans-nasal local delivery of hypothermia and protease inhibitors to the injured pre-chiasmatic optic nerve in a goat.
Video 5
Representative virtual surgical path to expose the pre-chiasmatic optic nerve in a goat.
Video 6
Representative virtual surgical path to expose the pre-chiasmatic optic nerve in a beagle.
Video 7
Representative virtual surgical path to expose the pre-chiasmatic optic nerve in a domestic pig.
Video 8
Representative virtual surgical path to expose the pre-chiasmatic optic nerve in a rhesus macaque.
Video 9
Exposure of the pre-chiasmatic optic nerve via trans-nasal endoscopy in a rhesus macaque.
Tables
Key resources table
| Reagent type (species) or resource | Designation | Source or reference | Identifiers | Additional information |
|---|---|---|---|---|
| Biological sample (Saanen goat) | Saanen goat (4–7 months old, male) | Caimu Livestock Company (Hangzhou, China) | ||
| Biological sample (rhesus macaque) | Rhesus macaque (5–7 years old, male/female) | the Joinn Laboratory | ||
| Antibody | Anti-beta-3 tubulin (Rabbit monoclonal) | Cell Signaling Technology | Cat#5,568 S, RRID: AB_10694505 | IF(1:250) |
| Antibody | anti-Rabbit IgG (H + L) Highly Cross-Adsorbed Secondary Antibody, Alexa Fluor 488(Donkey polyclonal) | Thermo Fisher Scentific | Cat# A-21206, RRID:AB_2535792 | IF(1:200) |
| Antibody | Anti-RBPMS(Guinea pig polyclonal) | custom-made by ProSci | PMID:31090540 | IF(1:4000) |
| Antibody | Cy3-conjugated, anti-guinea pig(Donkey polyclonal) | Jackson Immuno Research | Cat#706-165-148, RRID: AB_2340460 | IF(1:200) |
| Chemical compound, drug | Triton X-100 | Sigma | Cat#T8787 | dilution (1:200) |
| Chemical compound, drug | PPD | Macklin | Cat#P816017 | |
| Chemical compound, drug | Methanol | Macklin | Cat#P813895 | |
| Chemical compound, drug | Isopropanol | Macklin | Cat#I811925 | |
| Chemical compound, drug | Uranyl acetate | Lanzhou 404 Factory | Cat#8,901 | |
| Chemical compound, drug | TRIzol Reagent | Life Technologies | Cat#15596–026 | |
| Chemical compound, drug | 5% povidone-iodine solution | Zhejiang Apeloa Inc. | ||
| Chemical compound, drug | Protease inhibitor | Miilipore | Cat#539,134 | |
| Chemical compound, drug | Hibernate A medium | BrainBits | Cat# 2283833 | |
| Chemical compound, drug | 4% PFA | Servicebio | Cat#G1101 | |
| Chemical compound, drug | 4% glutaraldehyde | Phygene | Cat#PH1021 | |
| Chemical compound, drug | Ethanol | Sinopharm Chemical Reagent CO.,Ltd | Cat#100092183 | |
| Chemical compound, drug | EMbed 812 | SPI | Cat#90529-77-4 | |
| Chemical compound, drug | Propanone | Sinopharm Chemical Reagent CO.,Ltd | Cat#10000418 | |
| Chemical compound, drug | Osmium tetroxide | Ted Pella Inc | ||
| Chemical compound, drug | Zoletil50 | Virbac | 4–8 mg/kg, IM | |
| Chemical compound, drug | Xylazine | Huamu Animal Health Products, China | 4 mg/kg, intramuscular (IM) | |
| Chemical compound, drug | Idzoxan | Huamu Animal Health Products, China | 1.5 mg/kg, IM | |
| Chemical compound, drug | Propofol | Xian Lipont Enterprise Union Management, China | 5 mg/kg, intravenous (IV) | |
| Chemical compound, drug | Isoflurane | RWD Life Science, China | 2.5%–3.5%, by mechanical ventilator | |
| Chemical compound, drug | Atropine | Guangdong Jieyang Longyang Animal Pharmaceutical, China | 0.05 mg/kg, IV | |
| Chemical compound, drug | Esmolol hydrochloride | Qilu Pharmaceutical, China | 0.2 g (2 ml) in 48 ml saline, IV drip infusion | |
| Chemical compound, drug | Hemocoagulase Atrox | Penglainuokang Pharmaceutical, China | 1 unit (1 shot), IM | |
| Chemical compound, drug | Dexamethasone | Kelong Veterinary Medicine, China | 5 ml (5 mg), IV | |
| Chemical compound, drug | Ceftiofur sodium | Jiangxi Huatu, China | 20 mg/kg, IM | |
| Chemical compound, drug | Gentamicin | Shanxi Ruicheng Kelong Co., Ltd, China | 8 mg/kg, IM | |
| Chemical compound, drug | Potassium chloride | Bei 'an Feilong Animal Medicine, China | 40 mL, IV | |
| Commercial assay or kit | NEBNext Ultra RNA Library Prep Kit | New England BioLabs | Cat#E7530 | |
| Commercial assay or kit | NEBNext Poly (A) mRNA Magnetic Isolation Module | New England BioLabs | Cat# E7490 | |
| Software, algorithm | GraphPad | GraphPad | RRID:SCR_002798 | 9.0 |
| Software, algorithm | R Project for Statistical Computing | R Project | http://www.r-project.org/ | v4.1.2 |
| Software, algorithm | Image J | Image J | RRID:SCR_003070 | v1.53a |
| Software, algorithm | MITK | MITK | http://mitk.org/wiki/Downloads | v2018.04.2 |
| Software, algorithm | Computer-assisted surgical path planning program | This paper | https://github.com/LujieZhang/Preoperative-planning | |
| Software, algorithm | HISAT2 | Github | http://daehwankimlab.github.io/hisat2/ | v2.0.4 |
| Software, algorithm | StringTie | The Center for Computational Biology at Johns Hopkins University | http://ccb.jhu.edu/software/stringtie/ | v1.3.1 |
| Software, algorithm | NetworkAnalyst | Xia Lab | https://www.networkanalyst.ca | v3.0 |
| Software, algorithm | Bcl2fastq | illumina | https://support.illumina.com/sequencing/sequencing_software/bcl2fastq-conversion-software.html | v2.19.1 |
| Software, algorithm | FastQC | Babraham Bioinformatics | http://www.bioinformatics.babraham.ac.uk/projects/fastqc | |
| Software, algorithm | Metascape | Metascape | http://metascape.org/gp/#/main/step1 | |
| Software, algorithm | Cytoscape | Cytoscape | https://cytoscape.org | v3.8.2 |
| Other | NEBNext Multiplex Oligos | New England BioLabs | Cat#750 | Construct the cDNA library |
| Other | Goat serum | Beyotime Institute of Biotechnology | Cat# C0265 | Dissolvant of PI |
Author response table 1
| Potential differences | Previous studies (PMID: 33897437; 27556928) | This study |
|---|---|---|
| Delivery of hypothermia | Systemic hypothermia | Local hypothermia |
| Temperature of hypothermia | Mild (30-33C) | Deep (4C) |
| Species | Rodent | Goat |
| Sampling tissue | Retina (soma of RGCs, where the nucleus and most ribosomes lie) | Pre-chiasmatic optic nerve (distal axons of RGCs) |
Additional files
Download links
A two-part list of links to download the article, or parts of the article, in various formats.
Downloads (link to download the article as PDF)
Open citations (links to open the citations from this article in various online reference manager services)
Cite this article (links to download the citations from this article in formats compatible with various reference manager tools)
Cold protection allows local cryotherapy in a clinical-relevant model of traumatic optic neuropathy
eLife 11:e75070.
https://doi.org/10.7554/eLife.75070


