Electrocorticography is superior to subthalamic local field potentials for movement decoding in Parkinson’s disease
- Movement Disorder and Neuromodulation Unit, Department of Neurology, Charité - Universitätsmedizin Berlin, corporate member of Freie Universität Berlin and Humboldt Universität zu Berlin, Germany
- Brain Modulation Lab, Department of Neurosurgery, Massachusetts General Hospital, United States
- Harvard Medical School, United States
- Department of Neurobiology, University of Pittsburgh, United States
- Department of Computer Science, Technische Universität Berln, Germany
Figures
Figure 1 with 1 supplement
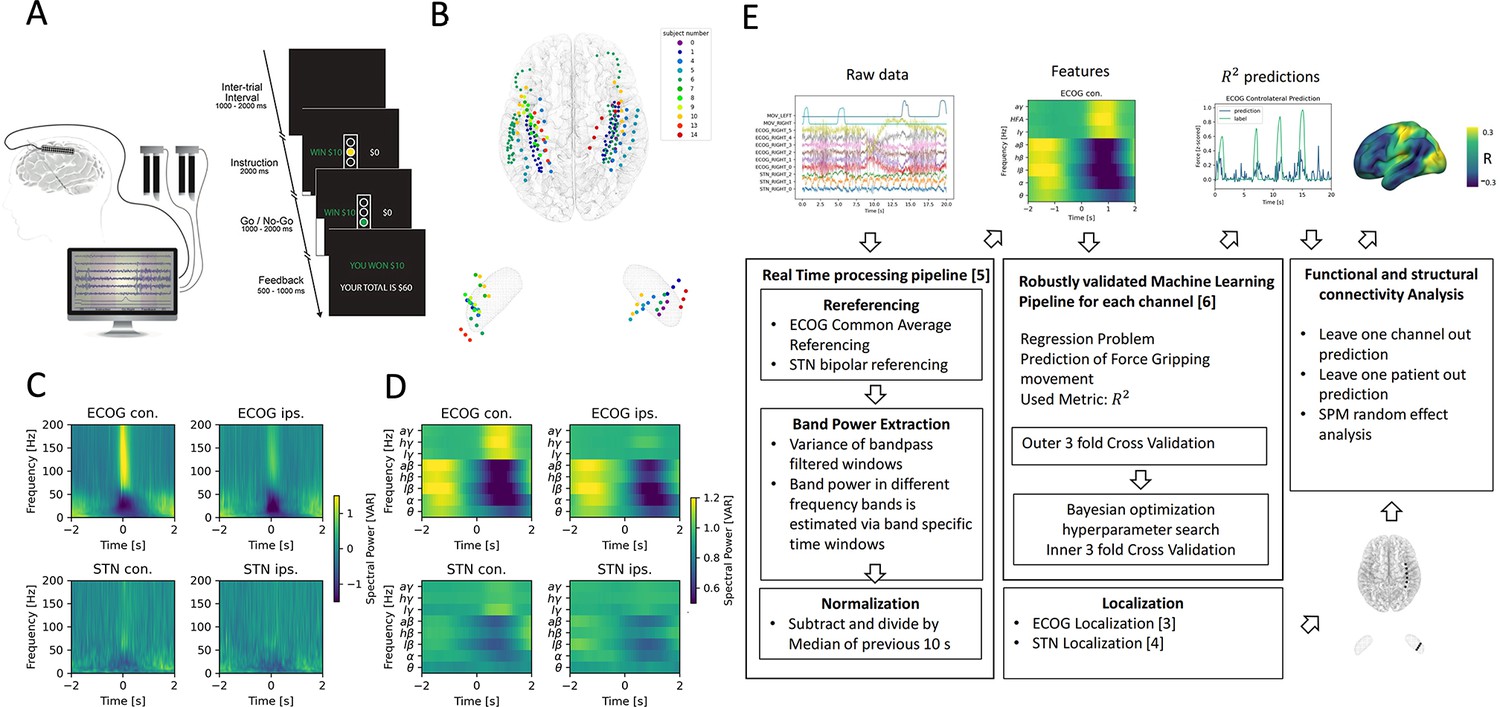
Movement induced spectral changes are more dominant for ECoG than STN-LFP signals for a grip force task before and after a machine learning feature signal processing pipeline.
(A) ECoG, STN, and gripping force were recorded simultaneously during performance of a Go / No-Go task. (B) Individual ECoG and STN electrodes were localized and transformed into in Montreal Neurological Institute (MNI) space (Figure 1—source data 1). Note that ECoG strip designs varied slightly between patients (see Supplementary file 1a), leading to varying dimensions of overall input feature matrices. The number of ECoG channels (average n=9.45 ± 11.15 STD per hemisphere) is higher compared to the number of STN LFP channels (n=3). (C) Mean spectral power of all ECoG and STN channels for contra- and ipsilateral movements showed typical movement induced spectral changes (Figure 1—source data 2). (D) Virtual streaming of data packets secured real-time compatible processing and normalization to extract time-frequency modulations into discrete feature time-series. Mean features of all ECoG and STN channels are visualized (Figure 1—source data 3). (E) Schematic flow chart of the implemented real-time enabled feature extraction, machine learning evaluation and functional and structural connectivity analysis pipeline.
-
Figure 1—source data 1
ECoG and STN electrode localizations.
- https://cdn.elifesciences.org/articles/75126/elife-75126-fig1-data1-v1.csv
-
Figure 1—source data 2
Mean ECoG and STN spectral power.
- https://cdn.elifesciences.org/articles/75126/elife-75126-fig1-data2-v1.zip
-
Figure 1—source data 3
Mean ECoG and STN features.
- https://cdn.elifesciences.org/articles/75126/elife-75126-fig1-data3-v1.zip
Figure 1—figure supplement 1
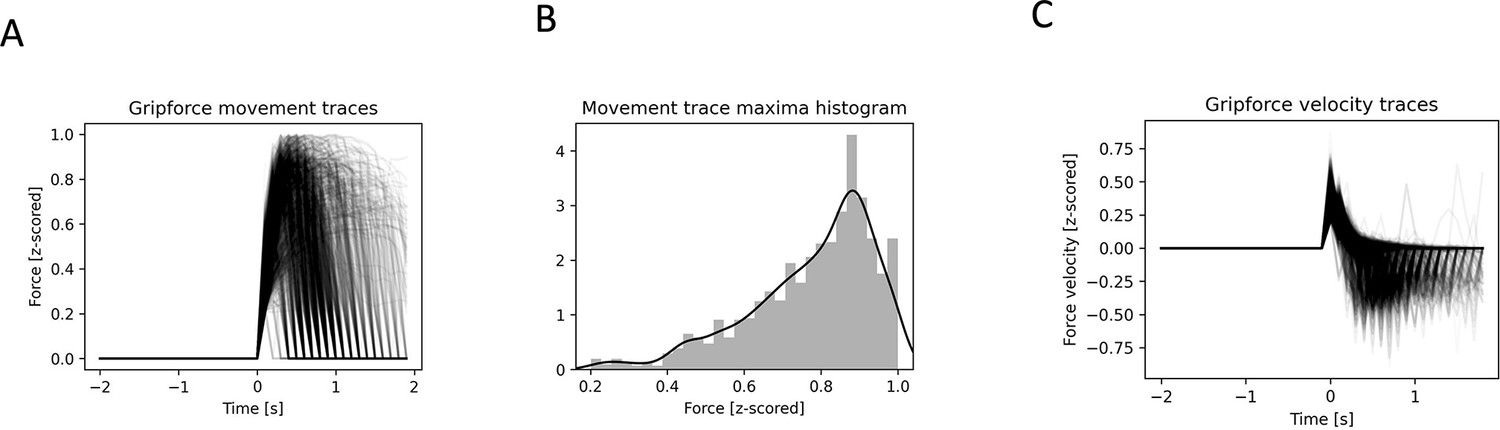
Analyzed movements show variability in maximum amplitude and velocity.
(A) All used normalized and baseline corrected grip force traces. (B) Maximum peak amplitude histogram (C) All movement trace velocities.
Figure 2
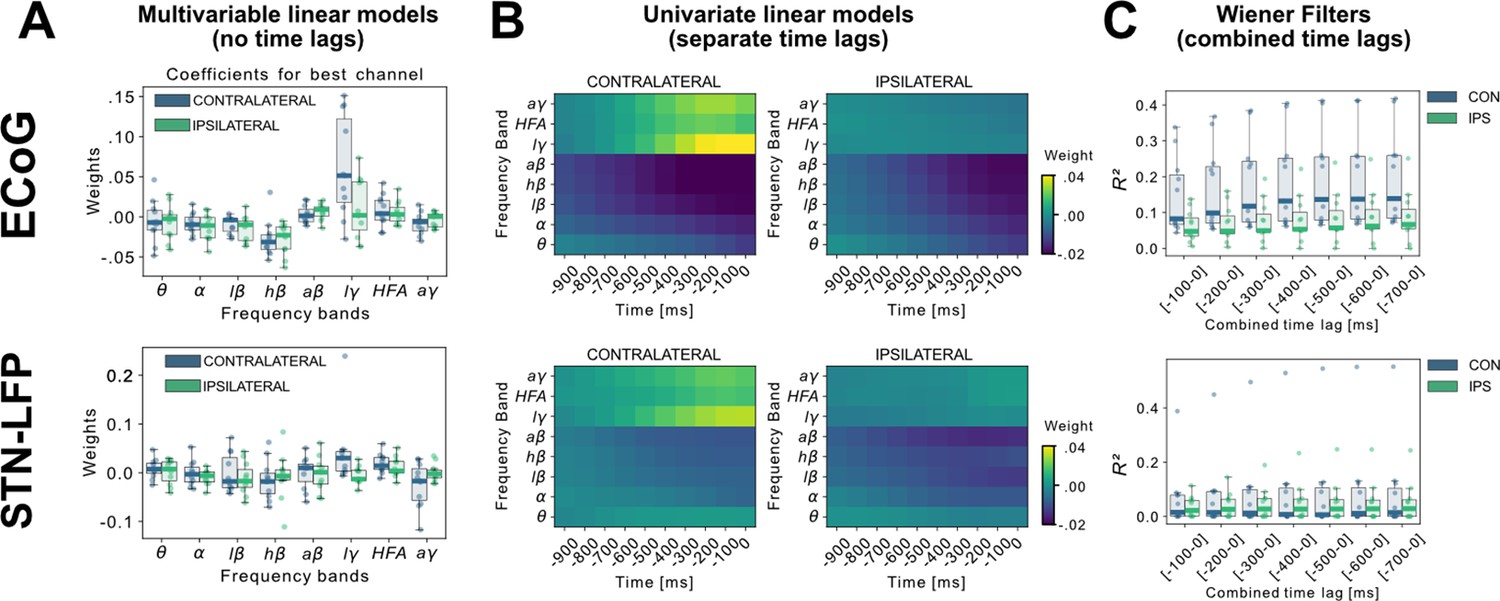
Linear Models and Wiener Filters reveal temporally and spectrally specific coefficient distributions with grip-force decoding performance gain by including signals preceding the target sample by up to 500ms.
(A) Multivariable linear model coefficients trained only from the instantaneous sample (0 time lag with respect to decoded target sample) including all frequency bands from best channels per patient resemble movement induced spectral changes with beta desynchronization and gamma synchronization (Figure 2—source data 1). ECoG derived coefficients yield higher absolute values than STN-LFP derived coefficients. (B) Univariate frequency and time lag specific Linear Models were trained and visualized to improve interpretability of average coefficients in the absence of interactions (Figure 2—source data 2). Low γ (60–80 Hz), HFA (90–200 Hz), and all γ (60–200 Hz) bands show stronger positive associations for contralateral over ipsilateral movements. Moreover, stronger associations are visible for ECoG over STN-LFP signals for , HFA, and bands. (C) Wiener Filters can integrate multiple time-steps in Linear Models leading to an incremental performance gain when signals are included preceding the current target sample by up to 500ms (Figure 2—source data 3).
-
Figure 2—source data 1
Best channel Linear Model coefficients trained from instantaneous sample.
- https://cdn.elifesciences.org/articles/75126/elife-75126-fig2-data1-v1.csv
-
Figure 2—source data 2
Univariate Linear Model coefficients of single frequency band and time lag.
- https://cdn.elifesciences.org/articles/75126/elife-75126-fig2-data2-v1.zip
-
Figure 2—source data 3
Wiener Filter multiple time-step comparison.
- https://cdn.elifesciences.org/articles/75126/elife-75126-fig2-data3-v1.csv
Figure 3

XGBOOST outperforms other machine learning methods for ECoG based grip-force decoding.
Based on the presented real-time compatible signal processing pipeline Neural Networks, Elastic - Net regularized Linear Models, Wiener Filters and extreme Gradient Boosting (XGBOOST) regression models were tested. Mean test-set grip-force decoding performances are shown for the best channel per patient after 10 rounds of Bayesian Optimization of hyperparameters with nested cross-validation for ECoG (A) and STN-LFP (B) (Figure 3—source data 1). The same pipeline was subjected to spatial feature extraction approach using all available channels of an electrode for each patient with Source Power Comodulation (SPoC). Best ECoG (A) performances were obtained by XGBOOST regressors. STN-LFP signals (B) did not exhibit performance gain when applying advanced machine learning methods. The mean ECoG vs. STN XGBOOST performance differences of contralateral = 0.21 ± 0.18 and ipsilateral = 0.069 ± 0.08 movements, indicate the higher grip-force decoding performance of ECoG over STN signals. The mean test-set prediction performances were higher for ECoG than for STN-LFP signals across all patients, for both contra- and ipsilateral movements. Best ECoG channels outperformed best STN-LFP channels and the combination of best channels from both ECoG and STN-LFP (C) (Figure 3—source data 2). When combining multiple channels, performances improve through the combination of ECoG and STN-LFPs (D), but the performances remain below individual best ECoG channels as depicted in (C). For combined ECoG +STN – LFP training, the model learned specific combinations between both feature locations and failed to select only the best ECoG features due to overfitting.
-
Figure 3—source data 1
Cross-validated ECoG and STN machine learning model performances for single channels.
- https://cdn.elifesciences.org/articles/75126/elife-75126-fig3-data1-v1.csv
-
Figure 3—source data 2
Cross-validated combined and best-channel XGBOOST performances for best ECoG and STN channels.
- https://cdn.elifesciences.org/articles/75126/elife-75126-fig3-data2-v1.csv
-
Figure 3—source data 3
Cross-validated XGBOOST performances for multichannel models based on ECoG, LFP and combined ECoG-LFP channels.
- https://cdn.elifesciences.org/articles/75126/elife-75126-fig3-data3-v1.csv
Figure 4
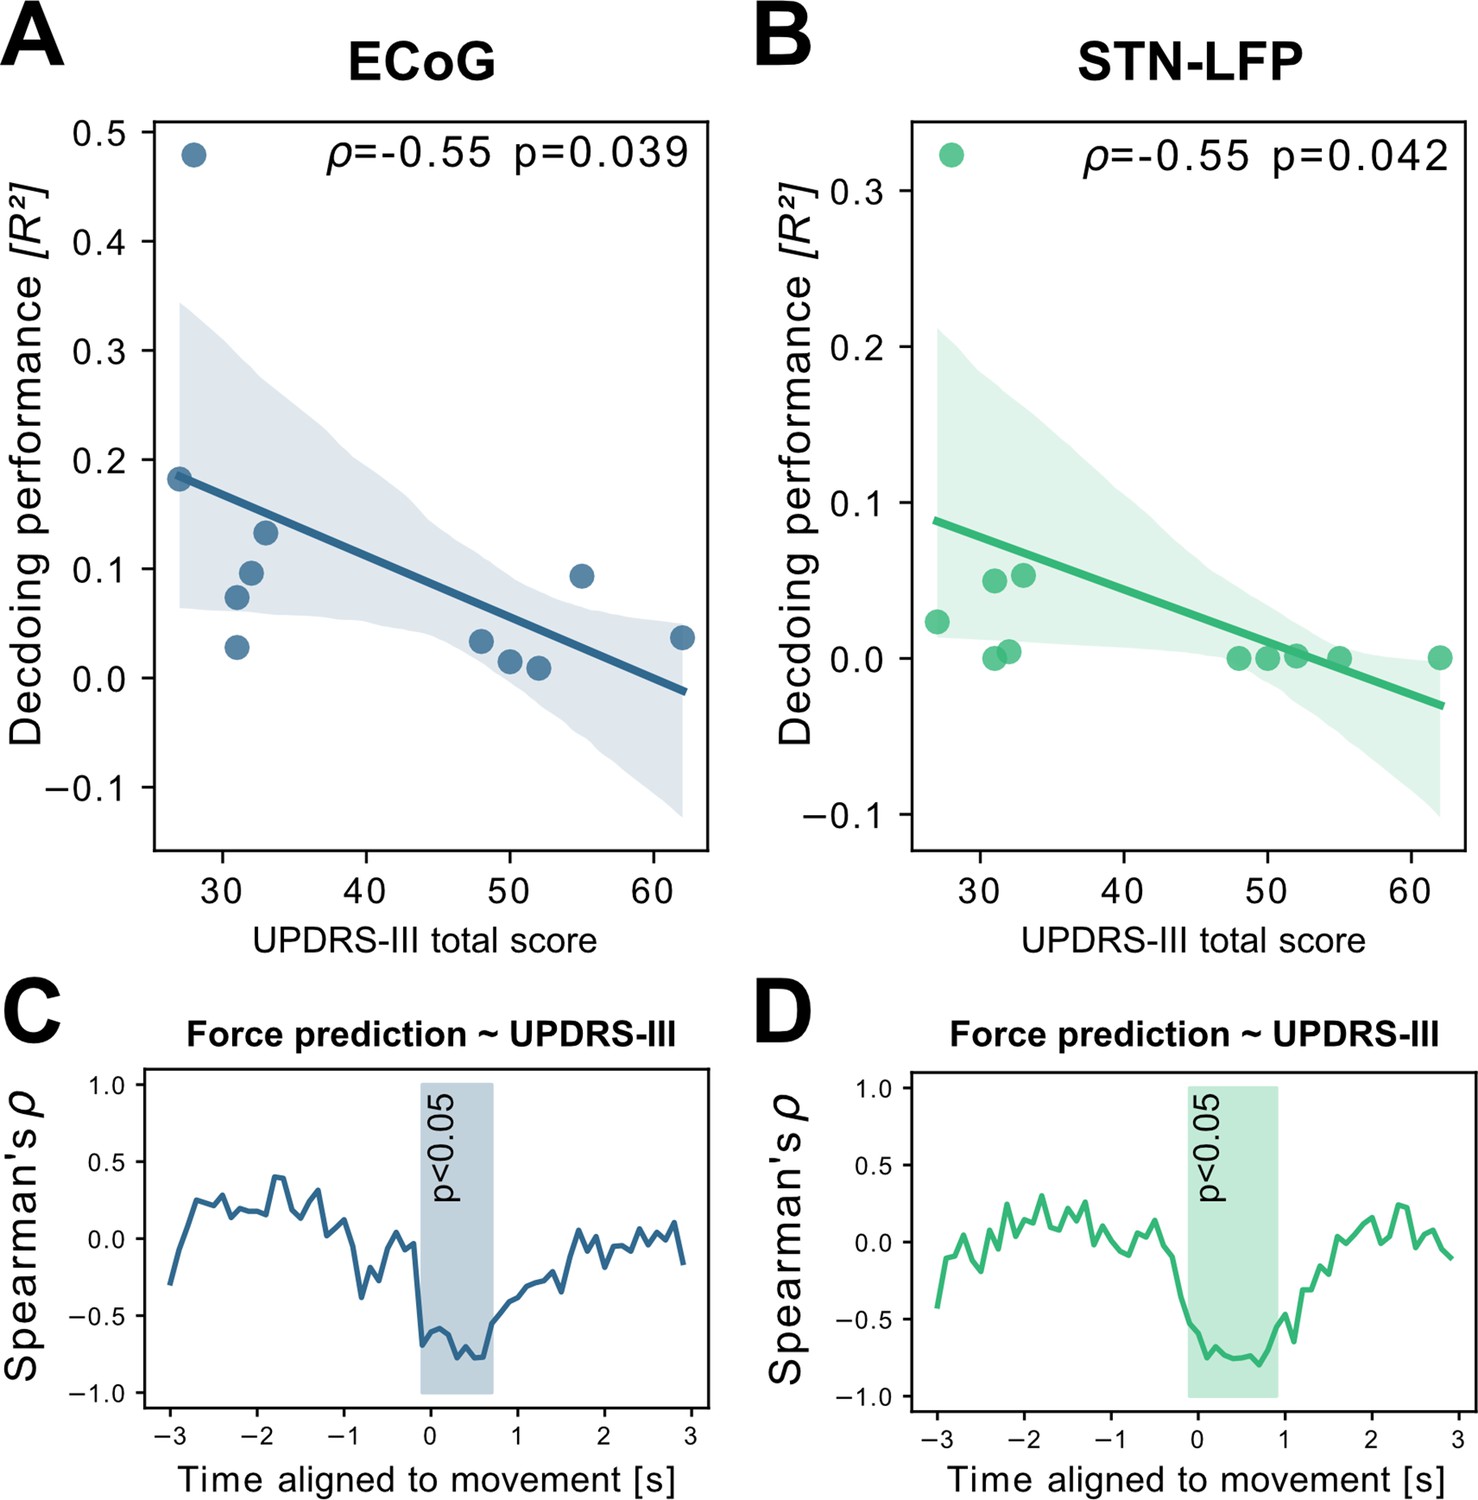
Grand average grip-force decoding performances correlate inversely with preoperative PD motor sign severity.
UPDRS-III scores show significant negative correlations with patient-wise XGBOOST grip-force decoding performance averages for (A) ECoG (ρ=–0.55, p=0.039) and (B) STN-LFP signals (ρ=–0.55, p=0.042) (Figure 4—source data 1). The temporal specificity of this correlation is revealed through movement aligned sample-wise correlations of average force prediction model output with UPDRS-III scores across patients (cluster based corrected significant segments are displayed shaded) (C+D) (Figure 4—source data 2).
-
Figure 4—source data 1
ECoG and STN single channel performances and UPDRS ratings.
- https://cdn.elifesciences.org/articles/75126/elife-75126-fig4-data1-v1.csv
-
Figure 4—source data 2
ECoG and STN Force prediction UPDRS correlation.
- https://cdn.elifesciences.org/articles/75126/elife-75126-fig4-data2-v1.csv
Figure 5
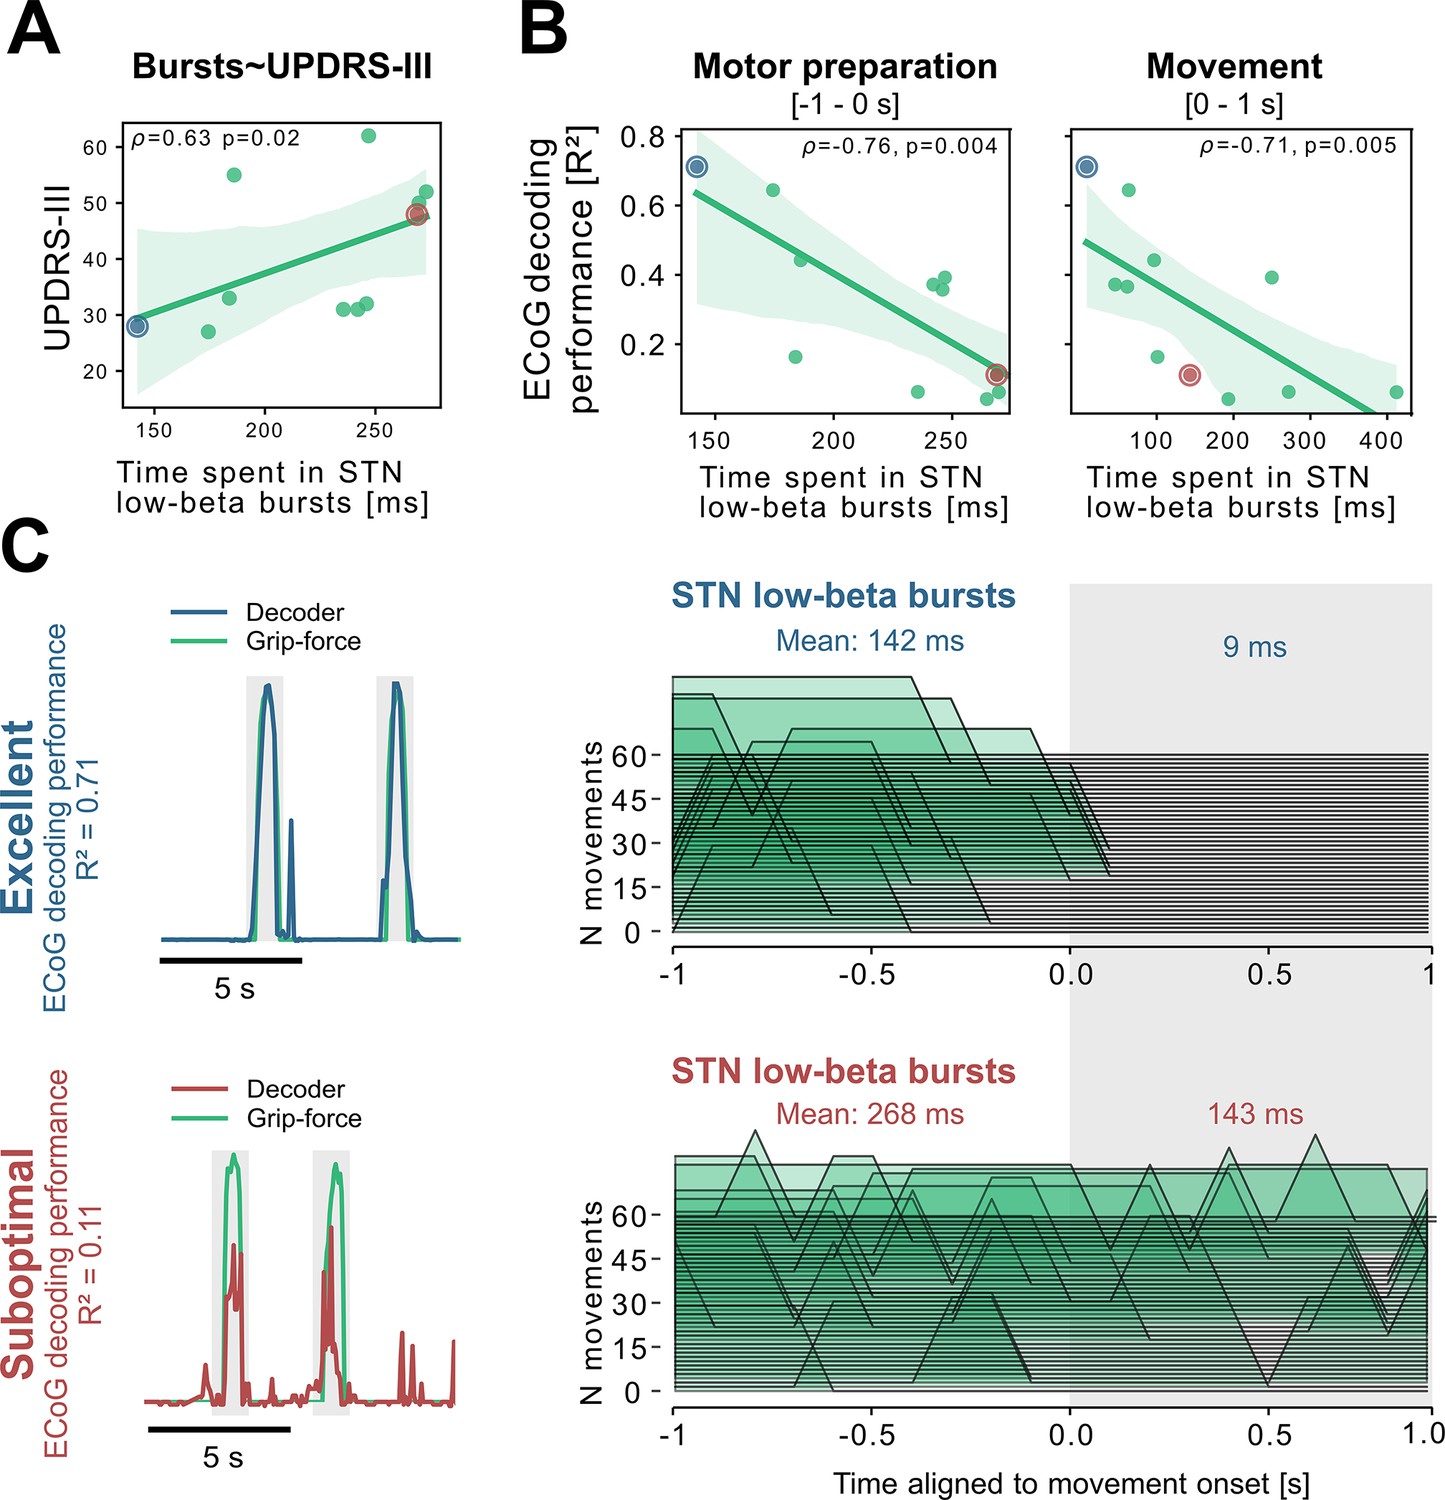
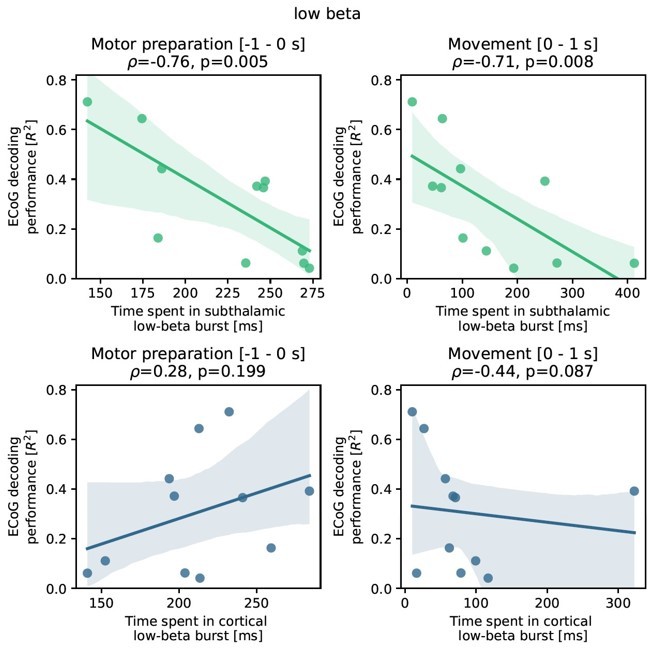
Subthalamic low-beta bursts relate to PD motor impairment and are associated with lower ECoG decoding performance.
UPDRS-III scores are significantly correlated with time spent in subthalamic low-beta bursts in the motor preparation period (A) and during movement (not shown). Average XGBOOST decoding performance correlated inversely with time spent in subthalamic low-beta bursts during motor preparation and movement performance (B) (Figure 5—source data 1). Patient examples with excellent (R²=0.71; blue) and suboptimal (R²=0.11; red) performances are highlighted in (B) and shown in further detail in (C) (Figure 5—source data 2). Note the difference in decoder output with respect to the original grip-force trace (left panel) and the differences in burst frequencies and durations across movement repetitions (right panel) in the motor preparation and movement execution (grey shaded area) period.
-
Figure 5—source data 1
Time spend in low-beta burst performance and UPDRS correlation.
- https://cdn.elifesciences.org/articles/75126/elife-75126-fig5-data1-v1.csv
-
Figure 5—source data 2
Movement onset aligned low-beta bursts for two subjects.
- https://cdn.elifesciences.org/articles/75126/elife-75126-fig5-data2-v1.zip
Figure 6
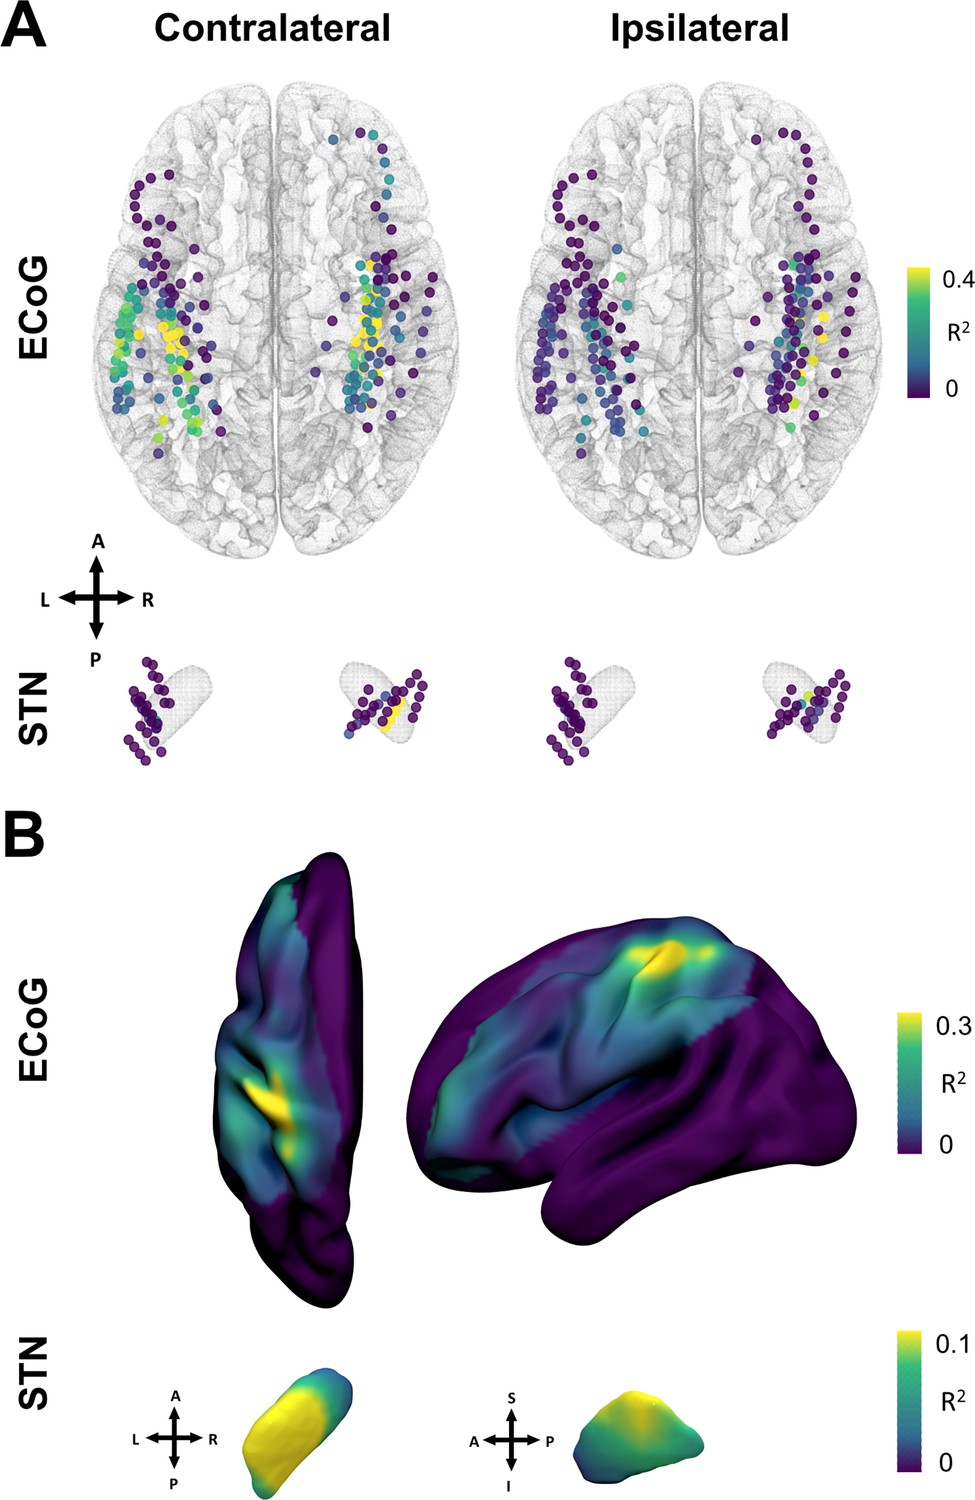
Grip-force decoding performances spatially peak in sensorimotor cortex and the dorsolateral STN.
(A) Channels are color coded for individual XGBOOST grip-force regression performances per channel. Performance differences shown are in favor of ECoG over STN and contralateral over ipsilateral recording locations for movement decoding. (Figure 6—source data 1) (B) Spatial interpolation across all contacts projected to the left hemisphere shows peak performances in sensorimotor cortex. STN interpolated decoding performance peaks in the dorsolateral portion of the STN, in proximity to the best therapeutic target (Caire et al., 2013).
-
Figure 6—source data 1
Single channel XGBOOST coordinates and performances.
- https://cdn.elifesciences.org/articles/75126/elife-75126-fig6-data1-v1.csv
Figure 7 with 1 supplement
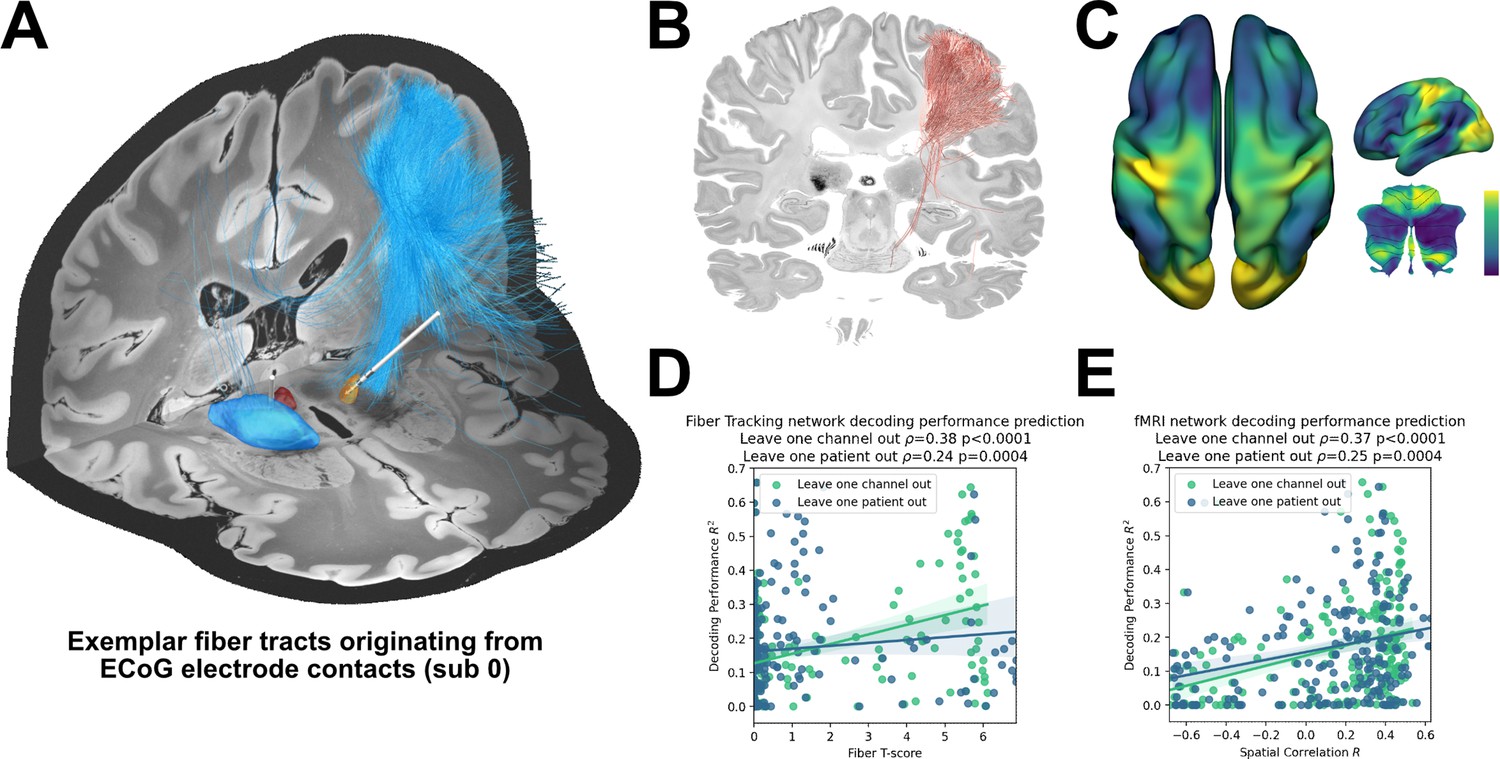
Structural and functional movement decoding network analysis reveals cerebellar as well as sensorimotor cortical decoding capacity.
(A) Visualization of fibers originating from the ECoG recording locations of subject 1. (B) Decoding performance across all subjects and channels significant fiber tracts are displayed. All ECoG contacts were projected to the left hemisphere. For every fiber a t-test statistic between connected and unconnected brain regions was calculated. Only significant fibers, indicating structural connectivity to grip-force decoding performance, are shown. (C) The optimal R-Map is shown for the cortical surface as well as cerebellum for fMRI functional connectivity. Fingerprints were calculated between the functional connectivity of every electrode contact to all other voxels. The R-Map was then calculated as a correlation between individual contact fingerprints and the contact specific decoding performance. (D) Fiber tracking connectivity predicts grip-force decoding performance (leave one channel out cross validation ρ=0.38, p<0.0001, leave one patient out cross validation ρ=0.24, p=0.0004) (Figure 7—source data 1). Here, each individual point represents a statistic of connected and unconnected fibers of each contact or patient. The previously calculated fiber statistic within each cross-validation fold could thus predict the channel or patient specific performance. (E) Functional connectivity predicts decoding performance (leave one channel out cross validation ρ=0.37, p<0.0001, leave one patient out cross validation ρ=0.25, p=0.0004) (Figure 7—source data 2). The spatial correlation between individual fingerprints and the cross-validation specific R-Map, predicts left out decoding performances.
-
Figure 7—source data 1
Fiber Tracking network decoding performance prediction.
- https://cdn.elifesciences.org/articles/75126/elife-75126-fig7-data1-v1.zip
-
Figure 7—source data 2
fMRI network decoding performance prediction.
- https://cdn.elifesciences.org/articles/75126/elife-75126-fig7-data2-v1.zip
Figure 7—figure supplement 1
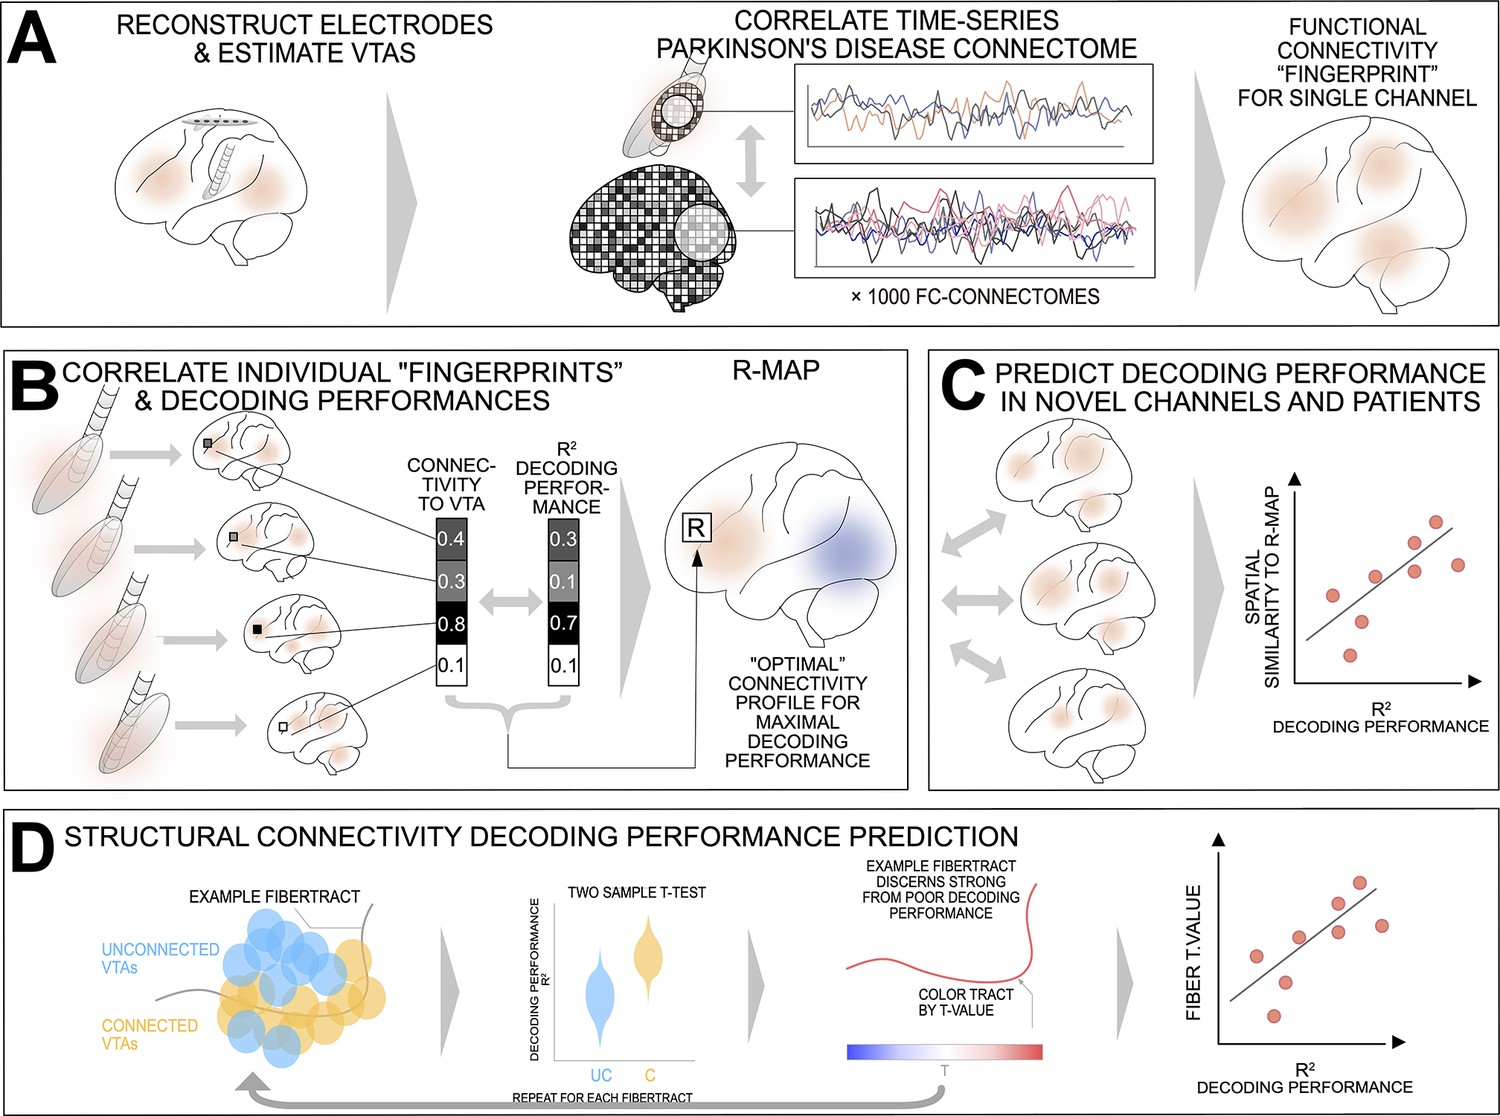
'Prediction Network Mapping’ allows for prediction of machine learning decoding performances using functional and structural connectivity.
(A) Functional connectivity ‘Fingerprints’ are estimated using fMRI resting state correlations of the Volume of Tissue Activated (VTA) voxels correlation to all other voxels. (B) The correlation of every fingerprint voxel values and their respective decoding performances allow for calculation of the optimal connectivity profile for maximum decoding performance called “R-MAP”. (C) The R-MAP correlation with individual fingerprints of cross validation left out channels, or set of channels for single subjects, allows for prediction of decoding performance. High correlation with the R-MAP optimal connectivity predicts high decoding performance. (D) Structural connectivity can be used for decoding performance prediction. For all fibers, a two sample t-test estimates a t value of connected and unconnected decoding performance contacts. The fiber t-value can thus be predictive of decoding performance.
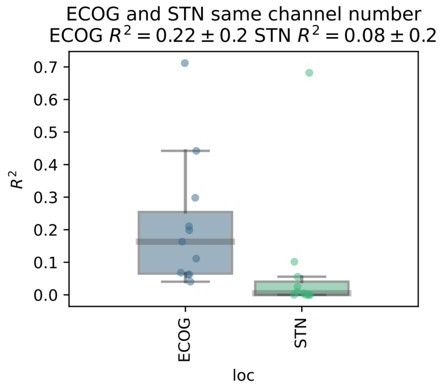
Author response image 1
Author response image 2
Author response image 3
Author response image 4
Author response image 5
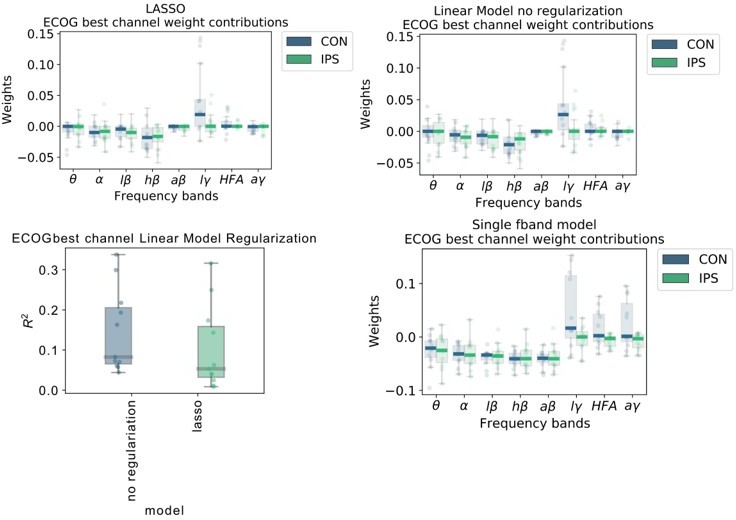
Author response image 6
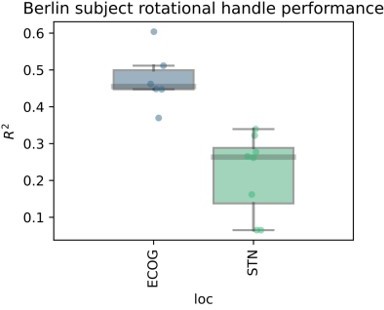
Author response image 7

Author response image 8
Tables
Table 1
Subject characteristics.
| N | Gender | UPDRS total | Hemisphere | Age | Movements | Disease duration [years] | ECoG Strip Contact Number Left | ECoG Strip Contact Number Right |
|---|---|---|---|---|---|---|---|---|
| 0 | Male | 28 | R | 60.3 | 128 | 10.7 | 0 | 6 |
| 1 | Male | 27 | L+R | 51.2 | 464 | 14 | 28 | 28 |
| 2 | Male | 33 | L+R | 53.8 | 213 | 7.2 | 8 | 8 |
| 3 | Male | 31 | L+R | 44.2 | 285 | 10.1 | 8 | 8 |
| 4 | Male | 32 | 2L+2 R | 63.6 | 381 | 13.1 | 28+8 | 28+8 |
| 5 | Male | 52 | L | 59.6 | 84 | 5.9 | 6 | 0 |
| 6 | Male | 55 | L | 71.6 | 161 | 1.4 | 6 | 0 |
| 7 | Male | 50 | L | 52.5 | 131 | 8.7 | 6 | 0 |
| 8 | Male | 62 | L+R | 66.8 | 547 | 9.8 | 6 | 6 |
| 9 | Male | 48 | L | 67.9 | 86 | 17.1 | 6 | 0 |
| 10 | Female | 31 | R | 69 | 205 | 10.4 | 0 | 6 |
Additional files
-
Supplementary file 1
Electrode details, Bayesian optmization hyperparemeters and best subject performances.
(a) Electrode Details (b) Bayesian Optimization Hyperparameters (c) Best channel performances.
- https://cdn.elifesciences.org/articles/75126/elife-75126-supp1-v1.docx
-
Transparent reporting form
- https://cdn.elifesciences.org/articles/75126/elife-75126-transrepform1-v1.docx
Download links
A two-part list of links to download the article, or parts of the article, in various formats.
Downloads (link to download the article as PDF)
Open citations (links to open the citations from this article in various online reference manager services)
Cite this article (links to download the citations from this article in formats compatible with various reference manager tools)
Electrocorticography is superior to subthalamic local field potentials for movement decoding in Parkinson’s disease
eLife 11:e75126.
https://doi.org/10.7554/eLife.75126


