Thymic macrophages consist of two populations with distinct localization and origin
- Institute of Microbiology and Immunology, National Yang Ming Chiao Tung University, Taiwan
- Bioinformatics Program, Taiwan International Graduate Program, Institute of Information Science, Academia Sinica, Taiwan
- Graduate Institute of Biomedical Electronics and Bioinformatics, National Taiwan University, Taiwan
- Brain Research Center, National Yang Ming Chiao Tung University, Taiwan
- Division of Immunology and Pathogenesis, Department of Molecular and Cell Biology, University of California, Berkeley, United States
- Institute of Biomedical Informatics, National Yang Ming Chiao Tung University, Taiwan
Figures
Figure 1 with 4 supplements
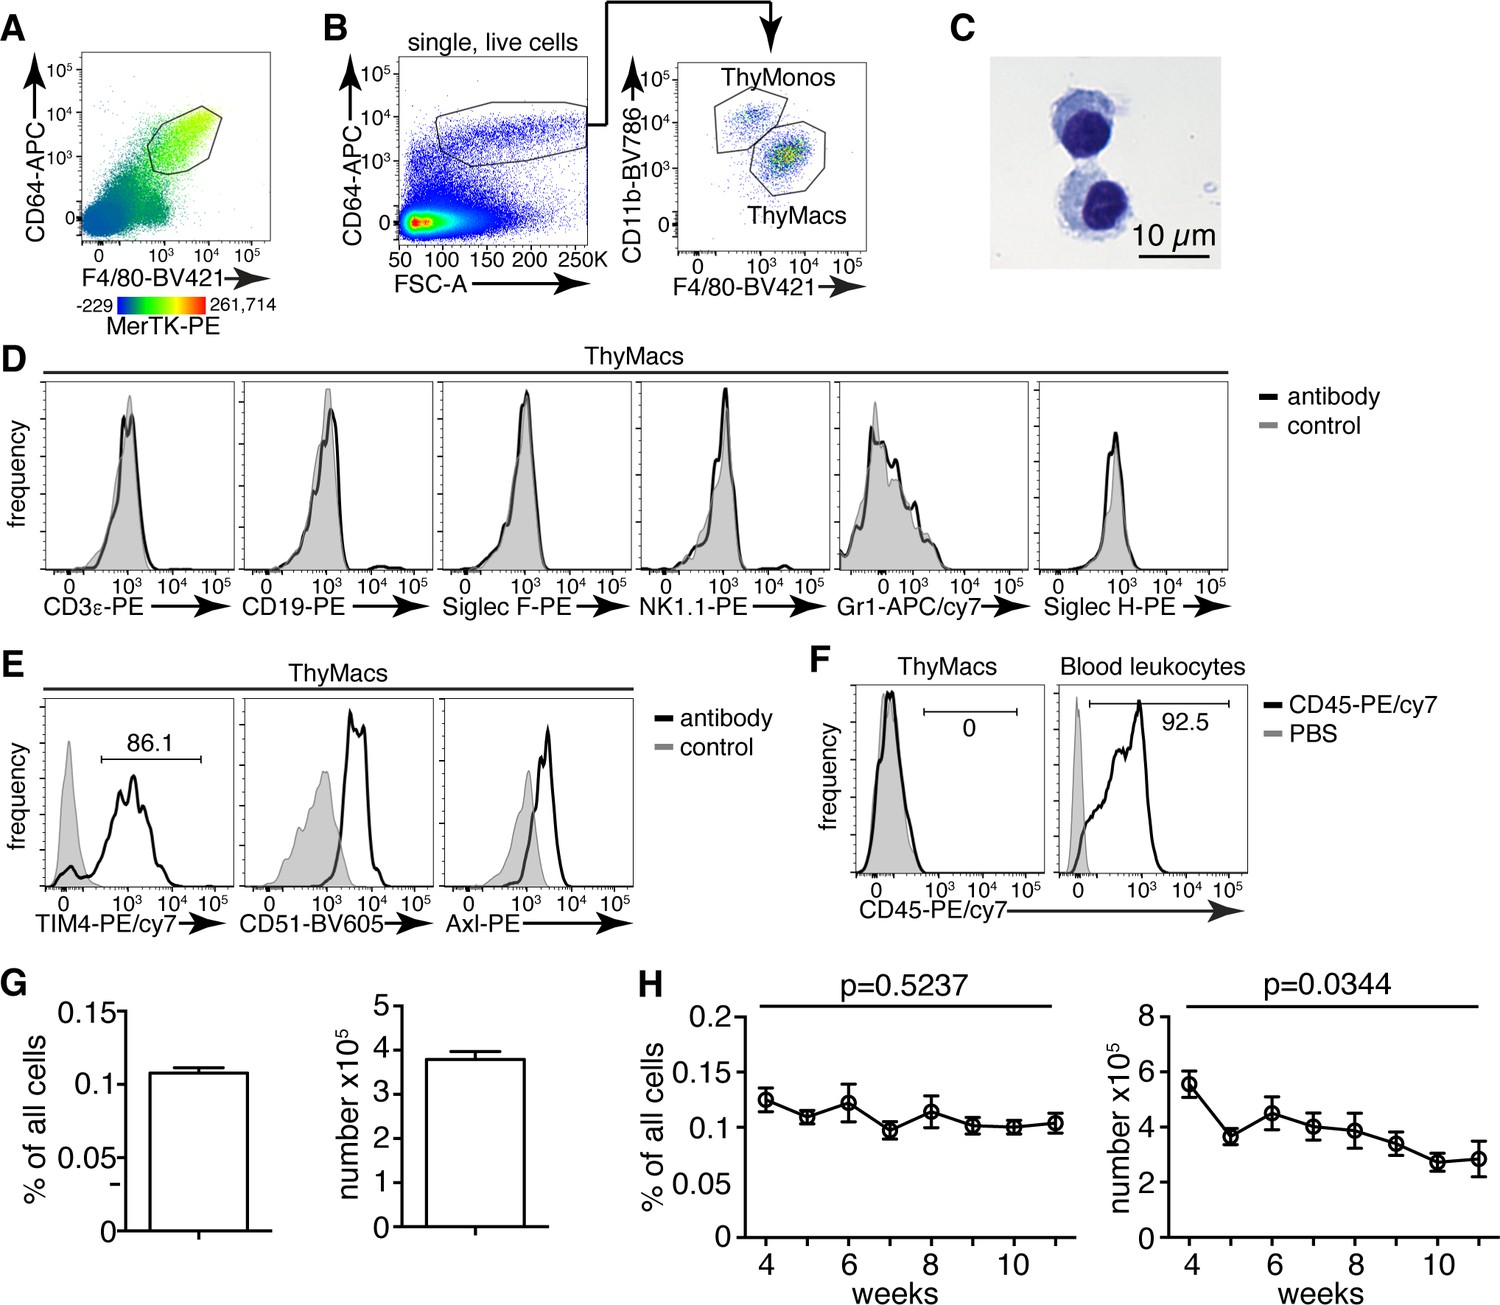
Thymic macrophages (ThyMacs) can be identified by the expression of CD64, MerTK, and F4/80.
(A) Flow cytometric analysis of enzymatically digested thymus tissue with macrophage markers CD64, MerTK, F4/80, and CD11b. (B) Gating strategy for identifying ThyMacs: CD64+FSChi are first gated; the F4/80+CD11blo cells among them are the ThyMacs, while F4/80loCD11b+ are the thymic monocytes (ThyMonos). (C) Pappenheim (Hemacolor Rapid staining kit) staining of sorted ThyMacs. (D) Lack of expression of lineage markers associated with other cell types on ThyMacs. (E) The expression on ThyMacs of three receptors for phosphatidylserine that participates in the phagocytosis of apoptotic cells. (F) Labeling of ThyMacs with intravenously injected anti-CD45-PE antibody or PBS. The labeling of blood leukocytes is shown for comparison. (G) Average numbers and percentages of ThyMacs in 4–11 weeks old mice, n=82. (H) Comparison of the numbers and percentages of ThyMacs in mice of different ages, n=82. All flow cytometry plots are representative of at least three independent repeats. The numbers in the flow cytometry plots are the percent of cells in the respective gates. Data in (G) and (H) represent mean ± SEM. Statistical significance in (H) was determined with one-way ANOVA.
-
Figure 1—source data 1
Numbers and percentages of mouse thymic macrophages.
- https://cdn.elifesciences.org/articles/75148/elife-75148-fig1-data1-v2.xlsx
Figure 1—figure supplement 1
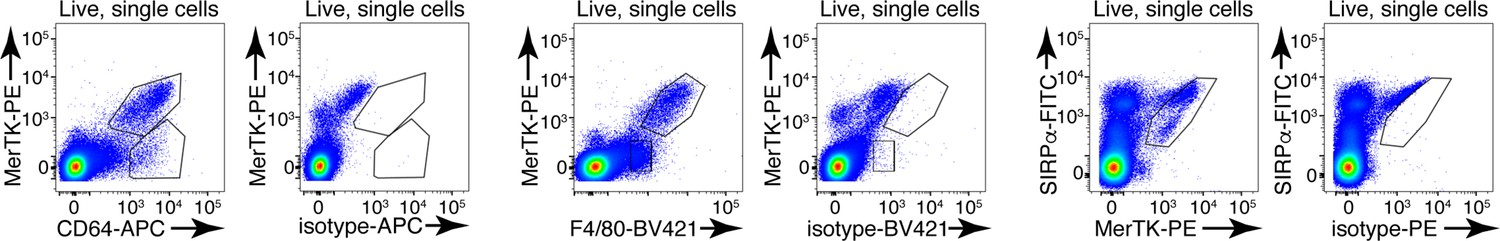
Representative flow cytometry staining of enzymatically digested thymus single-cell suspension for CD64, MerTK, and F4/80 and respective isotype controls.
The flow cytometry plots are representative of 5 individual experiments.
Figure 1—figure supplement 2
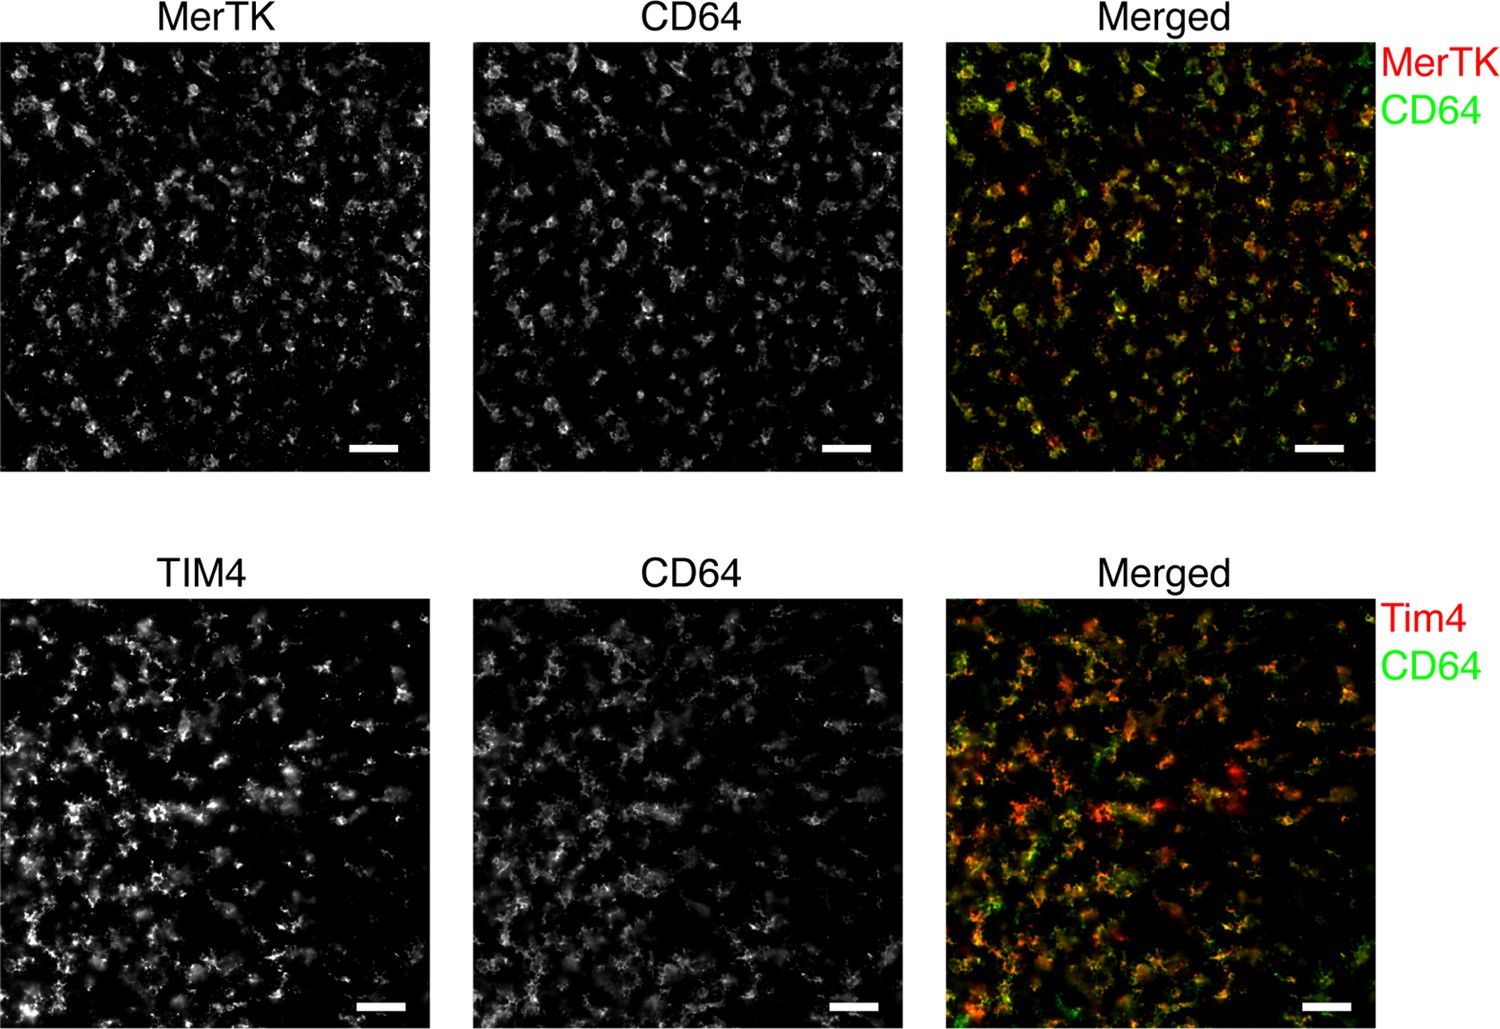
Immunofluorescent images of thymic sections showing co-localization of MerTK and CD64 staining (upper row) and TIM4 and CD64 staining (lower row) in the thymic cortex.
The images are representative of at least three mice. The scale bar is 50 µm.
Figure 1—figure supplement 3
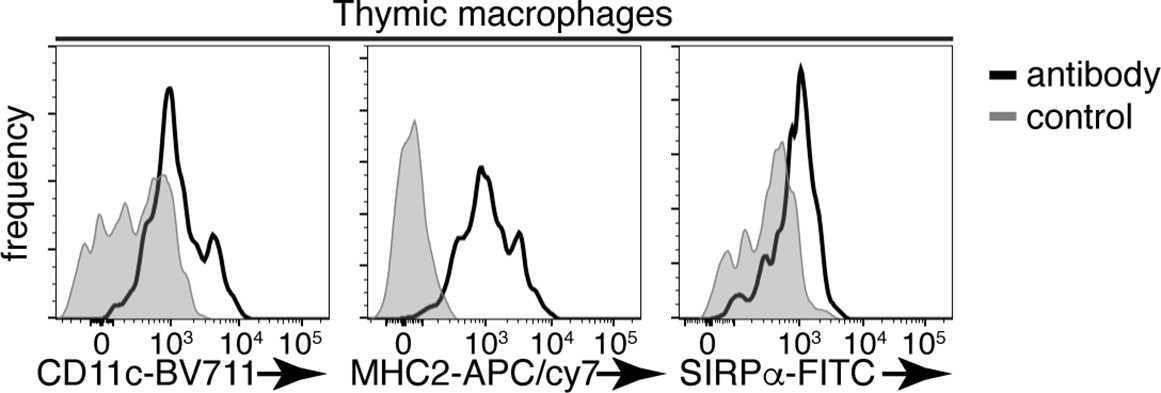
Expression of CD11c, MHC2, and SIRPα on thymic macrophages with respective controls.
The flow cytometry plots are representative of five individual experiments.
Figure 1—figure supplement 4
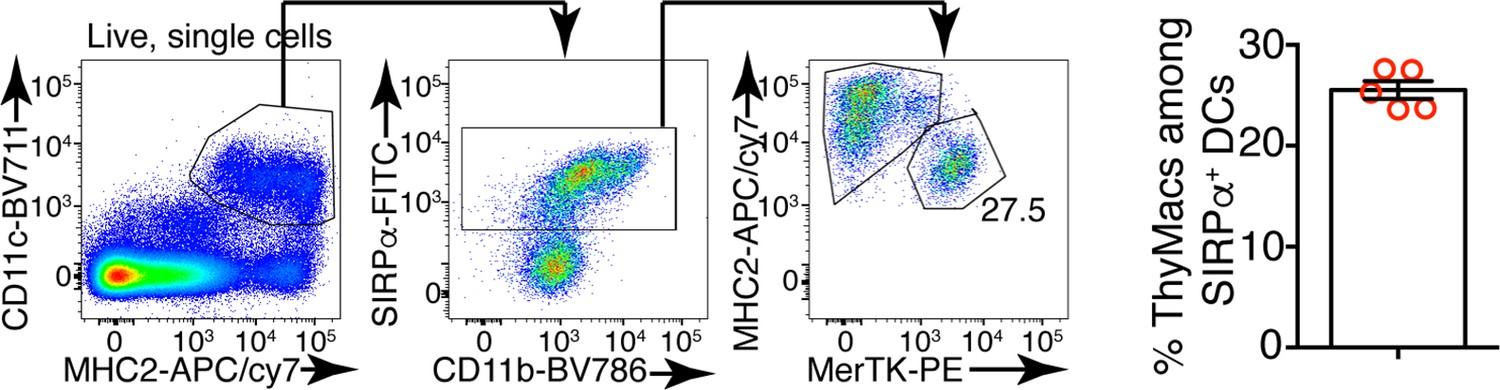
Example flow cytometry plots showing that gating on CD11c+MHC2+ thymus cells, in addition to dendritic cells (DCs), also includes macrophages, especially among SIRPα+ cells.
On the right is a plot of the frequency of MerTK+ cells among CD11c+MHC2+SIRPα+ cells. The data are mean ± SEM from five individual mice. Each dot is an individual mouse. The numbers in the flow cytometry plots are the percent of cells in the respective gate.
-
Figure 1—figure supplement 4—source data 1
Thymic macrophages contaminate conventional dendritic cells 2 (cDC2) flow cytometry gate.
- https://cdn.elifesciences.org/articles/75148/elife-75148-fig1-figsupp4-data1-v2.xlsx
Figure 2 with 3 supplements
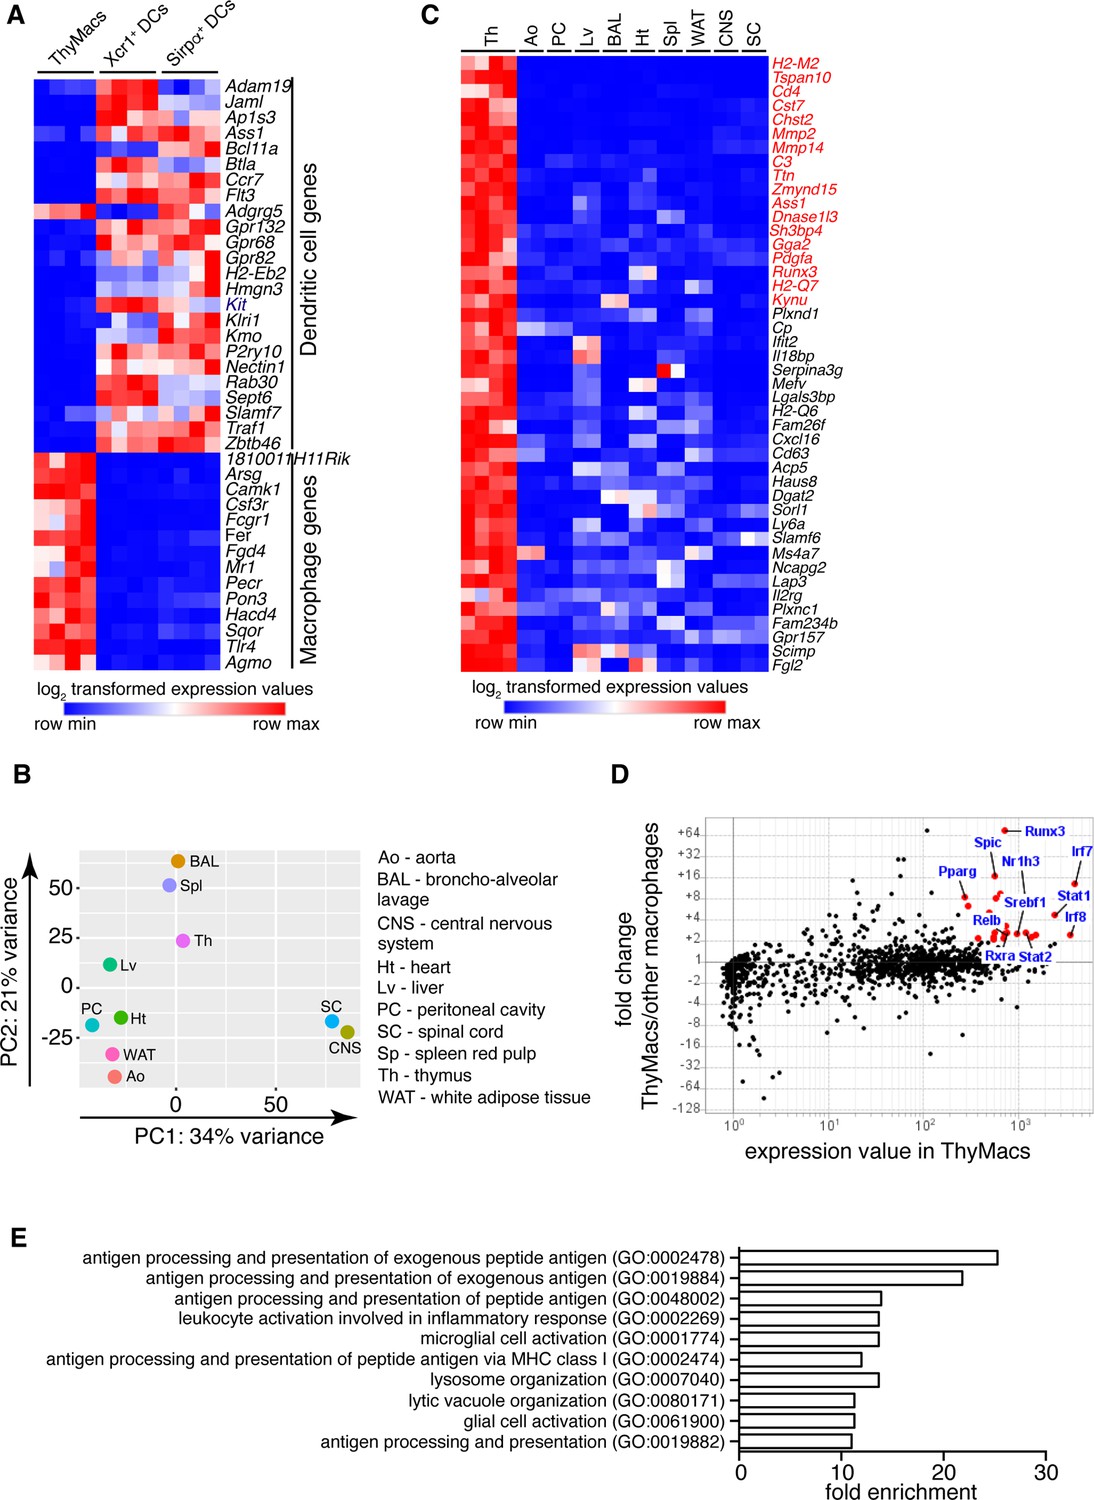
Transcriptional profile of thymic macrophages (ThyMacs).
(A) Expression of classical dendritic cell (cDC)-specific genes (top) and macrophage-specific genes (bottom) in ThyMacs and two populations of thymic cDCs (ThyDCs) – Xcr1+ ThyDCs and Sirpa+ ThyDCs. (B) Principal components analysis of ThyMacs and nine other populations of tissue-resident macrophages in duplicates. (C) Highly expressed (>500) genes enriched (>fivefold) in ThyMacs (four samples) compared to nine other tissue-resident macrophage populations (two samples each). The genes in red are >10-fold up-regulated in ThyMacs. (D) Comparison of the geometric mean expression of transcription factors in ThyMacs (four samples) and the nine other macrophage populations (two samples each). Transcription factors with expression >250 and fold change >2 are marked with red dots. (E) Top 10 gene ontology (GO) pathways in ThyMacs based on the 500 most highly expressed genes in these cells.
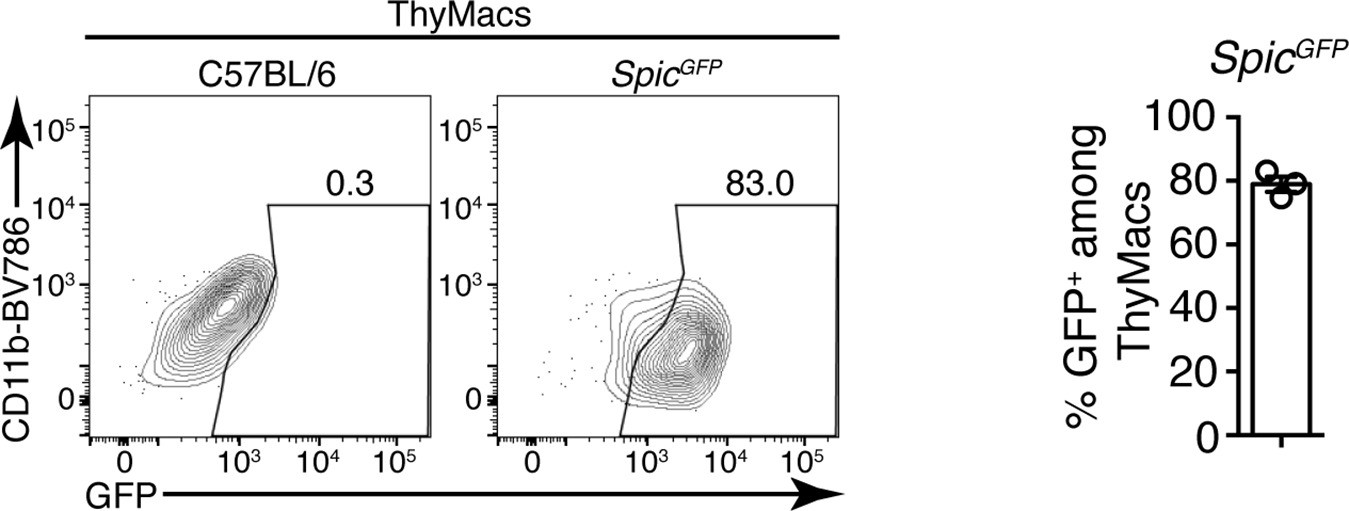
Figure 2—figure supplement 1
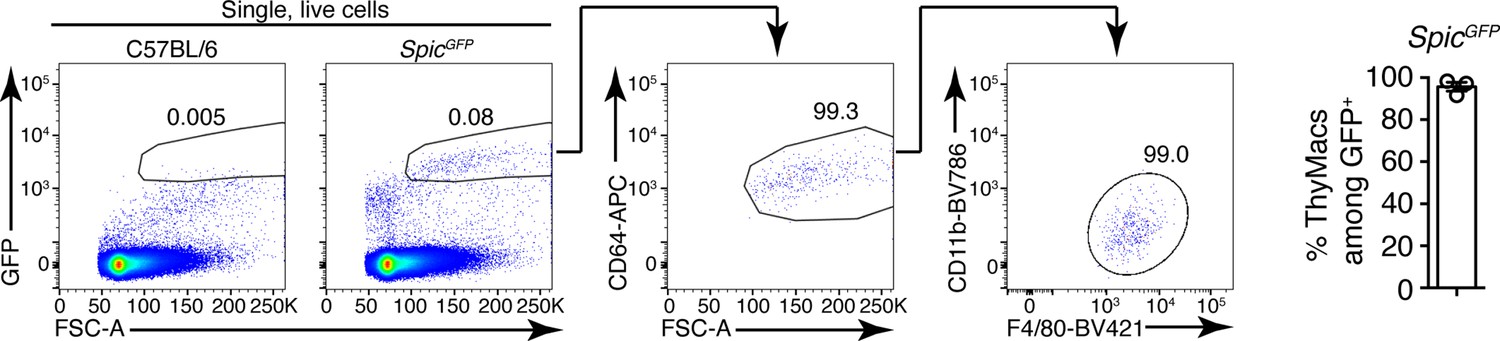
Example of the gating strategy to identify thymic macrophages (ThyMacs) among SpicGFP+ cells.
On the right is a plot showing the mean ± SEM of the frequencies of ThyMacs among SpicGFP+ cells. Each dot is an individual mouse. The numbers in the flow cytometry plots are the percent of cells in the respective gate.
-
Figure 2—figure supplement 1—source data 1
SpicGFP is a faithful reporter of thymic macrophages.
- https://cdn.elifesciences.org/articles/75148/elife-75148-fig2-figsupp1-data1-v2.xlsx
Figure 2—figure supplement 2
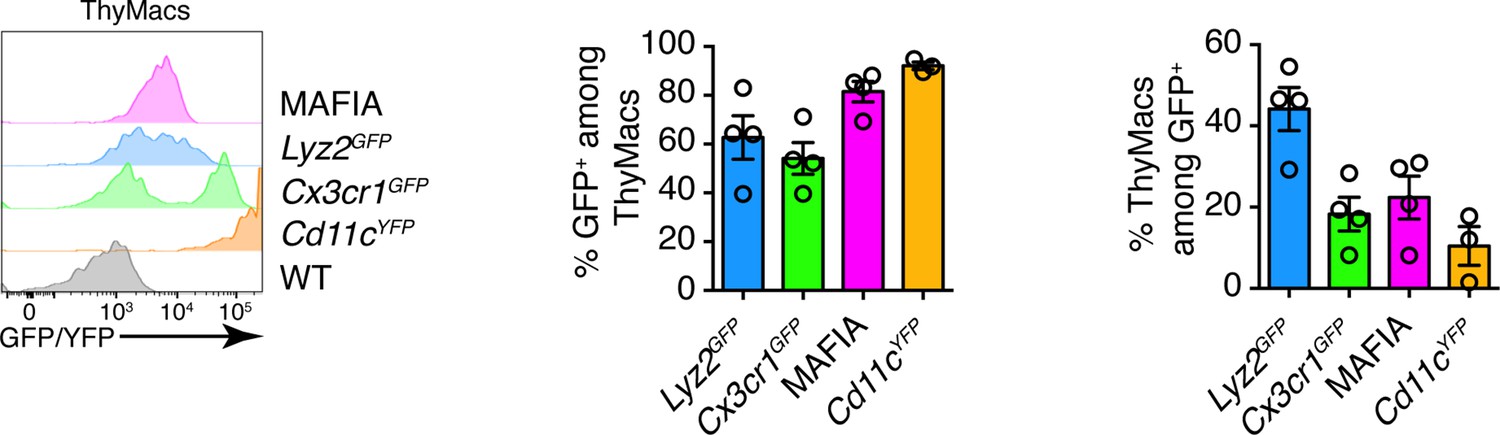
Representative flow cytometry plots of the expression of four reporter alleles in thymic macrophages (ThyMacs; left), frequencies of GFP/YFP+ cells among ThyMacs (middle), and frequencies of ThyMacs among GFP/YFP+ cells (right).
Data in the graphs represent mean ± SEM. Each dot is an individual mouse.
-
Figure 2—figure supplement 2—source data 1
The utility of various reporter mouse strains to identify thymic macrophages.
- https://cdn.elifesciences.org/articles/75148/elife-75148-fig2-figsupp2-data1-v2.xlsx
Figure 2—figure supplement 3
Representative flow cytometry plots of the expression of SpicGFP in thymic macrophages (ThyMacs).
To the right is a graph showing the mean ± SEM of the frequencies of SpicGFP+ cells among ThyMacs. Each dot is an individual mouse. The numbers in the flow cytometry plots are the percent of cells in the respective gate.
-
Figure 2—figure supplement 3—source data 1
Expression of SpicGFP in thymic macrophages.
- https://cdn.elifesciences.org/articles/75148/elife-75148-fig2-figsupp3-data1-v2.xlsx
Figure 3
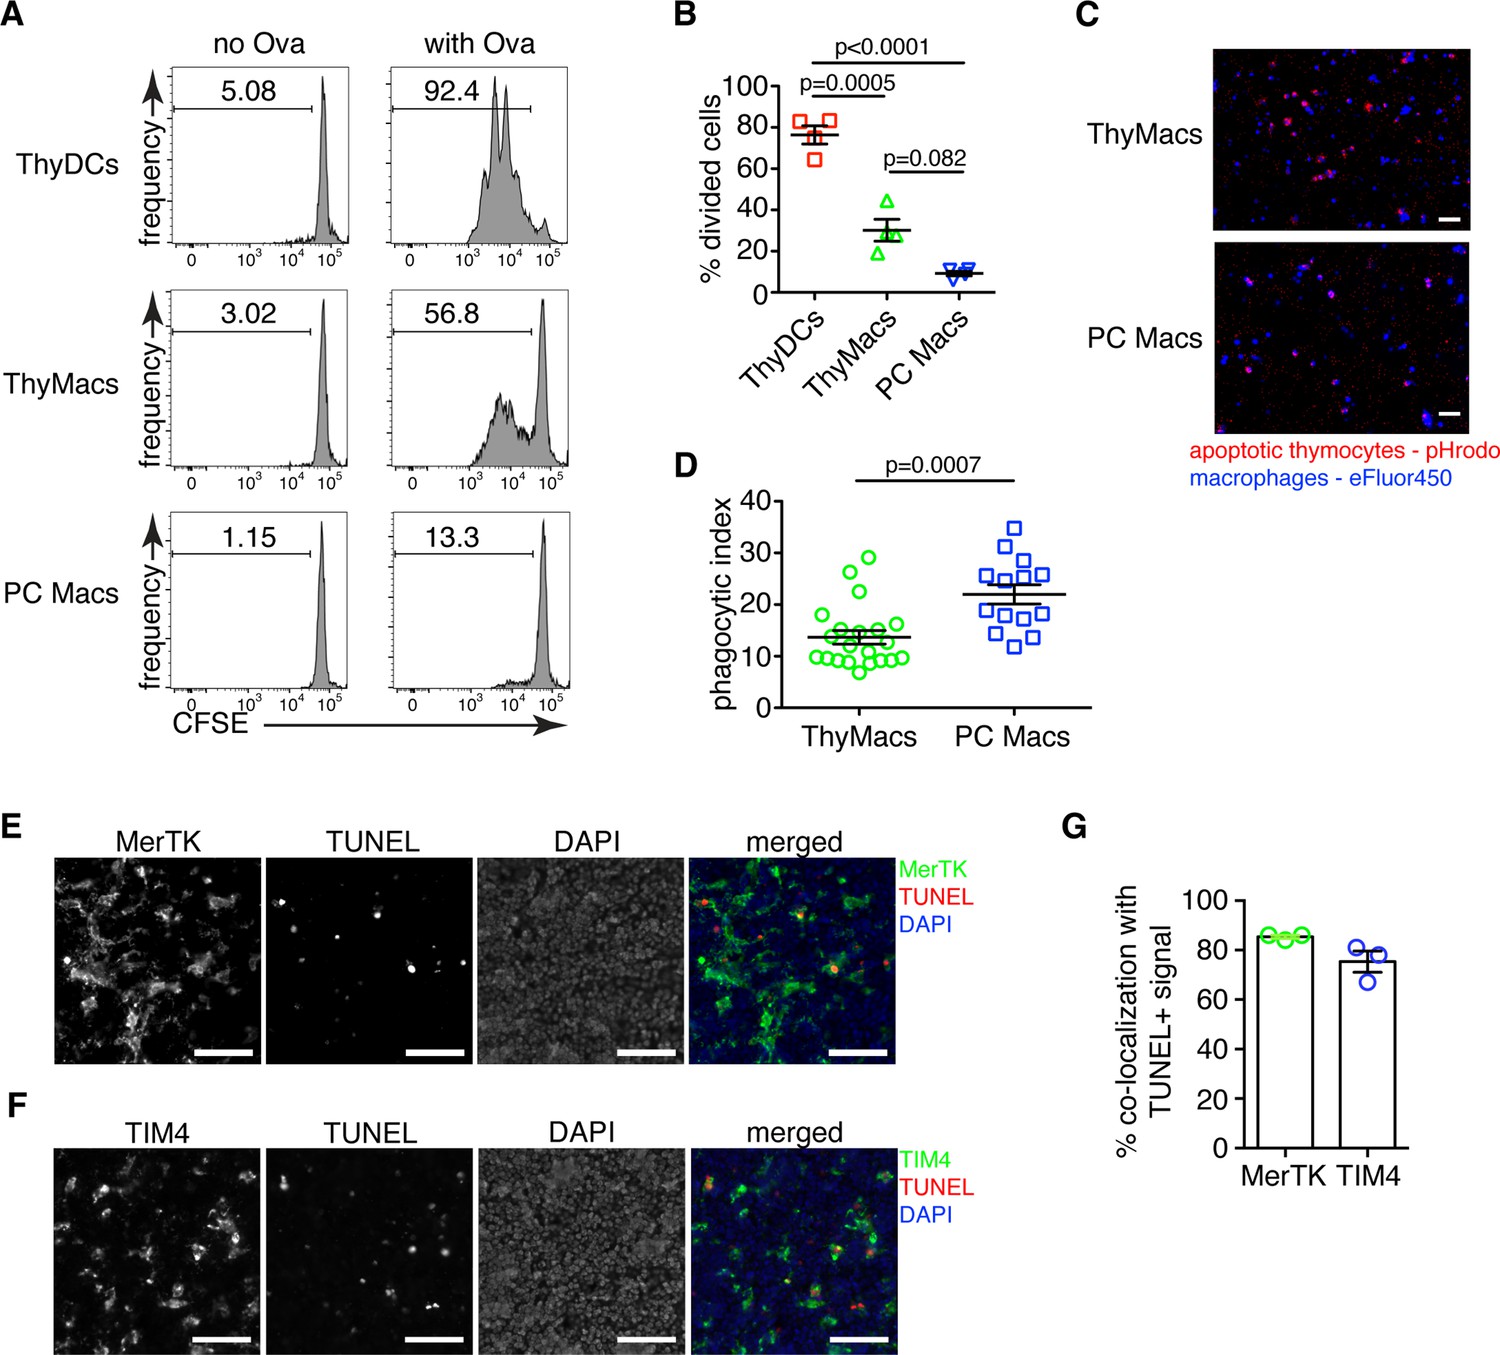
Thymic macrophages can present antigens to T cells and phagocytose apoptotic cells.
(A) Naïve OT2 T cells were labeled with CFSE and cultured with purified thymic dendritic cells (ThyDCs), thymic macrophages (ThyMacs), or peritoneal cavity macrophages (PC Macs) in the presence or absence of chicken ovalbumin (Ova). Three days later, the CFSE dilution was assessed by flow cytometry. (B) Quantification of the cell division in naïve OT2 cells by using the Cell Proliferation module in FlowJo that calculates the percent of cells from the initial population that has undergone division. (C) Example immunofluorescent images of ThyMacs or PC Macs phagocytosis apoptotic thymocytes. The macrophages were labeled with eFluor 450, while the apoptotic thymocytes with pHrodo Red. An intense red signal within the macrophages indicates phagocytosed thymocytes. (D) Quantification of the percentage of macrophages that have engulfed at least one thymocyte (phagocytic index). (E) Example images showing co-localization of TUNEL+ apoptotic cells and MerTK+ ThyMacs in thymic sections. (F) Example images showing co-localization of TUNEL+ apoptotic cells and TIM4+ ThyMacs in thymic sections. Scale bars in (E and F) are 50 µm. (G) Frequencies of the co-localization of TUNEL+ signal with MerTK+ and TIM4+ cells. Flow cytometry plots in (A) are representative of two independent experiments. All immunofluorescent images are representative of at least three independent repeats. Data in (B, D, and G) represent mean ± SEM. Each symbol in B and G is an individual mouse. Each symbol in D is a field of view.
-
Figure 3—source data 1
Antigen presentation and phagocytosis of apoptotic cells by thymic macrophages.
- https://cdn.elifesciences.org/articles/75148/elife-75148-fig3-data1-v2.xlsx
Figure 4 with 4 supplements

Two populations of macrophages with distinct localization exist in the thymus.
(A) Identification of the clusters from the single-cell RNA-sequencing data based on lineage-specific markers. (B) Expression of lineage-specific markers in different clusters. (C) UMAP clusters from A with high expression of the transcription factor Mafb fall into three groups: monocytes, Timd4+ macrophages, and Cx3cr1+ macrophages. (D) Expression of the indicated genes in the three Mafb-positive clusters. (E) A flow cytometry plot of Cx3cr1GFP and TIM4 expression in thymic macrophages (ThyMacs). The plot is representative of >10 individual experiments. The numbers inside the plot are the percentages of the cell populations in the respective gates. (F) Immunofluorescent staining of the thymus of Cx3cr1GFP mouse stained with MerTK (a marker for all macrophages) and Keratin 5 (a marker for medulla). The scale bar is 150 µm. Areas in the cortex, medulla, and the cortico-medullary junction (CMJ) represented by the dashed boxes are enlarged to the right to show the co-localization of Cx3cr11GFP and MerTK signal in CMJ and medulla, but not in the cortex. The scale bars in the images to the right are 20 µm. The images are representative of three individual mice. (G) Differentially expressed genes among Timd4+ thymic macrophages, Cx3cr1+ thymic macrophages, and thymic monocytes. The negative log10 p-values for the genes expressed in each cluster were calculated as described in the Materials and methods, and the top 50 differentially expressed genes were plotted in the figure. Ten of these genes are listed on the left.
Figure 4—figure supplement 1
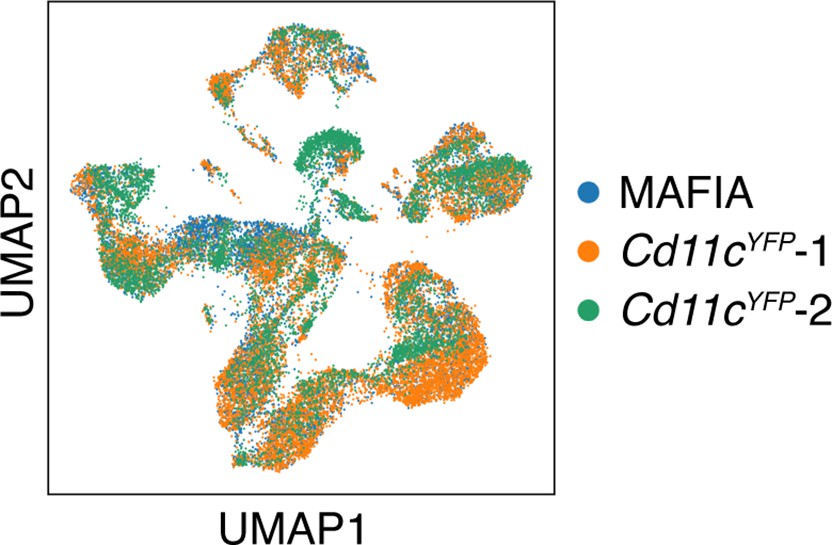
UMAP clustering of the single-cell RNA-sequencing data shows that the cells from the three samples (one from GFP+ cells in MAFIA mice and two from YFP+ cells in Cd11cYFP mice) overlap considerably.
Figure 4—figure supplement 2
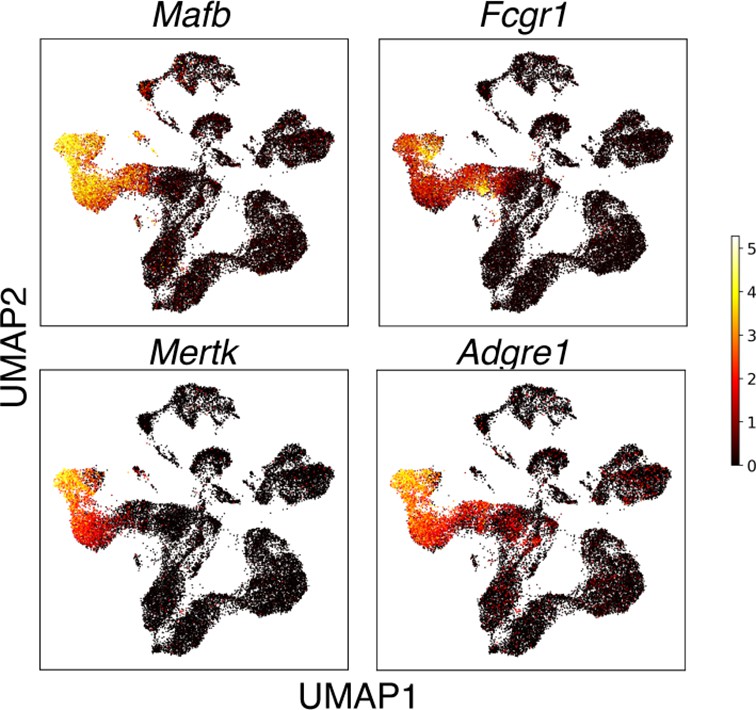
The relative expression of prototypical macrophage genes Mafb, Fcgr1 (CD64), Mertk, and Adgre1 (F4/80) among thymic cells sorted as Csf1rGFP+ and Cd11cYFP+.
Figure 4—figure supplement 3
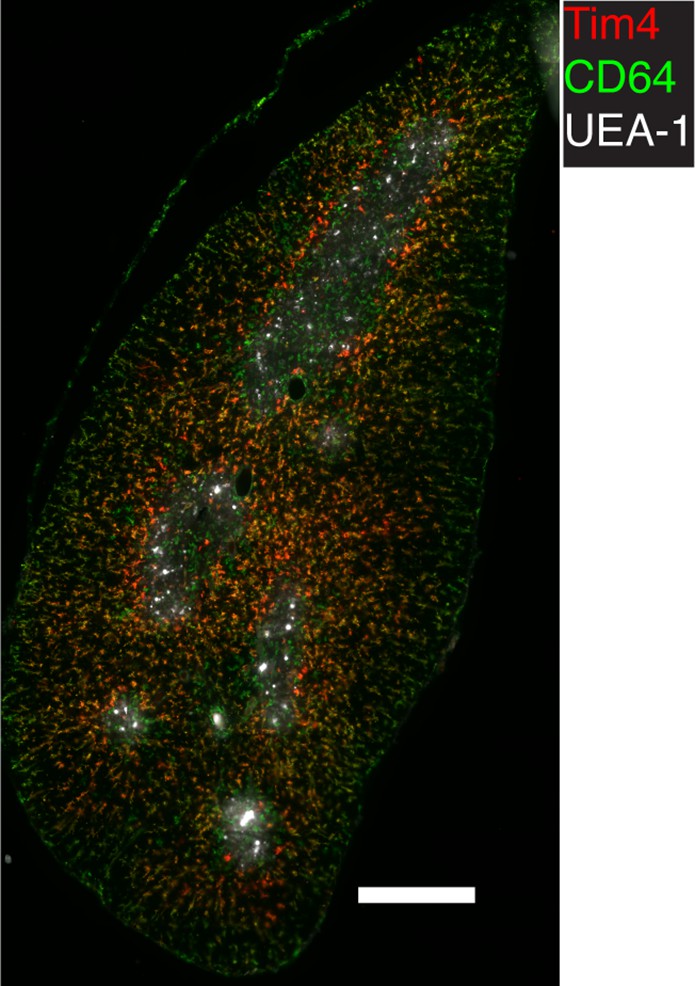
Representative immunofluorescent image of WT thymic frozen section stained for TIM4, CD64, and UEA-1 (a marker for medulla).
CD64 stains all macrophages, while TIM4 – only a subset that is located in the cortex. The image is representative of three mice. The scale bar is 400 µm.
Figure 4—figure supplement 4
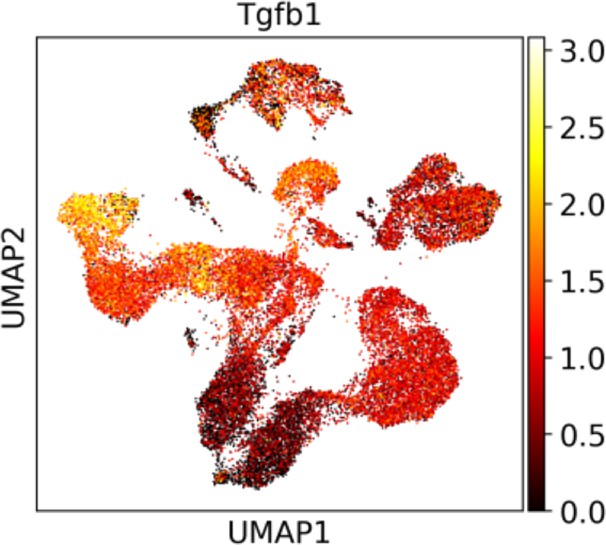
The relative expression of Tgfb1 among thymic cells from the single-cell RNA-sequencing data.
Figure 5 with 2 supplements
Yolk sac (YS), non-YS-derived embryonic progenitors, and adult hematopoietic stem cells sequentially contribute to the thymic macrophage (ThyMac) pool.
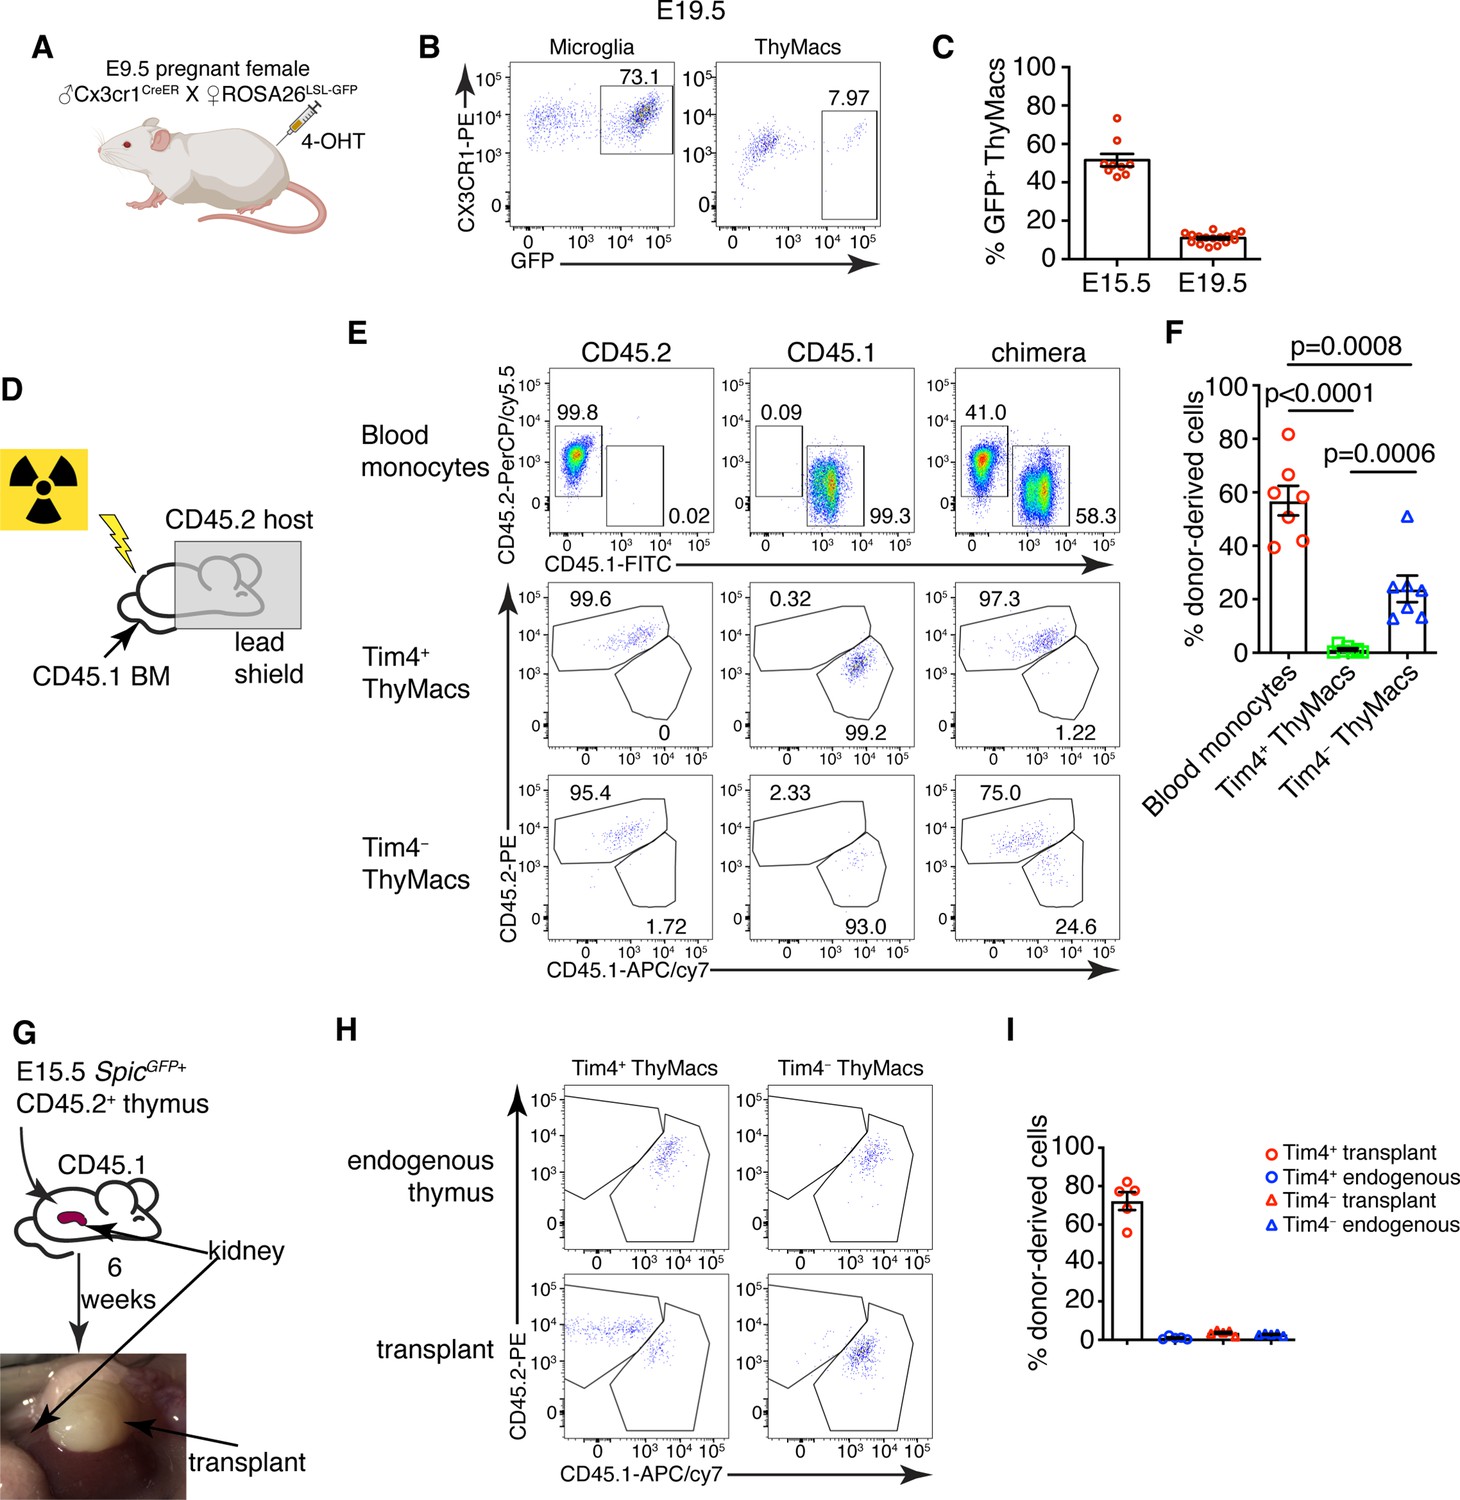
(A) Scheme of the YS-progenitor labeling experiments. E9.5 pregnant ROSA26LSL-GFP mice mated with Cx3cr1CreER males were injected with 4-hydroxytamoxifen (4-OHT) and sacrificed at E15.5 or E19.5. (B) Representative flow cytometry plots of the Cx3cr1GFP expression in microglia (CD45+CD11b+ cells in the brain) and ThyMacs of the pups at E19.5. (C) Frequencies of GFP+ ThyMacs at E15.5 and E19.5 adjusted to the degree of labeling of microglia. (D) Scheme of the shield chimera experiments. Congenic CD45.2 mice were lethally irradiated with their upper body protected by a 5-cm thick lead shield and then injected with CD45.1+ bone marrow. (E) Representative flow cytometric analysis of CD115+CD11b+ blood monocytes, TIM4+ and TIM4− ThyMacs for donor-derived (CD45.1+) and host-derived (CD45.2+) cells. Non-chimeric CD45.1 and CD45.2 samples serve as controls for the gating. (F) Frequencies of donor-derived blood monocytes, TIM4+ and TIM4− ThyMacs. (G) Scheme of the thymus transplantation experiments. Embryonic thymuses from E15.5 SpicGFP+ CD45.2+ mice were transplanted under the kidney capsule of CD45.1+ mice and analyzed 6 weeks later. (H) Representative flow cytometry plots of donor- (CD45.2+) vs. host (CD45.1+)-derived TIM4+ and TIM4− ThyMacs in the transplanted thymus. The host thymus (endogenous thymus) serves as a negative control. (I) Frequencies of CD45.2+ (donor-derived) cells among TIM4+ and TIM4− ThyMacs in the transplanted and endogenous thymuses of the mice. Data in C, F, and I are mean ± SEM with two litters, seven, and five mice per group, respectively. The numbers in the flow cytometry plots are the percent of cells in the respective gates. Each symbol in the graphs is an individual mouse or embryo.
-
Figure 5—source data 1
Contribution of different waves of progenitors to the thymic macrophage pool.
- https://cdn.elifesciences.org/articles/75148/elife-75148-fig5-data1-v2.xlsx
Figure 5—figure supplement 1
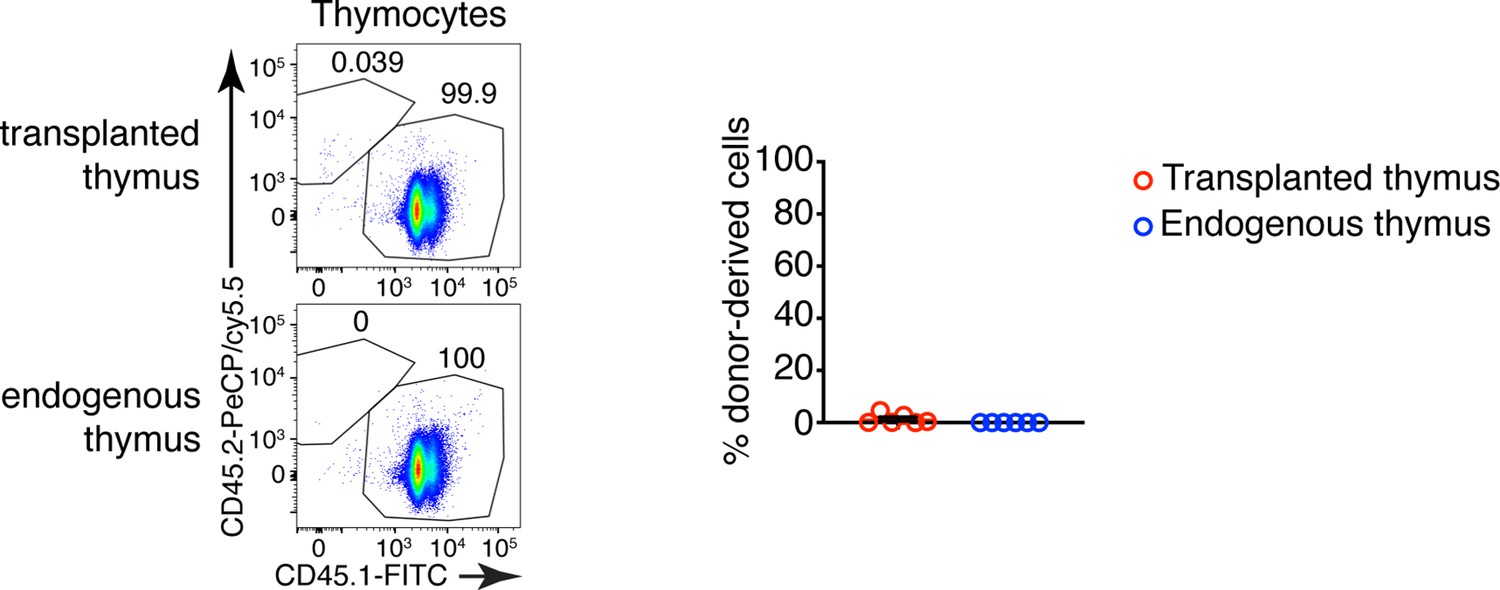
Representative flow cytometry plots of donor- (CD45.2+) vs. host (CD45.1+)-derived thymocytes in the transplanted thymus.
The host thymus (endogenous thymus) serves as a negative control. To the right is a graph showing the mean ± SEM of the frequencies of CD45.2+ (donor-derived) cells among thymocytes in the transplanted and endogenous thymuses of the mice. Each dot is an individual mouse. The numbers in the flow cytometry plots are the percent of cells in the respective gate.
-
Figure 5—figure supplement 1—source data 1
All thymocytes in the transplanted thymus are derived from host hematopoietic stem cells.
- https://cdn.elifesciences.org/articles/75148/elife-75148-fig5-figsupp1-data1-v2.xlsx
Figure 5—figure supplement 2
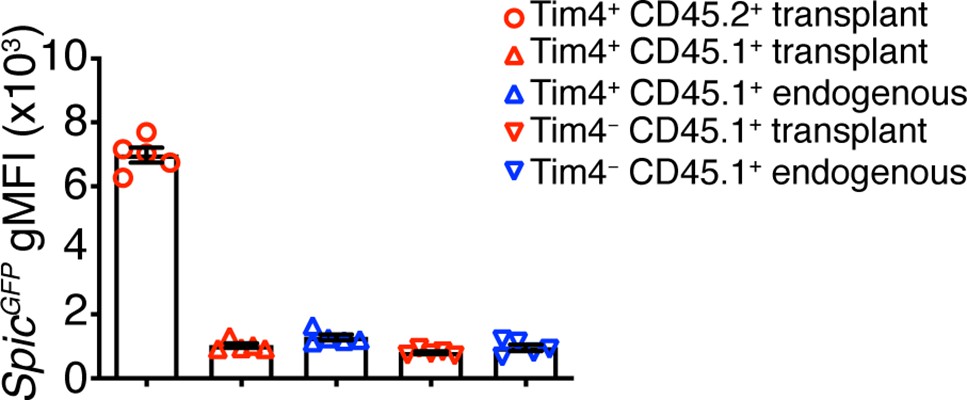
Comparison of the geometric mean fluorescent intensities (gMFI) of SpicGFP TIM4+ and TIM4− thymic macrophages of host and donor-origin in the transplanted thymus.
The endogenous thymus serves as background control. Only populations comprising >5% of thymic macrophages are shown. Each dot is an individual mouse. The data are presented as mean ± SEM.
-
Figure 5—figure supplement 2—source data 1
Only TIM4+ thymic macrophages in the transplanted thymus express SpicGFP and are donor-derived.
- https://cdn.elifesciences.org/articles/75148/elife-75148-fig5-figsupp2-data1-v2.xlsx
Figure 6 with 1 supplement
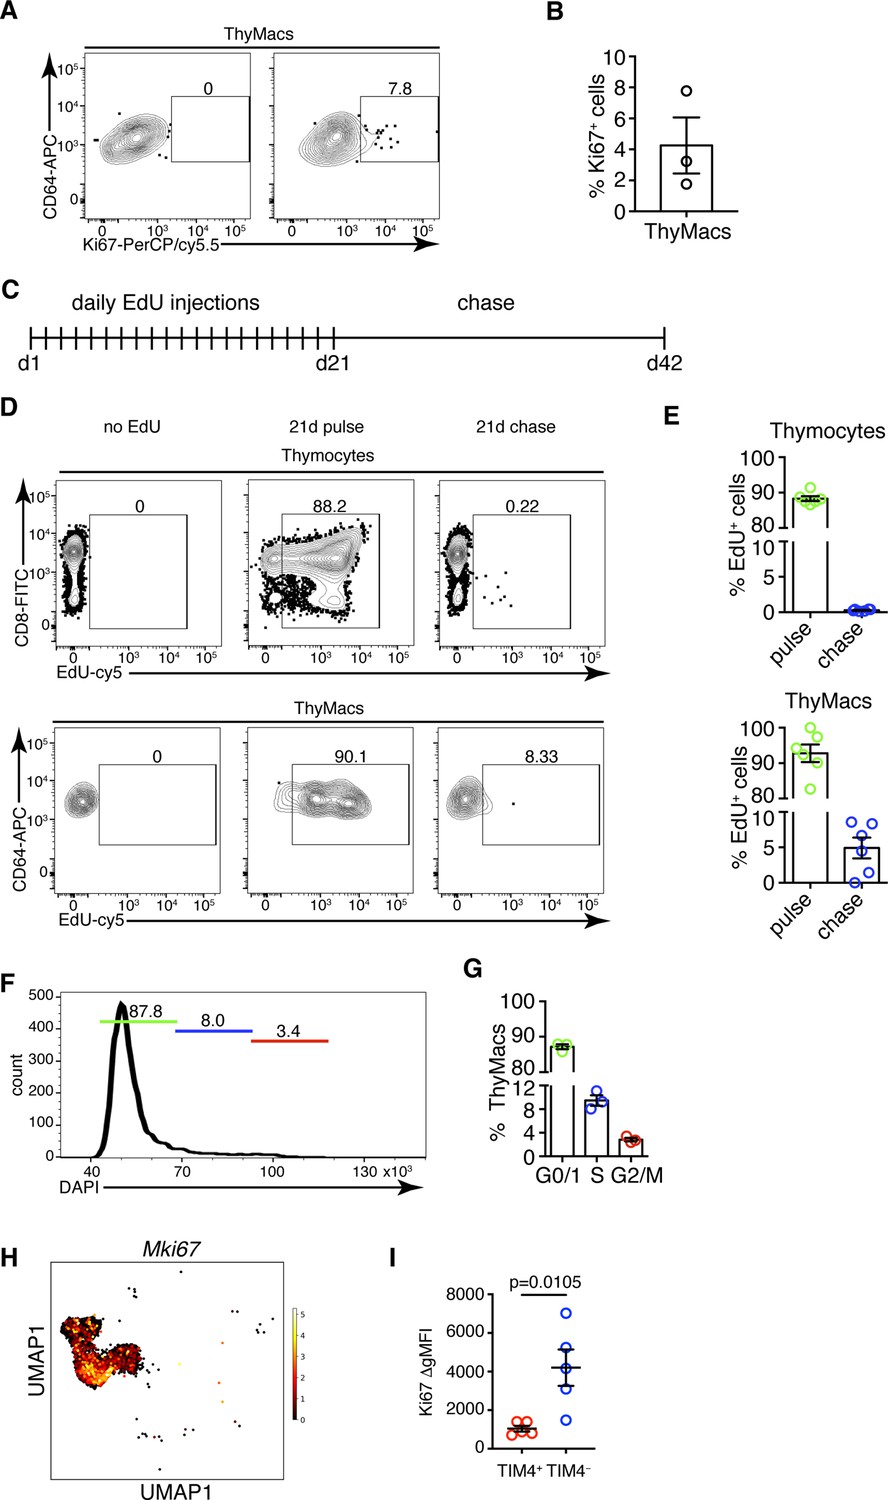
Thymic macrophages (ThyMacs) exhibit a low degree of proliferation.
(A) Example flow cytometry plots of Ki67 staining of ThyMacs. (B) Frequency of Ki67+ ThyMacs. (C) Scheme of 5-ethynyl-2’-deoxyuridine (EdU) pulse/chase experiment: mice were injected daily with 1 mg EdU i.p. for 21 days and rested for 21 more days. (D) Example flow cytometry plots of EdU staining of thymocytes (upper row) and ThyMacs (lower row). (E) Frequencies of EdU+ cells among thymocytes (top graph) and ThyMacs (bottom graph). (F) Example flow cytometry plot of cell cycle analysis of FACS-sorted ThyMacs. (G) Frequencies of ThyMacs in different stages of the cell cycle. (H) UMAP plot of Mki67 expression in Mafb-positive clusters from the single-cell RNA-sequencing data described in Figure 4. (I) Comparison of Ki67 protein expression in TIM4+ and TIM4− ThyMacs. The expression is measured as the difference of the geometric mean fluorescent intensities of the Ki67 antibody staining and isotype control (ΔgMFI). The numbers in the flow cytometry plots are the percent of cells in the respective gates. Data are mean ± SEM from three mice (B and G) or five mice (I), or six to seven individual mice (E). Each dot is an individual mouse. Statistical significance in (I) was determined by unpaired Student’s t-test.
-
Figure 6—source data 1
Low degree of proliferation in thymic macrophages mainly restricted to the TIM4- subset.
- https://cdn.elifesciences.org/articles/75148/elife-75148-fig6-data1-v2.xlsx
Figure 6—figure supplement 1
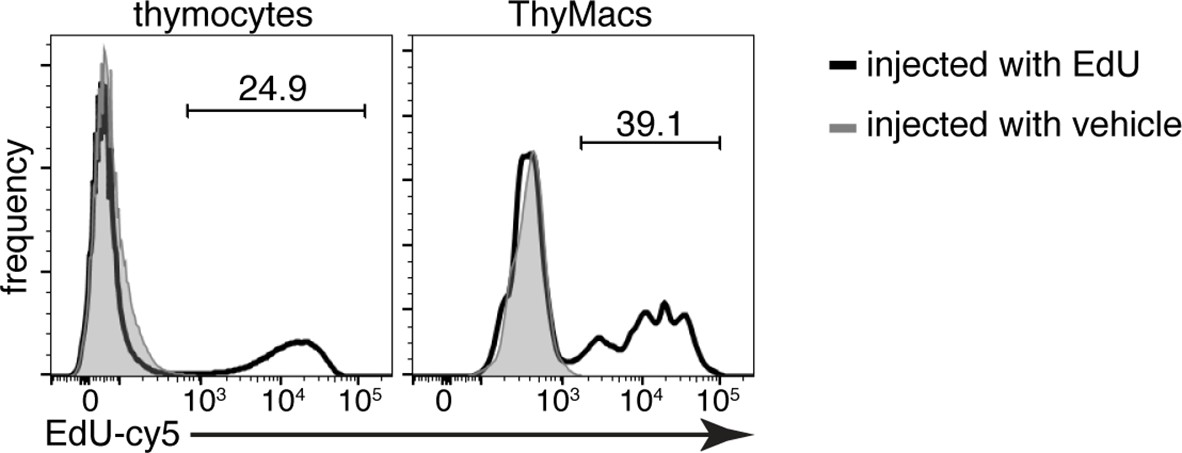
Example flow cytometry plots of the 5-ethynyl-2’-deoxyuridine (EdU) accumulation in thymocytes and thymic macrophages 2 hr after 1 mg EdU i.p. or vehicle injection.
The numbers inside flow plots are the percentage of EdU+ cells from mice injected with EdU. Data are representative of three independent experiments.
Figure 7
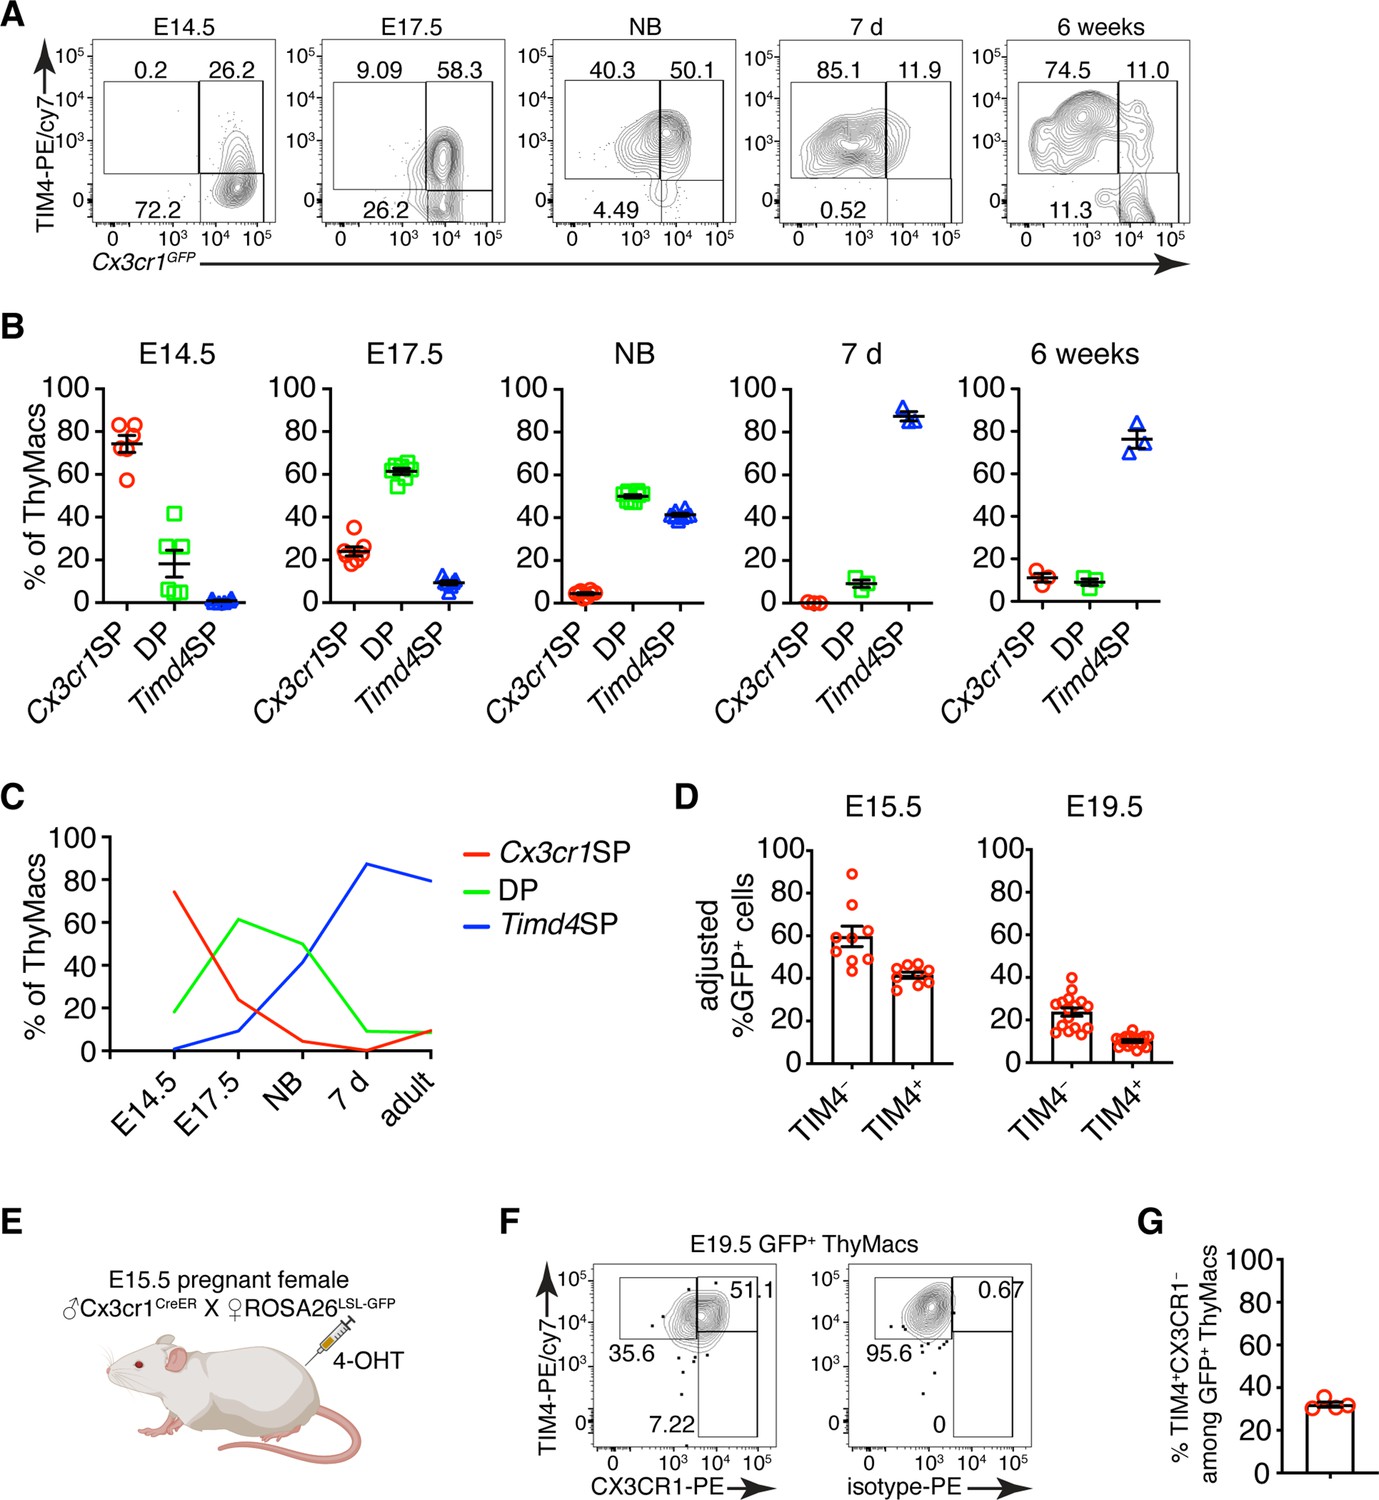
Timd4+ thymic macrophages are derived from Cx3cr1+ cells during embryonic development.
(A) Example flow cytometry plots for the expression of Cx3cr1GFP and TIM4 on thymic macrophages at different times during embryonic development (E14.5, E17.5), immediately after birth, at 7 days, and 6 weeks of age. (B) Frequencies of Timd4+Cx3cr1− (Timd4 single-positive or Timd4SP), Timd4+Cx3cr1+ (double-positive or DP), and Cx3cr1+Timd4− (Cx3cr1 single-positive or Cx3cr1SP) thymic macrophages at the indicated time points. (C) Kinetics of the changes in different subpopulations of thymic macrophages from E14.5–6 weeks. (D) Frequencies at E15.5 and E19.5 of GFP-labeled cells among TIM4+ or TIM4− cells in Cx3cr1CreER × ROSA26LSL-GFP embryos treated with 4-OHT at E9.5. (E) Scheme of the fate-mapping experiments showing the relationship between Cx3cr1+ and Timd4+ thymic macrophages during embryonic development. E15.5 pregnant ROSA26LSL-GFP mice mated with Cx3cr1CreER males were injected with 4-hydroxytamoxifen (4-OHT) and sacrificed at E19.5. (F) Representative flow cytometry staining for TIM4 and CX3CR1 in fate-mapped GFP+ thymic macrophages at E19.5. The panel to the right is the isotype control for CX3CR1-PE staining. (G) Frequencies of TIM4+CX3CR1− cells among fate-mapped GFP+ macrophages. Data are shown as meanSEM and are from at least two independent experiments for each panel. Each symbol is an individual mouse or embryo.
-
Figure 7—source data 1
Thymic macrophages during the embryonic period.
- https://cdn.elifesciences.org/articles/75148/elife-75148-fig7-data1-v2.xlsx
Figure 8
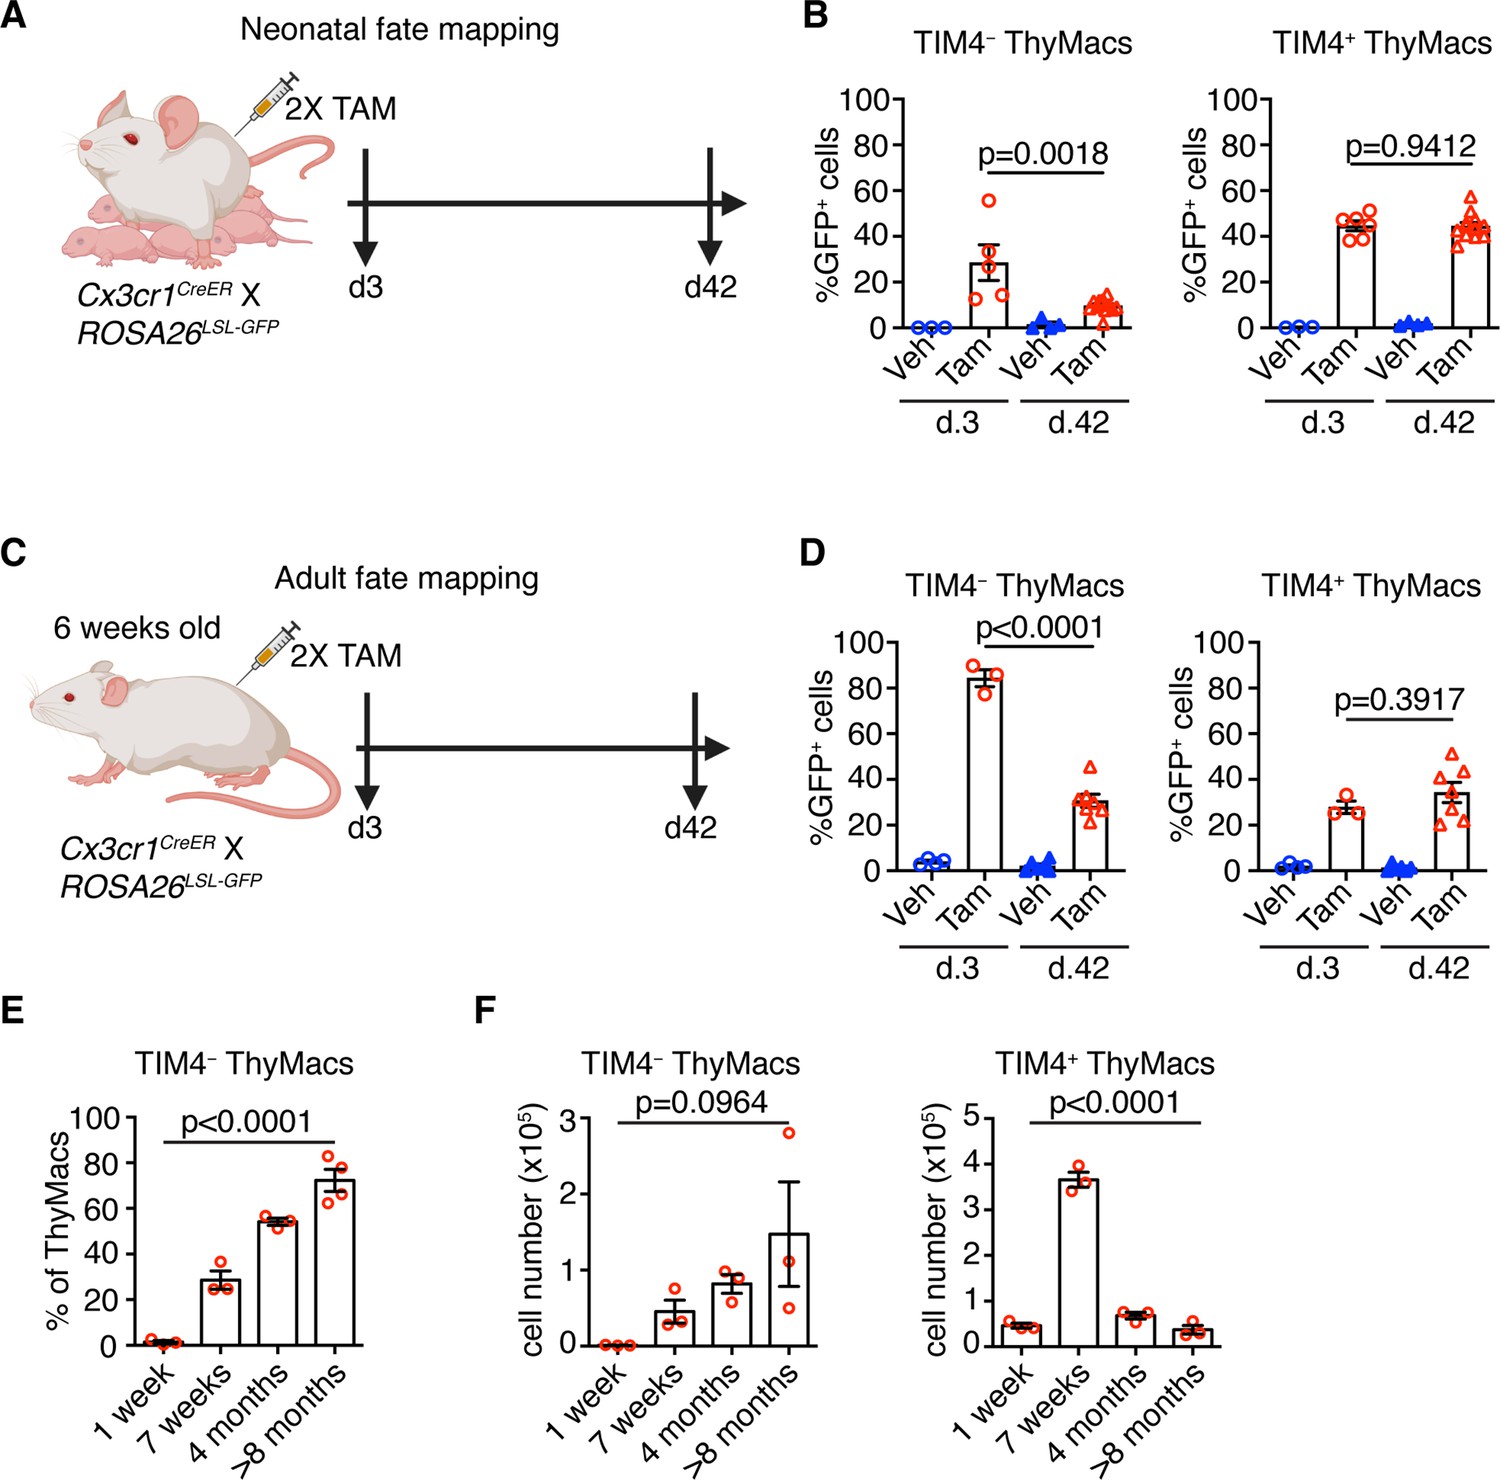
Timd4+ thymic macrophages (ThyMacs) are progressively lost, while Cx3cr1+ cells slowly accumulate with age.
(A) Scheme of the neonatal fate mapping: A nursing dam was injected twice with tamoxifen (Tam) or vehicle (Veh) in the first week after giving birth to Cx3cr1CreER × ROSA26LSL-GFP pups. The mice were sacrificed 3 or 42 days after the last injection, and the degree of labeling of TIM4+ and TIM4− ThyMacs was examined by flow cytometry. (B) Frequencies of GFP+ TIM4+ or TIM4− ThyMacs from neonatally fate-mapped mice after 3 and 42 days. Vehicle-injected nursing dam litters (Veh) served as a control for non-specific labeling. (C) Scheme of the adult fate mapping: Six weeks old Cx3cr1CreER × ROSA26LSL-GFP mice were injected twice with Tam or Veh. The mice were sacrificed 3 or 42 days after the last injection, and the degree of labeling of TIM4+ and TIM4− ThyMacs was examined by flow cytometry. (D) Frequencies of GFP+ TIM4+ or TIM4− ThyMacs from adult fate-mapped mice after 3 and 42 days. (E) Frequencies of TIM4− ThyMacs at different ages. (F) Changes in the numbers of TIM4− and TIM4+ ThyMacs with age. The data are mean ± SEM from two independent experiments (B) or at least three individual mice per time point (D, E, and F). Each symbol is an individual mouse. Statistical significance in the difference between Tam-treated samples at different time points was determined with unpaired Student’s t-test (B and D). One-way ANOVA was used to assess the significance of the change in TIM4+ and TIM4− ThyMacs percentages and numbers with age (E and F).
-
Figure 8—source data 1
Dynamics of TIM4+ and TIM4- thymic macrophages with age.
- https://cdn.elifesciences.org/articles/75148/elife-75148-fig8-data1-v2.xlsx
Tables
Table 1
Expression of differentially up-regulated transcription factors in thymic macrophages.
Transcription factors that were highly expressed in thymic macrophages (>250) and up-regulated >twofold in thymic macrophages compared to non-thymic macrophages were listed alphabetically, and the geometric means of four replicates of thymic macrophages (ThyMacs) and two replicates of each of the nine non-thymic macrophage populations (non-ThyMacs) were recorded. Non-thymic macrophages are: spleen red pulp macrophages, Kupffer cells, broncho-alveolar lavage macrophages, peritoneal cavity macrophages, aorta macrophages, heart macrophages, white adipose tissue macrophages, central nervous system microglia, and spinal cord macrophages.
| Gene name | ThyMacs | non-ThyMacs |
|---|---|---|
| Irf7 | 3879.32 | 300.82 |
| Irf8 | 3528.27 | 1474.35 |
| Stat1 | 2403.69 | 522.04 |
| Dnmt3a | 1515.94 | 647.81 |
| Znxf1 | 1379.89 | 635.36 |
| Stat2 | 1210.35 | 472.53 |
| Nr1h3 | 1182.17 | 147.05 |
| Srebf1 | 975.09 | 399.06 |
| Rxra | 760.26 | 298.55 |
| Trps1 | 746.36 | 232.48 |
| Runx3 | 723.14 | 9.76 |
| Relb | 715.53 | 293.92 |
| Sp100 | 696.94 | 324.47 |
| Zbp1 | 639.19 | 69.83 |
| Tfec | 588.72 | 74.66 |
| Spic | 573.11 | 34.36 |
| Nfkbie | 569.74 | 226.76 |
| Ncoa4 | 550.69 | 249.15 |
| Rest | 548.22 | 269.22 |
| Meis3 | 530.8 | 120.91 |
| Bhlhe40 | 490.59 | 99.56 |
| Parp12 | 414.11 | 126.82 |
| Arid5b | 374.03 | 177.08 |
| Creb5 | 295.14 | 47.91 |
| Pparg | 276.54 | 33.24 |
Table 2
List of the differentially expressed genes among Timd4+ thymic macrophages, Cx3cr1+ thymic macrophages, and thymic monocytes.
The top 100 differentially expressed genes among the three clusters are listed by their negative log10 transformed p-value.
| Cx3cr1 + ThyMacs | Timd4 + ThyMacs | ThyMonos | |||
|---|---|---|---|---|---|
| Gene name | Adjusted p-value | Gene name | Adjusted p-value | Gene name | Adjusted p-value |
| Ctsz | 0 | Hpgd | 0 | Alox5ap | 0 |
| Cd63 | 0 | Serpinb6a | 0 | S100a6 | 0 |
| Pmepa1 | 0 | Slc40a1 | 0 | Ly6c2 | 0 |
| Zmynd15 | 0 | Cd81 | 0 | Ifi27l2a | 0 |
| Olfml3 | 0 | Vcam1 | 0 | Fau | 0 |
| Mmp2 | 0 | Cfp | 0 | Coro1a | 0 |
| AU020206 | 1.60E-290 | Spic | 0 | Ccr2 | 0 |
| Plxnd1 | 1.59E-285 | Trf | 0 | Rps27 | 0 |
| Cst7 | 8.68E-279 | Actn1 | 0 | Tmsb10 | 0 |
| Dnase1l3 | 2.45E-270 | Maf | 0 | Ifitm2 | 7.21E-302 |
| Timp2 | 2.15E-267 | Pld3 | 0 | Fxyd5 | 6.36E-299 |
| Lgals3bp | 8.69E-263 | Il18 | 0 | Rps19 | 2.04E-292 |
| Pdgfa | 6.87E-255 | Mrc1 | 0 | Rpl18 | 6.50E-291 |
| Mmp14 | 2.33E-253 | Crip2 | 0 | Rpl9 | 1.11E-289 |
| Fam46c | 9.99E-235 | Tmem65 | 0 | Rps23 | 1.28E-289 |
| Chst2 | 1.19E-226 | Igf1 | 0 | Napsa | 8.91E-279 |
| Cp | 5.36E-225 | Epb41l3 | 0 | Ms4a4c | 8.25E-272 |
| Camk1 | 7.12E-225 | Timd4 | 0 | Plac8 | 2.10E-270 |
| B2m | 1.09E-222 | Blvrb | 0 | Rpl18a | 9.26E-269 |
| Lhfpl2 | 4.52E-217 | Clec1b | 0 | S100a4 | 4.98E-268 |
| Acp5 | 5.90E-216 | Cd68 | 0 | Cd52 | 3.67E-267 |
| Lag3 | 3.91E-213 | Axl | 0 | Rps14 | 1.94E-266 |
| Lyz2 | 1.28E-209 | Paqr9 | 3.32E-307 | Ifitm3 | 3.19E-263 |
| H2-M2 | 1.22E-199 | Sdc3 | 3.45E-305 | Rpl34 | 2.02E-261 |
| Psap | 7.26E-198 | Myo9a | 5.59E-305 | Rps27a | 3.67E-260 |
| Gatm | 1.33E-192 | Scp2 | 3.79E-302 | Rpl36 | 1.54E-259 |
| Cpd | 1.50E-192 | Selenop | 2.10E-295 | Rps16 | 2.55E-258 |
| C3 | 2.34E-187 | Lrp1 | 2.08E-294 | Rpl24 | 1.37E-257 |
| Cxcl16 | 8.11E-183 | Lap3 | 1.45E-290 | Rps9 | 6.34E-253 |
| Lgals3 | 1.57E-182 | Marcks | 2.77E-279 | Gpr141 | 1.21E-246 |
| Ube2j1 | 1.63E-180 | Glul | 3.64E-279 | Rpl27a | 3.06E-243 |
| Plxnc1 | 9.84E-180 | Hebp1 | 3.76E-278 | Rpl17 | 8.15E-241 |
| Stab1 | 4.07E-176 | Ear2 | 4.53E-276 | Rps24 | 1.46E-240 |
| Cyth1 | 3.27E-163 | Apoc1 | 2.49E-275 | Rps13 | 2.34E-236 |
| Spsb1 | 3.96E-163 | Kcna2 | 3.72E-275 | Rpl38 | 1.95E-226 |
| Blnk | 2.35E-162 | Myo10 | 9.05E-269 | H2-DMb1 | 1.02E-223 |
| Cx3cr1 | 9.29E-162 | Atp13a2 | 2.95E-267 | Rps18 | 5.39E-223 |
| Med10 | 5.25E-161 | Slc1a3 | 6.24E-263 | Rpl19 | 3.68E-221 |
| Nek6 | 5.28E-160 | Slco2b1 | 1.11E-258 | Rpl8 | 2.01E-219 |
| Ptms | 1.05E-159 | mt-Nd2 | 3.45E-258 | Rpl7a | 4.17E-217 |
| Anxa5 | 1.10E-156 | Wwp1 | 2.16E-253 | Gm34084 | 5.23E-216 |
| Gpnmb | 1.21E-154 | Aplp2 | 4.22E-248 | Rpl13 | 2.08E-215 |
| Itgb5 | 2.78E-154 | Atp8a1 | 5.03E-248 | Rpl11 | 2.47E-213 |
| Myo5a | 1.11E-146 | P2ry13 | 3.17E-247 | Rpl35a | 2.13E-210 |
| Runx3 | 1.81E-146 | Ccdc148 | 4.70E-245 | Rpsa | 1.62E-209 |
| Tmem176a | 2.34E-144 | Grn | 1.58E-244 | Rpl6 | 5.70E-208 |
| Ctss | 4.81E-141 | Bank1 | 1.82E-239 | Tpt1 | 2.63E-206 |
| Sh3pxd2b | 9.38E-141 | Mertk | 2.15E-238 | Rack1 | 2.14E-203 |
| Rtcb | 4.42E-140 | Nr1h3 | 1.13E-235 | Rpl23 | 6.14E-199 |
| Fam20c | 1.91E-139 | Prnp | 2.93E-235 | Rpl26 | 7.48E-198 |
| Il2rg | 8.84E-138 | Ninj1 | 2.42E-234 | Rps6 | 6.64E-197 |
| Lpcat2 | 8.53E-137 | Fcna | 3.33E-233 | Rps10 | 2.06E-195 |
| Kynu | 8.49E-136 | Csrp1 | 1.16E-230 | Ier5 | 1.06E-191 |
| Tnfsf13b | 8.77E-136 | Rgl1 | 7.18E-229 | Rps3 | 8.23E-185 |
| Gpr157 | 1.18E-135 | Lpl | 4.94E-223 | Rpl27 | 8.23E-185 |
| Tgfbr1 | 7.63E-135 | Fam213b | 1.08E-222 | Rps5 | 8.36E-185 |
| H2-K1 | 1.15E-133 | Tcf7l2 | 1.26E-222 | Rps7 | 3.96E-182 |
| Basp1 | 1.23E-133 | AB124611 | 4.64E-221 | Rps15a | 6.82E-182 |
| Pla2g7 | 1.80E-132 | Abcc3 | 3.28E-216 | Rps11 | 1.97E-180 |
| Fth1 | 4.19E-131 | Fcgrt | 5.79E-216 | Rps4x | 5.07E-180 |
| Ggh | 1.85E-126 | Tgm2 | 1.88E-215 | Rplp0 | 3.09E-177 |
| Adam19 | 6.94E-126 | Itgad | 5.35E-214 | Ly6i | 8.17E-176 |
| C3ar1 | 7.35E-125 | Ptgs1 | 2.94E-213 | S100a11 | 6.23E-175 |
| Ccl12 | 3.37E-123 | Laptm4a | 1.01E-212 | Atox1 | 1.22E-174 |
| Hvcn1 | 2.51E-121 | Comt | 1.33E-206 | Pim1 | 9.56E-174 |
| Anxa3 | 8.60E-121 | Creg1 | 3.24E-205 | Sh3bgrl3 | 3.97E-173 |
| Tgfbi | 1.88E-120 | Adgre1 | 9.67E-205 | Ciita | 7.35E-173 |
| Ctsd | 2.73E-117 | Clec12a | 6.33E-204 | Eef1a1 | 6.09E-172 |
| Itm2c | 5.19E-116 | Tspan4 | 7.80E-203 | Rps3a1 | 9.09E-168 |
| Tmem119 | 5.62E-116 | Txn1 | 9.13E-203 | Gm2a | 6.07E-165 |
| Rap2a | 1.03E-114 | Ctsb | 9.52E-201 | Ptprc | 2.05E-163 |
| Ctsl | 4.00E-114 | Mrap | 5.65E-197 | Rpl37 | 1.51E-161 |
| Itga6 | 1.83E-113 | Slc16a9 | 5.99E-197 | Rps25 | 3.03E-160 |
| B4galnt1 | 2.45E-113 | Abcg3 | 3.83E-196 | H3f3a | 5.92E-159 |
| Fam3c | 1.64E-112 | Pla2g15 | 4.22E-196 | Btg2 | 1.14E-158 |
| Tmem173 | 1.54E-111 | C1qc | 6.17E-192 | Rpl15 | 1.42E-158 |
| Ski | 3.59E-111 | Agpat3 | 1.68E-191 | Cnn2 | 1.09E-156 |
| Anpep | 5.85E-111 | Hs6st1 | 1.95E-191 | Cdkn1a | 2.57E-156 |
| Gng2 | 2.37E-110 | Dmpk | 2.15E-191 | Slfn1 | 4.83E-155 |
| Nceh1 | 2.88E-110 | Cd38 | 1.79E-190 | Sem1 | 4.08E-154 |
| H2-Q7 | 4.94E-108 | Tmem26 | 2.02E-189 | Lsp1 | 1.34E-152 |
| Rtn1 | 1.28E-106 | Slc11a1 | 1.05E-188 | Rpl37a | 1.78E-152 |
| Sorl1 | 1.31E-103 | Cd300a | 1.41E-187 | Rpl22 | 3.64E-152 |
| Glipr1 | 1.22E-102 | Slc7a7 | 3.28E-187 | Sirpb1c | 4.81E-152 |
| Gsn | 2.00E-102 | Cyb5a | 6.94E-187 | Traf1 | 6.97E-152 |
| Afdn | 4.54E-102 | Sipa1l1 | 7.41E-187 | Emb | 4.22E-151 |
| Ak2 | 1.11E-101 | Il18bp | 1.48E-186 | Rpl30 | 1.32E-147 |
| Ntpcr | 2.21E-98 | Cd86 | 2.52E-183 | Rps15 | 1.14E-146 |
| Scarb2 | 3.16E-97 | Vamp5 | 3.05E-183 | H2-Ab1 | 2.84E-145 |
| Creb5 | 5.41E-97 | Jup | 6.69E-182 | Il1b | 3.05E-145 |
| Gsto1 | 5.56E-97 | Blvra | 1.30E-178 | Rps28 | 4.52E-145 |
| Ncf1 | 4.26E-96 | Mgst1 | 6.48E-178 | Jarid2 | 1.82E-143 |
| Ppfia4 | 4.97E-96 | Tbxas1 | 1.47E-177 | Rps26 | 1.53E-142 |
| Chchd10 | 7.77E-96 | Hpgds | 2.04E-177 | Rpl32 | 4.21E-142 |
| Gna12 | 1.23E-95 | Tgfbr2 | 2.70E-176 | Pld4 | 9.07E-142 |
| Mvb12b | 1.80E-95 | Clec4n | 3.52E-175 | Cbfa2t3 | 1.54E-141 |
| Rasal3 | 1.45E-94 | Ms4a7 | 5.30E-175 | Rps21 | 4.04E-141 |
| Scoc | 6.86E-94 | Sirpa | 3.35E-171 | Fgr | 4.04E-141 |
| Cfb | 6.00E-93 | Fyn | 2.84E-168 | Rps8 | 1.11E-139 |
| Lmna | 1.04E-92 | Cadm1 | 2.20E-167 | Cd74 | 5.34E-138 |
Additional files
Download links
A two-part list of links to download the article, or parts of the article, in various formats.
Downloads (link to download the article as PDF)
Open citations (links to open the citations from this article in various online reference manager services)
Cite this article (links to download the citations from this article in formats compatible with various reference manager tools)
Thymic macrophages consist of two populations with distinct localization and origin
eLife 11:e75148.
https://doi.org/10.7554/eLife.75148


