Microevolution of Trypanosoma cruzi reveals hybridization and clonal mechanisms driving rapid genome diversification
- Departamento de Biologia Celular, Embriologia e Genética, Universidade Federal de Santa Catarina, Brazil
- Department of Cell and Molecular Biology, Karolinska Institute, Sweden
- Faculty of Infectious and Tropical Diseases, London School of Hygiene and Tropical Medicine, United Kingdom
- Institute of Computational Biology, Computational Health Centre, Helmholtz Munich, Germany
- Departamento de Microbiologia, Imunologia e Parasitologia, Universidade Federal de Santa Catarina, Brazil
Figures
Figure 1
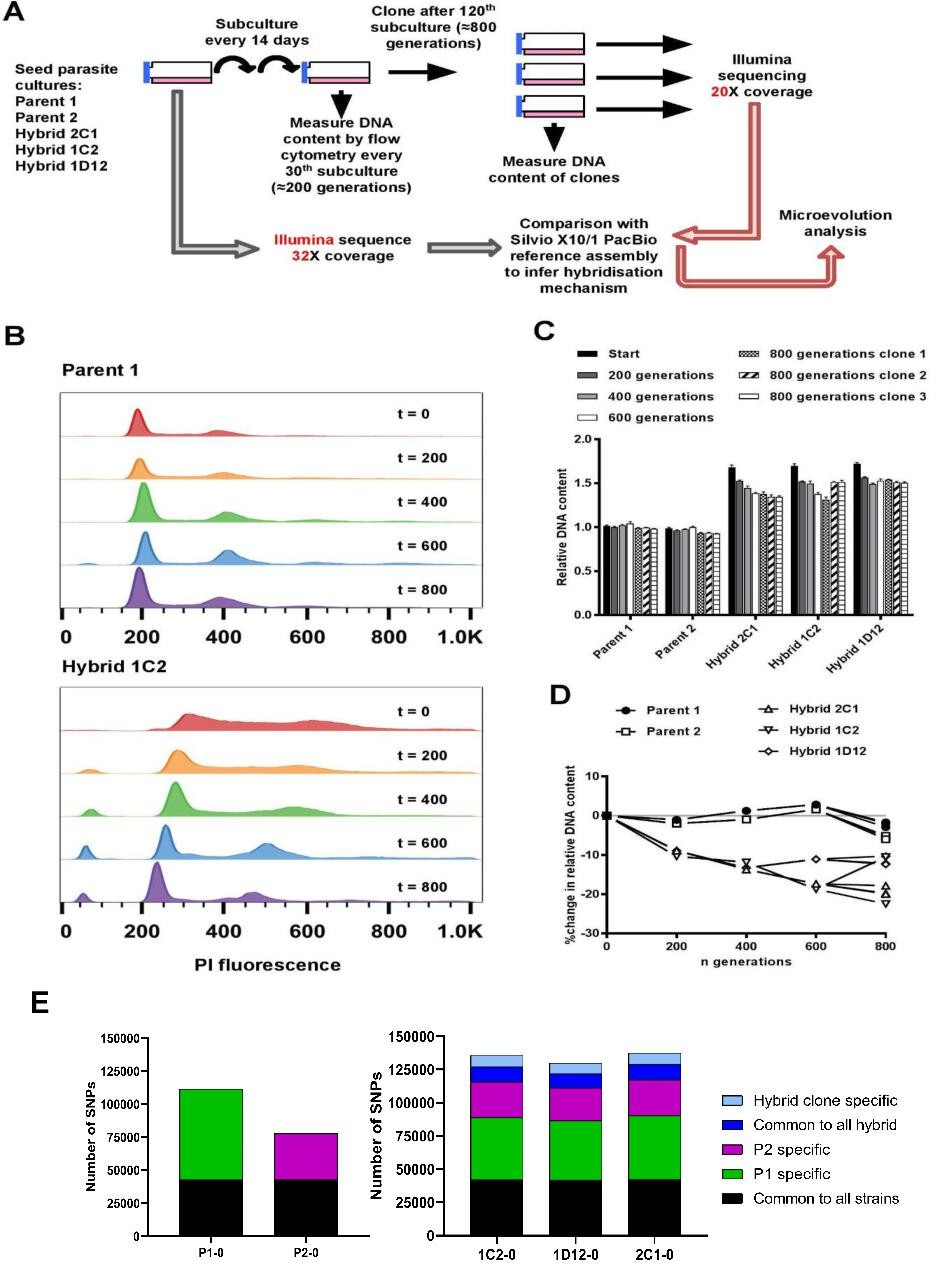
In vitro microevolution of Trypanosoma cruzi hybrids.
(A) Overview of experimental design. (B) DNA content profiles shown as propidium iodide (PI) staining intensity histograms measured by flow cytometry. PI fluorescence = relative fluorescence units; y-axis shows number of events from the population of parasites at the indicated generation of the in vitro culture experiment from start (t=0) to finish (t=800). Plots of one parent and one hybrid are shown, representative of three biological replicates for each time point. The vertical dashed line marks the position of the G1 fluorescence intensity peak at t=0. (C) Quantitative analysis of DNA content for both parents and three hybrid strains at each time point and for three clones per strain generated after the final time point of 800 generations. Data are the mean + SEM of three biological replicates after normalization against an internal standard and conversion to a ratio of the mean of the two parents at t=0. The predicted total DNA content ranges equating to tetraploid (4n1k) and triploid (3n1k) parasites are indicated, under the assumption that kDNA constitutes between 20% and 30% of total DNA. (D) The same data as shown in C, represented as the % change in DNA content over time compared to t=0. (E) Distinct genomic signatures exclusive to each parental strain were inherited by the hybrid strains. In black are represented SNPs present in both parental strains, in green SNPs exclusive to the P1 strain, in purple SNPs exclusive to the P2 strain, in dark blue SNPs common to all hybrids, and in light blue SNPs exclusive to each hybrid clone.
Figure 2
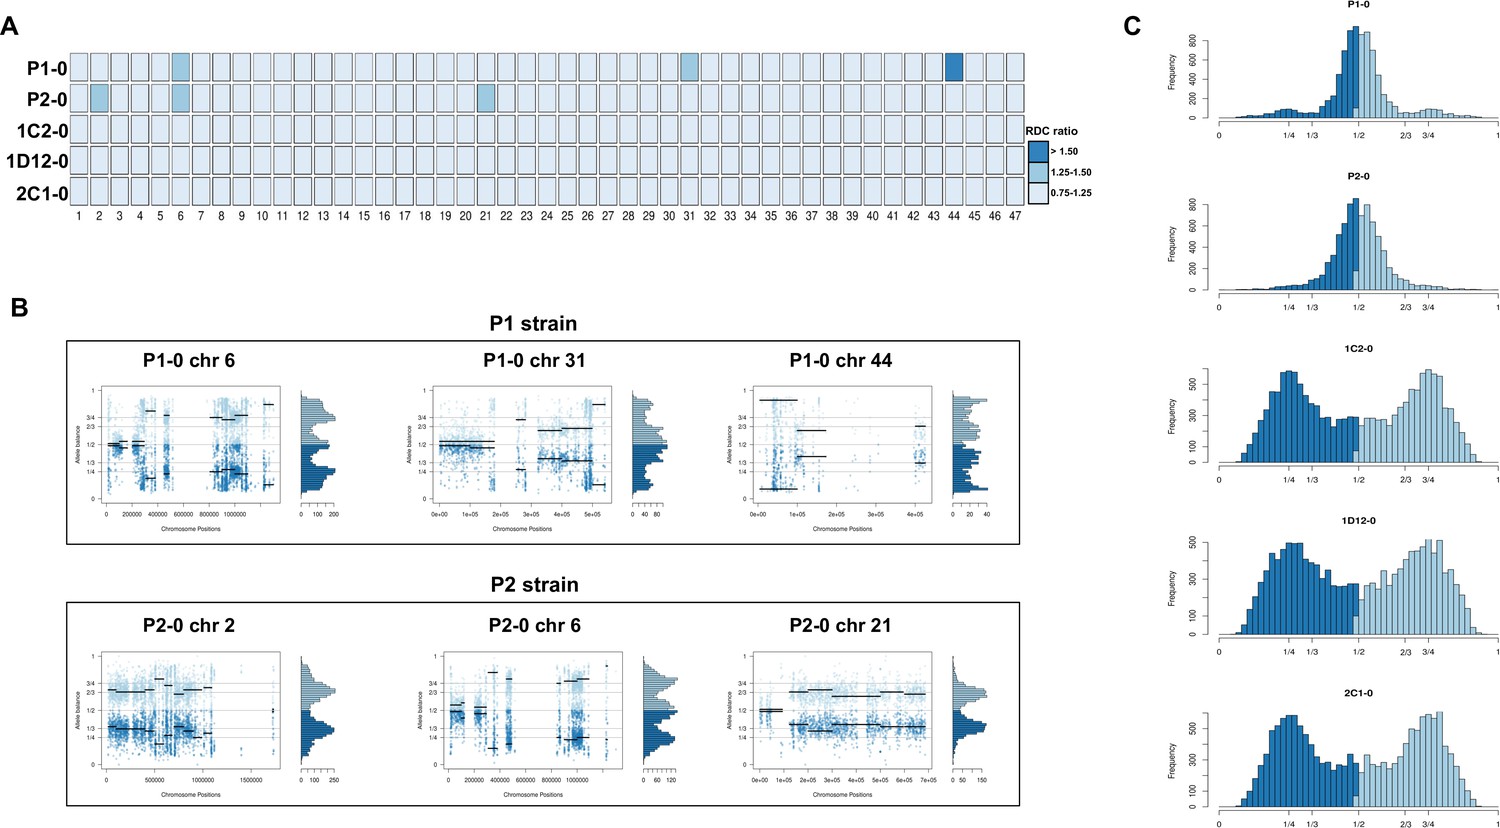
Somy estimation based on read depth coverage (RDC) and allelic balance (AB) reveals aneuploidies in parental strains and tetrasomic hybrid clones.
(A) Aneuploidy analysis based on RDC among all 47 chromosomes in the starting generation of parental strains (P1-0 and P2-0) and hybrids (1C2-0, 1D12-0, and 2C1-0). An increase or decrease in the mean RDC of a chromosome when compared to the genome coverage is an indicator of a gain or loss of chromosomal sequences. When the ratio between the median chromosome coverage and the median genome coverage was approximately one, the chromosome was considered having the same somy as the genome, while fluctuations in this ratio (lower than 0.75 or higher than 1.25) were considered as putative aneuploidies. (B) Proportion of the alleles in heterozygous SNP positions in chromosomes with RDC ratio higher than 1.25 to confirm somy estimations. Blue points represent the proportion of the alleles in heterozygous SNP positions along the chromosome. Darker blue represents the frequency of the first allele while lighter blue represents the frequency of the second allele, black lines represent the median value in windows. (C) Ploidy estimation based on the proportion of the alleles in heterozygous SNP positions of single-copy genes. It is expected that diploid genomes display a proportion of each allele around 50%, triploid genomes around 33.3% and 66.6%, while tetraploid genomes around 25% and 75% or 50% (Lenski, 2017). Darker blue represents the frequency of the first allele while lighter blue represents the frequency of the second allele.
Figure 3 with 5 supplements
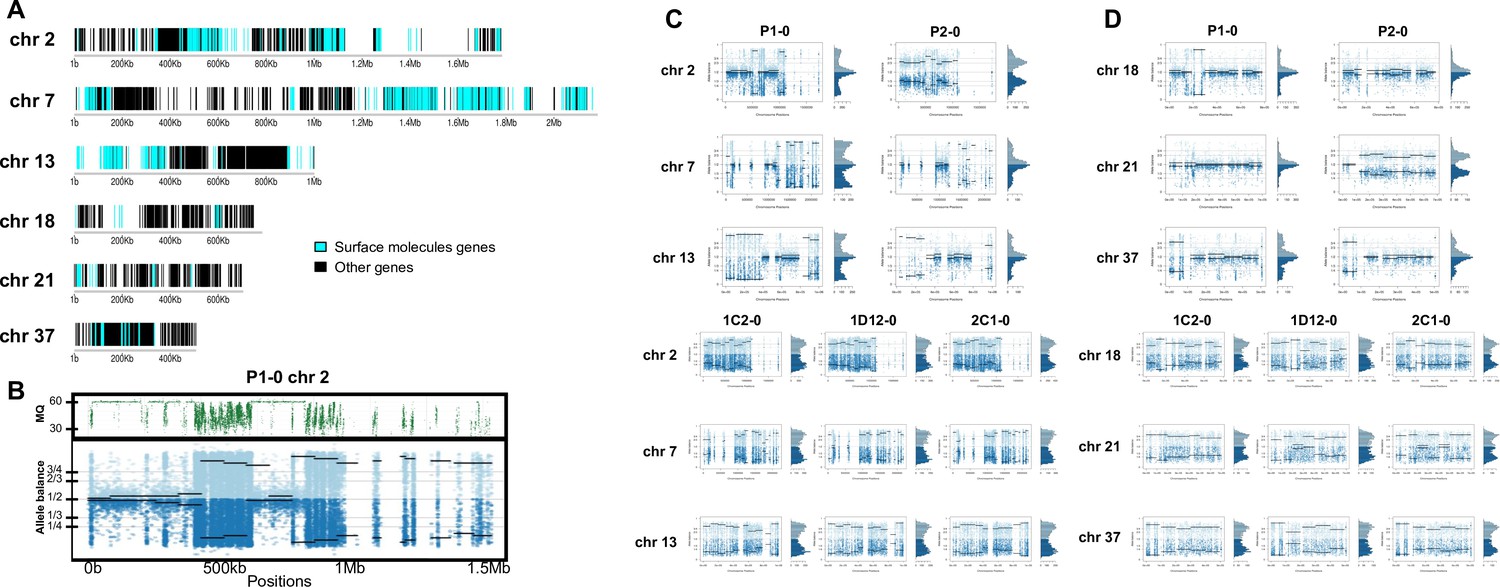
Somy estimation per chromosome based on allele balance (AB) in starting generation confirming aneuploidies in parental strains and tetrasomic hybrid clones.
(A) Gene distribution and its implication in mapping quality (MQ) and somy estimation of six representative TcI chromosomes with longer surface molecule-encoding regions (chromosomes 2, 7, and 13) and shorter encoding surface molecule-encoding regions (chromosomes 18, 21, and 37). Surface protein-coding genes are represented as cyan blue boxes while other genes are represented as black boxes. (B) Implication of chromosome gene distribution in MQ and somy estimation based on AB in chromosome 2 (longer surface molecule-encoding regions) of parental strain 1 (P1-0). Dark green represents the fluctuation in MQ along chromosome positions. Blue points represent the proportion of the alleles in heterozygous SNP positions along the chromosome. Darker blue represents the frequency of the first allele while lighter blue represents the frequency of the second allele, black lines represent the median value in windows. (C) Proportion of the alleles in heterozygous SNP positions in chromosomes with longer surface molecule-encoding regions. (D) Proportion of the alleles in heterozygous SNP positions in chromosomes with shorter surface molecule-encoding regions. Blue points represent the proportion of the alleles in heterozygous SNP positions along the chromosome. Darker blue represents the frequency of the first allele while lighter blue represents the frequency of the second allele, black lines represent the median value in windows.
Figure 3—figure supplement 1
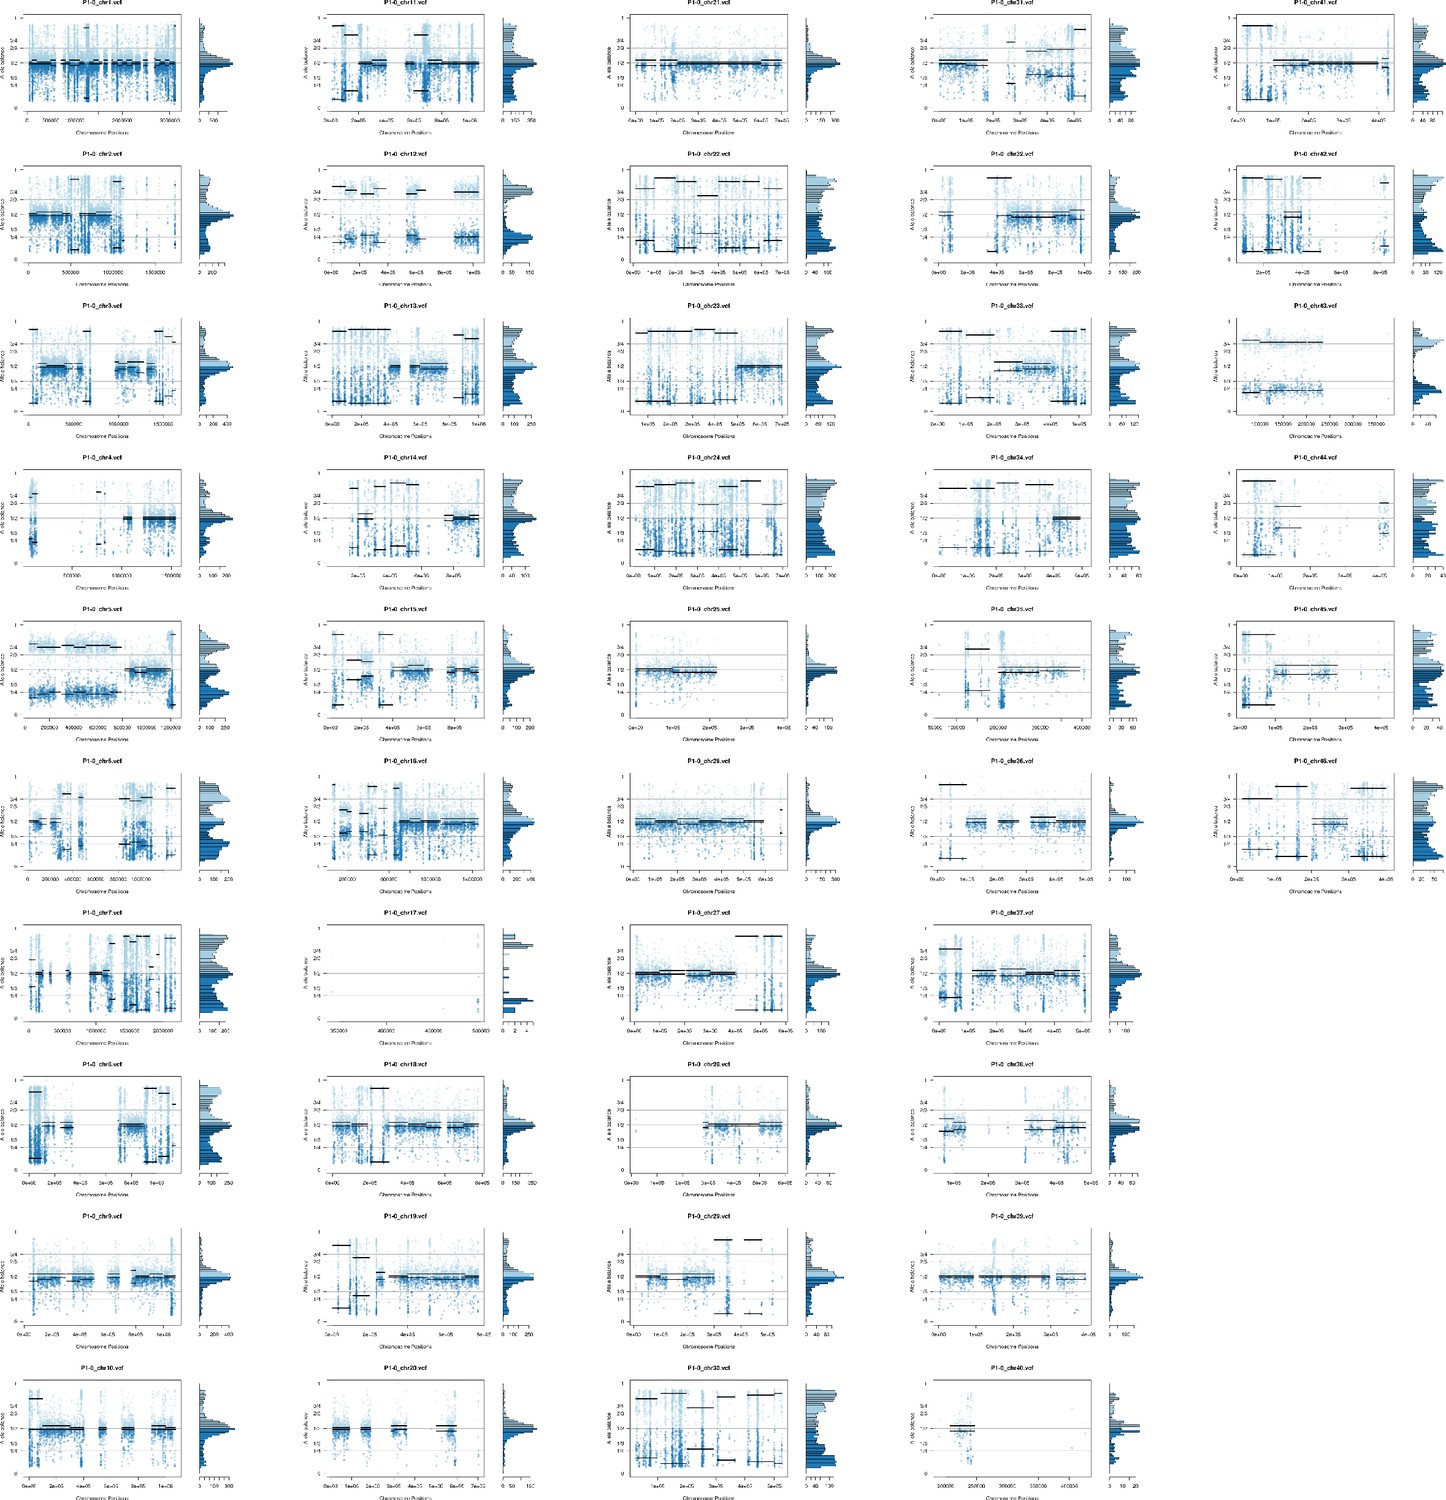
Somy estimation per chromosome based on allele balance (AB) in starting generation confirming aneuploidies in essentially diploid P1.
Figure 3—figure supplement 2
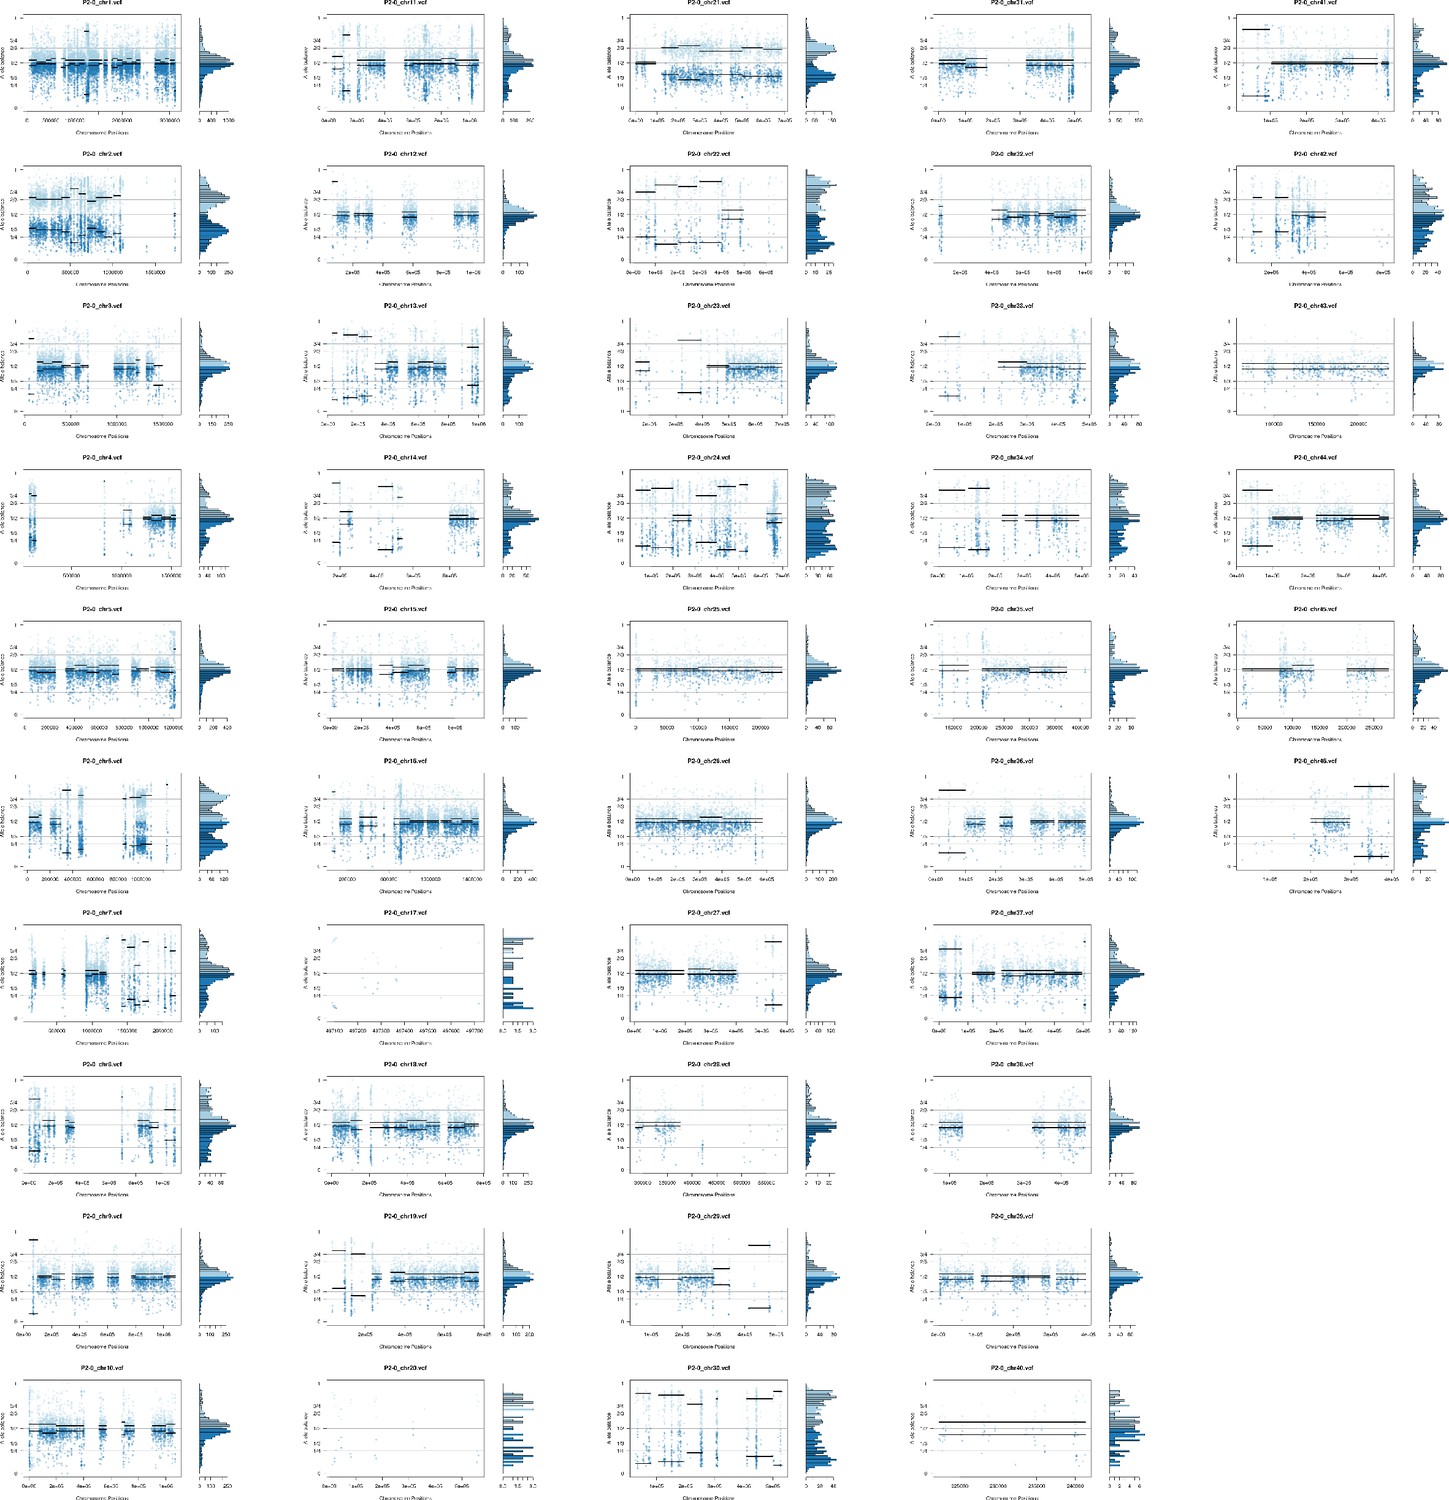
Somy estimation per chromosome based on allele balance (AB) in starting generation confirming aneuploidies in essentially diploid P2.
Figure 3—figure supplement 3
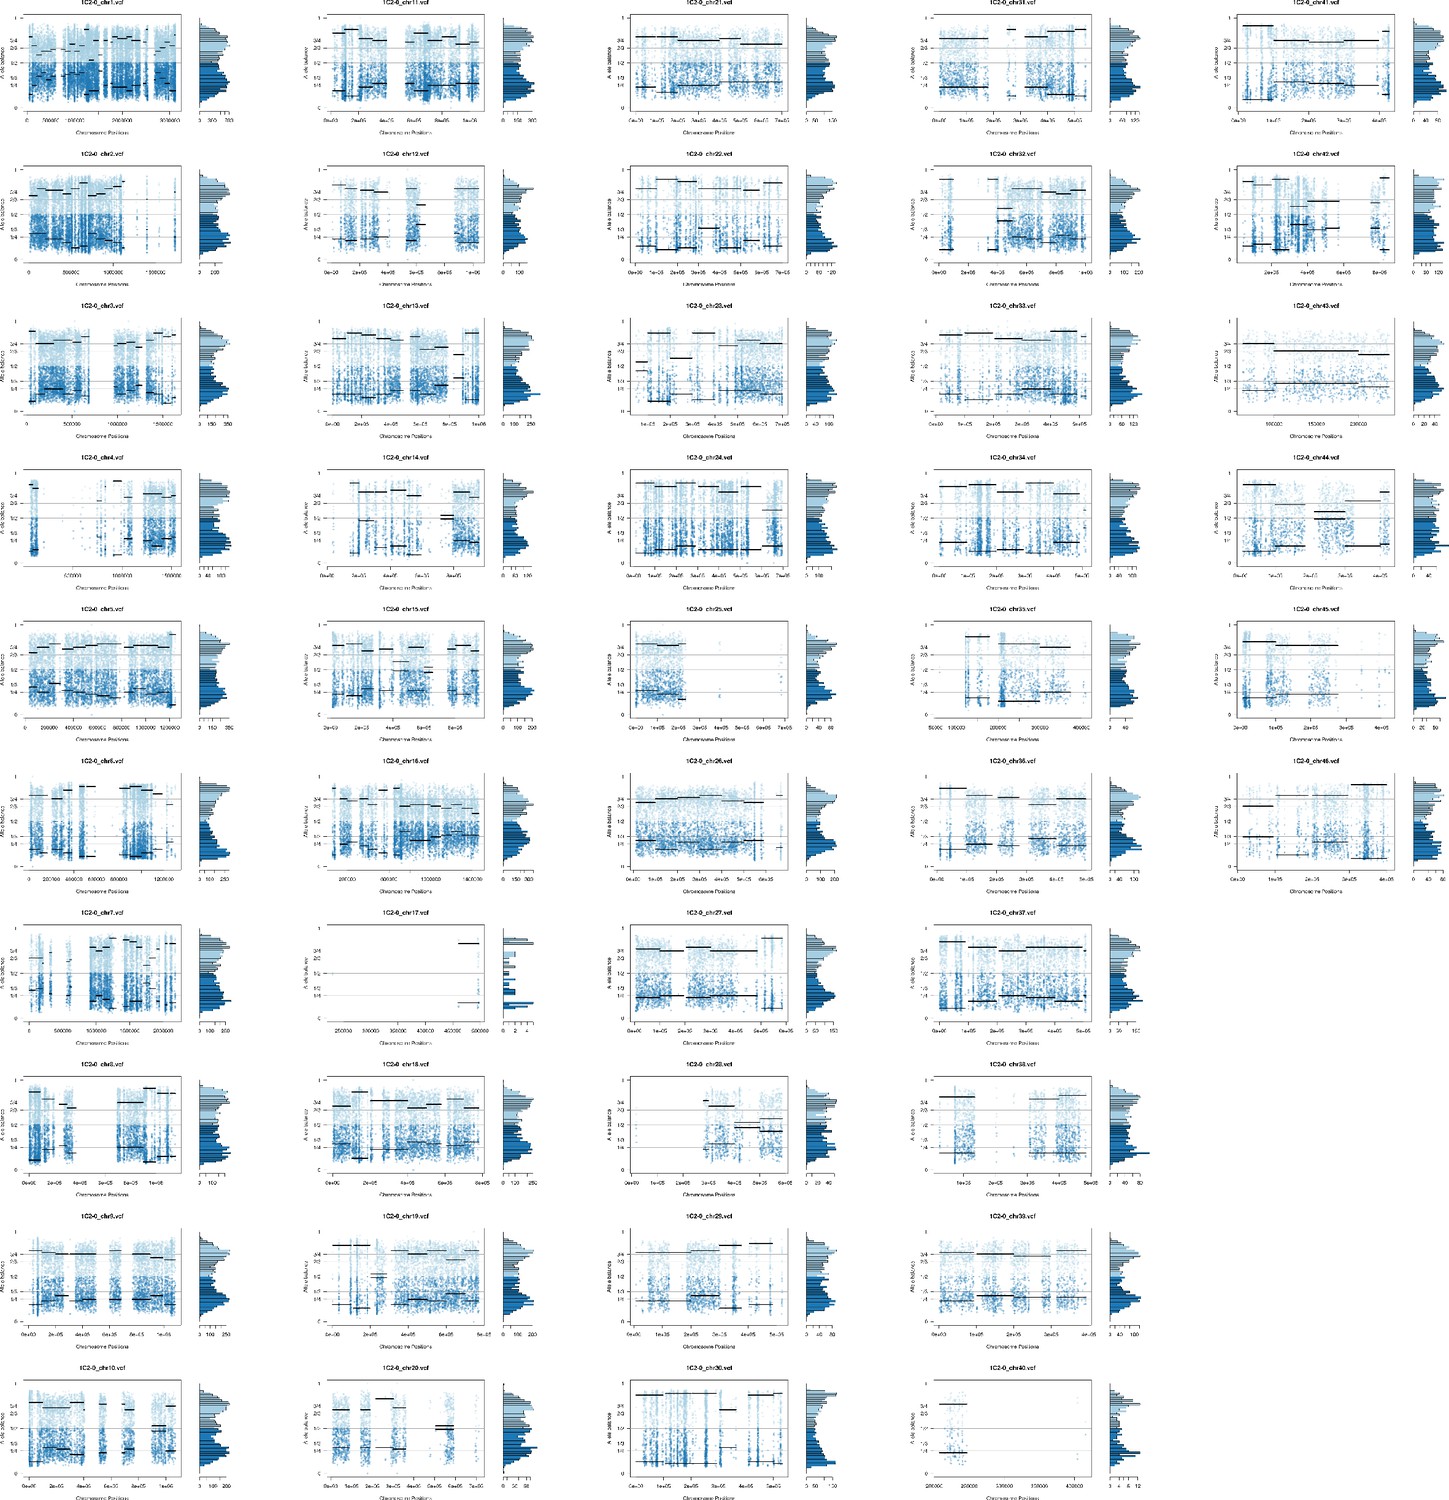
Somy estimation per chromosome based on allele balance (AB) in starting generation confirming tetrasomic chromosomes in hybrid 1C2.
Figure 3—figure supplement 4
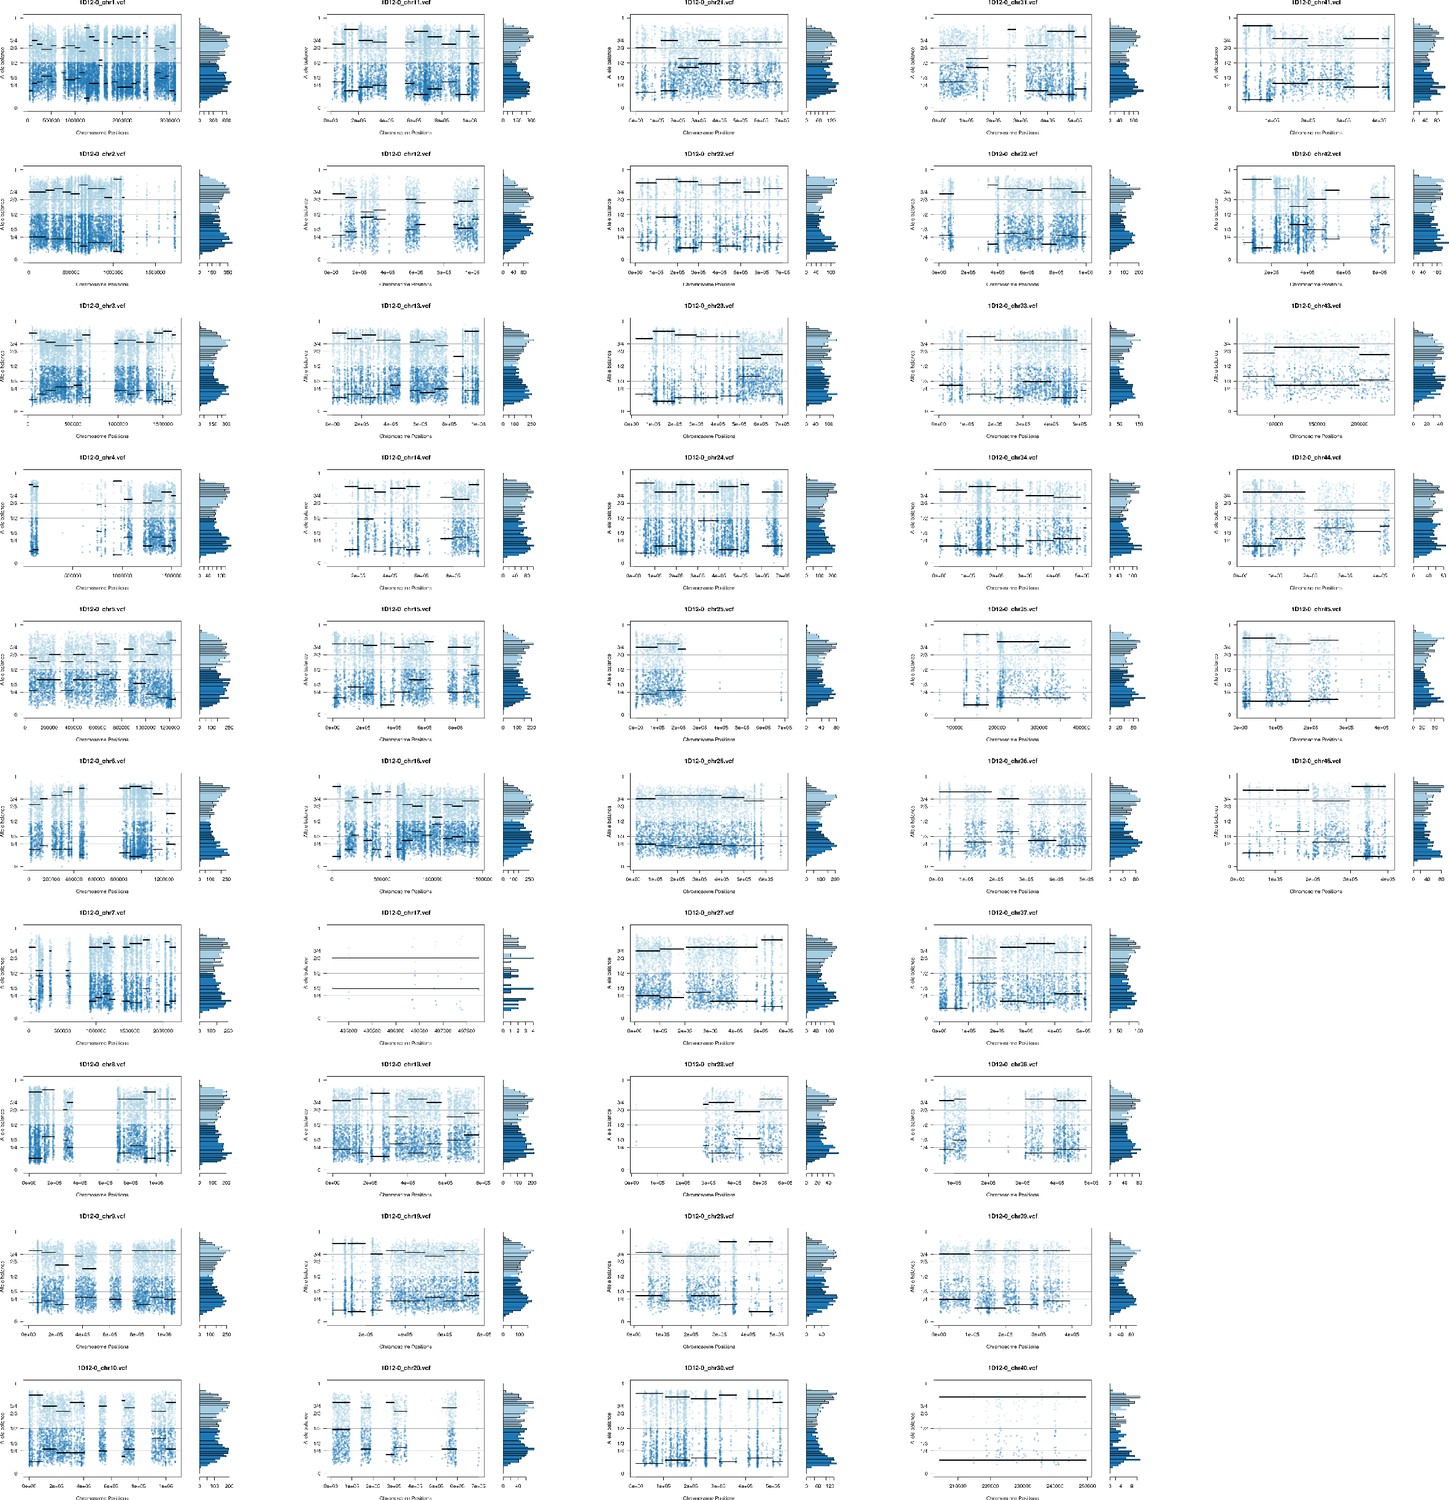
Somy estimation per chromosome based on allele balance (AB) in starting generation confirming tetrasomic chromosomes in hybrid 1D12.
Figure 3—figure supplement 5
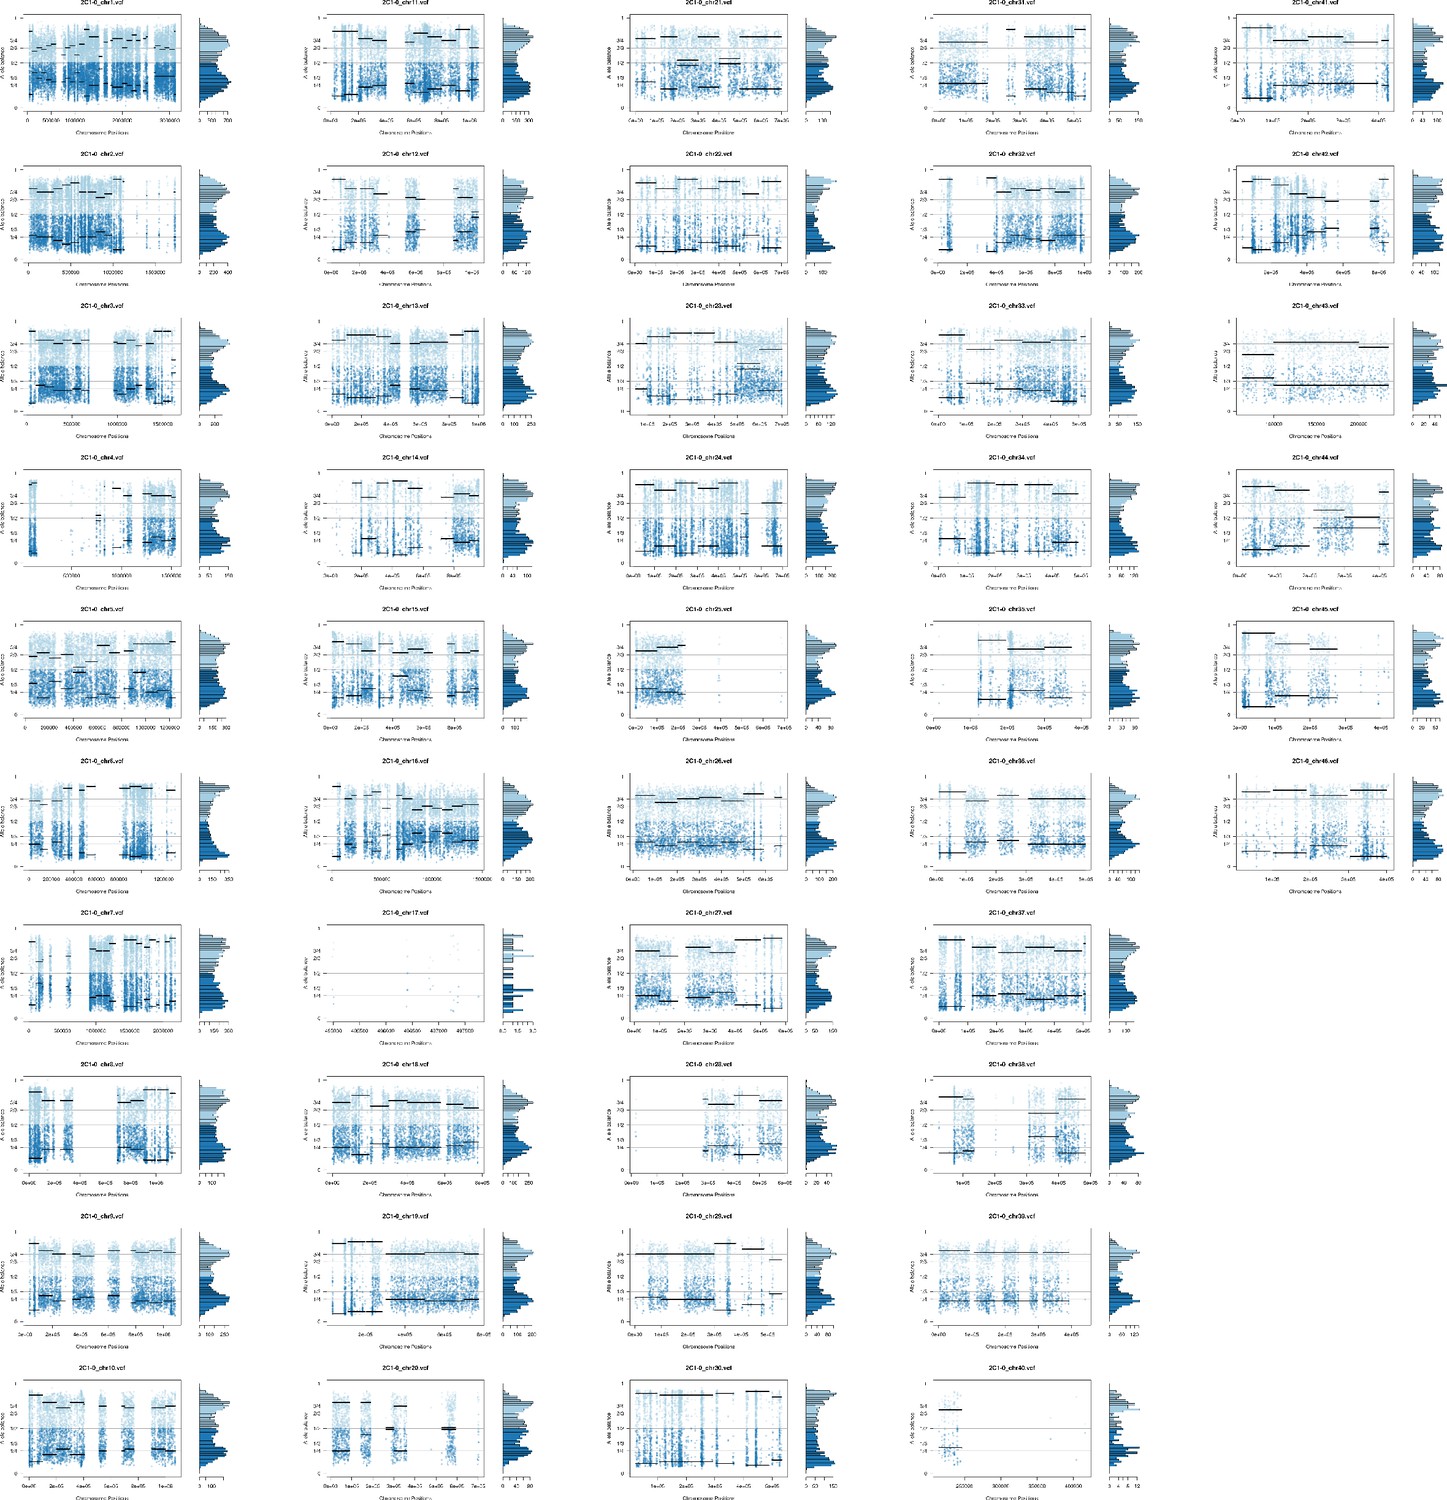
Somy estimation per chromosome based on allele balance (AB) in starting generation confirming tetrasomic chromosomes in hybrid 2C1.
Figure 4

Somy estimation based on read depth coverage (RDC) and allele balance (AB) reveals novel aneuploidies and a shift in hybrid strains ploidy after 800 generations in in vitro culture.
(A) Aneuploidy analysis based on RDC among the 47 chromosomes in all clones after culture growth. (B) Proportion of the alleles in heterozygous SNP positions in chromosomes showing aneuploidies in all parental or hybrid clones. (C) Comparison of somy estimation based on the proportion of the alleles in heterozygous SNP positions of single-copy genes. First generation is presented in shaded blue, while the 800 generation is presented in orange.
Figure 5 with 15 supplements
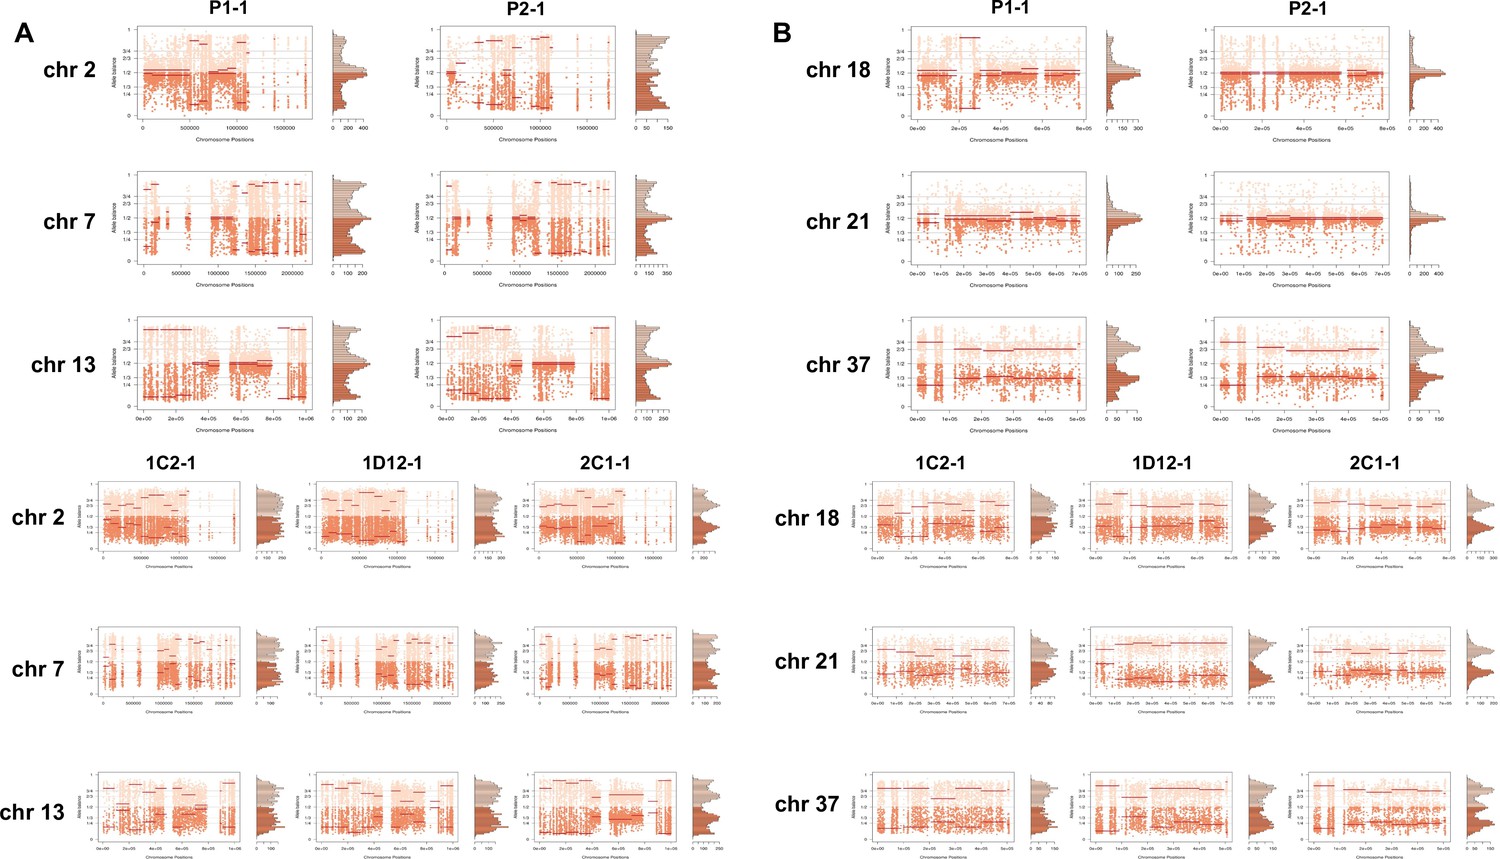
Somy estimation confirming novel aneuploidies after in vitro culture.
(A) Proportion of the alleles in heterozygous SNP positions in chromosomes with longer surface molecule-encoding regions. (B) Proportion of the alleles in heterozygous SNP positions in chromosomes with shorter surface molecule-encoding regions. Points represent the proportion of the alleles in heterozygous SNP positions along the chromosome.
Figure 5—figure supplement 1

Somy estimation per chromosome based on allele balance (AB) confirming novel aneuploidies after in vitro culture in the essentially diploid replicate P1-1.
Figure 5—figure supplement 2
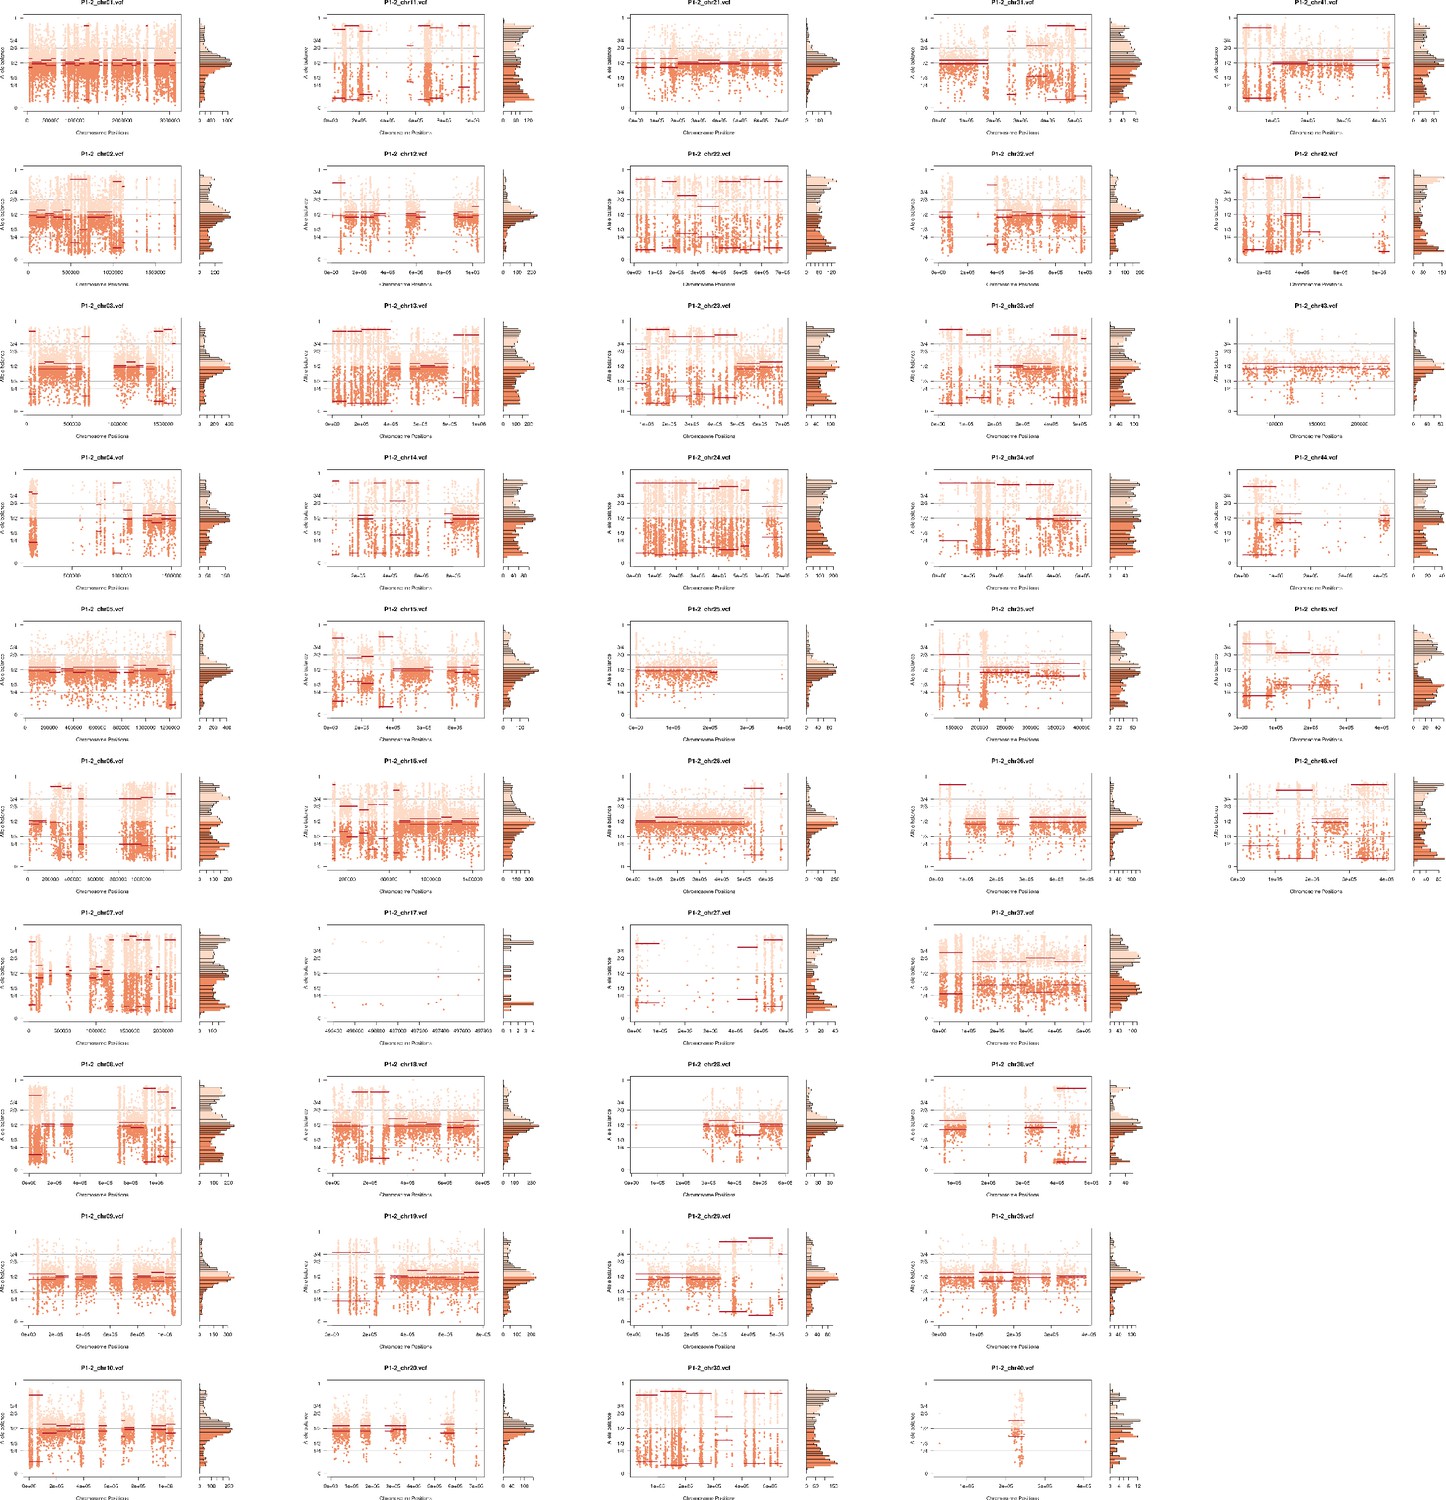
Somy estimation per chromosome based on allele balance (AB) confirming novel aneuploidies after in vitro culture in the essentially diploid replicate P1-2.
Figure 5—figure supplement 3
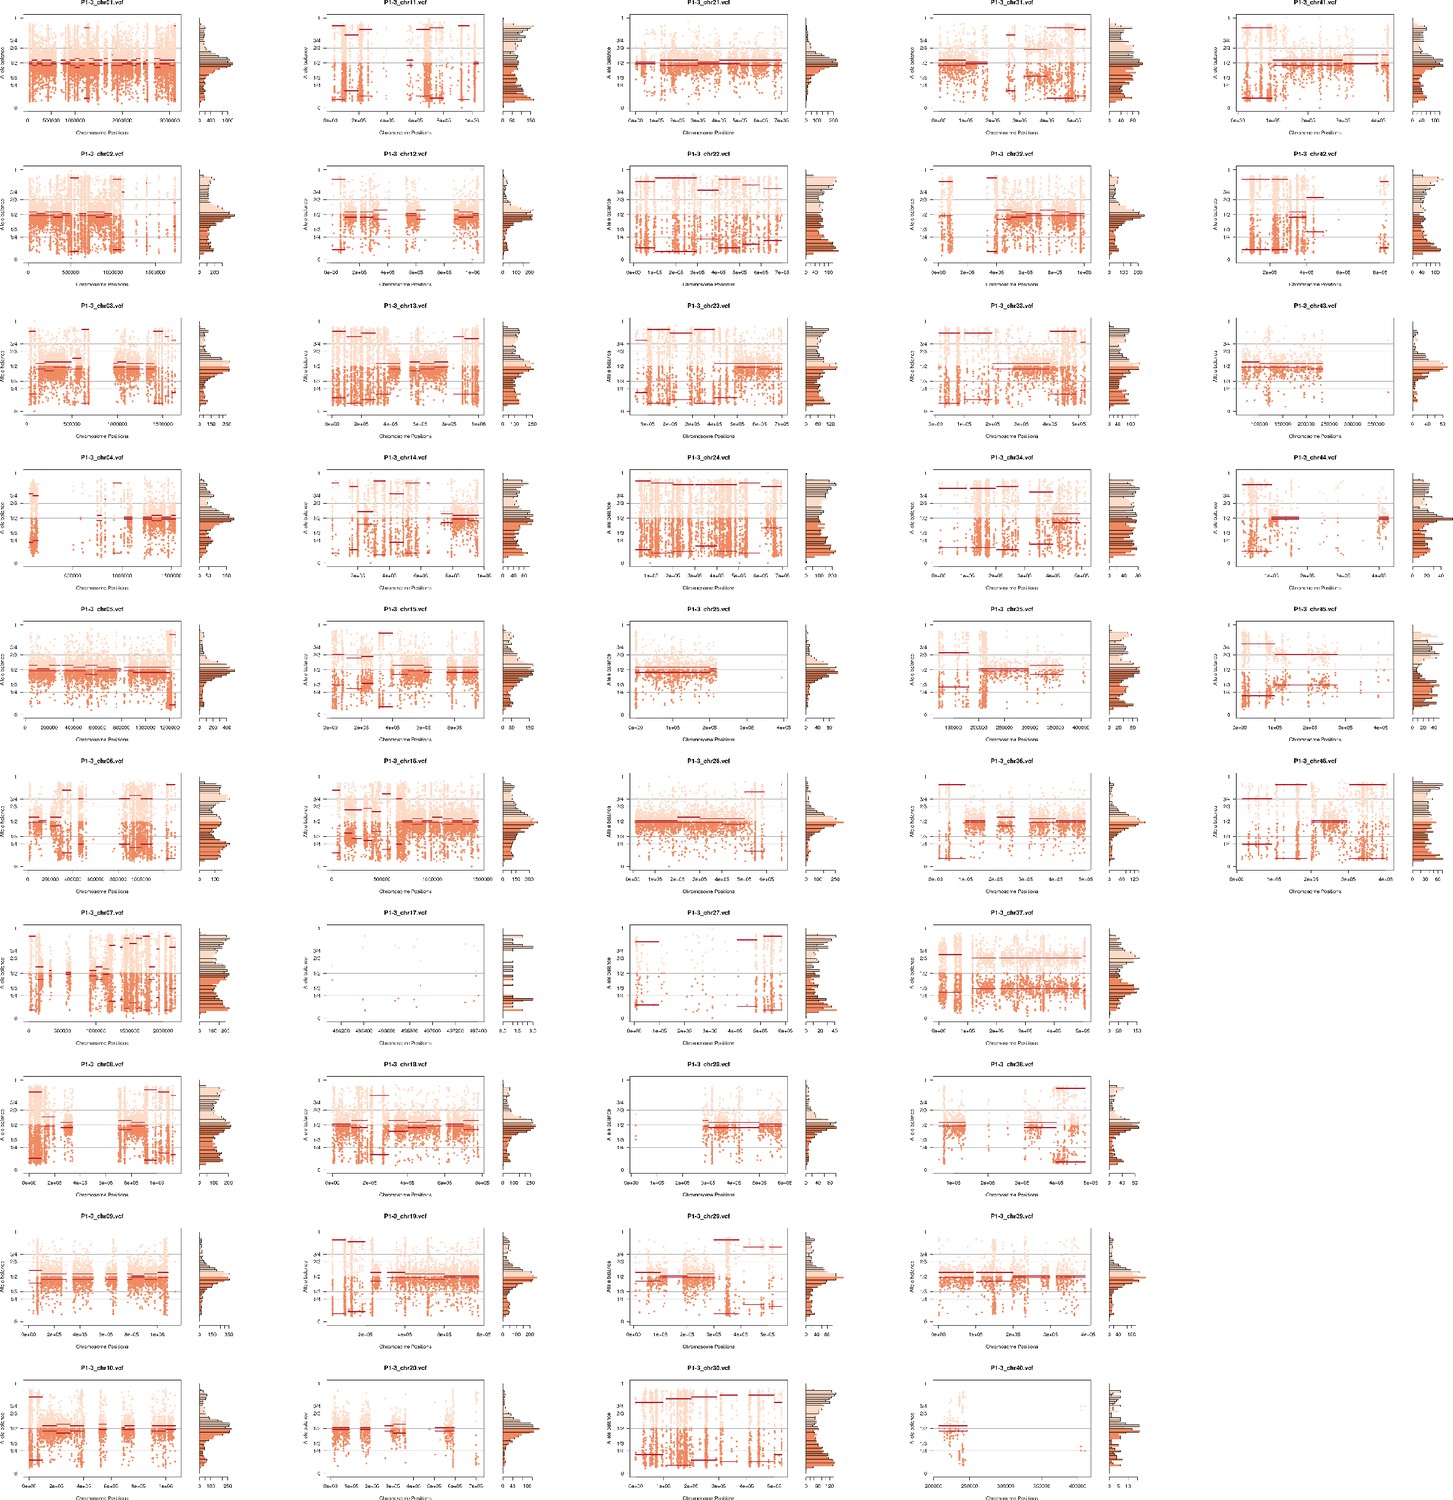
Somy estimation per chromosome based on allele balance (AB) confirming novel aneuploidies after in vitro culture in the essentially diploid replicate P1-3.
Figure 5—figure supplement 4
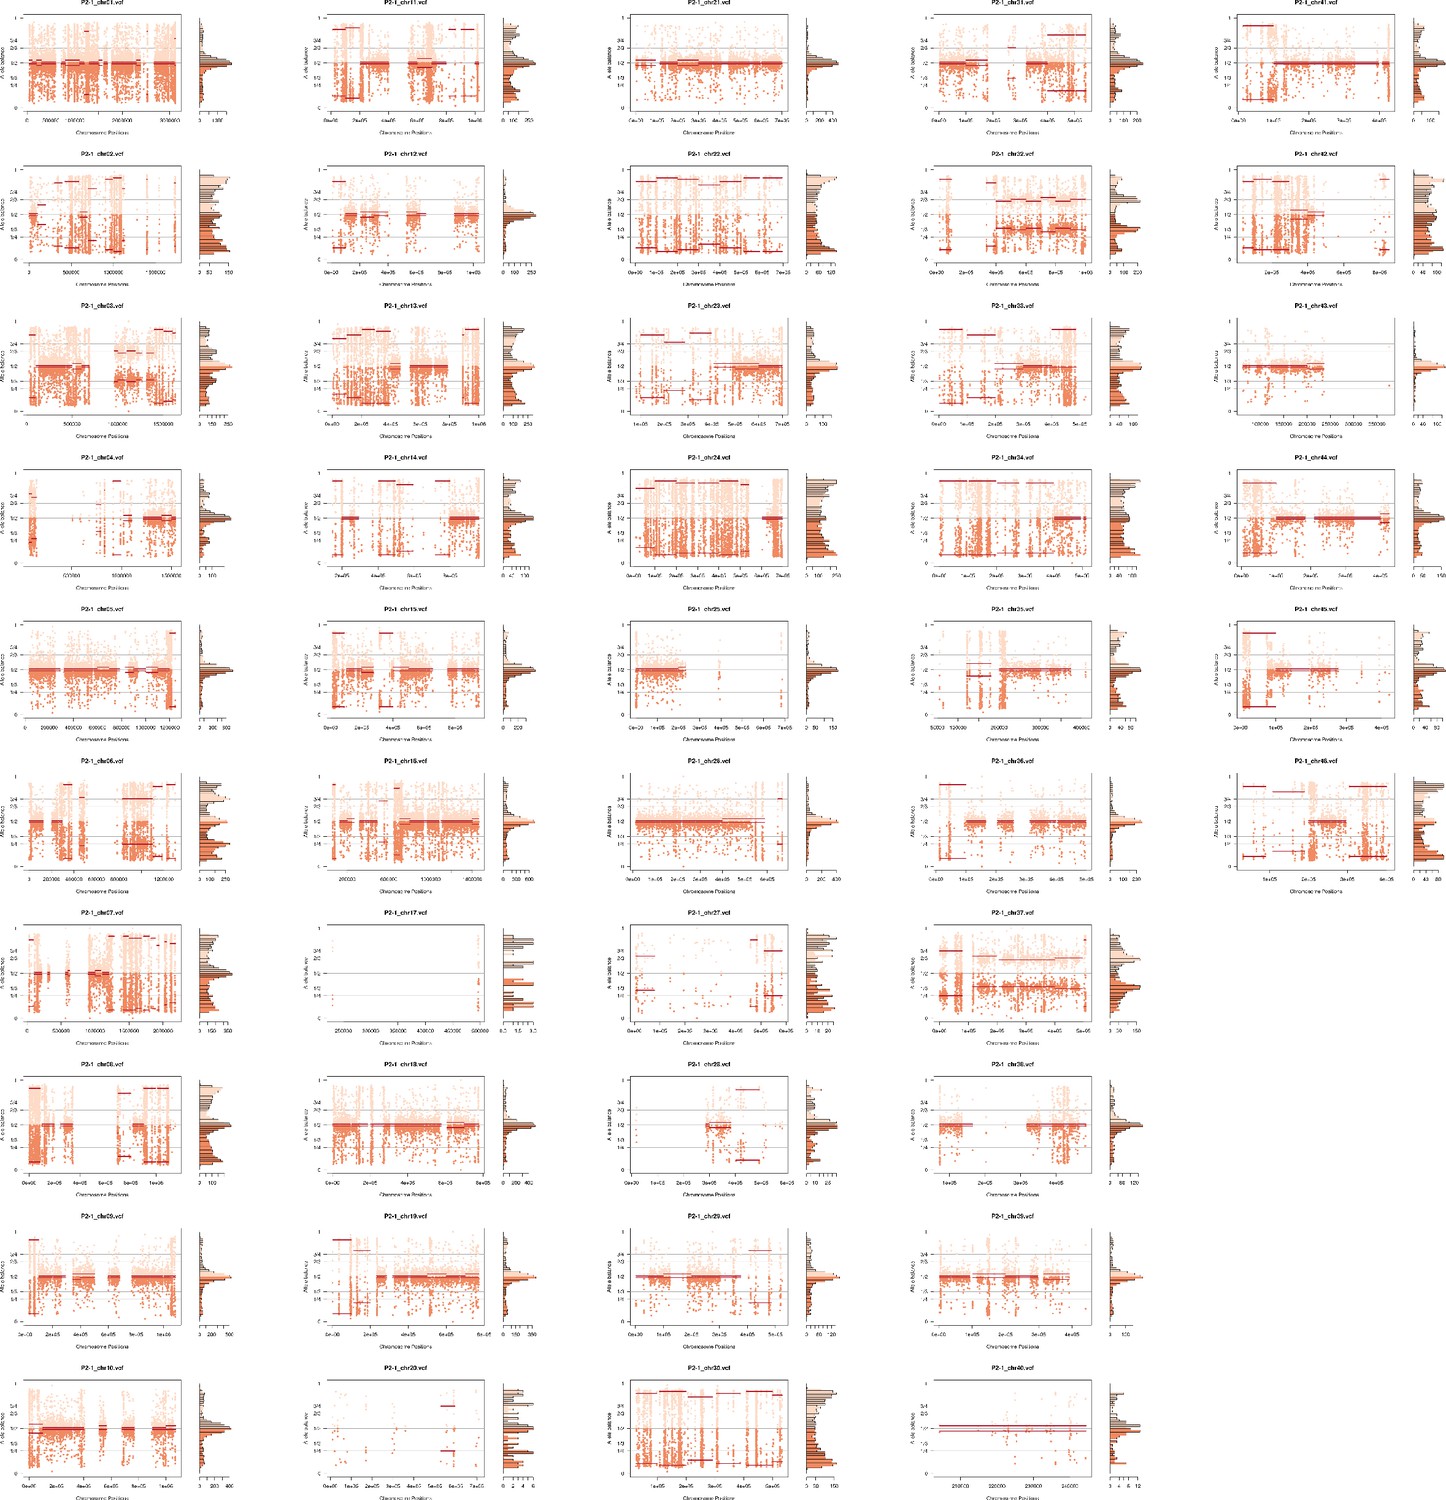
Somy estimation per chromosome based on allele balance (AB) confirming novel aneuploidies after in vitro culture in the essentially diploid replicate P2-1.
Figure 5—figure supplement 5
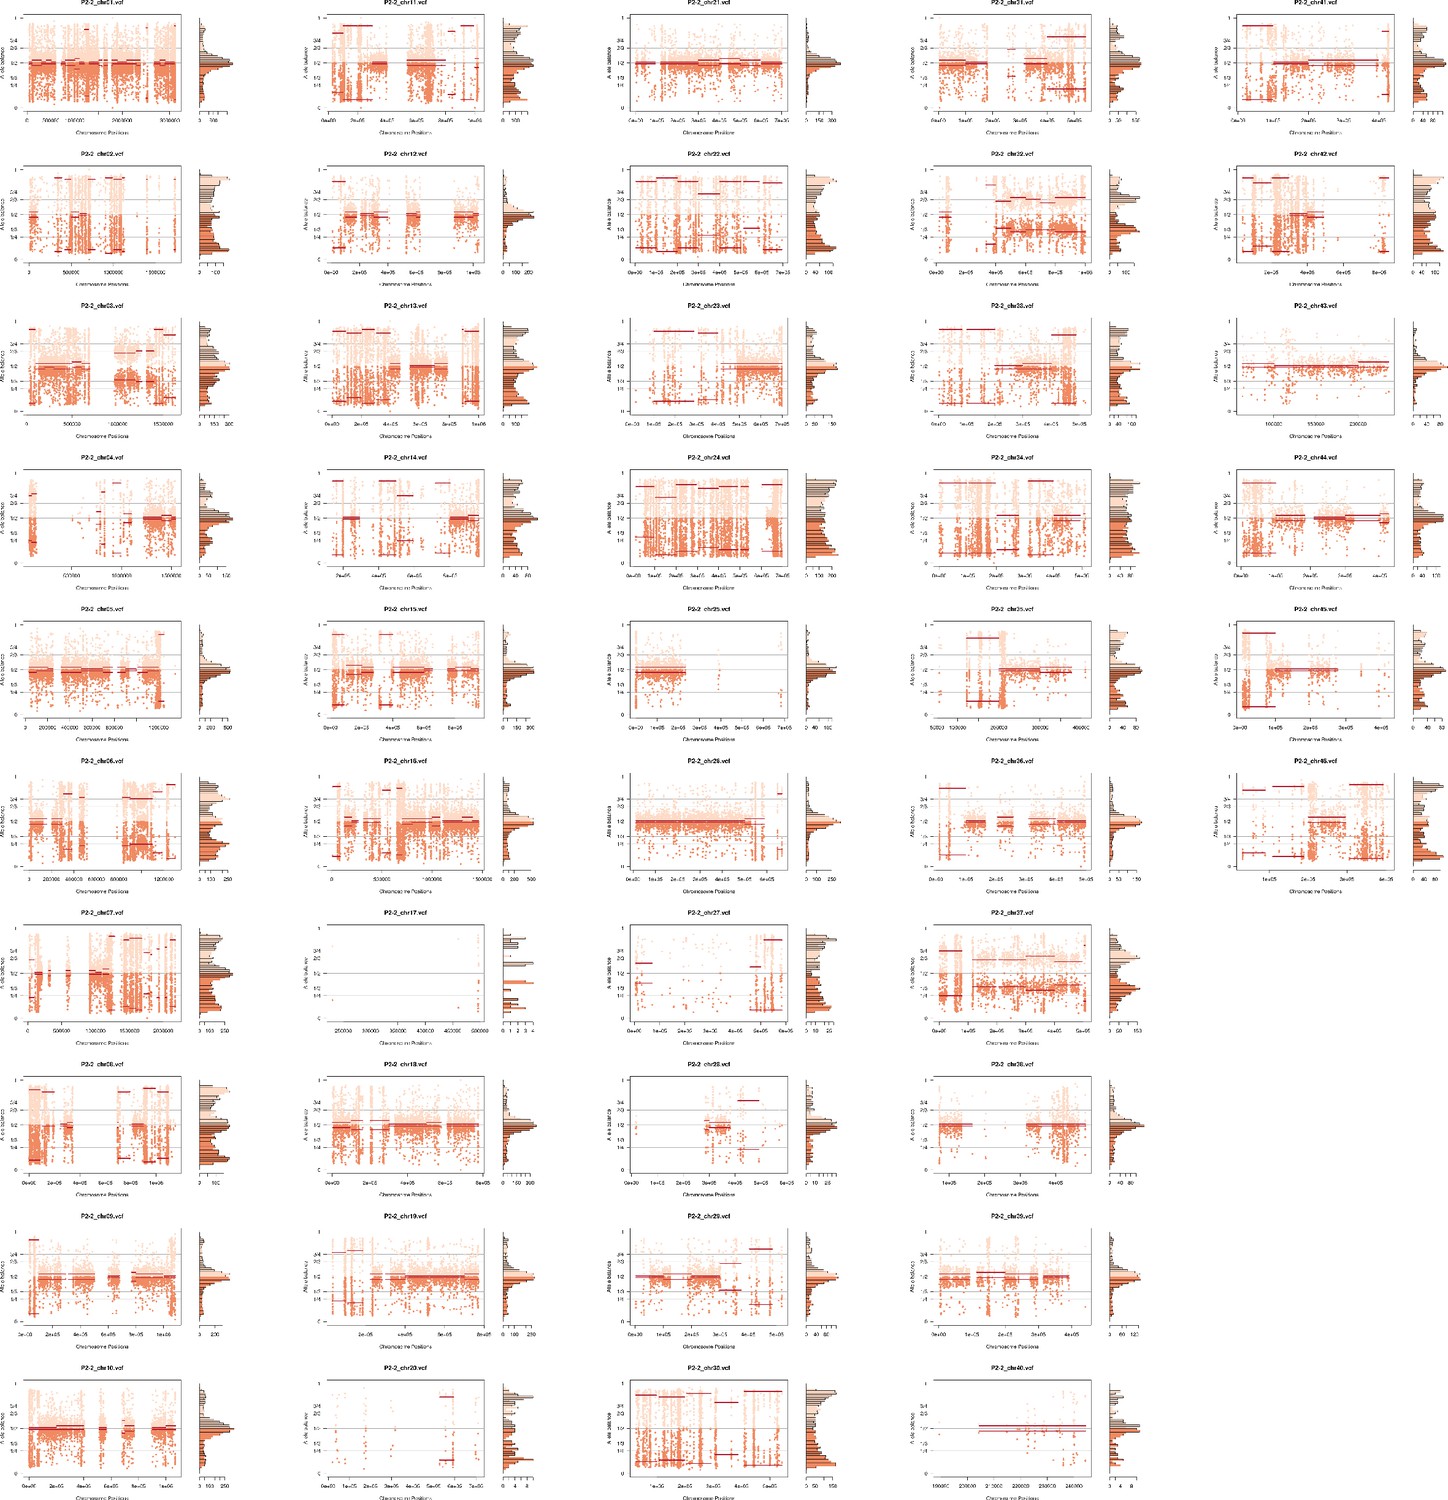
Somy estimation per chromosome based on allele balance (AB) confirming novel aneuploidies after in vitro culture in the essentially diploid replicate P2-2.
Figure 5—figure supplement 6
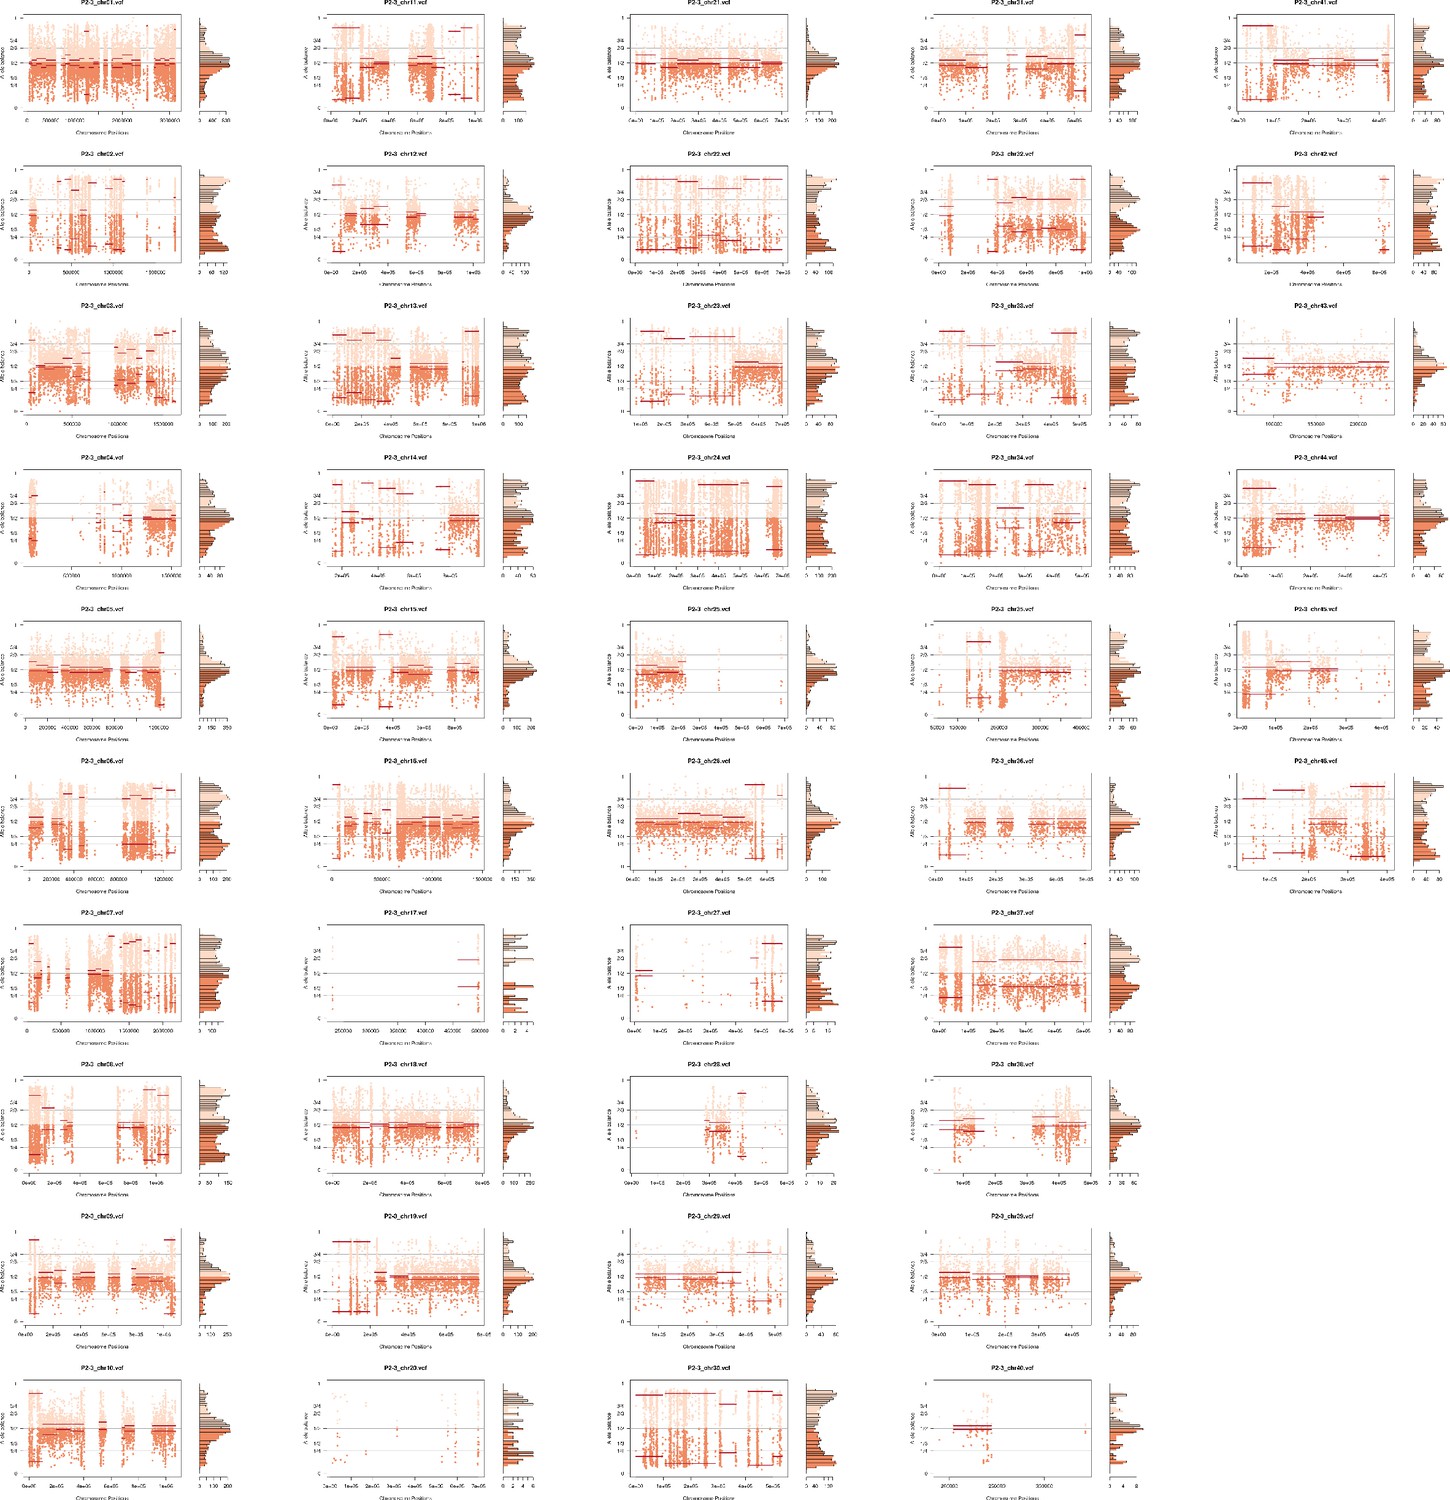
Somy estimation per chromosome based on allele balance (AB) confirming novel aneuploidies after in vitro culture in the essentially diploid replicate P2-3.
Figure 5—figure supplement 7
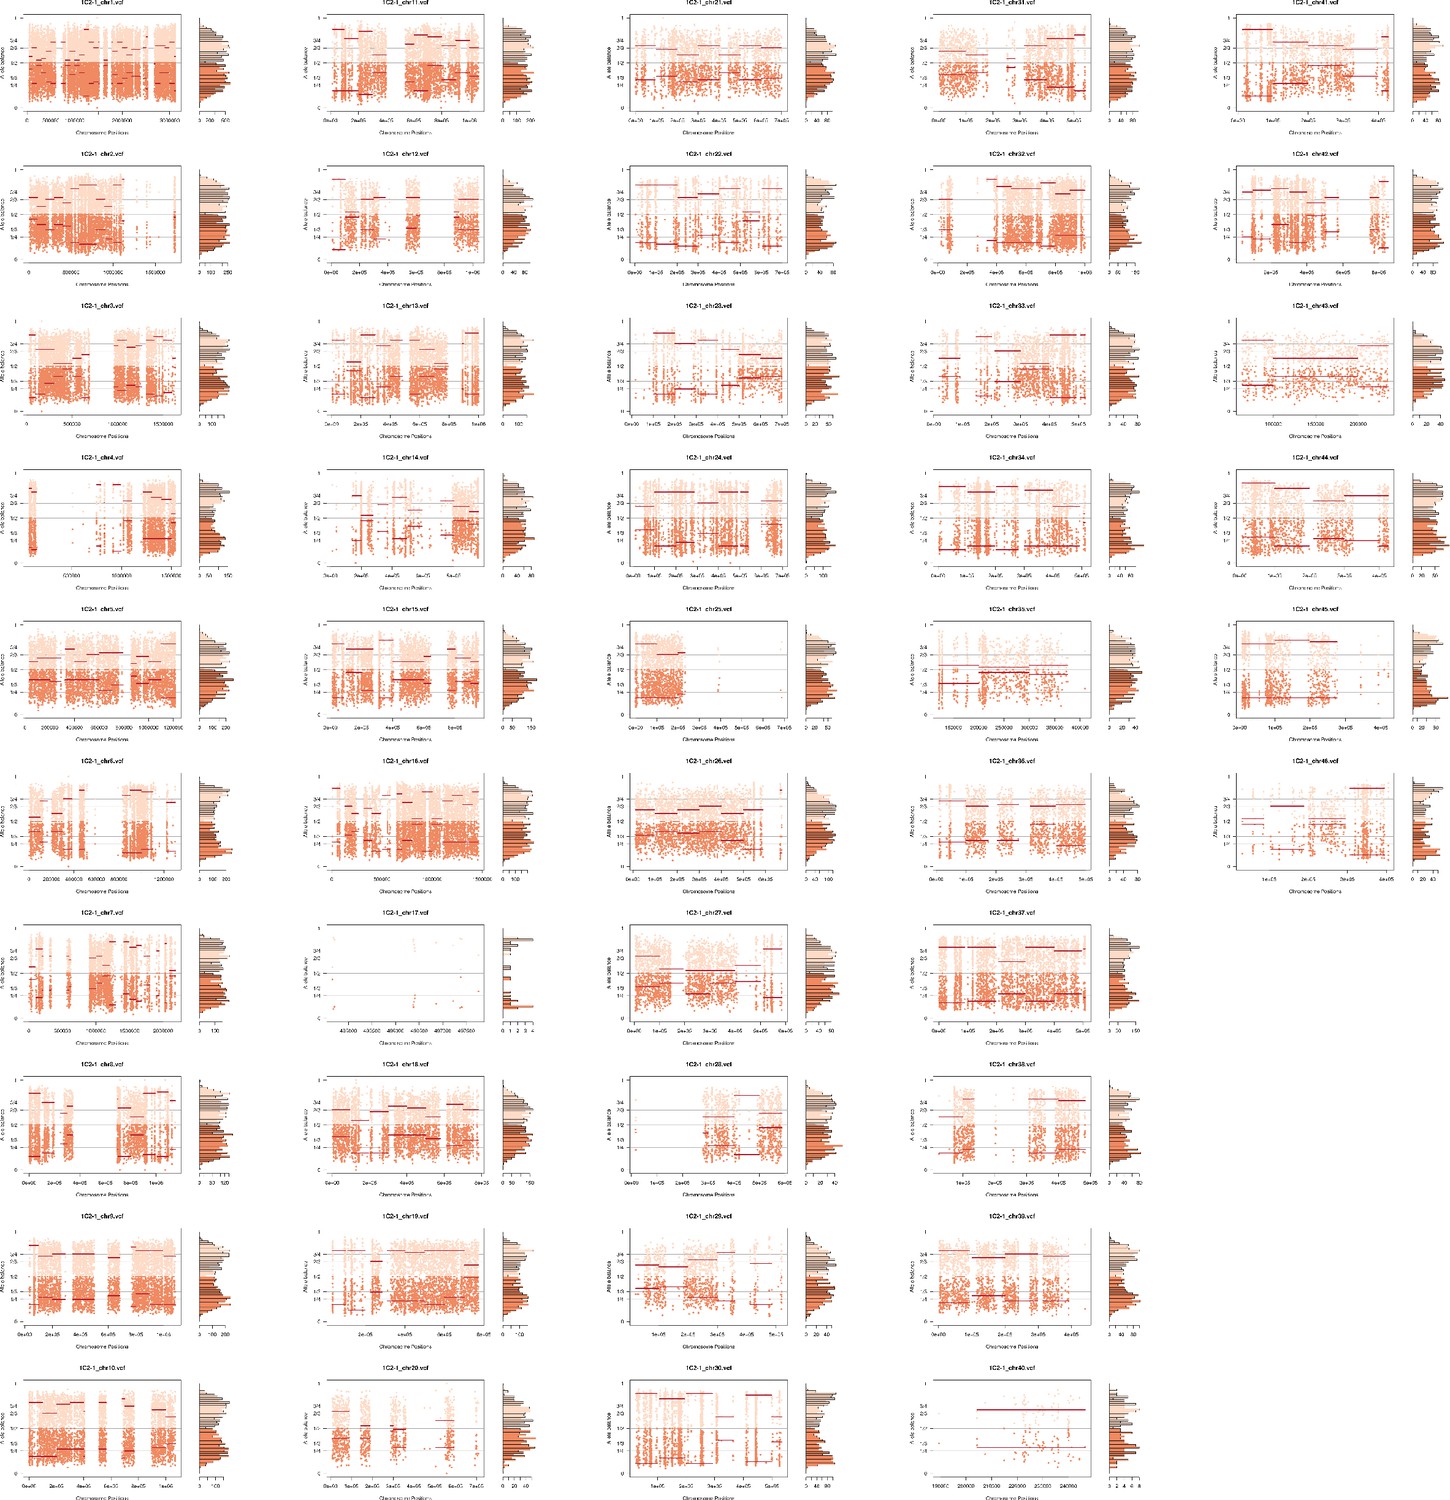
Somy estimation per chromosome based on allele balance (AB) confirming trisomic and tetrasomic chromosomes after in vitro culture in replicate 1C2-1.
Figure 5—figure supplement 8
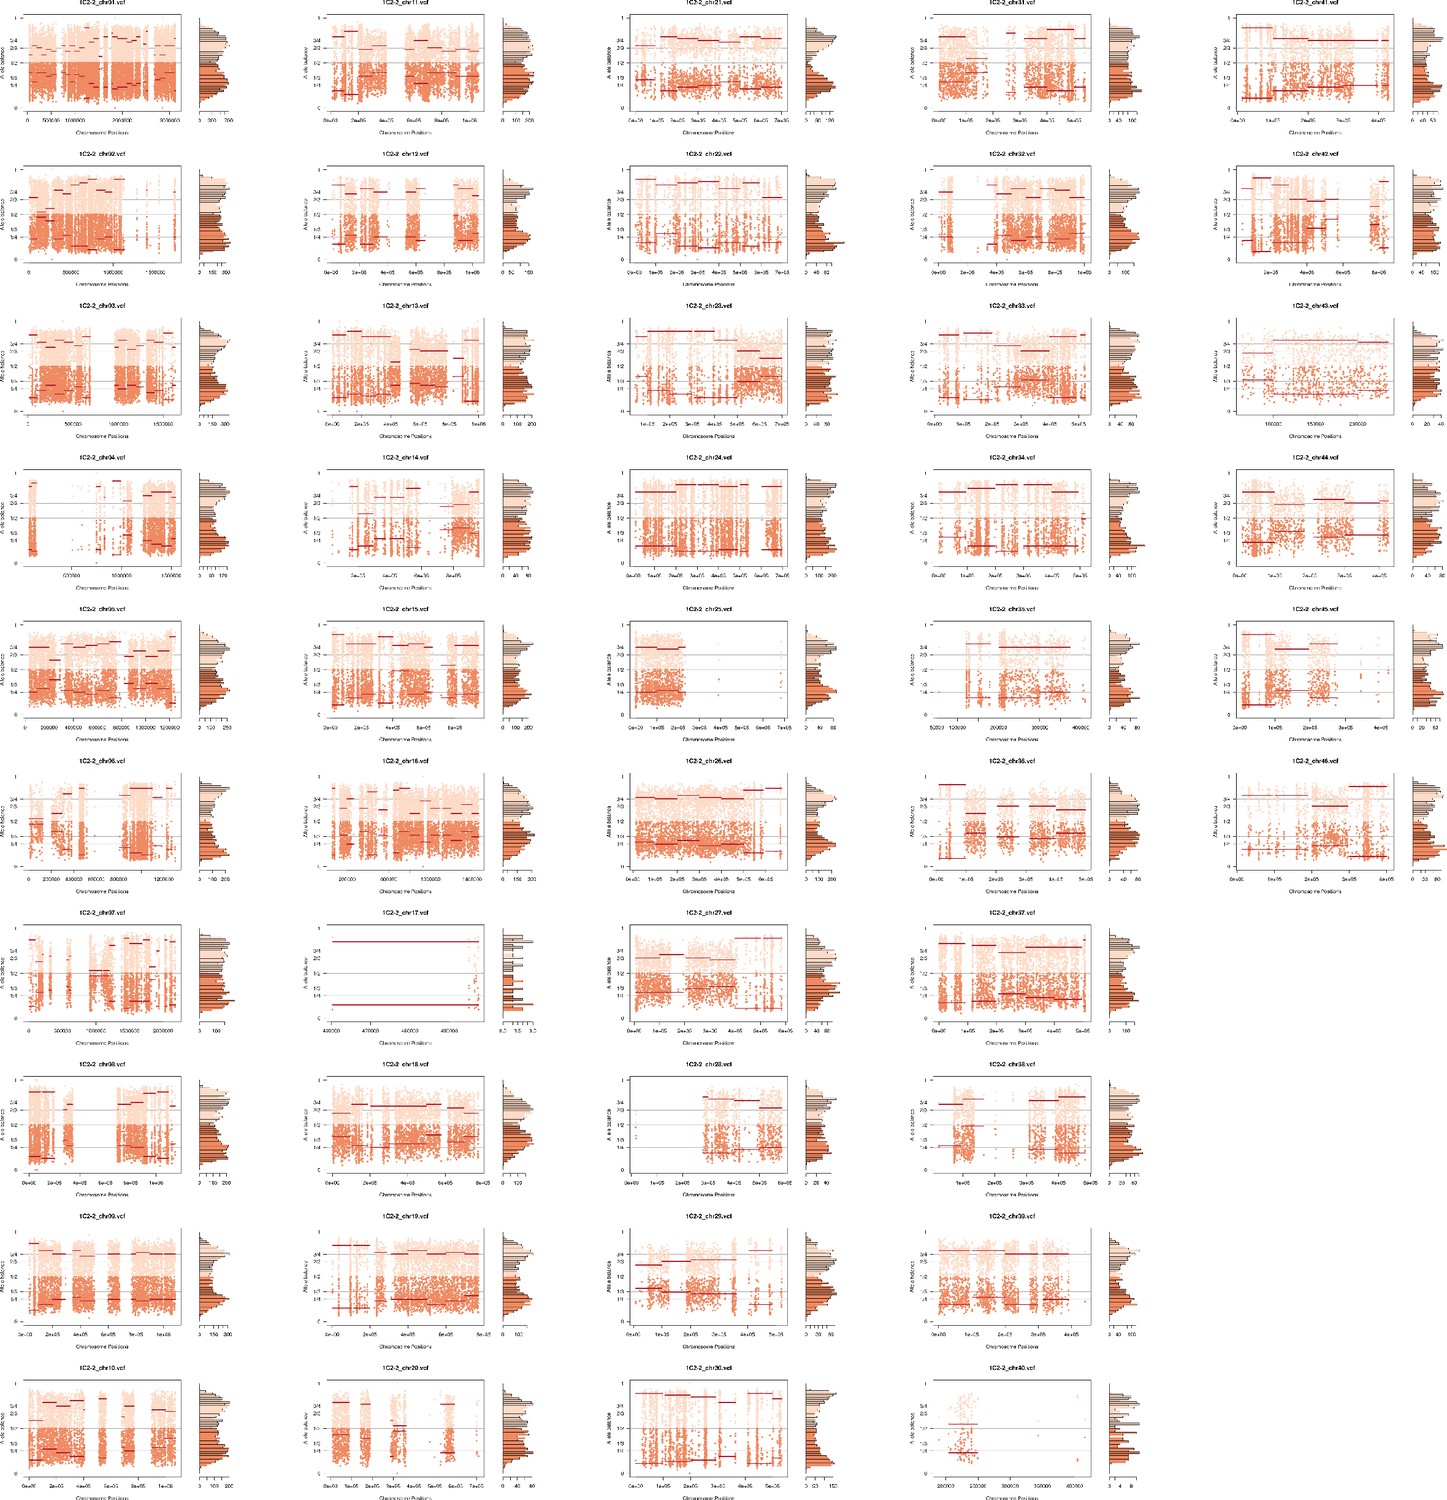
Somy estimation per chromosome based on allele balance (AB) confirming trisomic and tetrasomic chromosomes after in vitro culture in replicate 1C2-2.
Figure 5—figure supplement 9
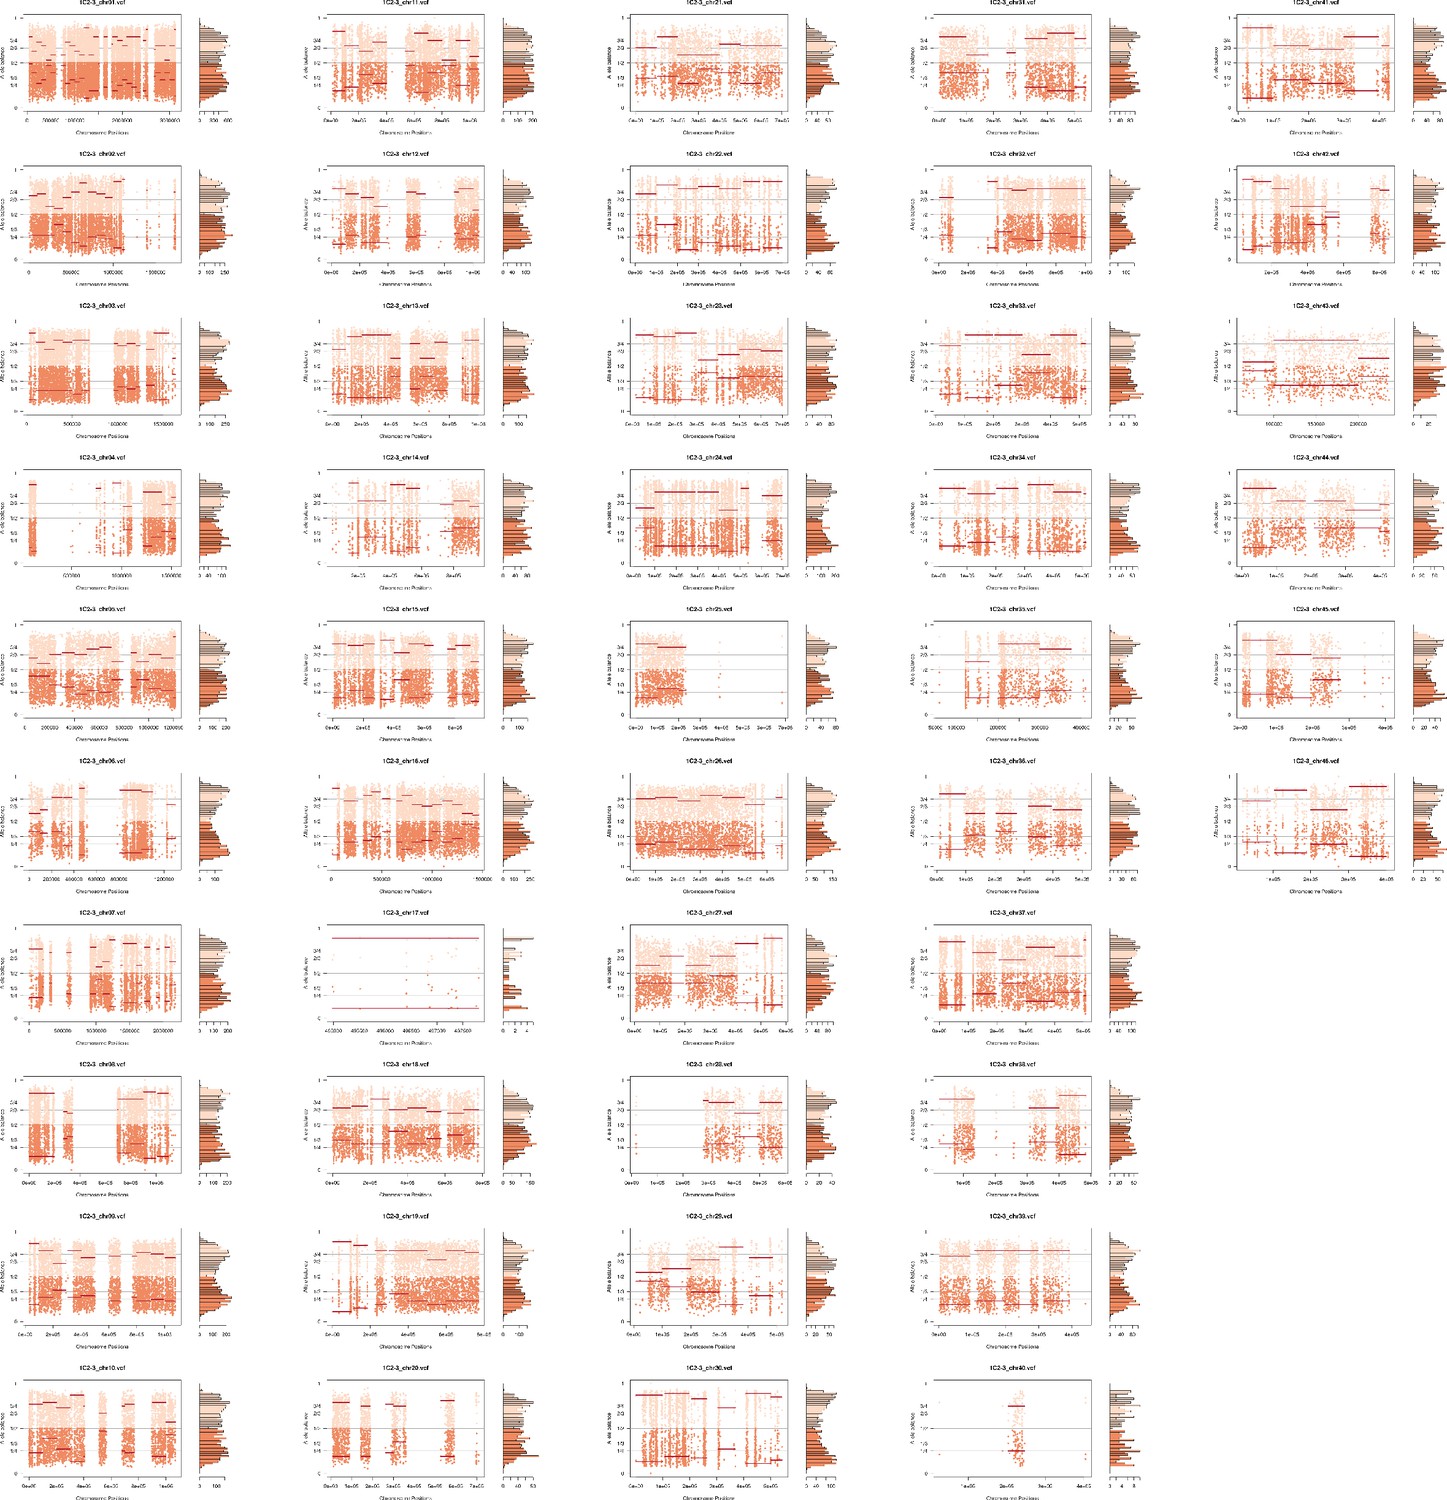
Somy estimation per chromosome based on allele balance (AB) confirming trisomic and tetrasomic chromosomes after in vitro culture in replicate 1C2-3.
Figure 5—figure supplement 10
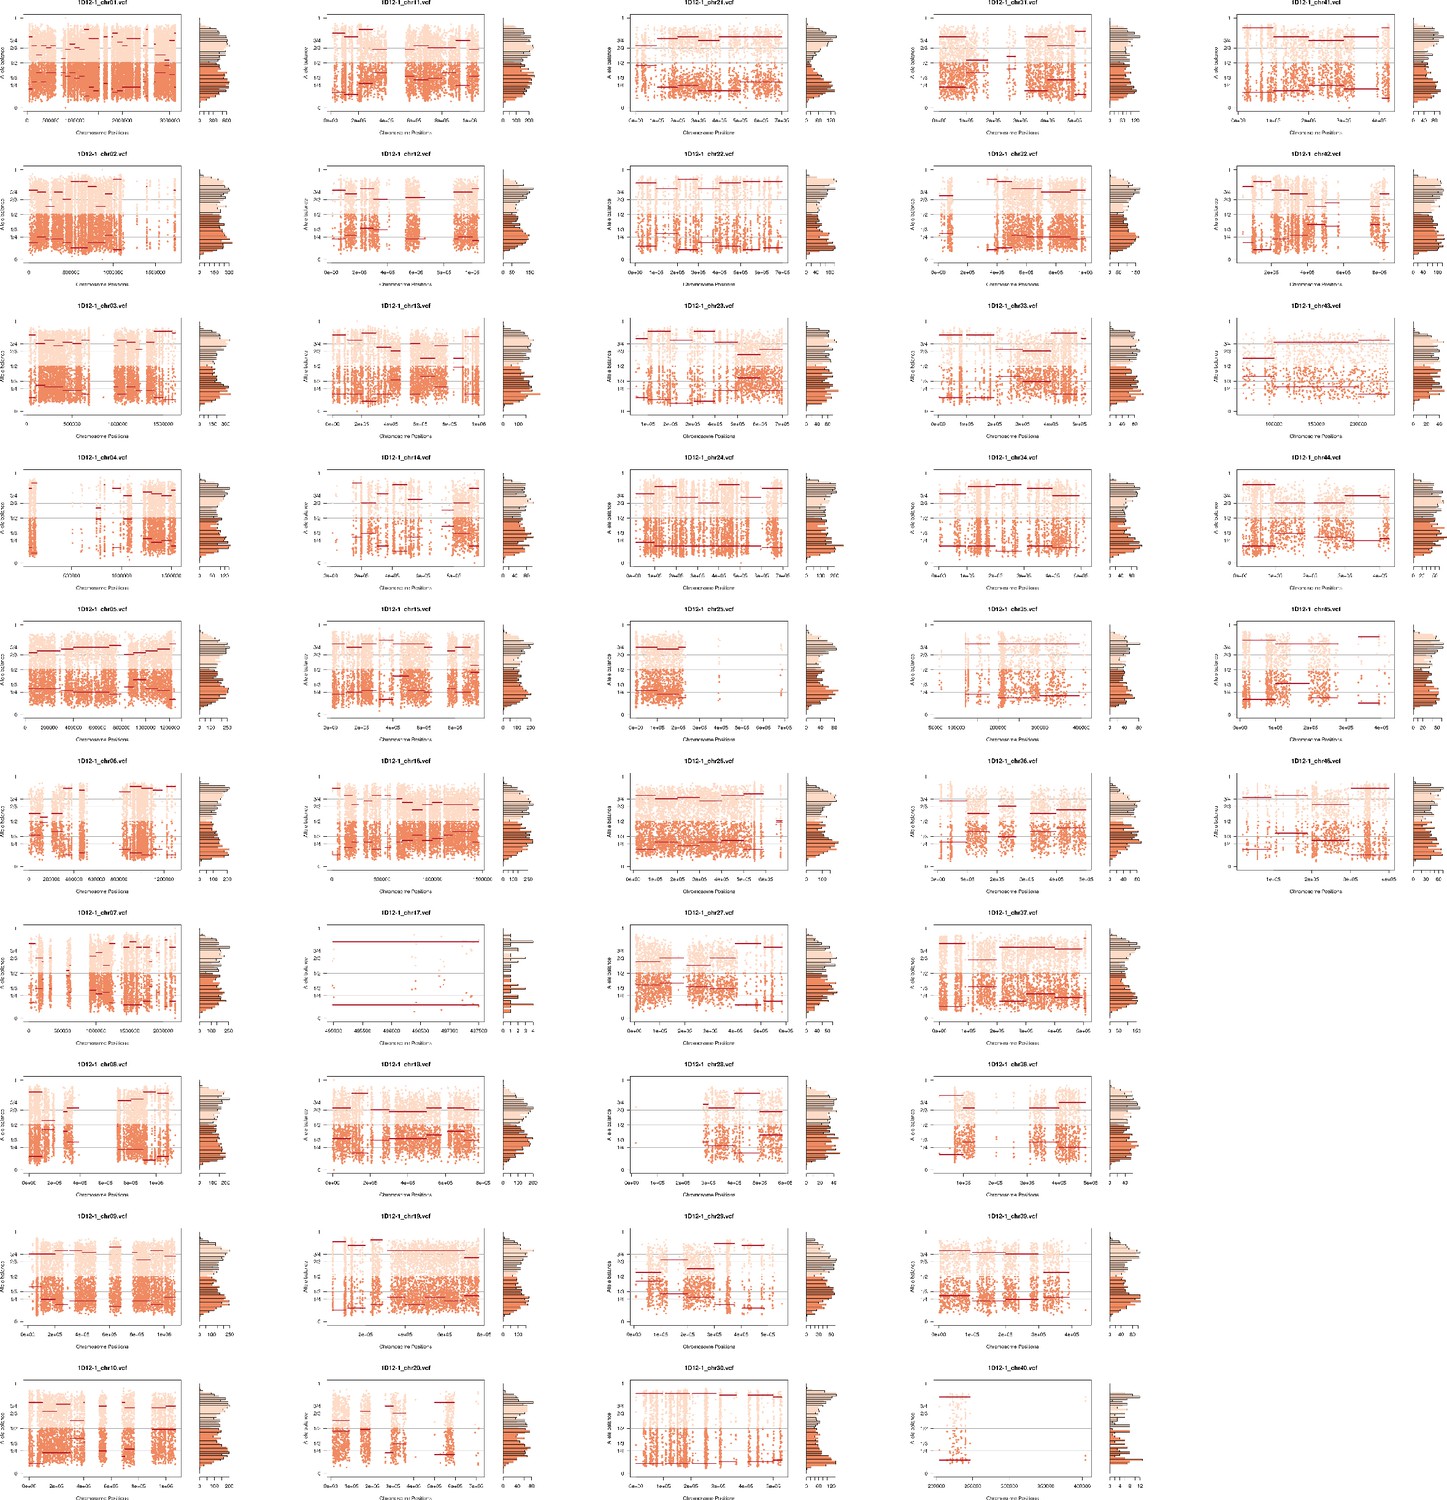
Somy estimation per chromosome based on allele balance (AB) confirming trisomic and tetrasomic chromosomes after in vitro culture in replicate 1D12-1.
Figure 5—figure supplement 11
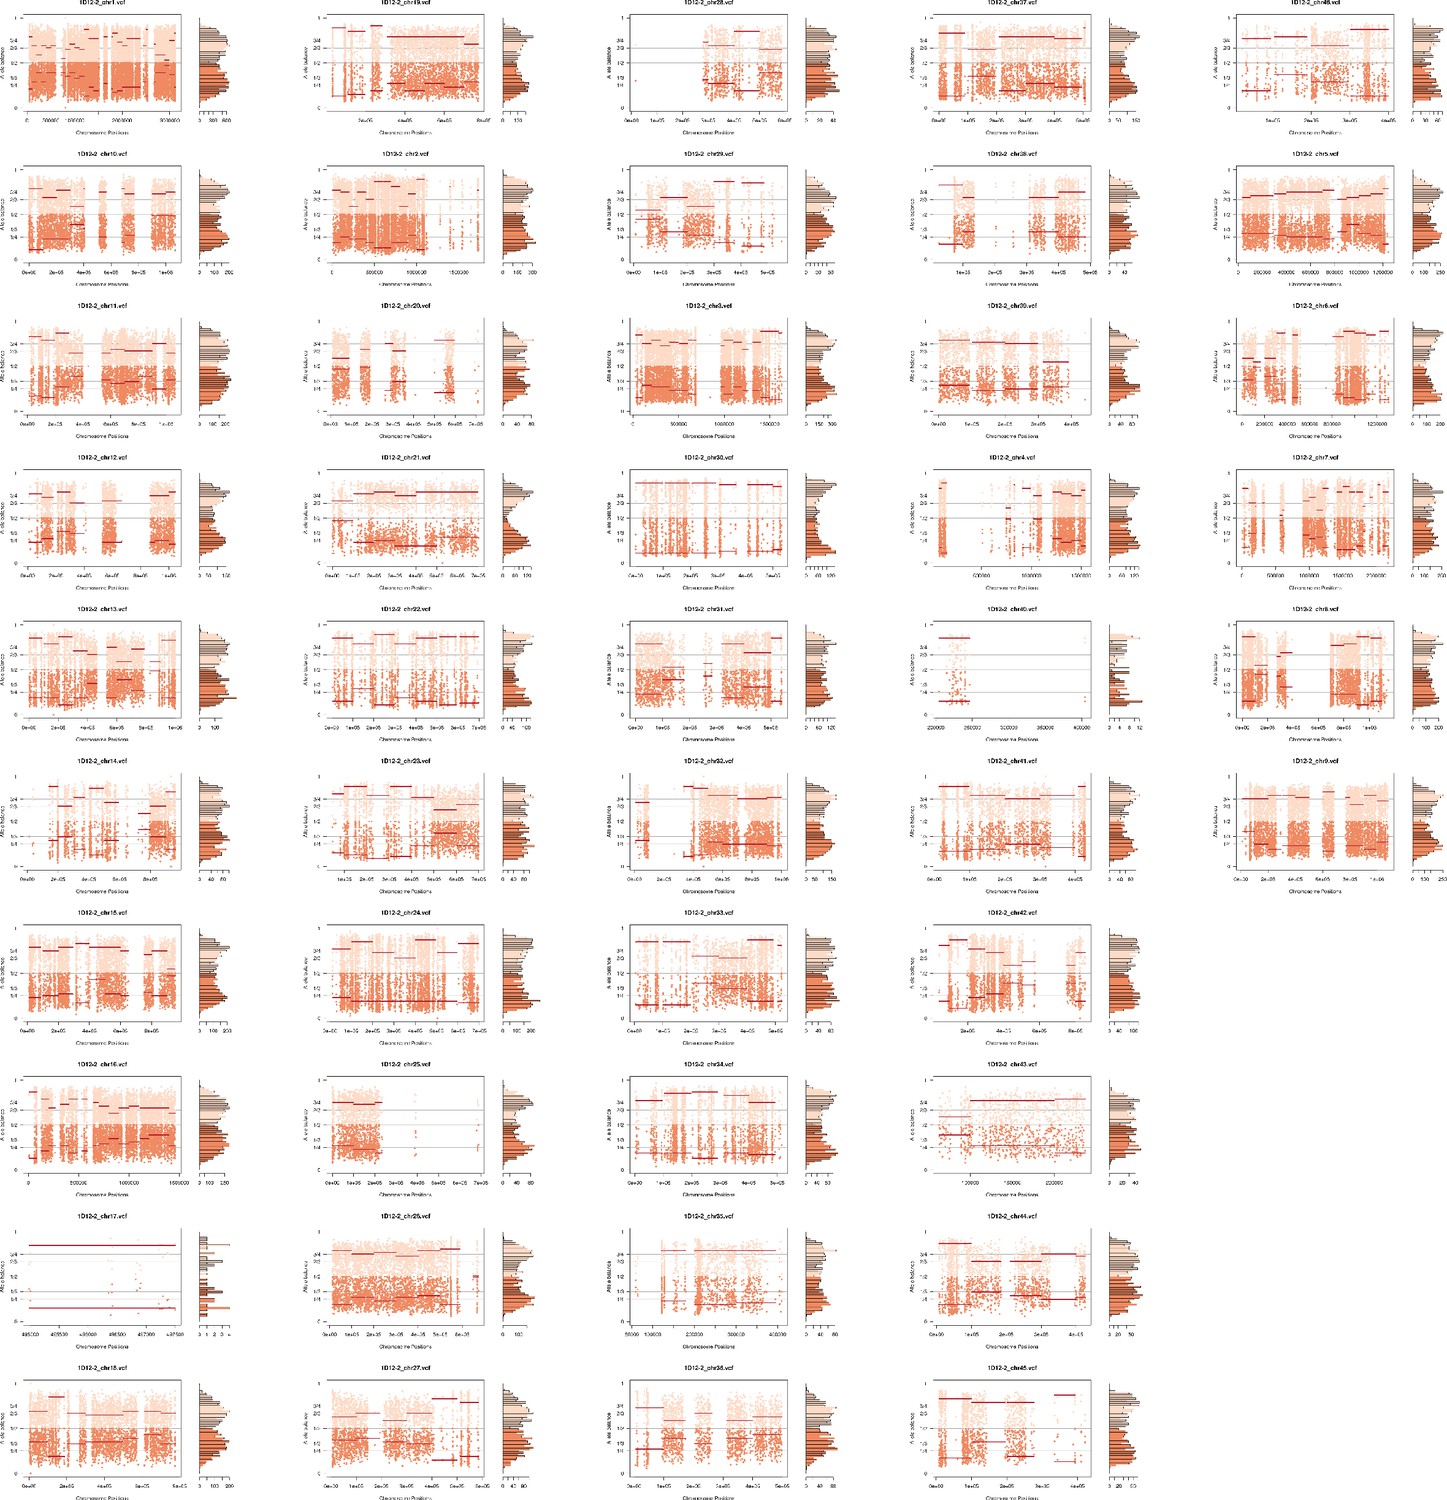
Somy estimation per chromosome based on allele balance (AB) confirming trisomic and tetrasomic chromosomes after in vitro culture in replicate 1D12-2.
Figure 5—figure supplement 12
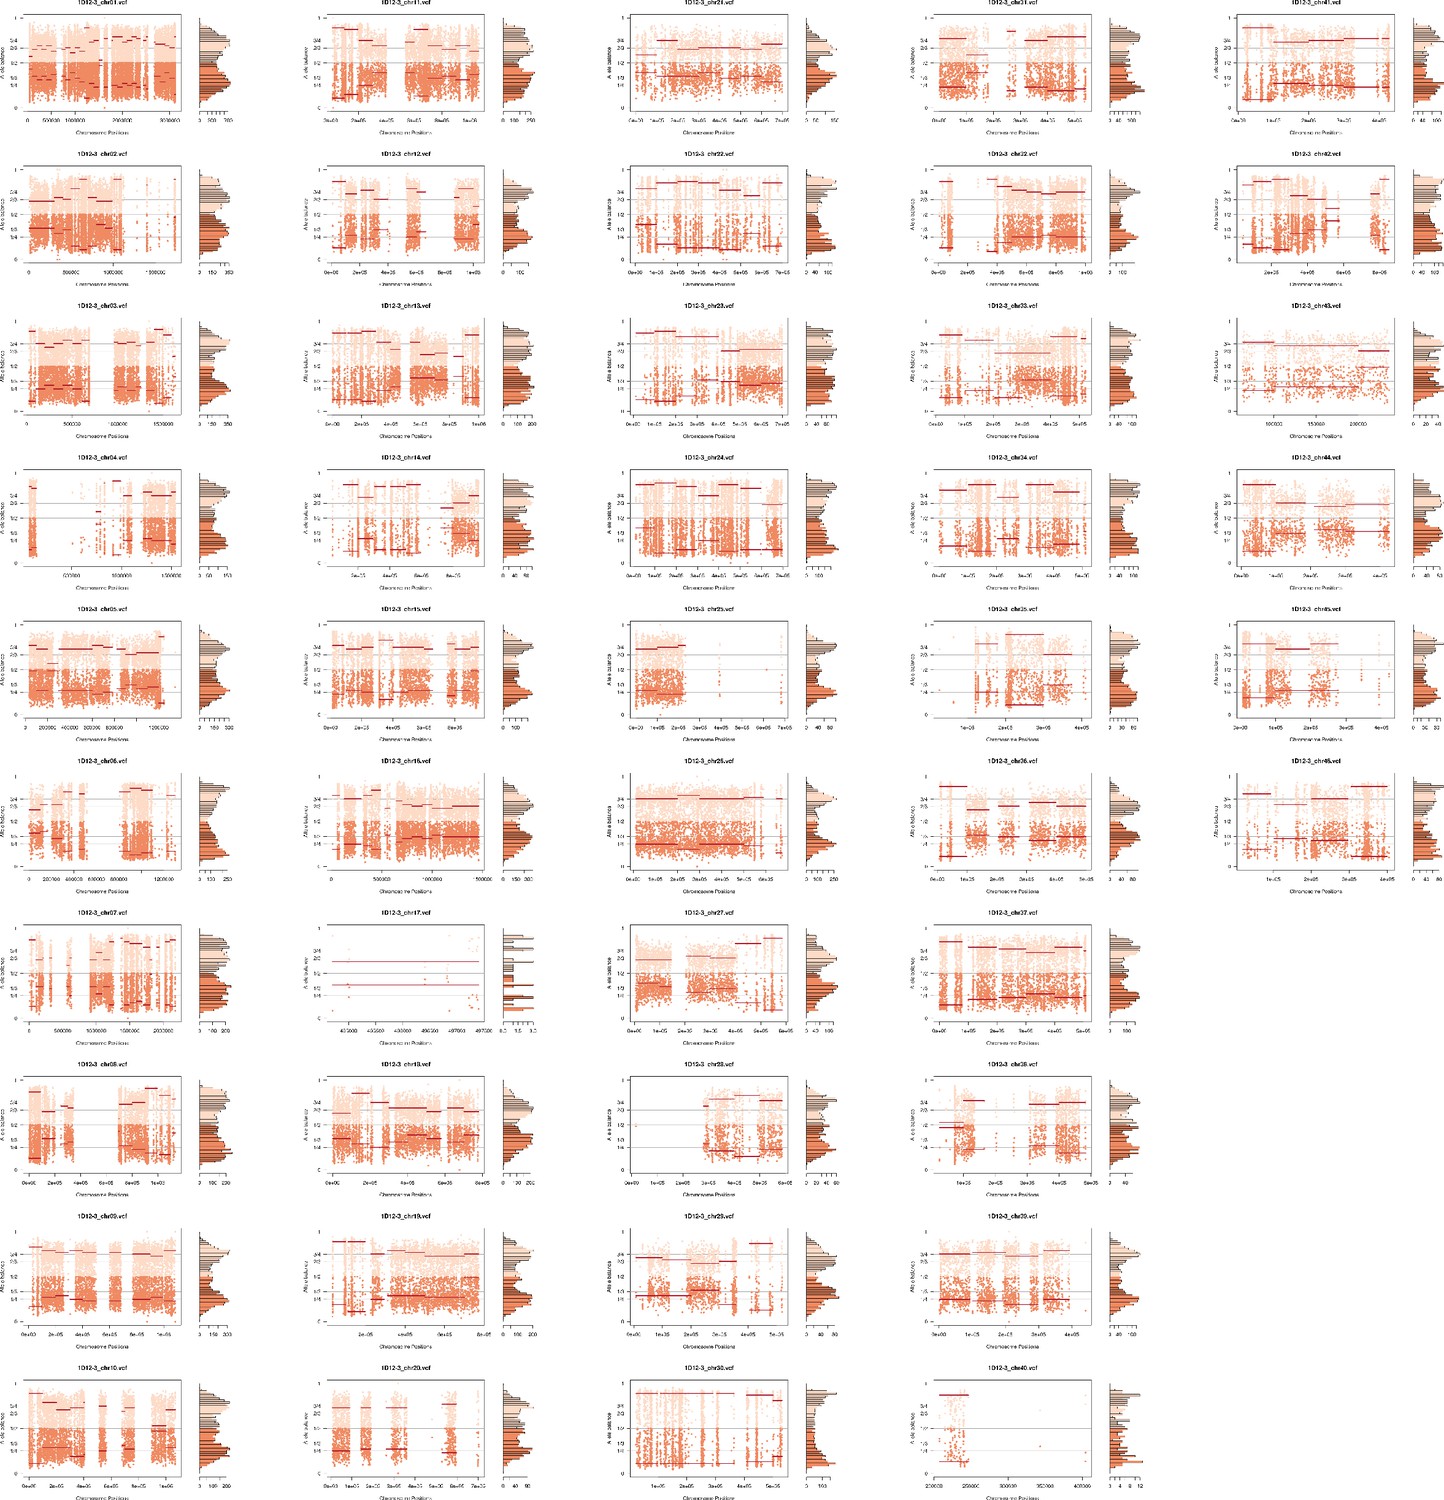
Somy estimation per chromosome based on allele balance (AB) confirming trisomic and tetrasomic chromosomes after in vitro culture in replicate 1D12-3.
Figure 5—figure supplement 13
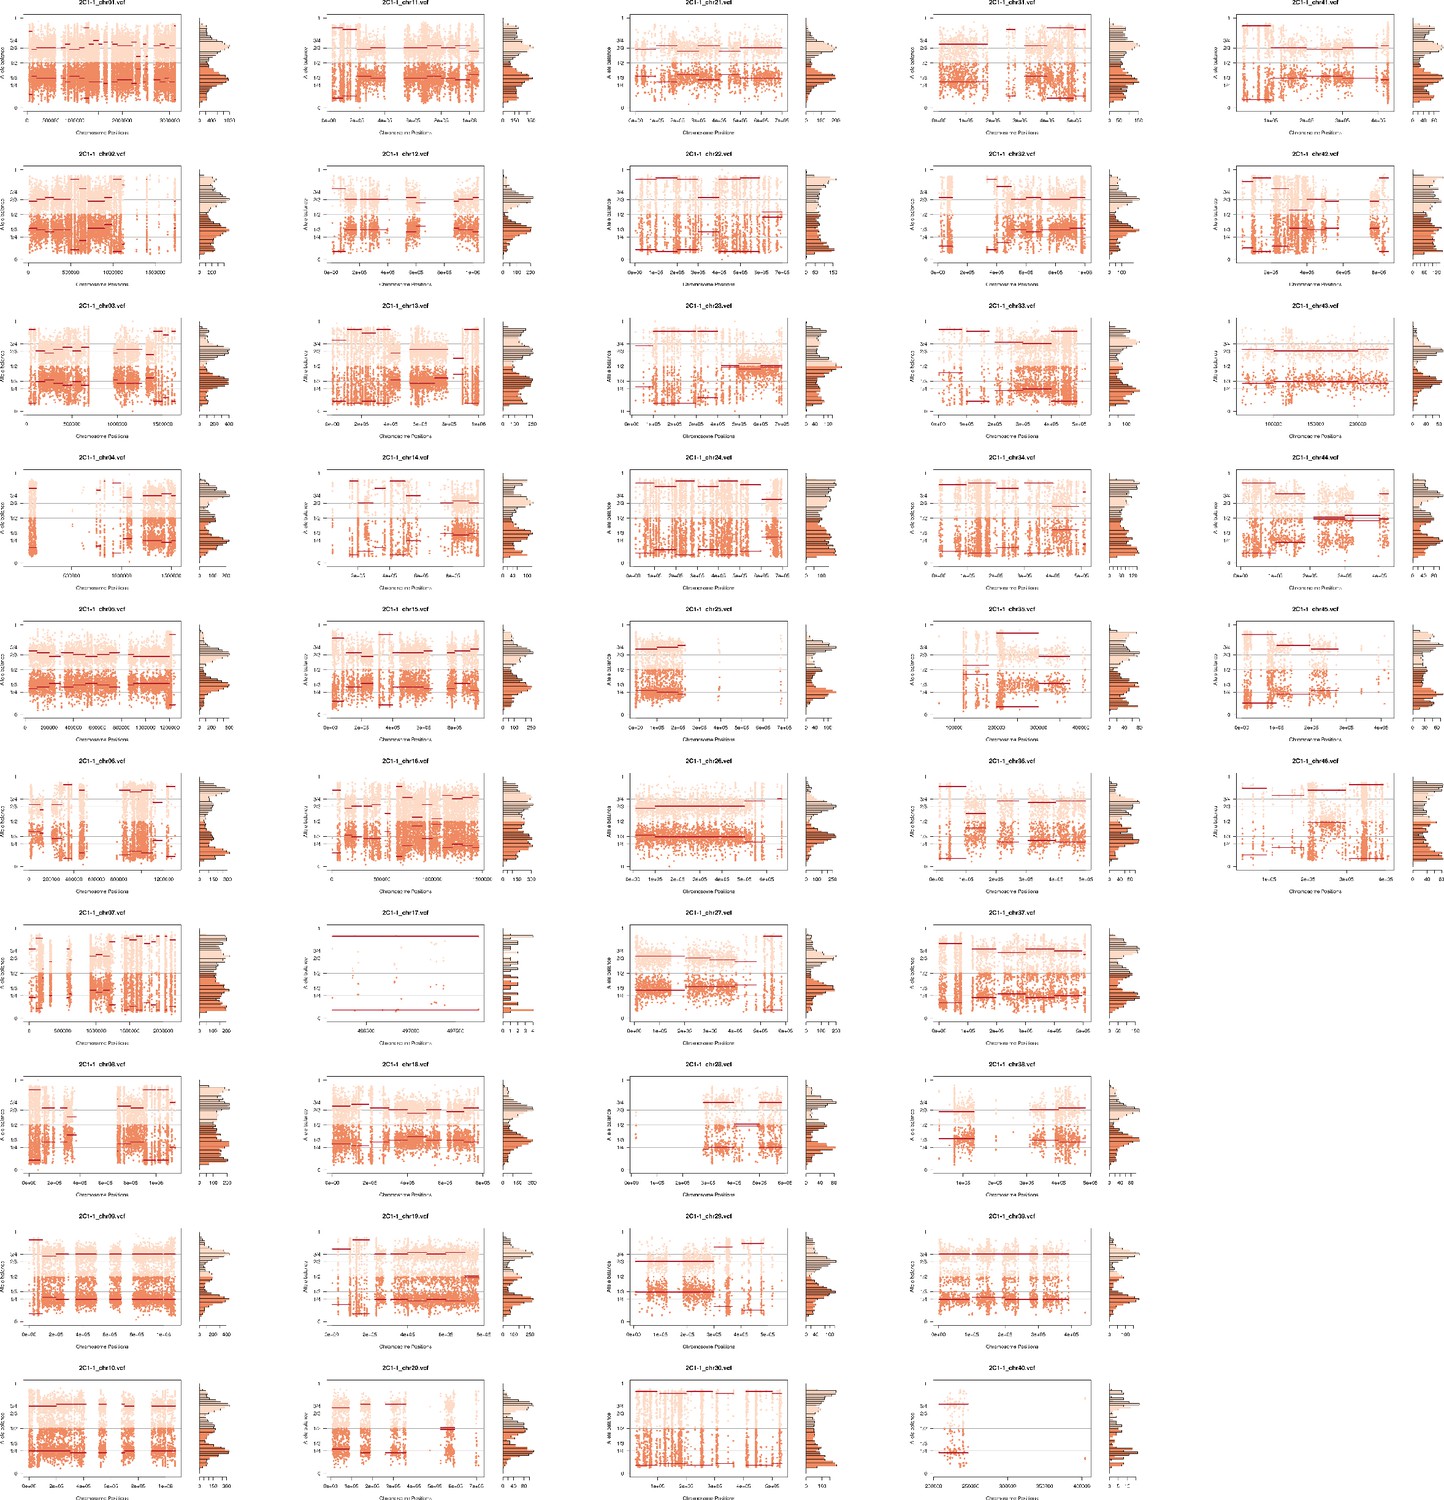
Somy estimation per chromosome based on allele balance (AB) confirming trisomic and tetrasomic chromosomes after in vitro culture in replicate 2C1-1.
Figure 5—figure supplement 14
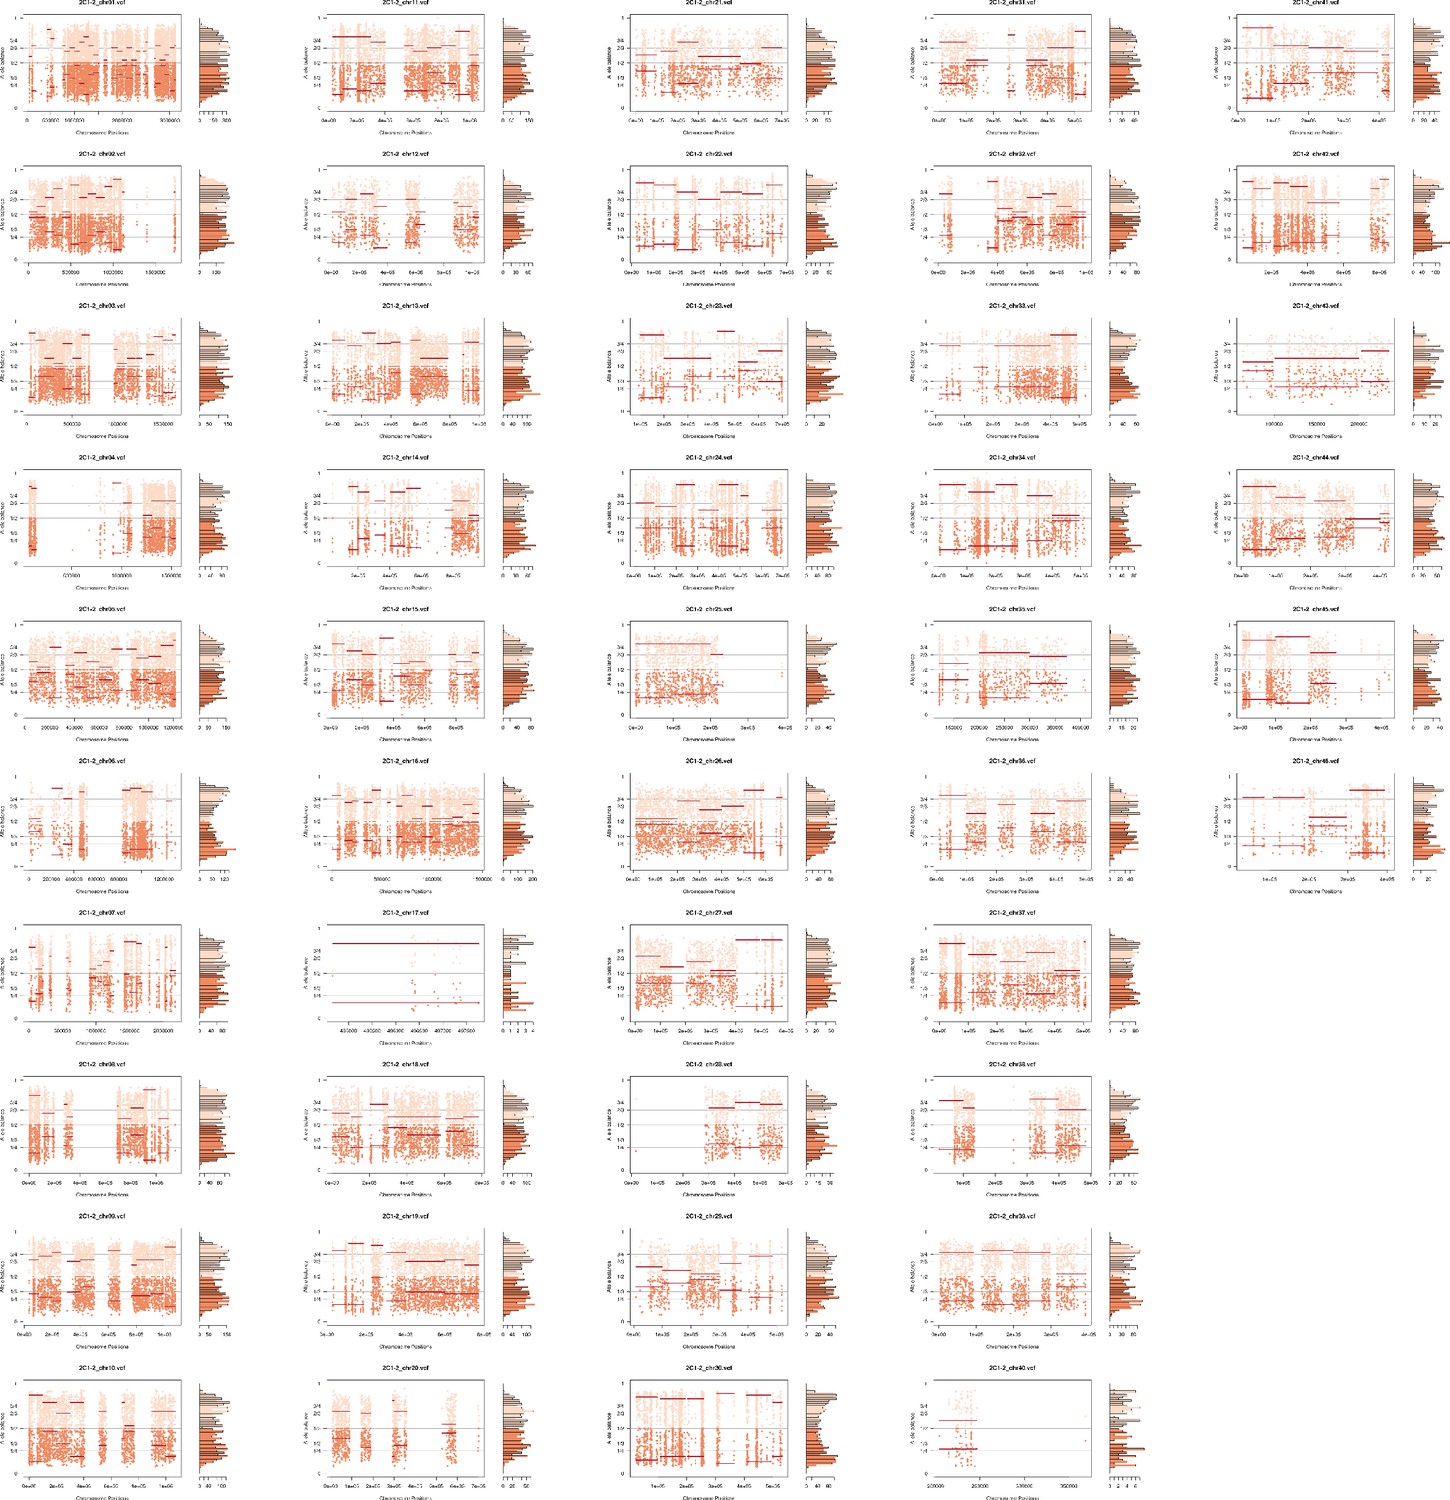
Somy estimation per chromosome based on allele balance (AB) confirming trisomic and tetrasomic chromosomes after in vitro culture in replicate 2C1-2.
Figure 5—figure supplement 15
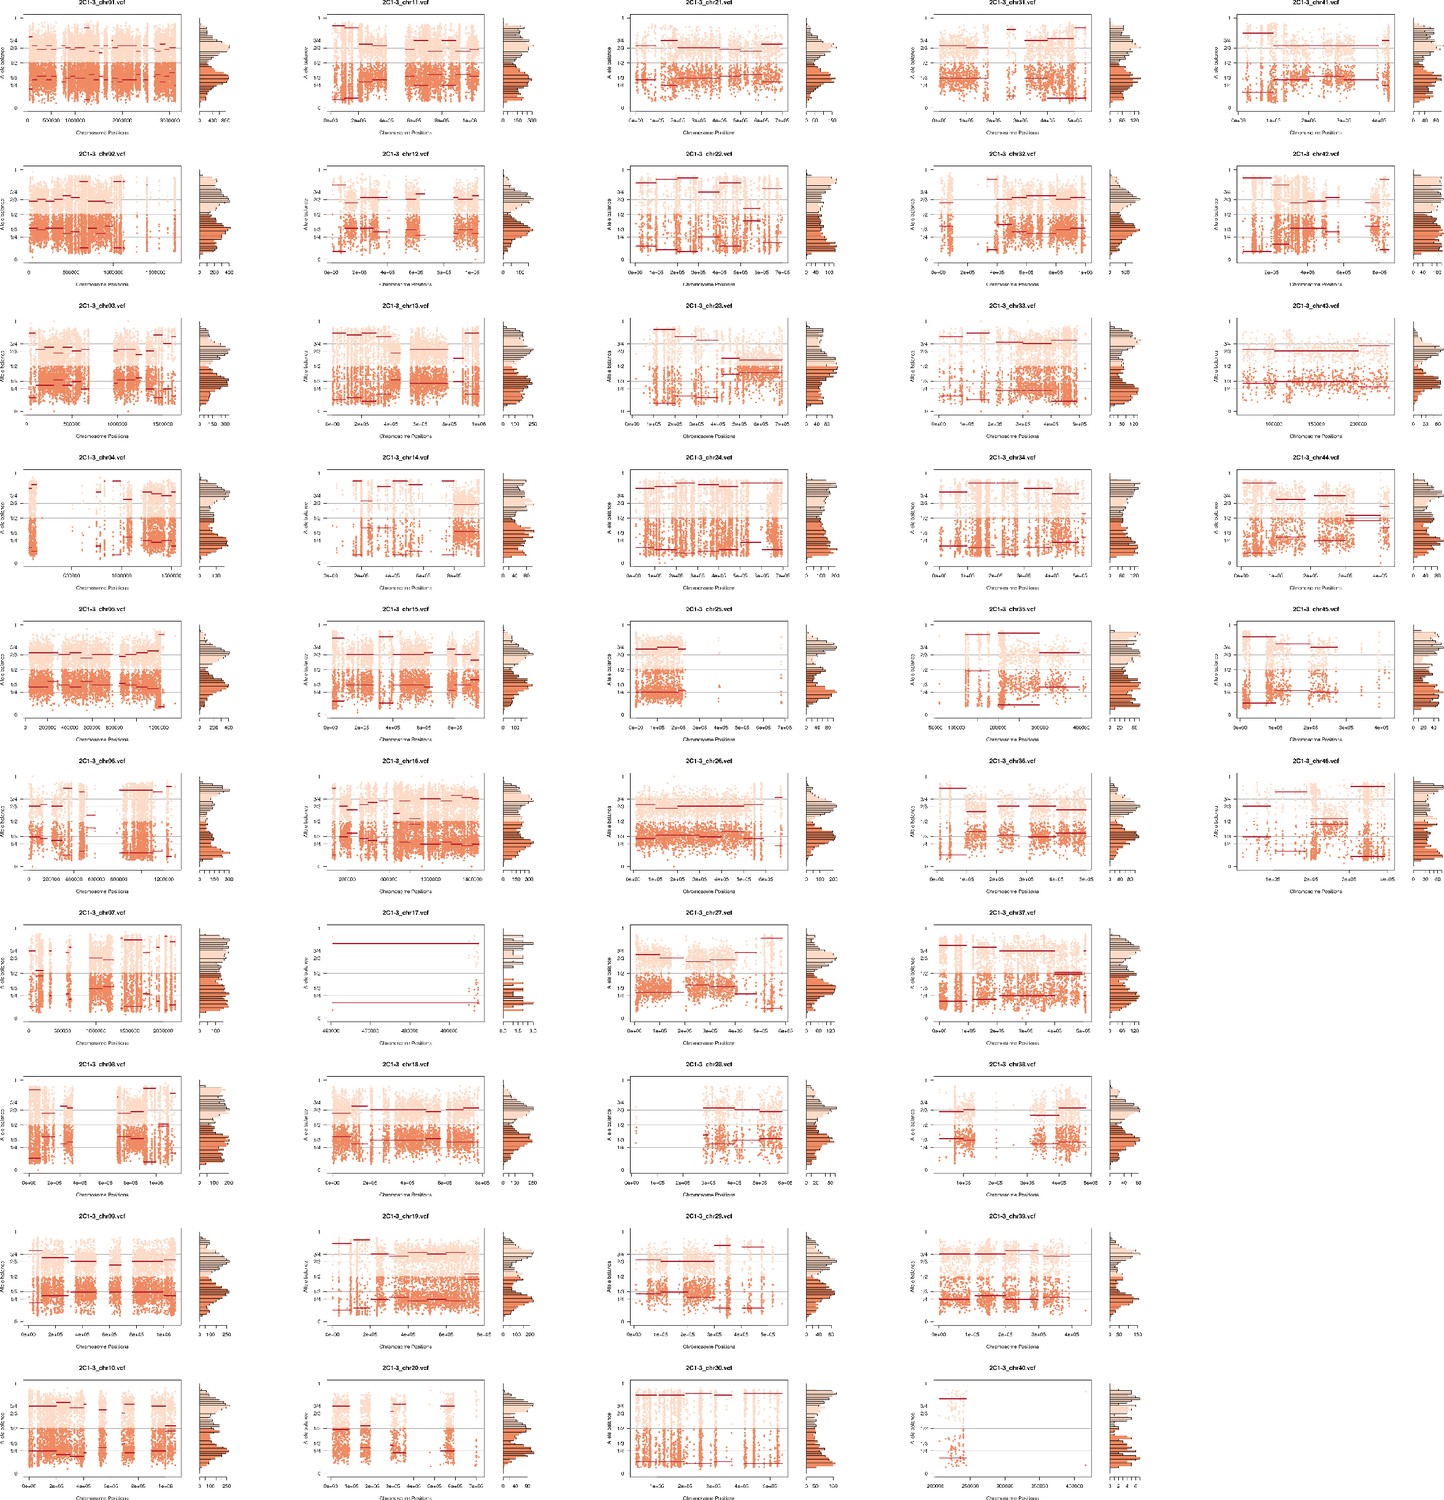
Somy estimation per chromosome based on allele balance (AB) confirming trisomic and tetrasomic chromosomes after in vitro culture in replicate 2C1-3.
Figure 6 with 1 supplement
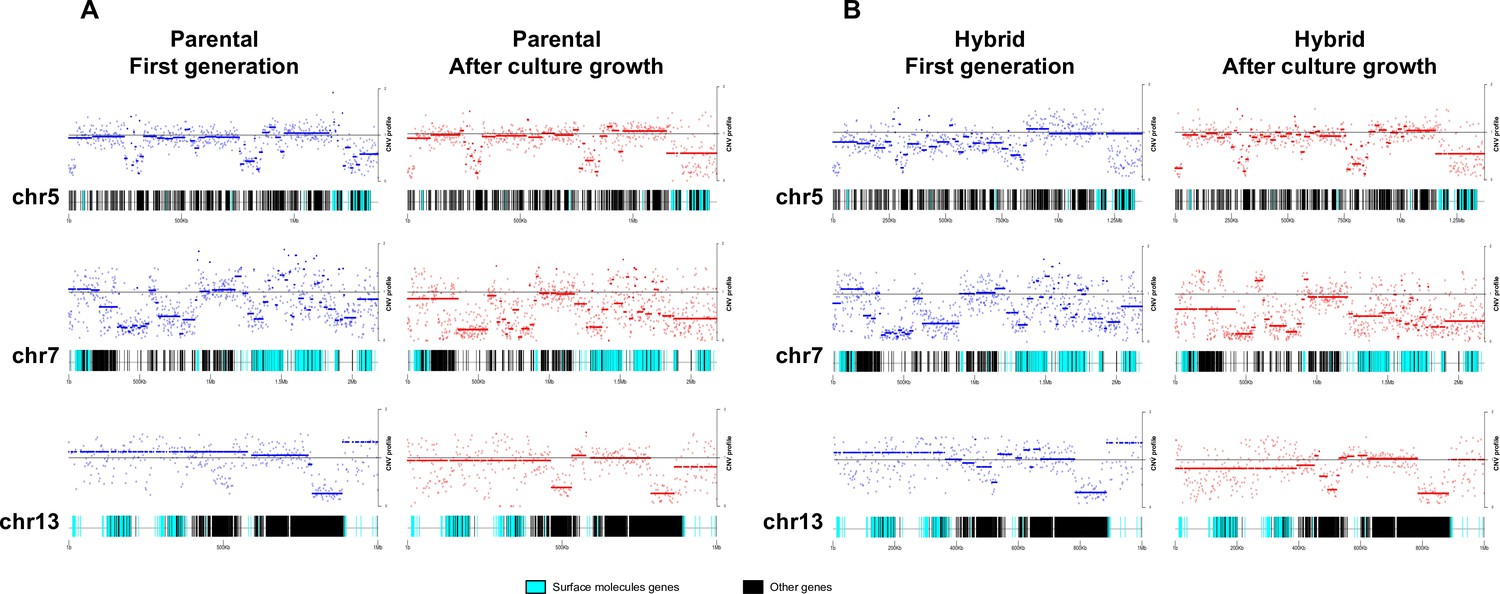
Chromosome gene composition and copy number variation (CNV) comparison indicate genome erosion patterns in surface molecule-coding regions after in vitro culture growth.
(A) CNV comparison in parental strain. (B) CNV comparison in hybrid strain. Each dot in the CNV profile chart represents the normalized depth per kb, while lines represent the median ratio (Cingolani et al., 2012). Blue points and lines represent CNV profiles in the first generation, while red points and lines represent CNV profiles after 800 generations of in vitro culture growth. surface protein-coding genes are represented as cyan blue boxes, while other genes are represented as black boxes.
Figure 6—figure supplement 1
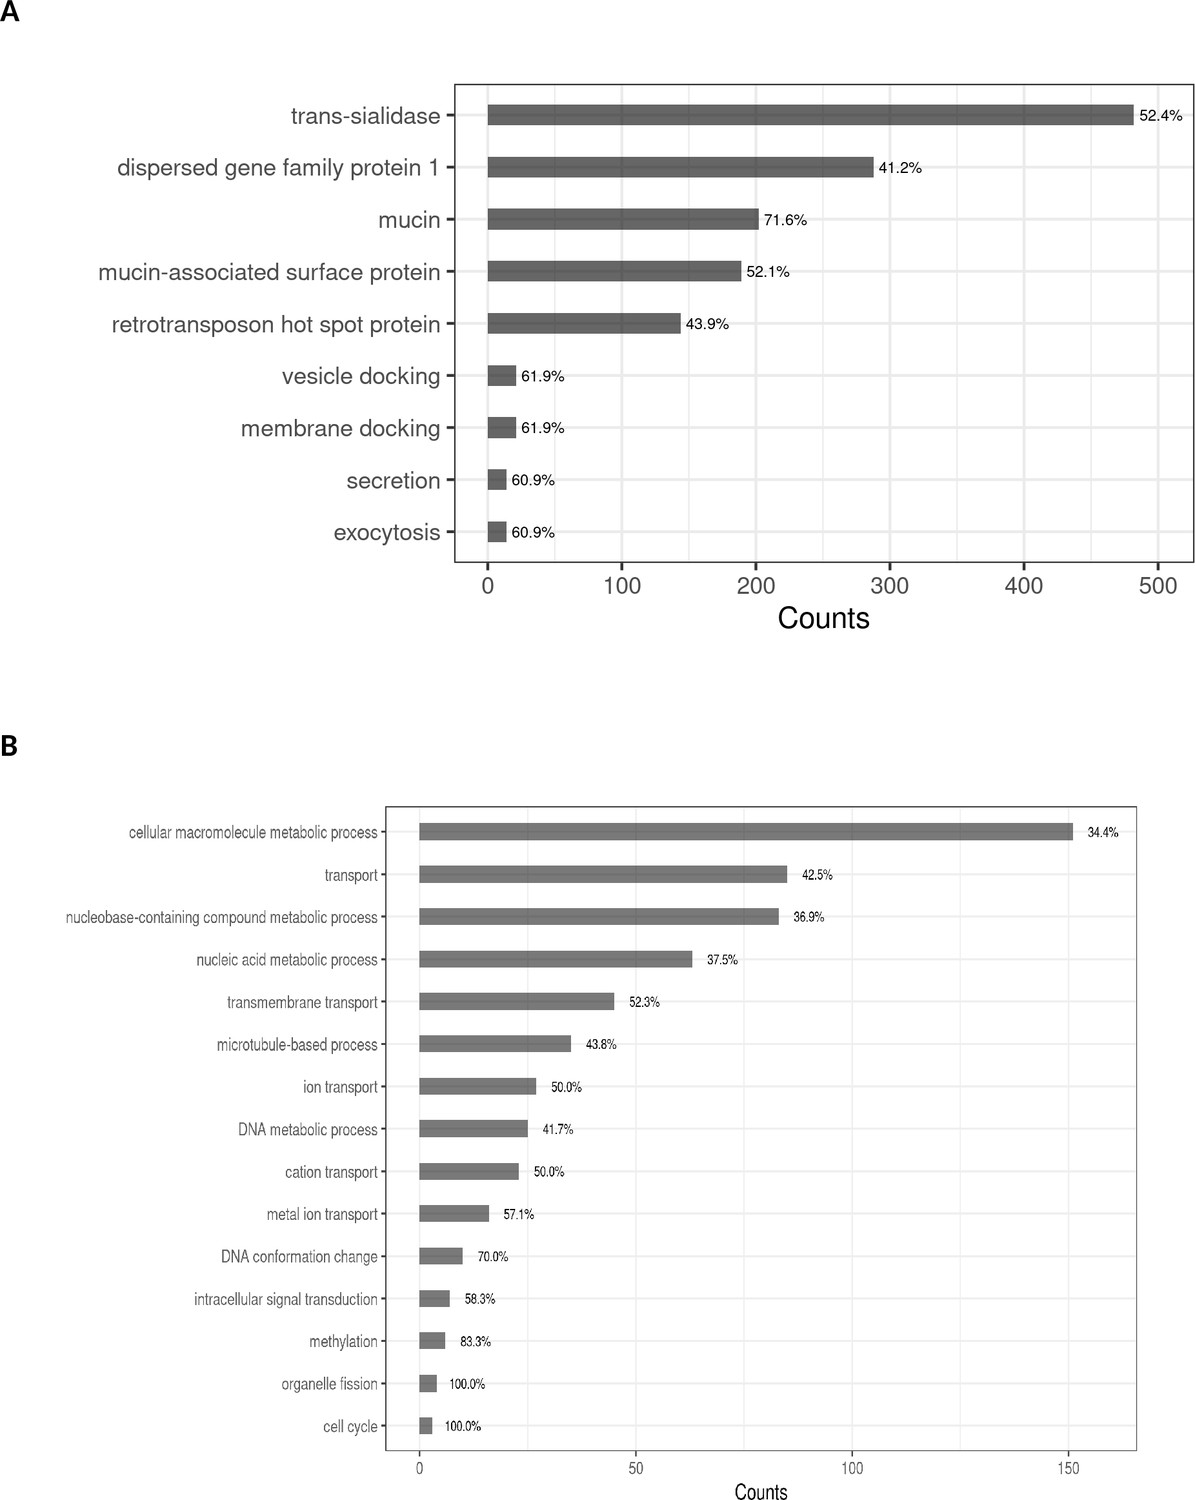
Counts of A. gene families and other membrane functional categories and B. other functional functional categories displaying copy number variation after culture growth.
Figure 7
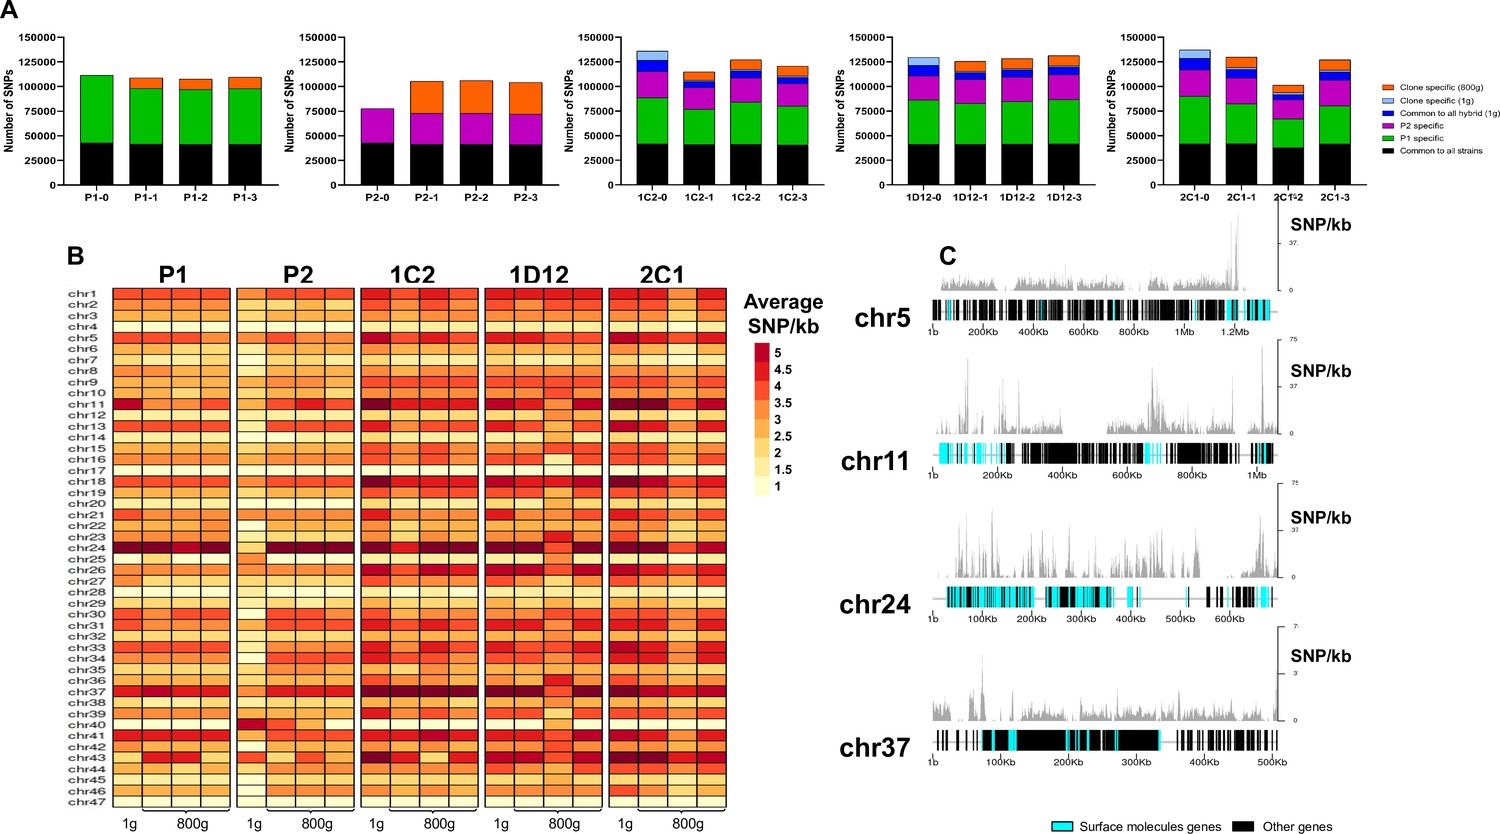
SNP density analysis throughout the genome indicates that surface molecule-coding regions displayed a higher number of variants than other regions of the genome for all strains.
(A) Number of SNPs in all clones after long-term in vitro culture. In black are represented SNPs common to all hybrid strains, in green SNPs specific to P1 strain, in purple SNPs specific to the P2 strain, in dark blue SNPs common to all hybrids in the first generation, in light blue SNPs exclusive to each hybrid clone in the first generation, and in orange SNPs exclusive to each clone after culture growth. (B) Chromosome average SNP density per kilobase in all samples before (1 g) and after culture growth (800 g). (C) 1C2 chromosomes with higher SNP density plotted displaying gene composition and SNP density. Surface protein-coding genes are represented as cyan blue boxes, while other genes are represented as black boxes.
Tables
Table 1
Average SNP density per kilobase in starting generation parental strains and hybrid clones.
| SNP/kb genome-wide | SNP/kb high-quality mapping regions | |
|---|---|---|
| P1-0 | 9.28 | 2.84 |
| P2-0 | 3.71 | 2.11 |
| 1C2-0 | 7.63 | 3.48 |
| 1D12-0 | 7.46 | 3.29 |
| 2C1-0 | 8.22 | 3.49 |
Additional files
-
Supplementary file 1
PCR-based multilocus microsatellite genotyping in parental and hybrid strains before (t=0) and after (t=800) the microevolution experiment.
- https://cdn.elifesciences.org/articles/75237/elife-75237-supp1-v2.xlsx
-
Supplementary file 2
Genome assembly statistics of parental strains.
- https://cdn.elifesciences.org/articles/75237/elife-75237-supp2-v2.xlsx
-
Supplementary file 3
Effects of SNPs in the first generation hybrids.
- https://cdn.elifesciences.org/articles/75237/elife-75237-supp3-v2.xlsx
-
Supplementary file 4
Number of SNPs in surface molecules genes (SM) and in other genes.
- https://cdn.elifesciences.org/articles/75237/elife-75237-supp4-v2.xlsx
-
Supplementary file 5
Number of non-synonymous SNPs in surface molecules genes (SM) and in other genes.
- https://cdn.elifesciences.org/articles/75237/elife-75237-supp5-v2.xlsx
-
Supplementary file 6
Gene Ontology analysis of expanded genes in parental strains after culture growth.
Bgd count: Number of genes with this term in the genome; Result count: Number of genes with this term in our analysis; Pct of bgd: The percent of genes with this term in our analysis divided by the percent of genes with this term in the genome; Fold enrichment: Of the genes in the genome with this term, the percent that are present in your analysis.
- https://cdn.elifesciences.org/articles/75237/elife-75237-supp6-v2.xlsx
-
Supplementary file 7
Gene Ontology analysis of contracted genes in parental strains after culture growth.
Bgd count: Number of genes with this term in the genome; Result count: Number of genes with this term in our analysis; Pct of bgd: The percent of genes with this term in our analysis divided by the percent of genes with this term in the genome; Fold enrichment: Of the genes in the genome with this term, the percent that are present in your analysis.
- https://cdn.elifesciences.org/articles/75237/elife-75237-supp7-v2.xlsx
-
Supplementary file 8
Gene Ontology analysis of expanded genes in hybrid strains after culture growth.
Bgd count: Number of genes with this term in the genome; Result count: Number of genes with this term in our analysis; Pct of bgd: The percent of genes with this term in our analysis divided by the percent of genes with this term in the genome; Fold enrichment: Of the genes in the genome with this term, the percent that are present in your analysis.
- https://cdn.elifesciences.org/articles/75237/elife-75237-supp8-v2.xlsx
-
Supplementary file 9
Gene Ontology analysis of contracted genes in hybrid strains after culture growth.
Bgd count: Number of genes with this term in the genome; Result count: Number of genes with this term in our analysis; Pct of bgd: The percent of genes with this term in our analysis divided by the percent of genes with this term in the genome; Fold enrichment: Of the genes in the genome with this term, the percent that are present in your analysis.
- https://cdn.elifesciences.org/articles/75237/elife-75237-supp9-v2.xlsx
-
Supplementary file 10
Gene Ontology analysis of genes encoded in chromosome 19.
Bgd count: Number of genes with this term in the genome; Result count: Number of genes with this term in our analysis; Pct of bgd: The percent of genes with this term in our analysis divided by the percent of genes with this term in the genome; Fold enrichment: Of the genes in the genome with this term, the percent that are present in your analysis.
- https://cdn.elifesciences.org/articles/75237/elife-75237-supp10-v2.xlsx
-
Supplementary file 11
Gene Ontology analysis of genes encoded in chromosome 37.
Bgd count: Number of genes with this term in the genome; Result count: Number of genes with this term in our analysis; Pct of bgd: The percent of genes with this term in our analysis divided by the percent of genes with this term in the genome; Fold enrichment: Of the genes in the genome with this term, the percent that are present in your analysis.
- https://cdn.elifesciences.org/articles/75237/elife-75237-supp11-v2.xlsx
-
Supplementary file 12
Gene Ontology analysis of contracted genes in Parental 2 clones after culture growth.
Bgd count: Number of genes with this term in the genome; Result count: Number of genes with this term in our analysis; Pct of bgd: The percent of genes with this term in our analysis divided by the percent of genes with this term in the genome; Fold enrichment: Of the genes in the genome with this term, the percent that are present in your analysis.
- https://cdn.elifesciences.org/articles/75237/elife-75237-supp12-v2.xlsx
-
Supplementary file 13
Number of non-synonymous SNPs in surface molecules genes (SM) and in other genes after culture growth.
- https://cdn.elifesciences.org/articles/75237/elife-75237-supp13-v2.xlsx
-
Transparent reporting form
- https://cdn.elifesciences.org/articles/75237/elife-75237-transrepform1-v2.pdf
Download links
A two-part list of links to download the article, or parts of the article, in various formats.
Downloads (link to download the article as PDF)
Open citations (links to open the citations from this article in various online reference manager services)
Cite this article (links to download the citations from this article in formats compatible with various reference manager tools)
Microevolution of Trypanosoma cruzi reveals hybridization and clonal mechanisms driving rapid genome diversification
eLife 11:e75237.
https://doi.org/10.7554/eLife.75237


