Genetic loci and metabolic states associated with murine epigenetic aging
- Department of Preventive Medicine, University of Tennessee Health Science Center, College of Medicine, United States
- Department of Genetics, Genomics and Informatics, University of Tennessee Health Science Center, College of Medicine, United States
- Department of Human Genetics, David Geffen School of Medicine, University of California Los Angeles, United States
- Department of Biostatistics, Fielding School of Public Health, University of California Los Angeles, United States
- YCI Laboratory for Next-Generation Proteomics, RIKEN Center for Integrative Medical Sciences, Japan
- University of Geneva, Switzerland
Figures
Figure 1 with 2 supplements
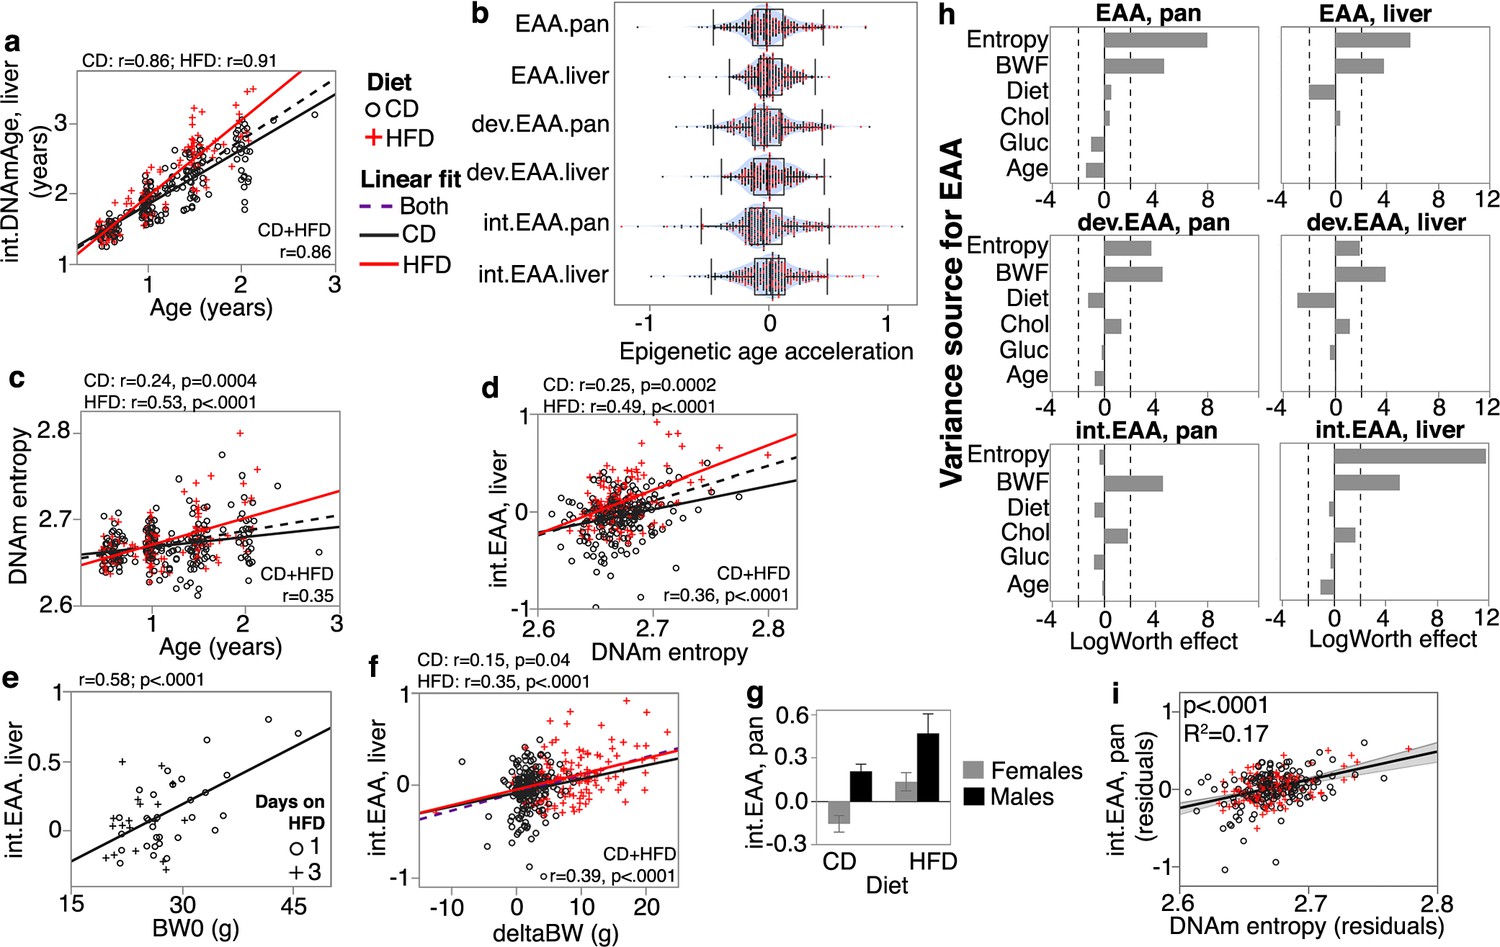
Correlates and modifiers of epigenetic clocks and methylome-wide entropy.
(a) Correlation between chronological age and predicted age (shown for the liver intervention clock or int.DNAmAge). Black circles are control diet (CD, n = 210); red crosses are high-fat diet mice (HFD, n = 128). (b) Violin plots of age-adjusted epigenetic age acceleration (EAA) (‘int,’ interventional; ‘dev,’ developmental). (c) Shannon entropy, calculated from the full set of high-quality CpGs, increases with age. (d) Methylome entropy has a direct correlation with EAA (shown for the liver int.EAA). (e) For 48 mice, initial body weight (BW0) was measured 1 or 3 days after introduction to HFD, and these showed significant correlation with EAA. (f) Weight was first measured at mean age of 4.5 ± 2.7 months (BW0), and then at 6.3 ± 2.8 months (BW1). Weight gains during this interval (deltaBW = BW1 – BW0) are a direct correlate of EAA. (g) For BXD genotypes with males and females samples, males have higher age acceleration. Bars represent mean ± standard error; 40 females (26 CD, 14 HFD) and 18 males (10 CD, 8 HFD). (h) Relative effects of different predictor variables on EAA shown as logworth scores (-log10p). The dashed lines correspond to p=0.01. Positive logworth values indicate positive regression estimates (for diet, positive means higher in HFD compared to CD). BWF, final weight; Chol, serum total cholesterol; Gluc, fasted glucose levels. (i) The residual plot displays association between methylome-wide entropy and the pan-tissue int.EAA after adjustment for diet, age, weight, glucose, cholesterol, and batch.
Figure 1—figure supplement 1
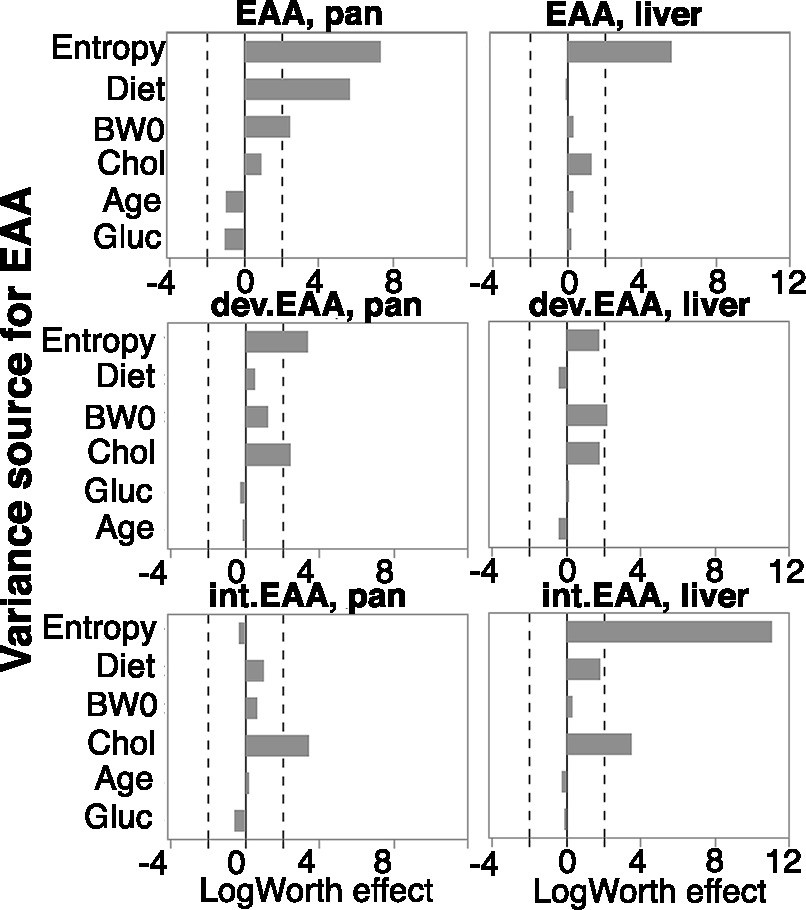
Relative effects of different predictor variables on epigenetic age acceleration (EAA).
Logworth scores of the predictors (–log10p) with dashed lines corresponding to p=0.01. Positive logworth values indicate positive regression estimates, and negative values indicate negative regression estimates (for diet, positive means higher in high-fat diet compared to control diet). BW0, baseline weight; Chol, serum total cholesterol, Gluc, fasted glucose levels.
Figure 1—figure supplement 2

BXD strains with shorter life expectancy have slightly more accelerated clocks.
This inverse correlation is depicted for the (a) 75th quartile age at natural death, (b) minimum lifespan, and (c) median lifespan (analysis in 302 female samples with lifespan data). CD, control diet; HFD, high-fat diet. The negative correlations are modest with explained variance values, r2, of ~ 3%.
Figure 2 with 2 supplements

Multivariable analysis of site-specific methylation.
(a) Volcano plot comparing regression estimates (change in methylation beta-value per day of age) versus the statistical significance for age effect. Dashed line denotes the Bonferroni p=0.05 for ~28K tests. Similar volcano plots for predictor variables: (b) final body weight (regression estimates are change per gram of weight), (c) diet (change in high-fat diet [HFD] compared to control diet [CD]), and (d) strain median lifespan (per day increase in median longevity). CpGs that were significantly associated with age are denoted by colored markers (red circles: age-gain; yellow triangles: age-loss). (e) Overlap among the lists of differentially methylated CpGs. (f) Each dot represents the mean methylation beta-values for the 5030 age-gain and 1523 age-loss CpGs. (g) Correlation between body weight and methylation beta-values for the CpG (cg10587537) located in the 3′UTR of Mettl23. Mice on HFD have higher methylation than mice on CD, but the inverse correlation with weight is consistent for both groups (r = –0.45, p<0.0001 for CD; r = –0.15, p=0.08 for HFD). (h) Contour density plot for the 6553 CpGs that are significantly associated with age (age-DMCs). This relates the pattern of change with age (x-axis) with change on HFD (y-axis). CpGs that gain methylation with age are also increased in methylation by HFD. (i) Correlation between age and methylation at the Mettl23 3′UTR CpG (r = 0.35 for CD; r = 0.46 for HFD). (j) For the 6553 age-DMCs, the contour density plot relates the pattern of change with age (x-axis) vs. change with median longevity (y-axis). CpGs that gain methylation with age have lower methylation with higher lifespan.
Figure 2—figure supplement 1
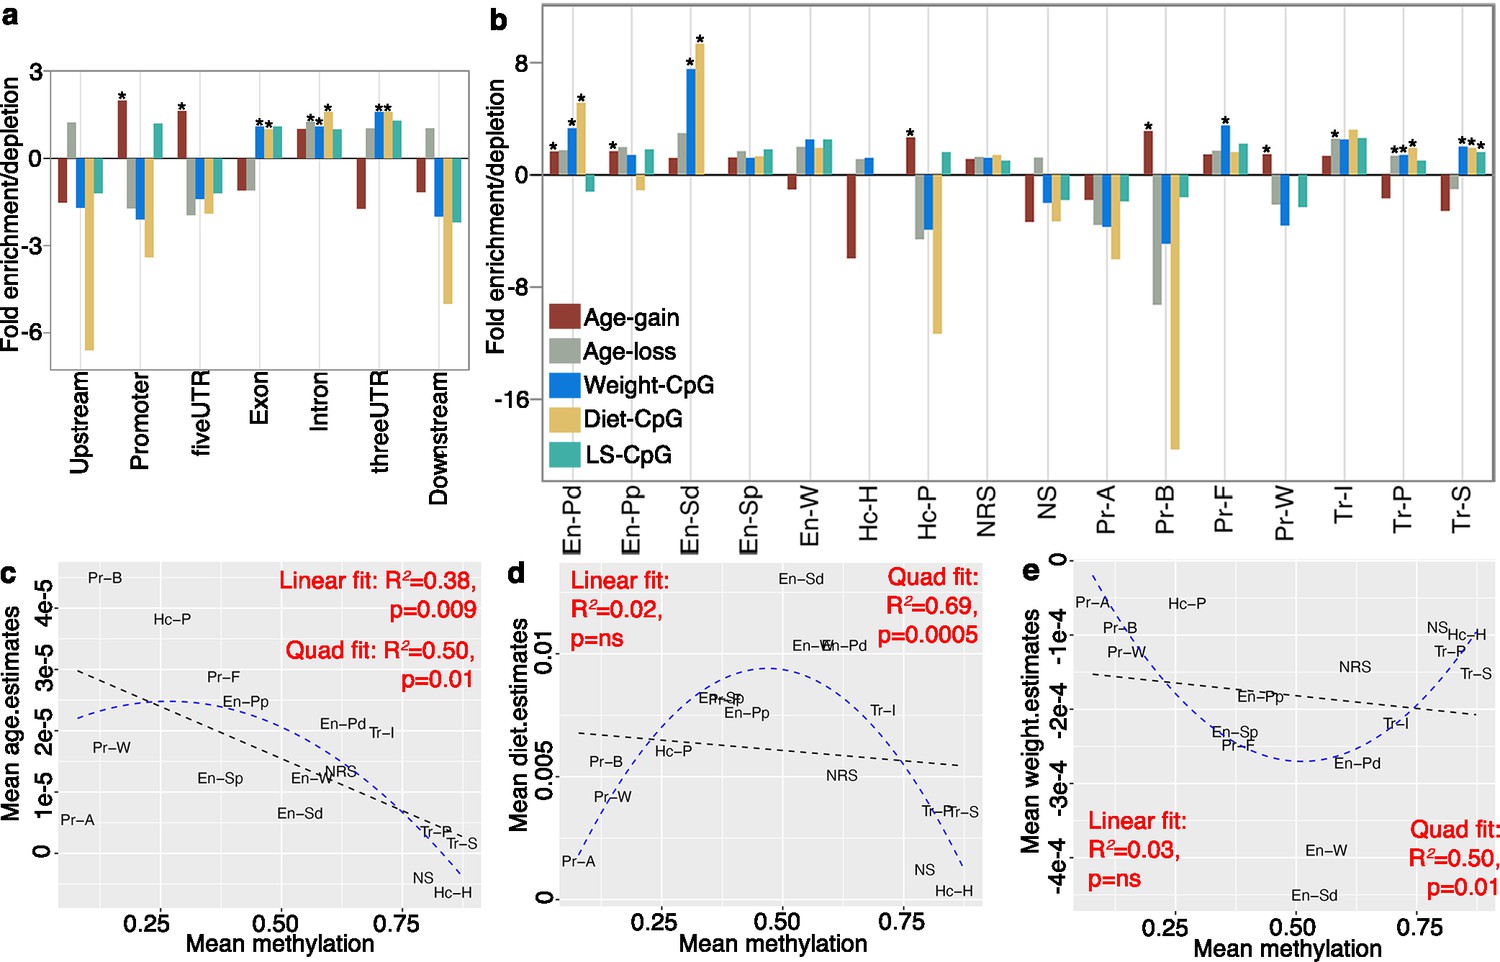
Genomic and chromatin states of differentially methylated CpGs.
Enrichment is (a) genomic location and (b) chromatin states among the differentially methylated CpGs (DMC) (expansions for the chromatin states are provided in Supplementary file 9). Asterisks denote hypergeometric enrichment p<0.001. For the 15 chromatin states (and regions with no replicable signal [NRS]), we compare the methylation levels and mean regression estimates for the effects of (c) age, (d) diet, and (e) body weight.
Figure 2—figure supplement 2
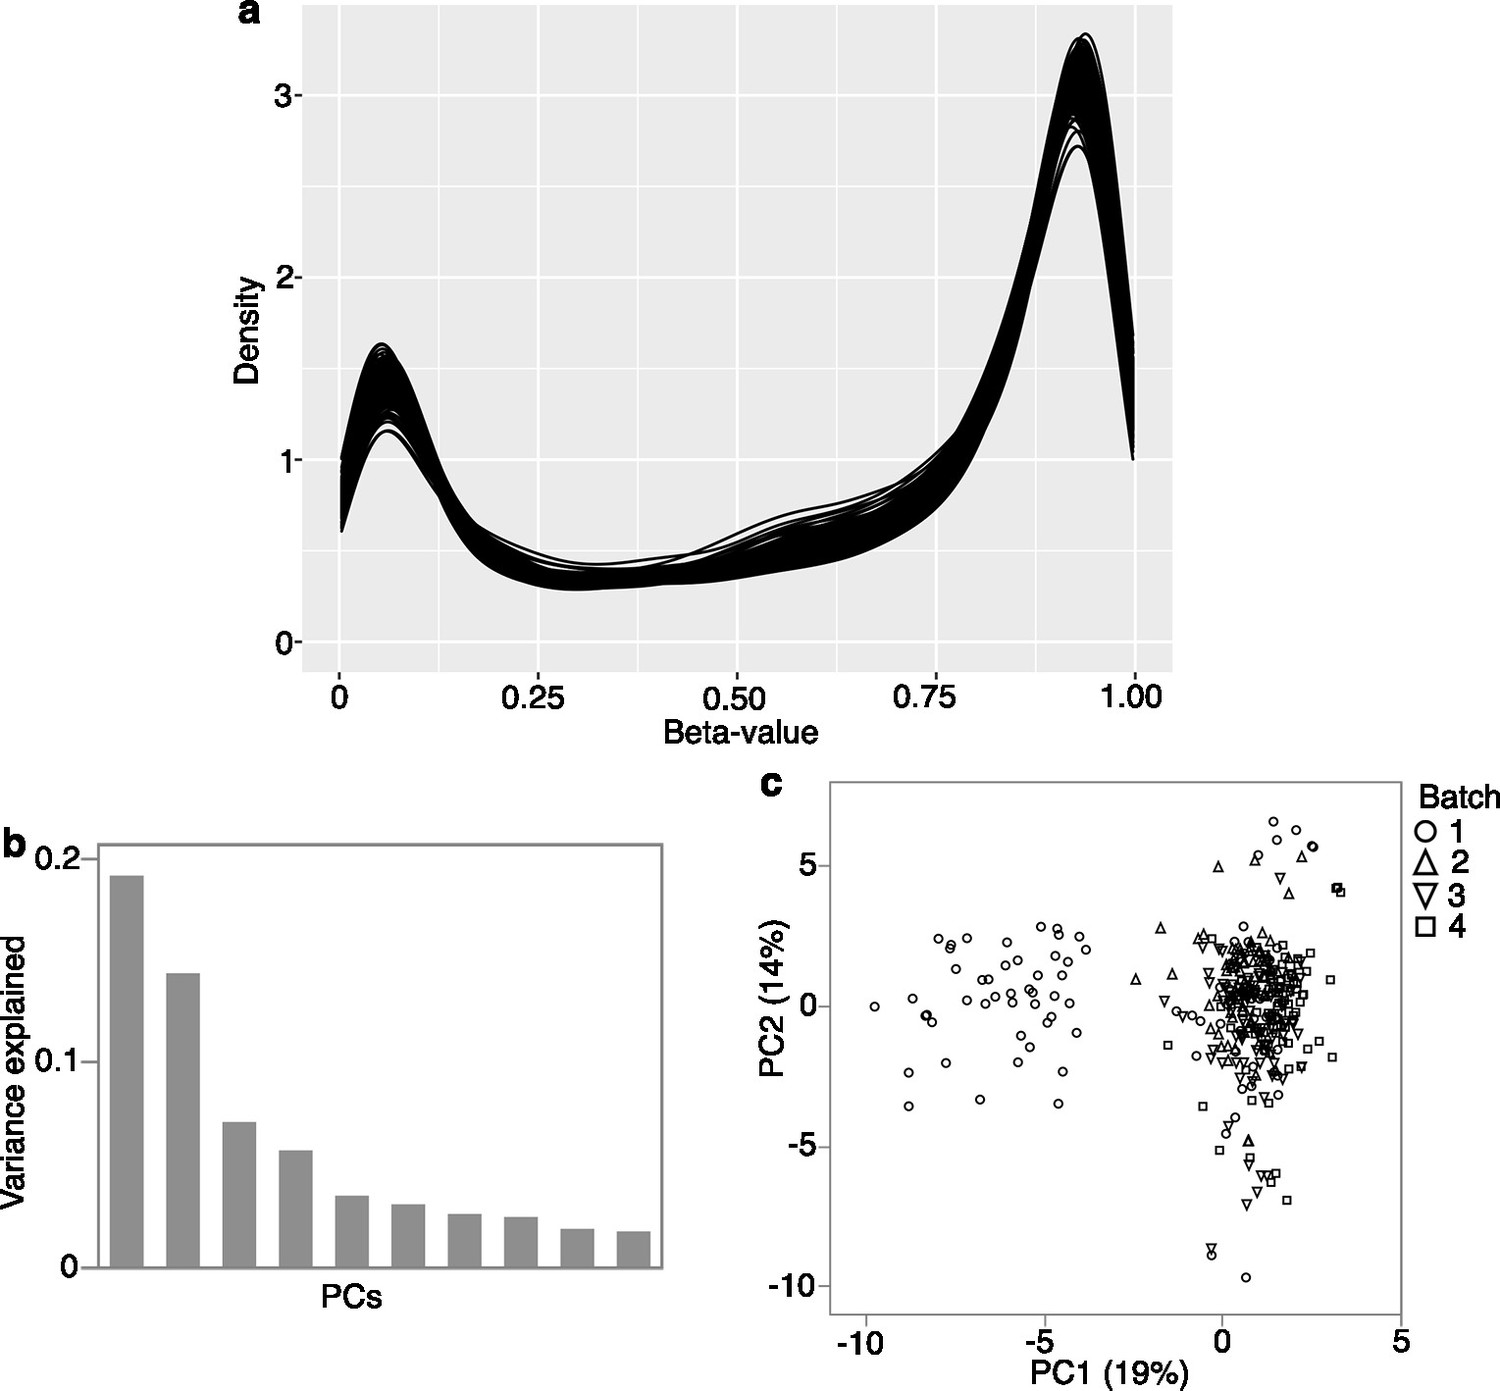
Array quality check.
(a) Density plot for the 339 cases using the full set of CpG probes. (b) Variance explained by the top 10 principal components (PCs) derived from the full set of probes. (c) Plot between component 1 and 2 shows the PC1 captures some batch effect. Here batch is the 96-well plates.
Figure 3
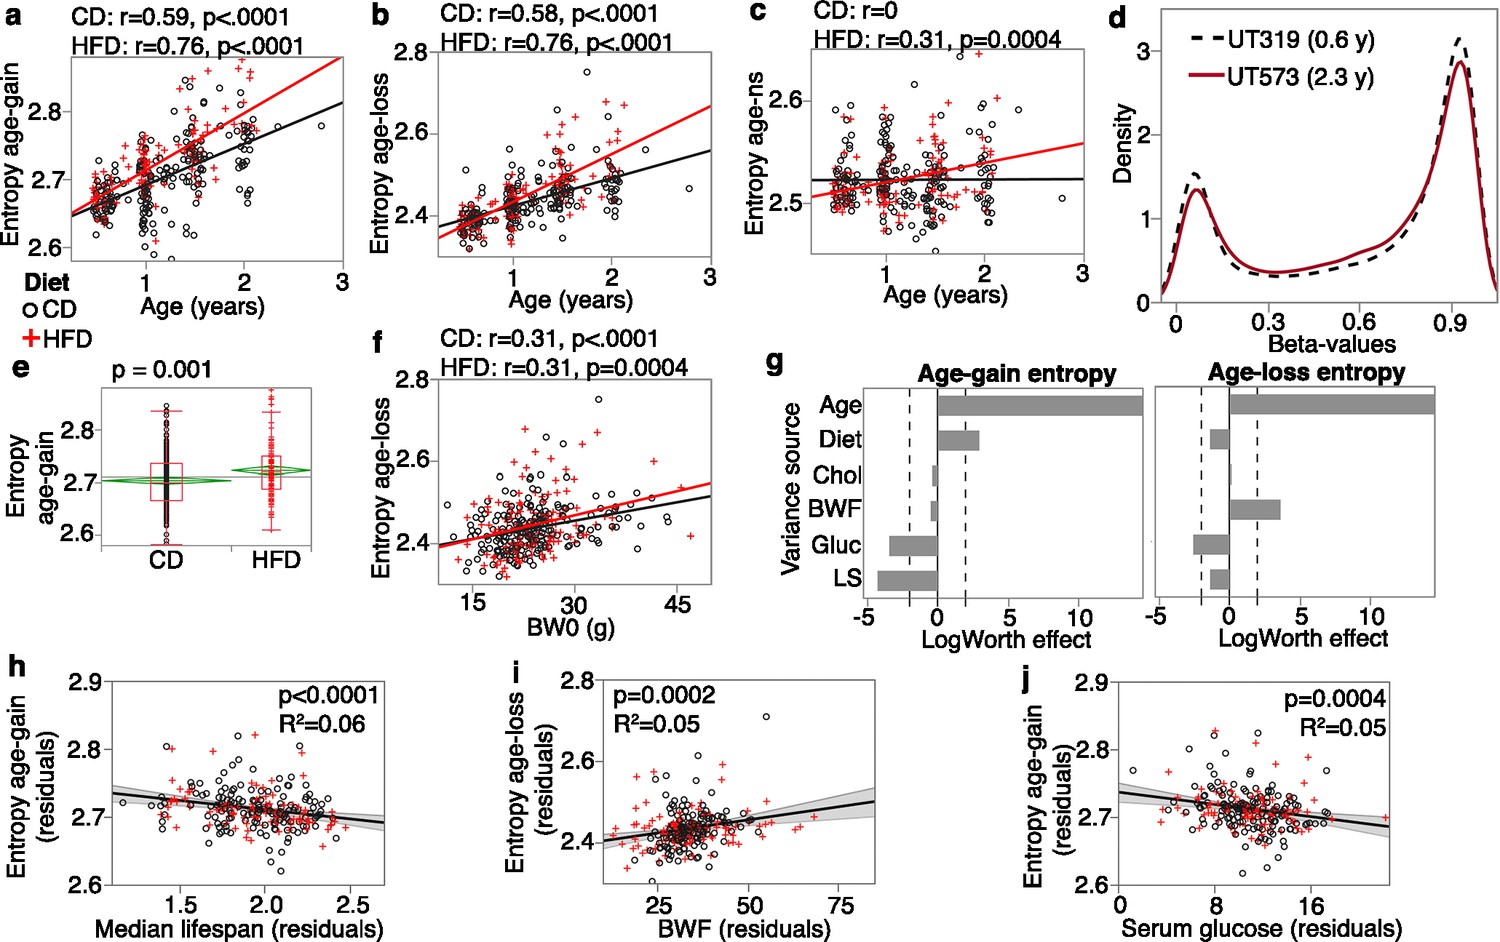
Entropy at age-associated CpGs.
Entropy values were calculated for the 5020 age-gain and 1523 age-loss CpGs separately. For both control diet (CD) and high-fat diet (HFD), there is a significant increase in entropy with age at the (a) age-gain and (b) age-loss CpGs. (c) The HFD mice also showed a slight increase in entropy at CpGs that were not strongly associated with age (age-ns). (d) The methylome-wide distribution of beta-values in a young adult mouse (0.6 years old; black dashed line) and an older mouse (2.3 years old; red line); both CD mice. The young mouse has higher peaks at the hypomethylated (closer to 0.1) and hypermethylated (around 0.9) beta-values compared to the older mouse. (e) The HFD group has higher entropy at the age-gain CpGs compared to the CD group. (f) Entropy at age-loss CpGs is higher with higher baseline weight (BW0). (g) Relative effects of predictor variables on entropy shown as logworth scores (-log10p). The dashed lines correspond to p=0.01. Positive values indicate positive regression estimates (for diet, positive value means higher in HFD). BWF, final weight; Chol, serum total cholesterol; Gluc, fasted glucose levels; LS, strain median lifespan. (h) The residual plot (adjusted for age, diet, BWF, glucose, cholesterol, and batch) shows the inverse association between entropy at age-gain sites and lifespan. Similar residual plots show the association between (i) BWF and age-loss entropy, and (j) between fasted serum glucose and age-gain entropy.
Figure 4 with 1 supplement
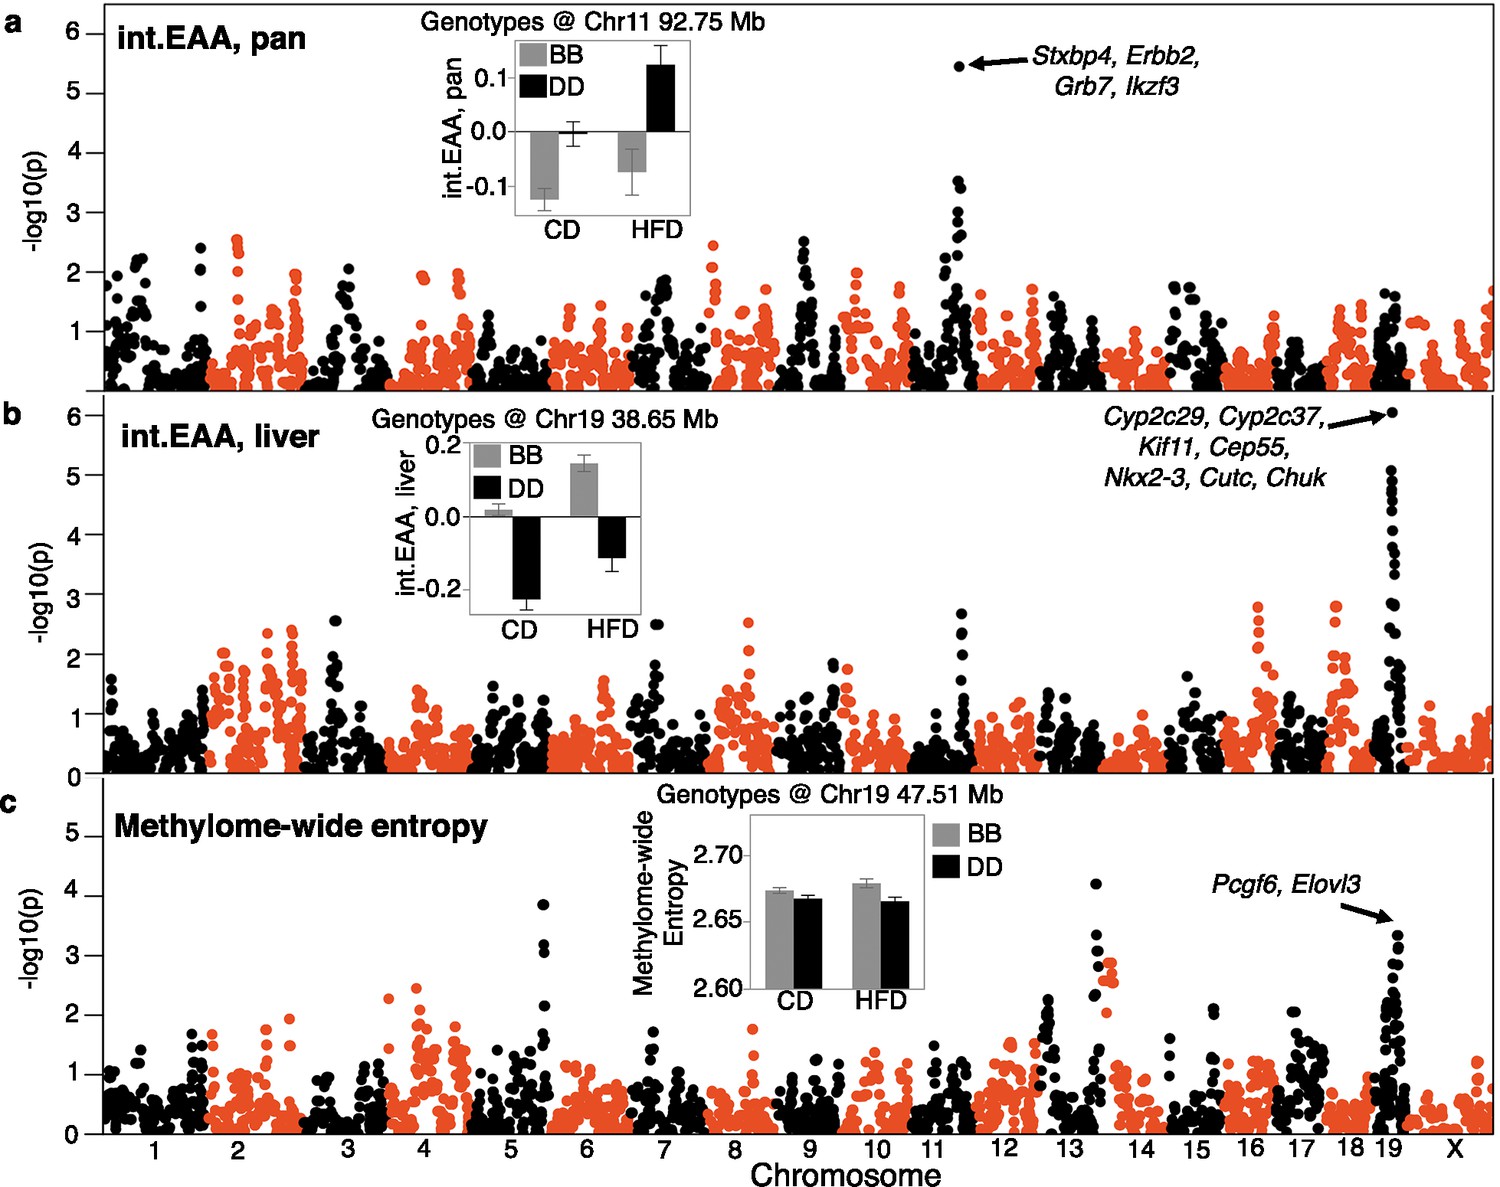
Quantitative trait locus (QTL) maps for the DNAm readouts.
The Manhattan plots represent the location of genotyped markers (x-axis) and linkage –log10p (y-axis). (a) The peak QTL for age acceleration from the pan-tissue interventional clock (int.EAA) is on chromosome (Chr) 11 at ~93 Mb. The inset shows the mean (± standard error) trait values for BXDs homozygous for the C57BL/6J allele (BB; gray) versus BXDs homozygous for the DBA/2J allele (DD; black) on control diet (CD) and high-fat diet (HFD). (b) The liver-specific int.EAA has a peak QTL on Chr19 (~38 Mb). Trait means by genotype at this locus are shown in inset; BB has higher age acceleration. (c) Linkage statistics are weaker for the methylome-wide entropy. However, there is a nominally significant linkage on the Chr19 locus, but the peak markers are at ~47.5 Mb. Here, the BB genotype has higher entropy.
Figure 4—figure supplement 1
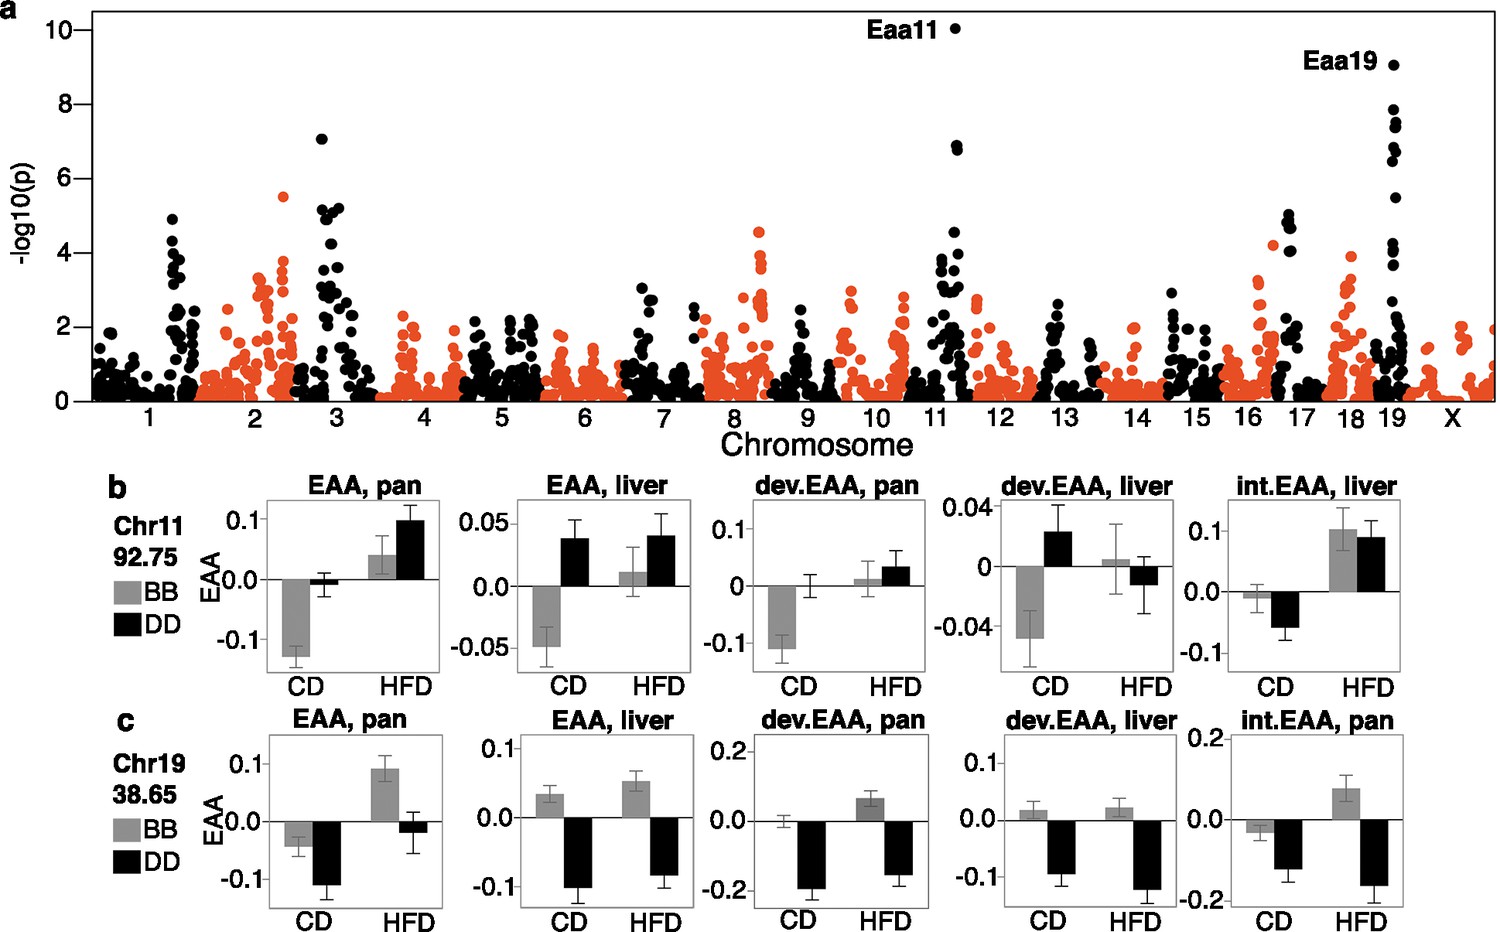
Consensus quantitative trait locus (QTL) mapping for epigenetic age acceleration (EAA).
(a) The Manhattan plot displays the combined meta p-values for EAA. These meta p-values are based on a simple p-value combination for the six EAA traits and are mainly to highlight regions with the highest consensus QTLs. The highest peaks are on chromosomes 11 (Eaa11) and 19 (Eaa19). (b) BXDs were segregated by genotype at a representative marker in Eaa11 (variant at 92.750 Mb). In the control diet group (CD), mean EAA (± standard error) is higher for mice with the DD genotype. Only the EAA derived from the liver interventional clock (int.EAA) shows no difference between the genotypes. (c) BXDs were segregated by the genotype at a marker in Eaa19 (38.650 Mb). Mean EAA is higher in the BB genotype, and this genotype effect is seen for all the clocks in both diets.
Figure 5
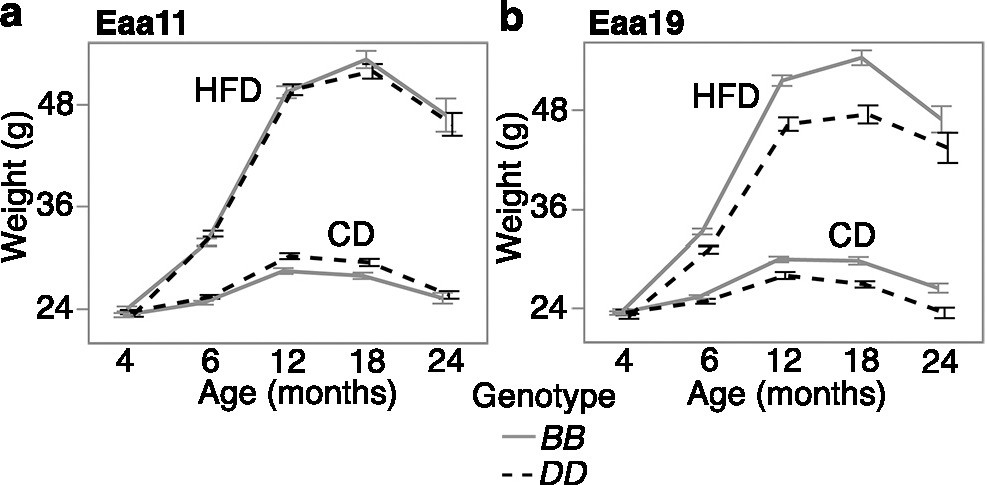
Body weight trajectory by diet and genotype.
Body weight was measured at regular age intervals (x-axis) from (a) 2112 BXD mice that were homozygous at the Eaa11 marker (DA0014408.4; 842 BB, 1279 DD) and (b) 1852 BXD mice that were homozygous at the proximal Eaa19 marker (rs48062674; 1252 BB, 600 DD). Mice were maintained on either control diet (CD) or high-fat diet (HFD). The graphs show the segregation of body weight over time by diet and genotype. Mean ± standard error; heterozygotes were excluded.
Figure 6 with 1 supplement
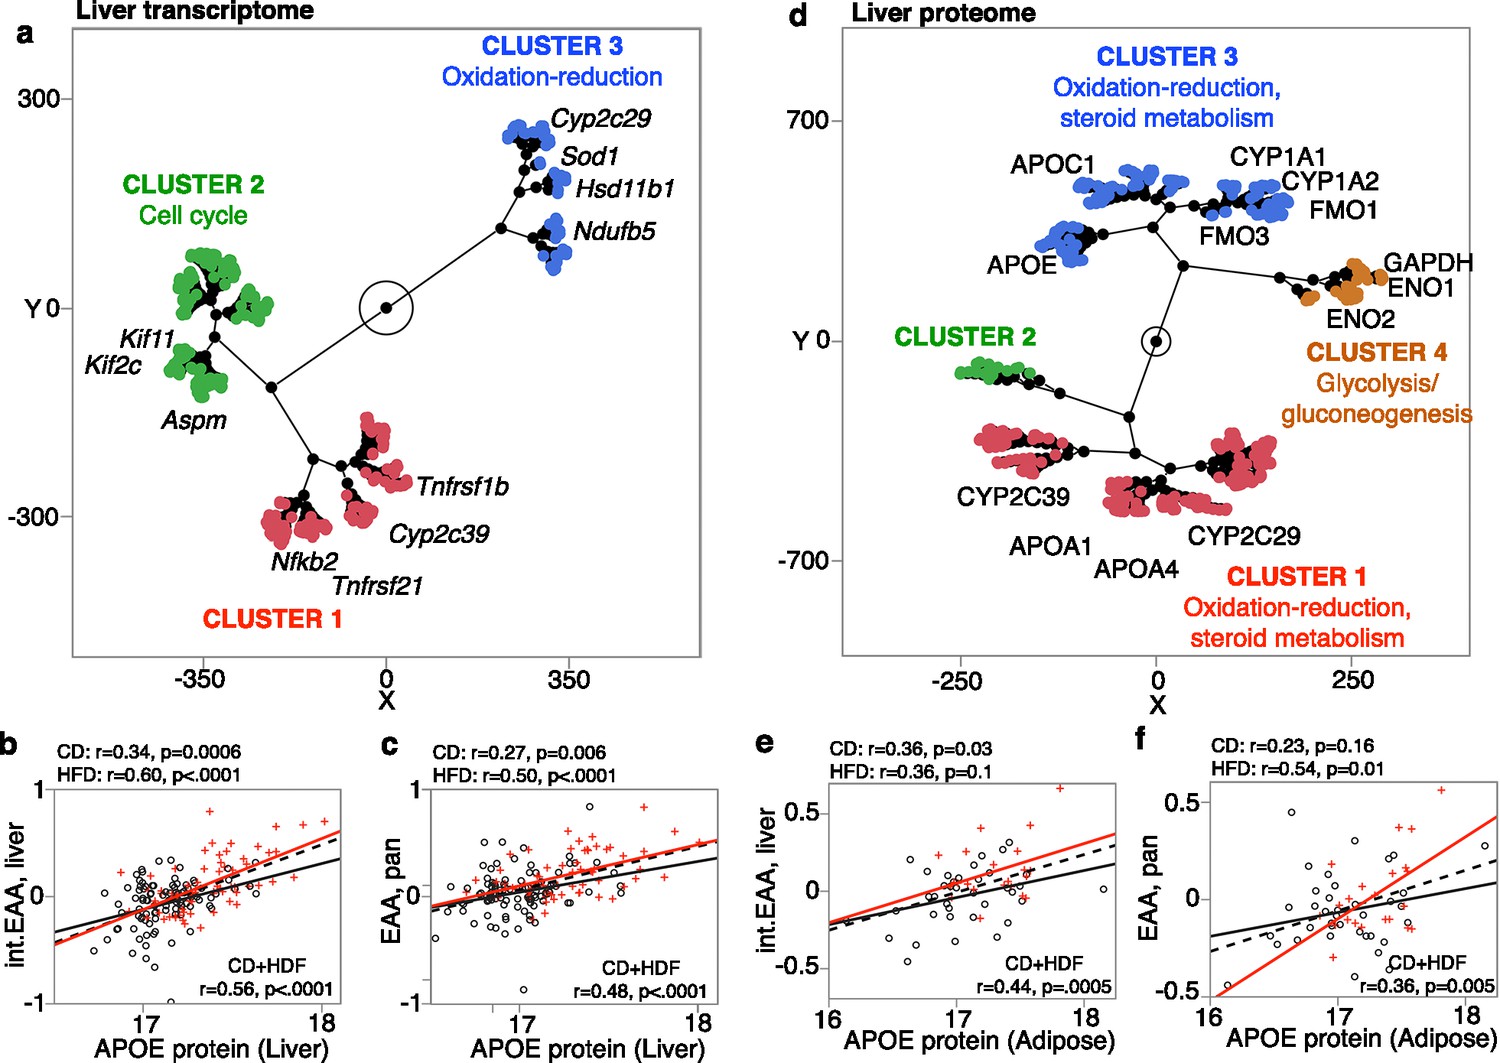
Gene expression correlates of epigenetic age acceleration (EAA).
(a) mRNAs that are correlated with the acceleration of both pan-tissue general clock (pan EAA) and liver interventional clock (liver int.EAA) were grouped based on unsupervised hierarchical clustering (HC). Few representative genes and gene ontologies are highlighted. For liver proteome, the level of APOE is the strongest correlate for both (b) liver int.EAA and (c) pan-tissue EAA. (d) For liver proteins that are correlated with both pan-tissue EAA and liver int.EAA, HC grouped the proteins into clusters enriched in oxidation-reduction and lipid metabolism, and a cluster enriched in glycogen metabolism. In adipose tissue, the expression level of the APOE protein is higher with higher age acceleration for both (e) liver int.EAA and (f) pan-tissue EAA.
Figure 6—figure supplement 1
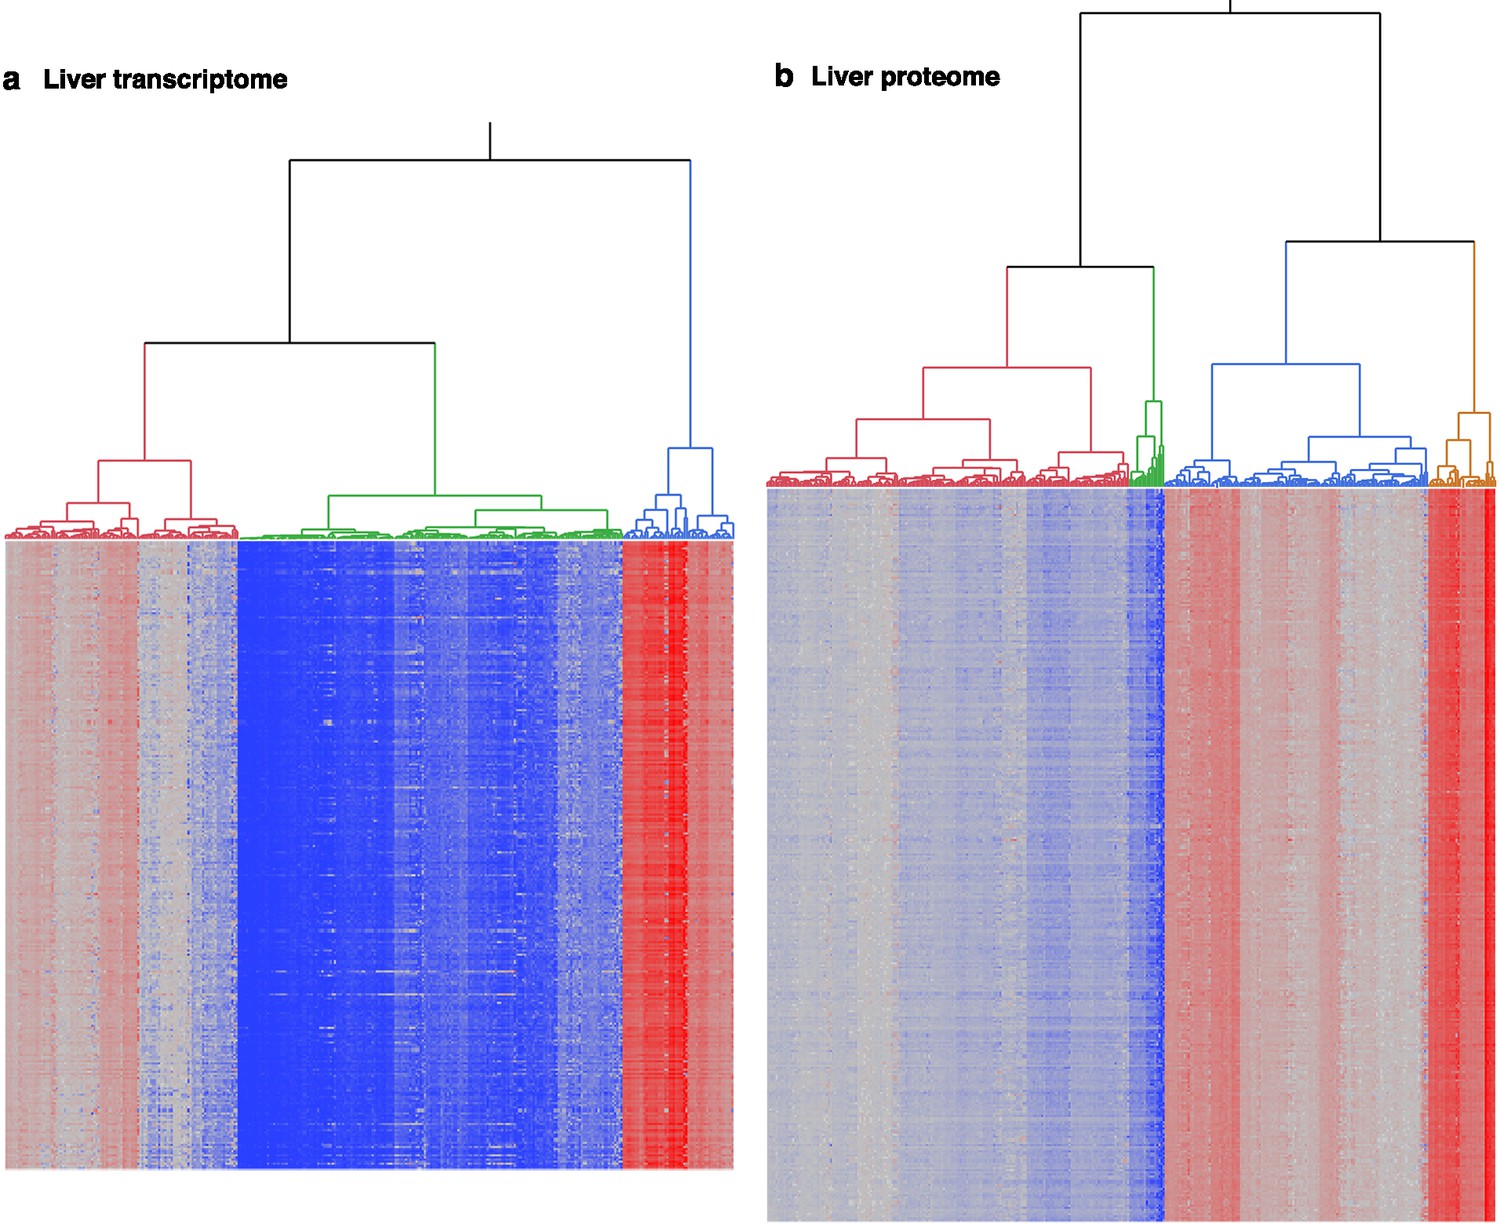
Hierarchical clustering heatmaps for the top expression correlates of epigenetic age acceleration.
The dendrograms represent the liver expression of (a) mRNA and (b) proteins that are correlated with age acceleration derived from both pan-tissue general clock and liver interventional clock.
Tables
Table 1
Chronological age prediction and correlation with methylome-wide entropy.
| Clock type | DNAmAge name | Tissue | r with age (n = 339)* | Age prediction median error | r with entropy(n = 339)*, † |
|---|---|---|---|---|---|
| Standard clocks | DNAmAge | Pan | 0.89 | 0.12 | 0.43 |
| Liver | 0.92 | 0.10 | 0.40 | ||
| Developmental clocks | dev.DNAmAge | Pan | 0.87 | 0.14 | 0.39 |
| Liver | 0.91 | 0.12 | 0.37 | ||
| Interventional clocks | int.DNAmAge | Pan | 0.85 | 0.17 | 0.29 |
| Liver | 0.86 | 0.15 | 0.47 |
-
*
p<0.0001.
-
†
Methylome-wide entropy calculated from ~28K CpGs.
Table 2
Association with diet and weight, and heritability of the epigenetic readouts.
| Type | EAA | Diet | Mean (SD) | Diet (p) | rBW0* | pBW0 | rBWF* | pBWF | h2 | Strain r† |
|---|---|---|---|---|---|---|---|---|---|---|
| Mouse clocks | EAA, pan | CD | –0.05 ± 0.21 | <0.0001 | 0.19 | 0.006 | 0.29 | <0.0001 | 0.49 | 0.54 |
| HFD | 0.07 ± 0.21 | 0.21 | 0.01 | 0.42 | <0.0001 | 0.50 | ||||
| EAA, liver | CD | 0 ± 0.17 | ns | 0.09 | ns | 0.20 | 0.003 | 0.40 | 0.73 | |
| HFD | 0.03 ± 0.14 | 0.22 | 0.01 | 0.49 | <0.0001 | 0.52 | ||||
| dev.EAA, pan | CD | –0.04 ± 0.23 | 0.004 | 0.09 | ns | 0.22 | 0.001 | 0.53 | 0.76 | |
| HFD | 0.03 ± 0.22 | 0.27 | 0.002 | 0.45 | <0.0001 | 0.61 | ||||
| dev.EAA, liver | CD | 0 ± 0.2 | ns | 0.19 | 0.002 | 0.29 | <0.0001 | 0.46 | 0.78 | |
| HFD | 0 ± 0.16 | 0.29 | 0.0007 | 0.47 | <0.0001 | 0.60 | ||||
| int.EAA, pan | CD | –0.05 ± 0.25 | 0.0003 | 0.03 | ns | 0.21 | 0.002 | 0.27 | 0.66 | |
| HFD | 0.06 ± 0.33 | 0.22 | 0.01 | 0.46 | <0.0001 | 0.45 | ||||
| int.EAA, liver | CD | –0.04 ± 0.22 | <0.0001 | 0.05 | ns | 0.18 | 0.01 | 0.59 | 0.80 | |
| HFD | 0.11 ± 0.25 | 0.27 | 0.002 | 0.58 | <0.0001 | 0.54 | ||||
| Entropy | - | CD | 2.67 ± 0.02 | ns | 0.09 | ns | 0.05 | ns | 0.31 | 0.24(ns) |
| HFD | 2.67 ± 0.02 | 0.15 | 0.09 | 0.15 | 0.09 | 0.32 |
-
CD, control diet; HFD, high-fat diet; EAA, epigenetic age acceleration; int, interventional; dev, developmental.
-
*
BW0 is body weight at about 4.5 months of age (n = 339; 210 CD and 129 HFD); BWF is final weight at tissue collection (1 HFD case missing data; n = 338; 210 CD and 128 HFD).
-
†
Pearson correlation between strain means for n = 29 BXD genotypes kept on CD and HFD.
Table 3
Marker-specific linkage analyses for epigenetic age acceleration and body weight trajectory.
| Linear regression* | |||||
|---|---|---|---|---|---|
| Predictor | Outcome | Estimate | Standard error | t ratio | p |
| Eaa11DA0014408.4[DD]Chr11, 92.750 Mb(133 BB cases, and 173 DD cases) | EAA, pan | 0.096 | 0.023 | 4.184 | 3.8E-05 |
| EAA, liver | 0.067 | 0.017 | 3.880 | 0.0001 | |
| dev.EAA, pan | 0.077 | 0.025 | 3.041 | 0.003 | |
| dev.EAA, liver | 0.037 | 0.020 | 1.878 | 0.06 | |
| int.EAA, pan | 0.153 | 0.029 | 5.278 | 2.5E-07 | |
| int.EAA, liver | –0.033 | 0.025 | –1.284 | 0.20 | |
| Eaa19rs48062674[DD]Chr19, 38.650 Mb(238 BB cases, and 67 DD cases) | EAA, pan | –0.083 | 0.028 | –2.954 | 0.003 |
| EAA, liver | –0.137 | 0.020 | –6.972 | 2.0E-11 | |
| dev.EAA, pan | –0.206 | 0.029 | –7.218 | 4.3E-12 | |
| dev.EAA, liver | –0.124 | 0.023 | –5.461 | 9.9E-08 | |
| int.EAA, pan | –0.143 | 0.035 | –4.028 | 7.1E-05 | |
| int.EAA, liver | –0.250 | 0.027 | –9.238 | 4.6E-18 | |
| Mixed model for longitudinal change in body weight† | |||||
| Predictor | Outcome | Estimate | Standard error | t ratio | p |
| Eaa11DA0014408.4[DD]Number of observations = 6885; Number of individuals = 2112 | Body weight | 0.619 | 0.345 | 1.794 | 0.07 |
| Eaa19rs48062674[DD]Number of observations = 6132; Number of individuals = 1852 | Body weight | –1.847 | 0.374 | –4.945 | 7.6E-07 |
-
int, interventional; dev, developmental; EAA, epigenetic age acceleration.
-
*
Regression model: lm(EAA ~ genotype + diet).
-
†
lmer(weight ~age + diet + genotype + (1|mouseID)).
Additional files
-
Supplementary file 1
Individual-level sample information.
- https://cdn.elifesciences.org/articles/75244/elife-75244-supp1-v2.xlsx
-
Supplementary file 2
CpGs and coefficients for the mouse clocks.
- https://cdn.elifesciences.org/articles/75244/elife-75244-supp2-v2.csv
-
Supplementary file 3
Covariates of the DNA methylation-based readouts.
- https://cdn.elifesciences.org/articles/75244/elife-75244-supp3-v2.xlsx
-
Supplementary file 4
Supplementary Tables 4a–c.
(a) Sex differences in epigenetic aging after correction for body weight. (b) Pearson correlations between epigenetic age acceleration and strain-level longevity summaries. (c) High-priority candidate genes in quantitative trait locus for epigenetic age acceleration.
- https://cdn.elifesciences.org/articles/75244/elife-75244-supp4-v2.docx
-
Supplementary file 5
Multivariable regression analysis of epigenetic age acceleration.
- https://cdn.elifesciences.org/articles/75244/elife-75244-supp5-v2.xlsx
-
Supplementary file 6
Epigenome-wide association study results and annotations for 27,996 CpG probes.
- https://cdn.elifesciences.org/articles/75244/elife-75244-supp6-v2.csv
-
Supplementary file 7
Multivariable regression analysis of entropy by age-effect.
- https://cdn.elifesciences.org/articles/75244/elife-75244-supp7-v2.xlsx
-
Supplementary file 8
Genomic regions enrichments analyses for the differentially methylated CpGs.
- https://cdn.elifesciences.org/articles/75244/elife-75244-supp8-v2.csv
-
Supplementary file 9
Enrichment/depletion in genomic regions and chromatin states for the differentially methylated CpGs.
- https://cdn.elifesciences.org/articles/75244/elife-75244-supp9-v2.xlsx
-
Supplementary file 10
Quantitative trait locus analysis of epigenetic age acceleration and methylome-wide entropy.
- https://cdn.elifesciences.org/articles/75244/elife-75244-supp10-v2.xlsx
-
Supplementary file 11
Positional candidate genes in Eaa11 and Eaa19.
- https://cdn.elifesciences.org/articles/75244/elife-75244-supp11-v2.csv
-
Supplementary file 12
Transcriptome and proteome analysis.
(a) Top 2000 liver transcriptome-wide correlates of liver int.EAA and pan-tissue EAA. (b) Functional enrichment among gene expression correlates of pan-tissue general clock (pan-tissue EAA). (c) Functional enrichment among gene expression correlates of liver interventional clock (liver int.EAA). (d) Top 2000 liver proteome correlates of liver int.EAA and pan-tissue EAA. EAA, epigenetic age acceleration.
- https://cdn.elifesciences.org/articles/75244/elife-75244-supp12-v2.xlsx
-
Supplementary file 13
Data access.
- https://cdn.elifesciences.org/articles/75244/elife-75244-supp13-v2.xlsx
-
Transparent reporting form
- https://cdn.elifesciences.org/articles/75244/elife-75244-transrepform1-v2.docx
Download links
A two-part list of links to download the article, or parts of the article, in various formats.
Downloads (link to download the article as PDF)
Open citations (links to open the citations from this article in various online reference manager services)
Cite this article (links to download the citations from this article in formats compatible with various reference manager tools)
Genetic loci and metabolic states associated with murine epigenetic aging
eLife 11:e75244.
https://doi.org/10.7554/eLife.75244


