The TFIIH complex is required to establish and maintain mitotic chromosome structure
- Laboratory of Biochemistry & Molecular Biology, National Cancer Institute, NIH, United States
- Laboratory of Cell Biology, National Cancer Institute, NIH, United States
Figures
Figure 1 with 3 supplements
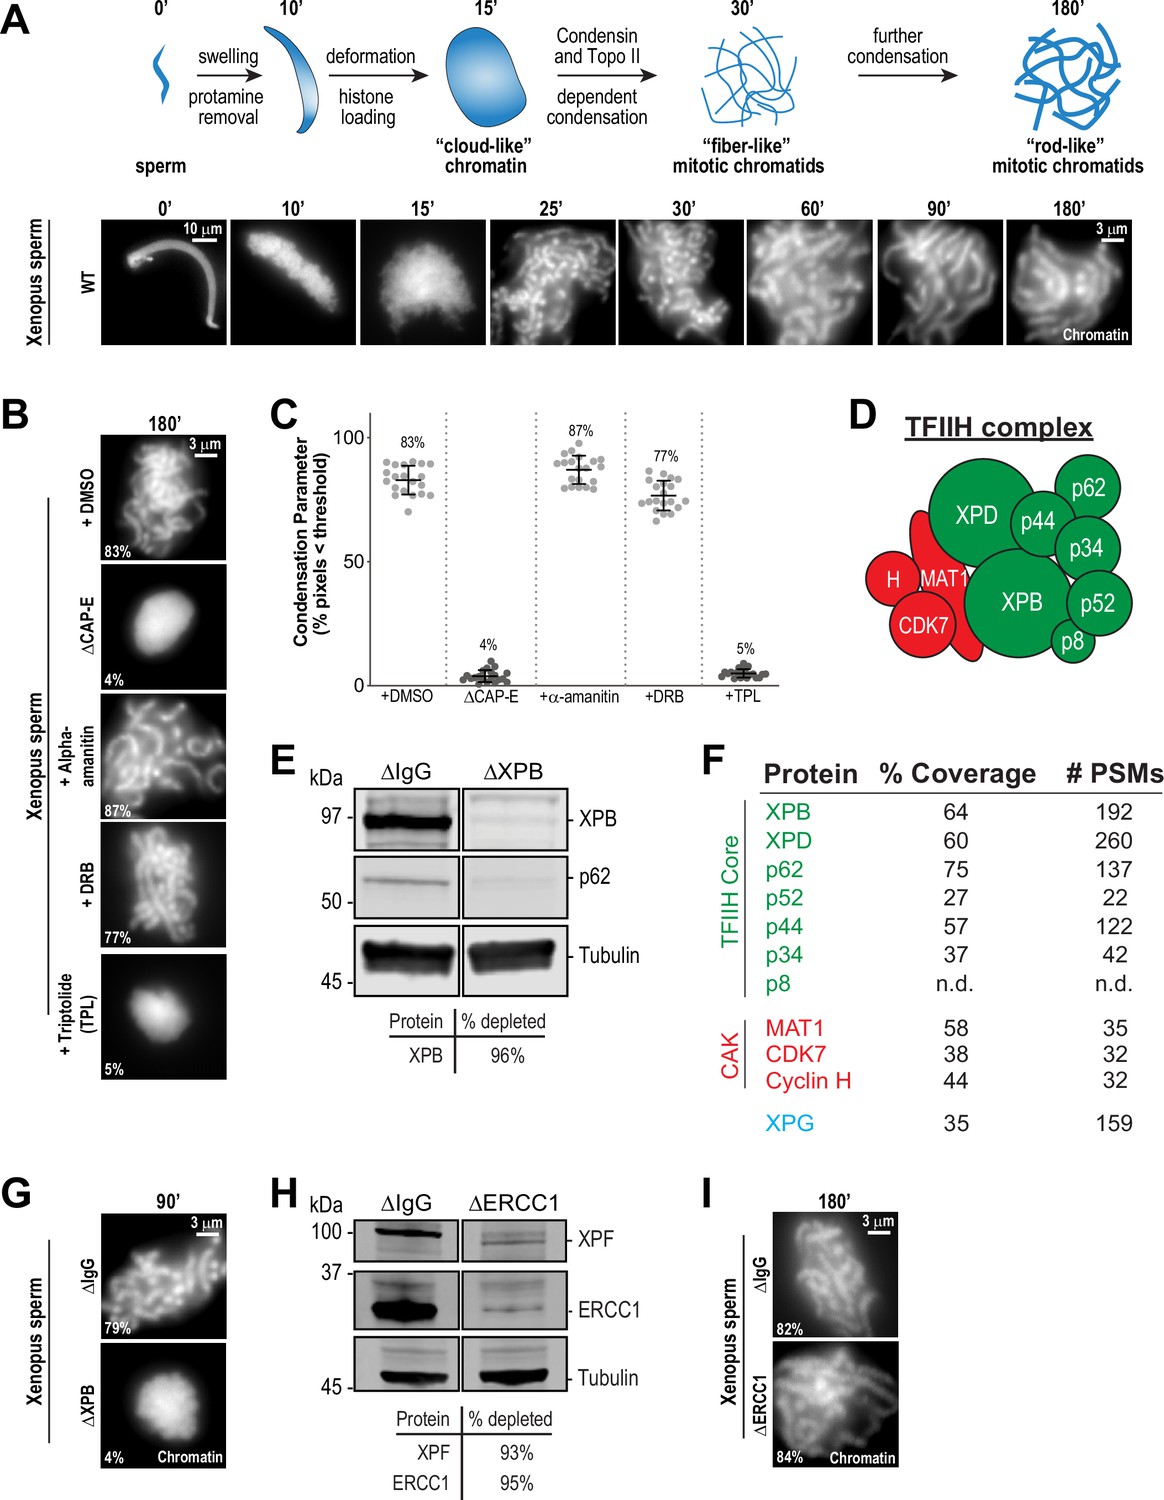
The TFIIH complex is required for chromosome condensation in Xenopus egg extracts.
(A) Top: Schematic of chromatid assembly in M-phase high-speed supernatant (HSS) extract. Bottom: Representative fluorescence images of fixed samples from a chromatid assembly reaction taken at indicated timepoints after sperm addition. Chromatin was stained with Hoechst. (B) Representative fluorescence images of chromatid assembly at steady state (180 min after sperm addition) in the presence of indicated inhibitors. Each drug or DMSO control was added at 25 min to exclude effects on the protamine-histone exchange process. Final inhibitor concentrations: Triptolide (50 μM), DRB (100 μM), and a-amanitin (54 μM). See Figure 1—figure supplement 1A for CAP-E depletion. Mean condensation parameters for each condition are indicated in lower left corner of each image. (C) Scatter plot of the percentage of pixels below a threshold of 35% of image maximum fluorescence intensity (the condensation parameter), which measures the progressive change in the fluorescence intensity distribution that occurs during condensation, for each condition. Error bars represent SD, and the mean values are indicated. n = 20 structures for each condition. Two biological replicates were performed, quantified structures are from a single experiment. (D) Schematic of the TFIIH complex. TFIIH core complex is green, CAK subcomplex in red. (E) Western blot for XPB, p62, and Tubulin in IgG or XPB-depleted extracts. (F) TFIIH complex members that interact with XPB in M-phase HSS extract, as identified by mass spectrometry. Purifications were performed in the absence of chromatin. PSMs = peptide spectrum matches. (G) Representative fluorescence images of chromatid assembly 90 min after sperm addition in IgG or XPB depleted extracts. Chromatin was stained with Hoechst. (H) Western blot for XPF, ERCC1, and Tubulin in IgG or ERCC1-depleted extracts. (I) Representative fluorescence images of chromatid assembly 180 min after sperm addition in IgG or ERCC1-depleted extracts. Chromatin was stained with Hoechst.
-
Figure 1—source data 1
Source data for Figure 1E and H.
- https://cdn.elifesciences.org/articles/75475/elife-75475-fig1-data1-v2.zip
Figure 1—figure supplement 1
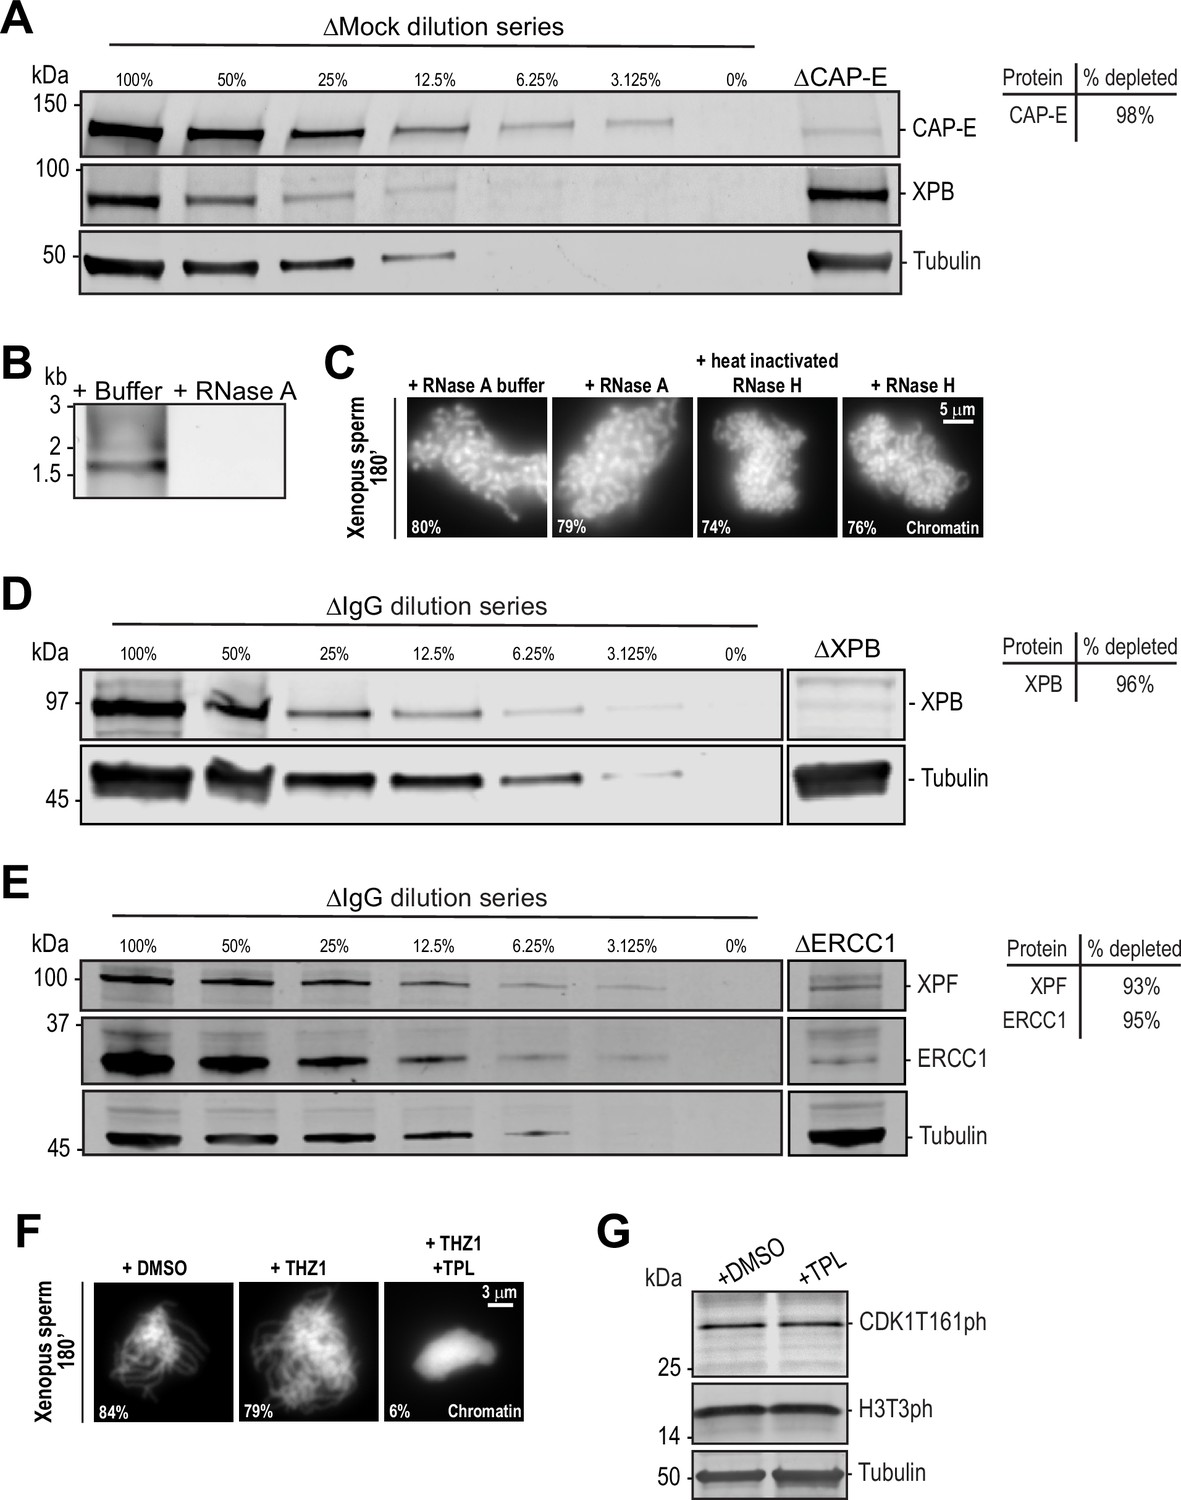
Immunodepletions and the effects of RNases and various transcription inhibitors on chromosome condensation and cell cycle state.
(A) Western blot for CAP-E, XPB, and Tubulin in Mock or CAP-E depleted extracts. Dilution series of Mock-depleted extracts was used to calculate the % depletion of CAP-E using quantitative fluorescence. (B) 1% agarose gel stained with SYBR safe stain showing RNase A dependent removal of total RNAs from high-speed supernatant egg extracts. (C) Representative fluorescence images of chromatid assembly at steady state (180 min after sperm addition) in the presence of indicated buffers and enzymes. See Materials and methods for details. Note that the high salt in the RNase H buffer causes morphological changes to chromatids regardless of activity. Mean condensation parameters for each condition are indicated in lower left corner of each image. (D) Western blot for XPB and Tubulin in IgG or XPB-depleted extracts. Dilution series of IgG-depleted extracts was used to calculate the % depletion of XPB using quantitative fluorescence. (E) Western blot for XPF, ERCC1, and Tubulin in IgG or ERCC1-depleted extracts. Dilution series of IgG-depleted extracts was used to calculate the % depletion of ERCC1 and XPF using quantitative fluorescence. (F) Representative fluorescence images of chromatid assembly at steady state (180 min after sperm addition) in the presence of DMSO, 30 μM CDK7 inhibitor THZ1, or 30 μM THZ1 and 50 μM triptolide (TPL). (G) Triptolide does not affect CDK1 activation or maintenance of M phase. Western blot for CDK1 T161ph, histone H3T3ph, and Tubulin in M phase HSS extracts in the presence of DMSO or 50 μM triptolide. Both CDK1T161ph (a CDK7 substrate) and H3T3ph are only highly phosphorylated in M phase, and their appearance is not affected by triptolide treatment.
-
Figure 1—figure supplement 1—source data 1
Source data for Figure 1—figure supplement 1A, B,D, E, G.
- https://cdn.elifesciences.org/articles/75475/elife-75475-fig1-figsupp1-data1-v2.zip
Figure 1—figure supplement 2
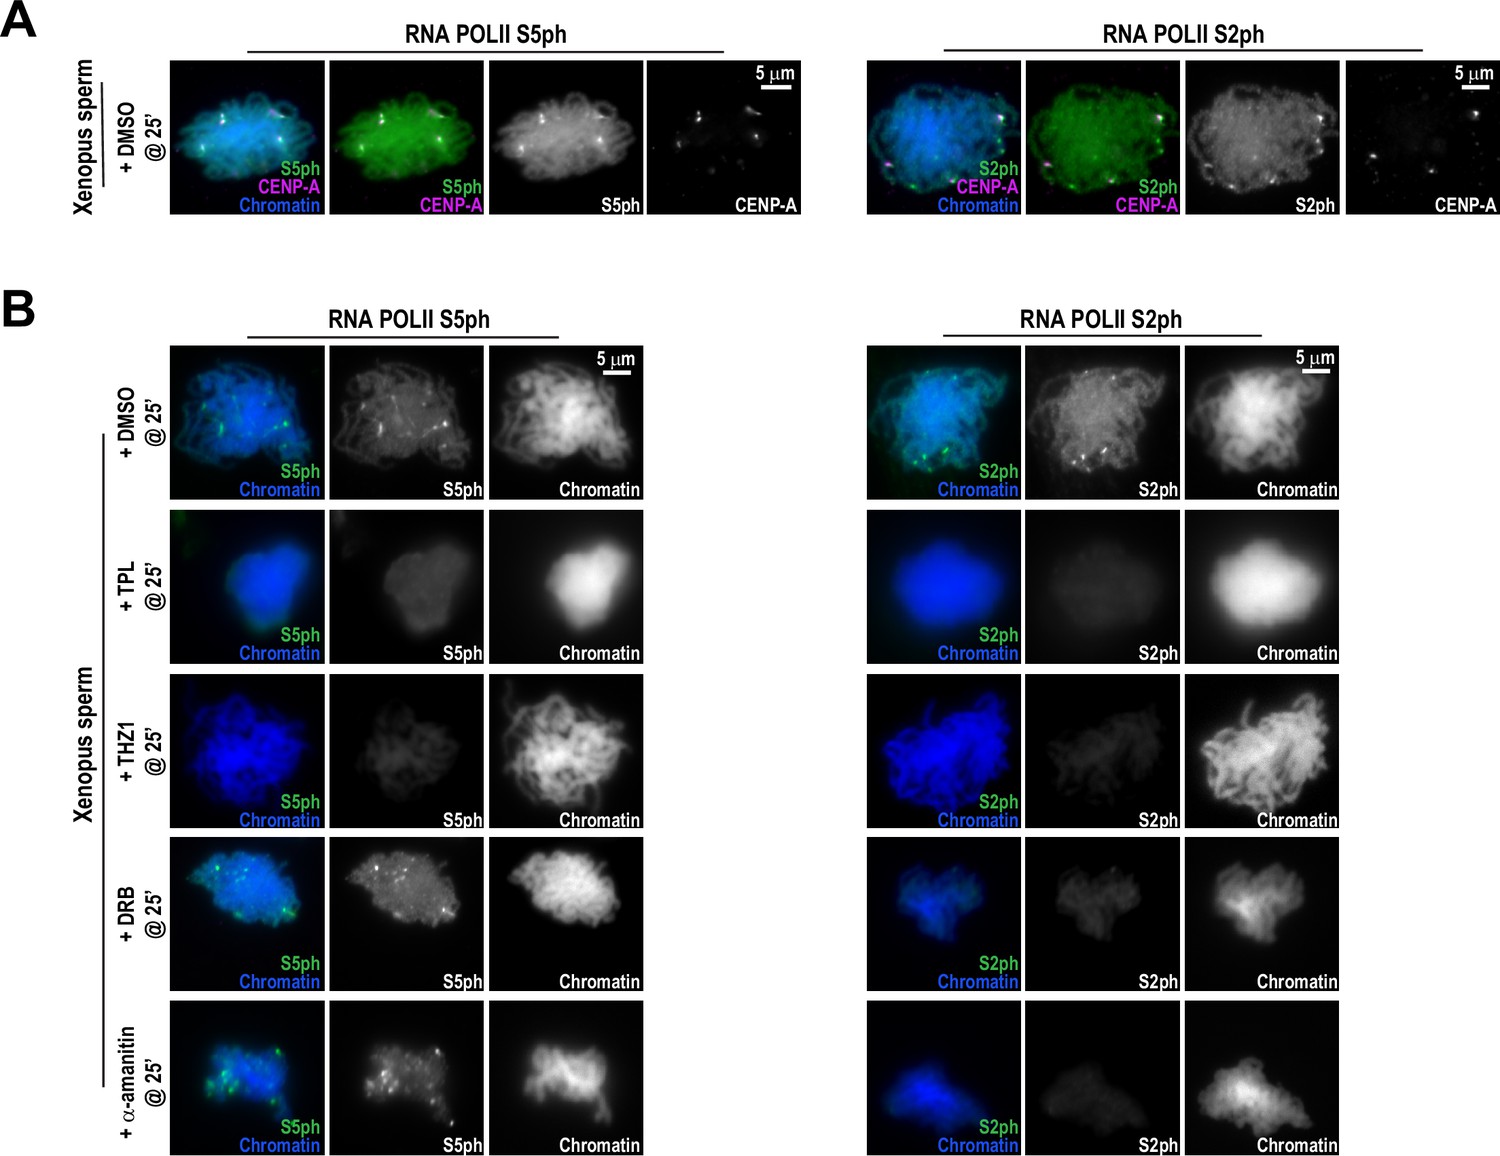
Effects of various transcription inhibitors on RNA Polymerase II C-terminal phosphorylation at centromeres.
(A) Representative immunofluorescence images of Xenopus sperm nuclei incubated in HSS extracts for 180 min. DMSO was added at 25 min as a control. Chromatids were labeled with Hoechst, either anti-Pol II S5ph (paused) or anti-Pol II S2ph (elongating), and co-stained with anti-CENP-A antibodies. (B) Representative immunofluorescence images of Xenopus sperm nuclei incubated in DMSO, triptolide (TPL), THZ1, DRB, or alpha-amanitin treated HSS extracts for 180 min. All inhibitors were added 25 min after sperm addition. Chromatids were labeled with Hoechst, anti-Pol II S5ph, or anti-Pol II S2ph antibodies.
Figure 1—figure supplement 3
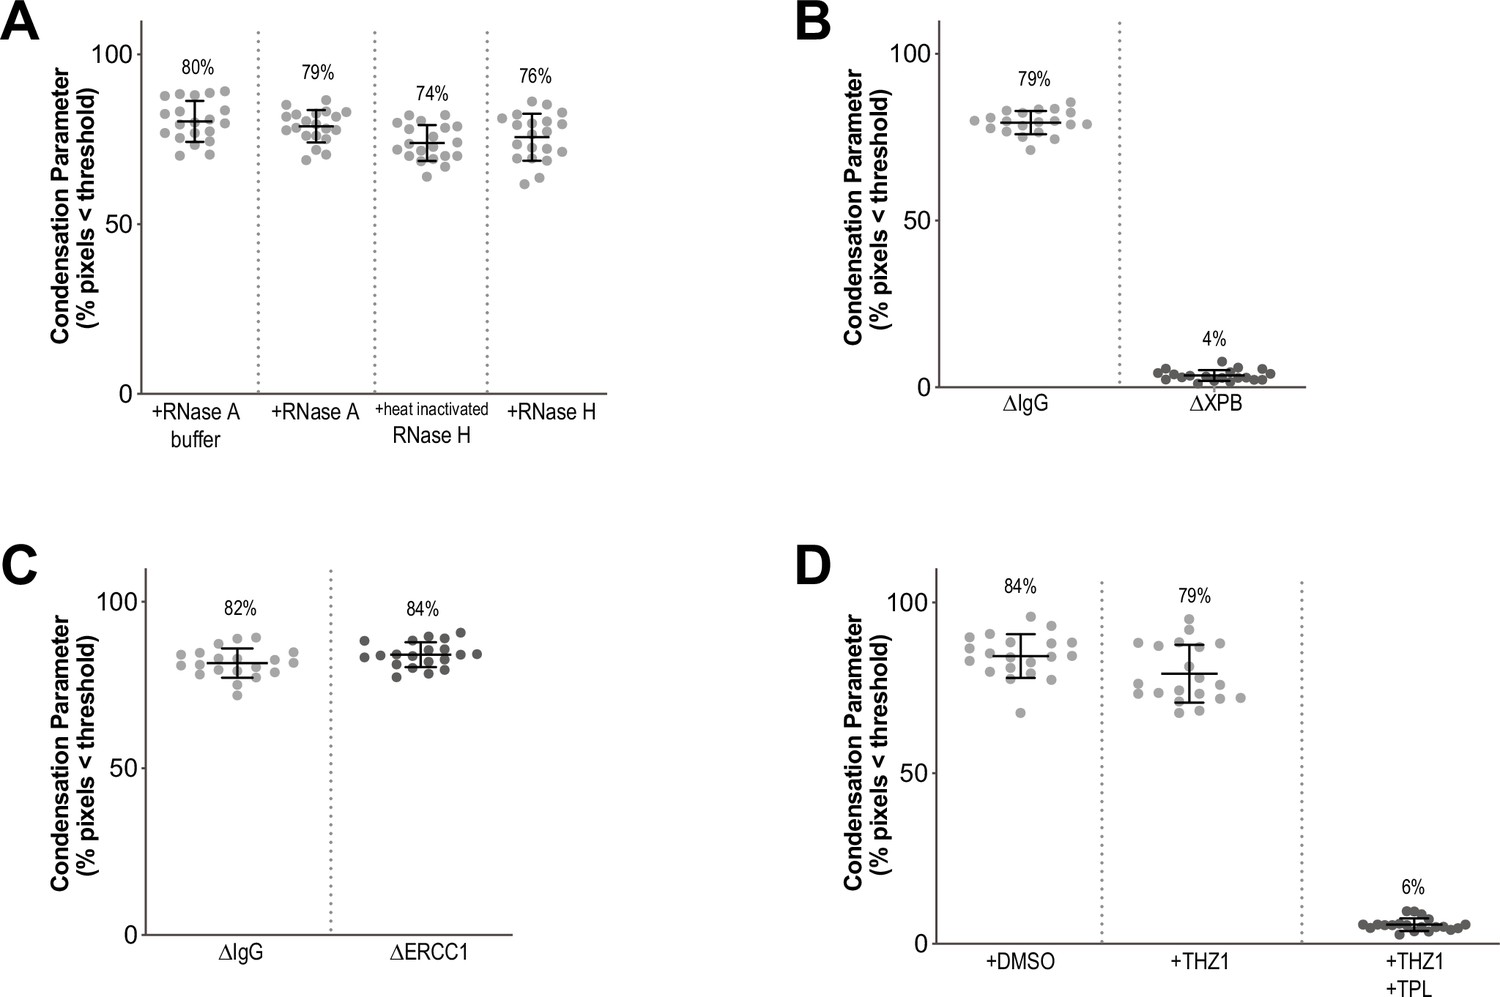
Condensation parameters.
(A–D) Scatter plots of the percentage of pixels below a threshold of 35% of image maximum fluorescence intensity (the condensation parameter), for indicated conditions in Figure 1 and Figure 1—figure supplement 1. Error bars represent SD, and the mean values are indicated. n = 20 structures for each condition. Two biological replicates were performed, quantified structures are from a single experiment.
Figure 2 with 2 supplements
Continuous TFIIH activity is required to maintain chromosome structure.
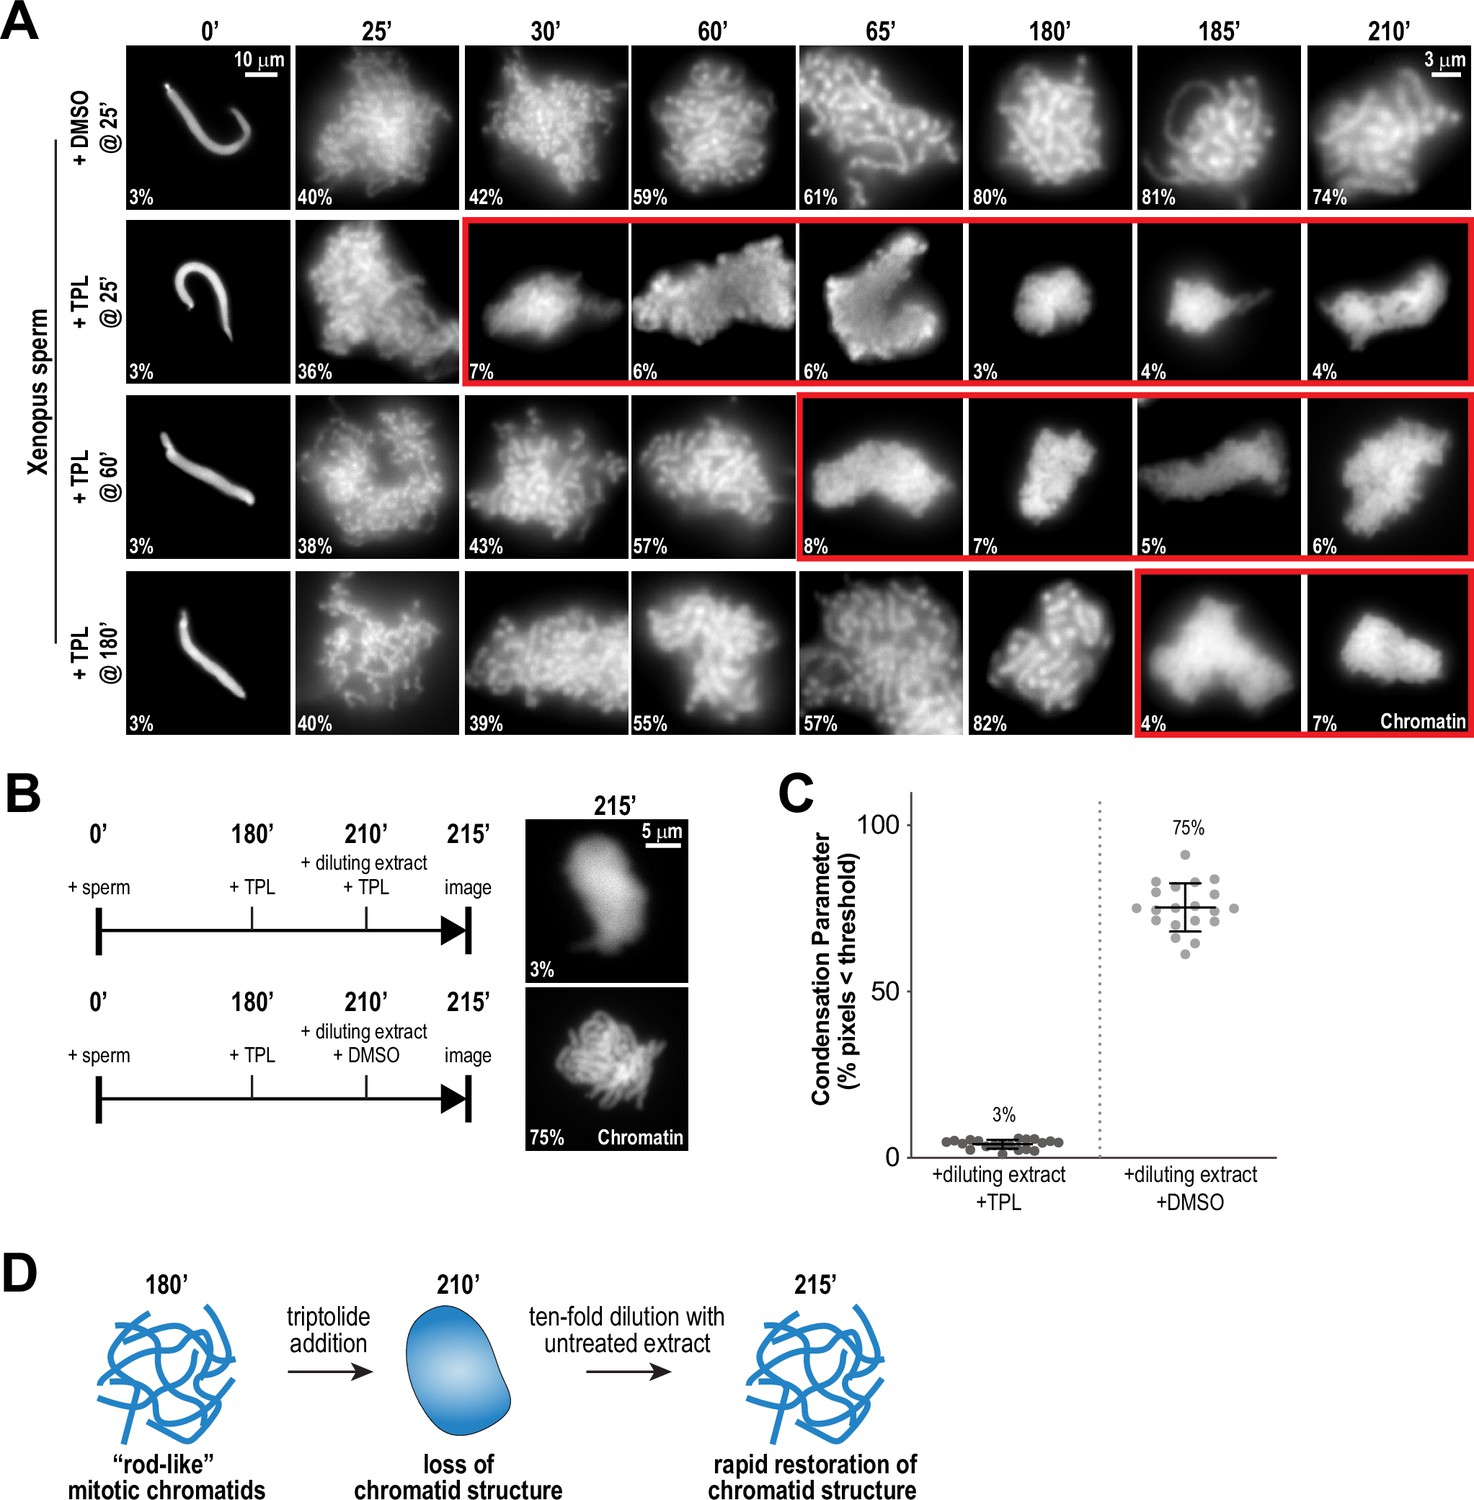
(A) Representative fluorescence images of chromatid assembly reactions sampled at indicated timepoints. DMSO or triptolide (TPL) were added at indicated times, immediately after sample retrieval for imaging. Chromatin was stained with Hoechst. Red boxes indicate representative images of decondensed chromosomes after triptolide addition. Mean condensation parameters for each condition are indicated in lower left corner of each image, see Figure 2—figure supplement 1A for more details. (B) Representative fluorescence images of chromatid masses fixed and spun onto coverslips 215 min after sperm addition, subjected to the indicated manipulations. Nuclei were incubated in extracts for 180 min to allow for the formation of fully condensed chromatids, followed by addition of DMSO or triptolide. After 30 min of incubation with DMSO/triptolide, reactions were diluted 10-fold with extract containing DMSO or triptolide, and further incubated for 5 min before taking samples for imaging. See Figure 2—figure supplement 2 for additional controls. Chromatin was stained with Hoechst. (C) Scatter plots of the percentage of pixels below a threshold of 35% of image maximum fluorescence intensity (the condensation parameter), for each condition in (B). Error bars represent SD, and the mean values are indicated. n = 20 structures for each condition. Two biological replicates were performed, quantified structures are from a single experiment. (D) Schematic illustrating the effects of triptolide addition and dilution on chromosome structure maintenance and reformation.
Figure 2—figure supplement 1
Condensation parameters of condensation kinetics after DMSO or Triptolide treatment.
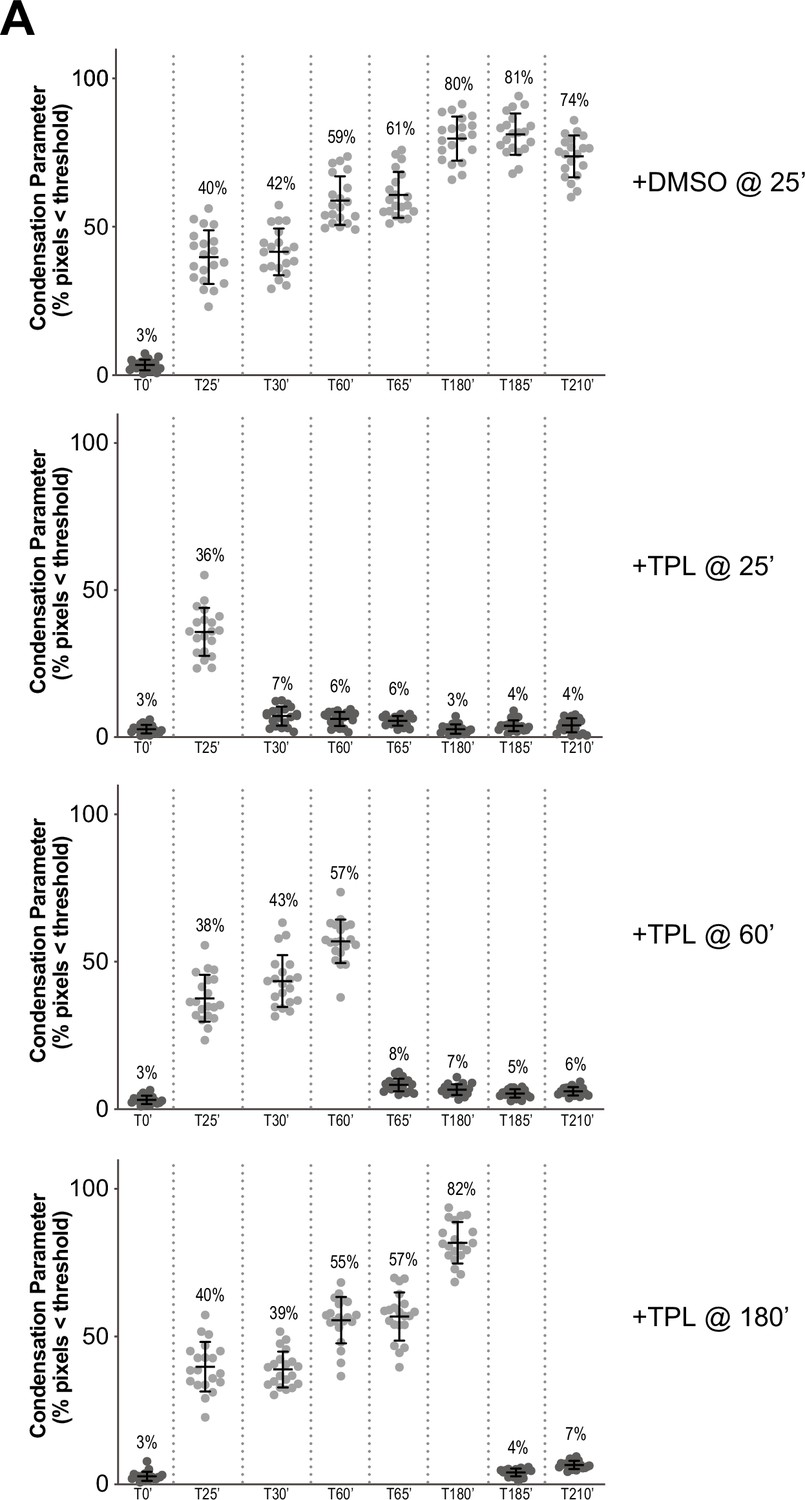
(A) Scatter plots of the percentage of pixels below a threshold of 35% of image maximum fluorescence intensity (the condensation parameter), for each drug condition and indicated time point. Error bars represent SD, and the mean values are indicated. n = 20 structures for each condition. Two biological replicates were performed, quantified structures are from a single experiment.
Figure 2—figure supplement 2
Continuous TFIIH activity is required to maintain chromosome structure and condensin levels on chromatin.
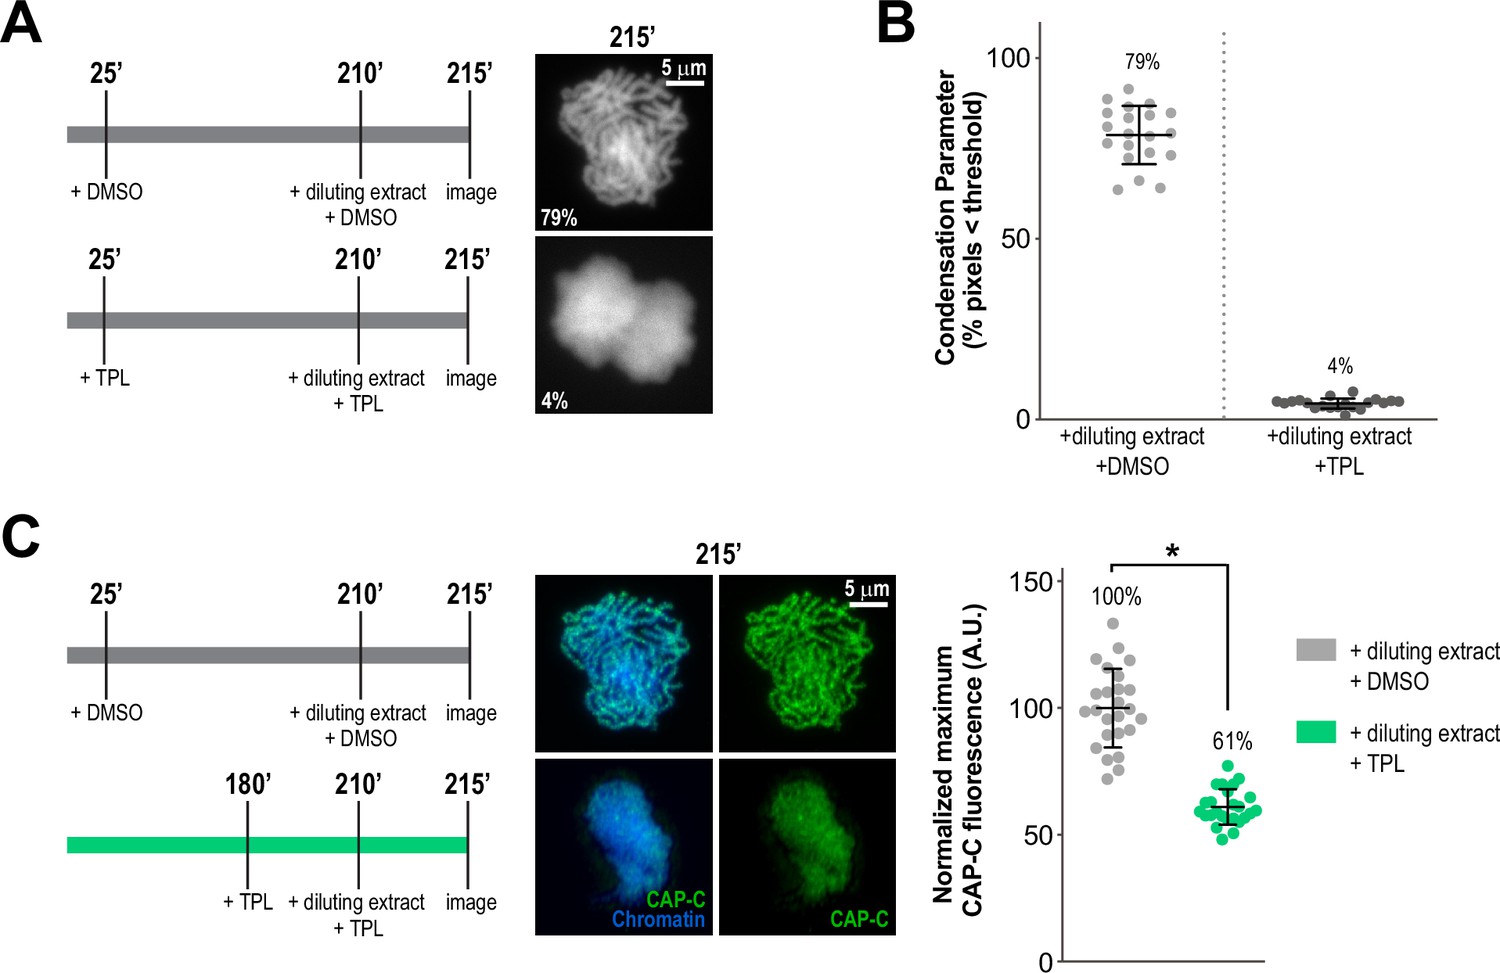
(A) Representative fluorescence images of Xenopus sperm nuclei incubated in extracts at indicated timepoints. DMSO or Triptolide were added 25 min after addition of nuclei, and extracts were diluted 10-fold with extract containing DMSO or Triptolide at 210 min after nuclei addition, and further incubated for 5 min before imaging. Chromatin was stained with Hoechst. (B) Scatter plots of the percentage of pixels below a threshold of 35% of image maximum fluorescence intensity (the condensation parameter), for each condition in (A). Error bars represent SD, and the mean values are indicated. n = 20 structures for each condition. Two biological replicates were performed, quantified structures are from a single experiment. (C) Condensin levels decrease after treatment of condensed chromatids with triptolide for 35 min. Left: Schematic of experimental conditions, top condition is from (A), bottom condition is from Figure 2B. Middle: Representative immunofluorescence images of Xenopus sperm nuclei from indicated experiments. Imaging was performed 215 min after nuclei addition. Chromatids were labeled with Hoechst and anti-CAP-C (condensin I & II) antibodies. Right: Quantification of fluorescence intensity of CAP-C on chromatin, normalized to DMSO. n = 50 structures for each condition. Error bars represent SD, and asterisks indicate a statistically significant difference (*, p < 0.001). A.U., arbitrary units. Two biological replicates were performed, quantified structures are from a single experiment.
Figure 3 with 1 supplement

The TFIIH complex is required for the enrichment of condensins on chromosomes.
(A) Representative immunofluorescence images of Xenopus sperm nuclei incubated with DMSO or triptolide (TPL) treated extracts for 180 min. Chromatids were labeled with Hoechst and anti-XPB, anti-CAP-D3 (condensin II), anti-CAP-C (condensin I & II), anti-CAP-E (condensin I and II), anti-SUPT16H (FACT complex), or anti-Topo II antibodies. Images of individual chromatids are shown in insets. (B) Quantification of fluorescence intensity of indicated proteins from experiment in (A), normalized to DMSO. n = 50 structures for each condition. Error bars represent SD, and asterisks indicate a statistically significant difference (*, p < 0.001), NS indicates no statistical significance. A.U., arbitrary units. Two biological replicates were performed, quantified structures are from a single experiment.
Figure 3—figure supplement 1
The TFIIH complex is required for the enrichment of condensins on chromosomes.
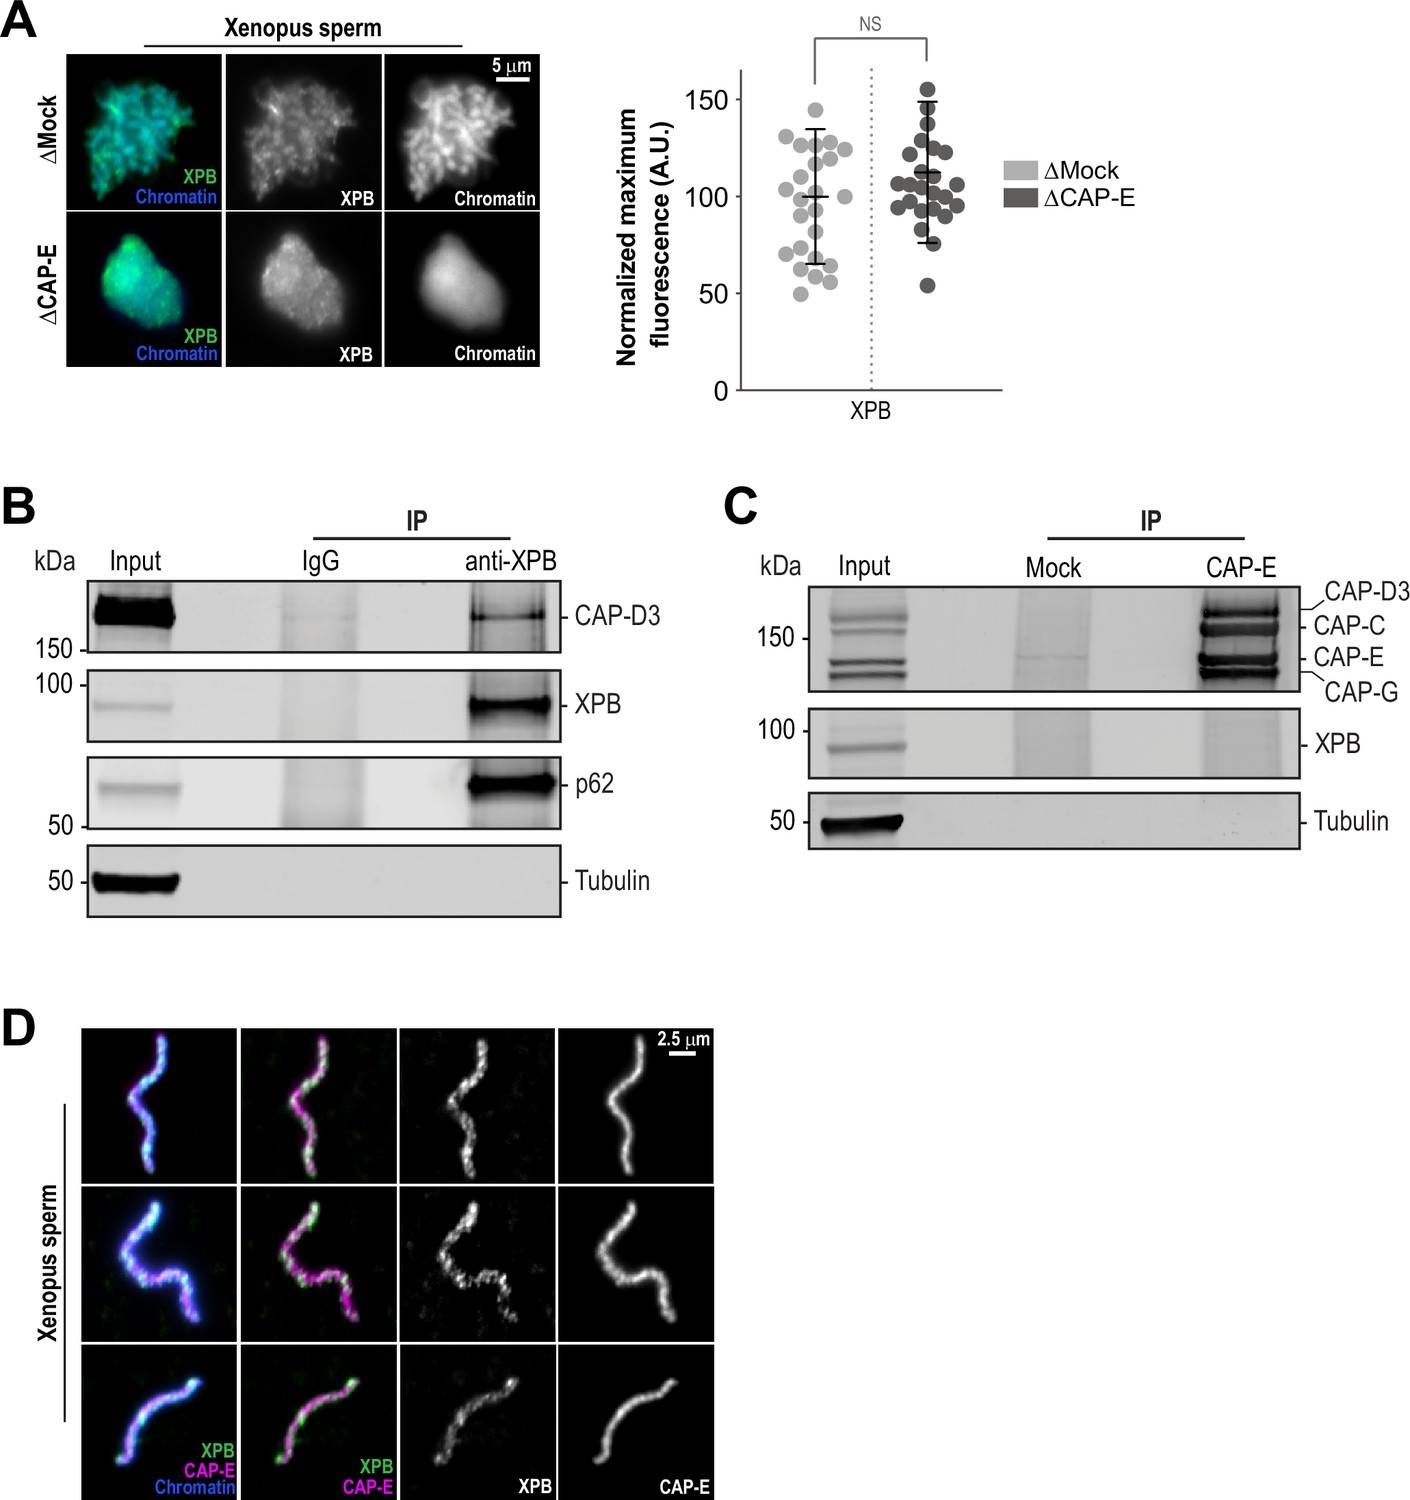
(A) Left: Representative immunofluorescence images of Xenopus sperm nuclei incubated with Mock or CAP-E depleted extracts for 180 min. Chromatids were labeled with Hoechst and anti-XPB antibodies. Right: Quantification of fluorescence intensity of XPB on chromatin, normalized to Mock depleted condition. n = 24 structures for each condition. Error bars represent SD, and ‘NS’ indicates no statistically significant difference (p > 0.001). A.U., arbitrary units. Two biological replicates were performed, quantified structures are from a single experiment. (B) Western blot for indicated proteins that copurify with anti-XPB or IgG beads isolated from HSS extracts. IP, immunoprecipitate. (C) Western blot for indicated proteins that copurify with anti-CAP-E or Mock-treated beads isolated from HSS extracts. For condensin subunit detection, the blot was probed simultaneously with the indicated antibodies. Beads were coupled to either anti-CAP-E or pre-immune serum (“Mock”) and processed as indicated in the methods. IP, immunoprecipitate. (D) Representative immunofluorescence images of Xenopus sperm nuclei incubated with HSS extracts for 180 min. Chromatids were labeled with Hoechst and co-stained with anti-XPB and anti-CAP-E antibodies. Images of three representative individual chromatids are shown.
-
Figure 3—figure supplement 1—source data 1
Source data for Figure 3—figure supplement 1B and C.
- https://cdn.elifesciences.org/articles/75475/elife-75475-fig3-figsupp1-data1-v2.zip
Figure 4 with 2 supplements
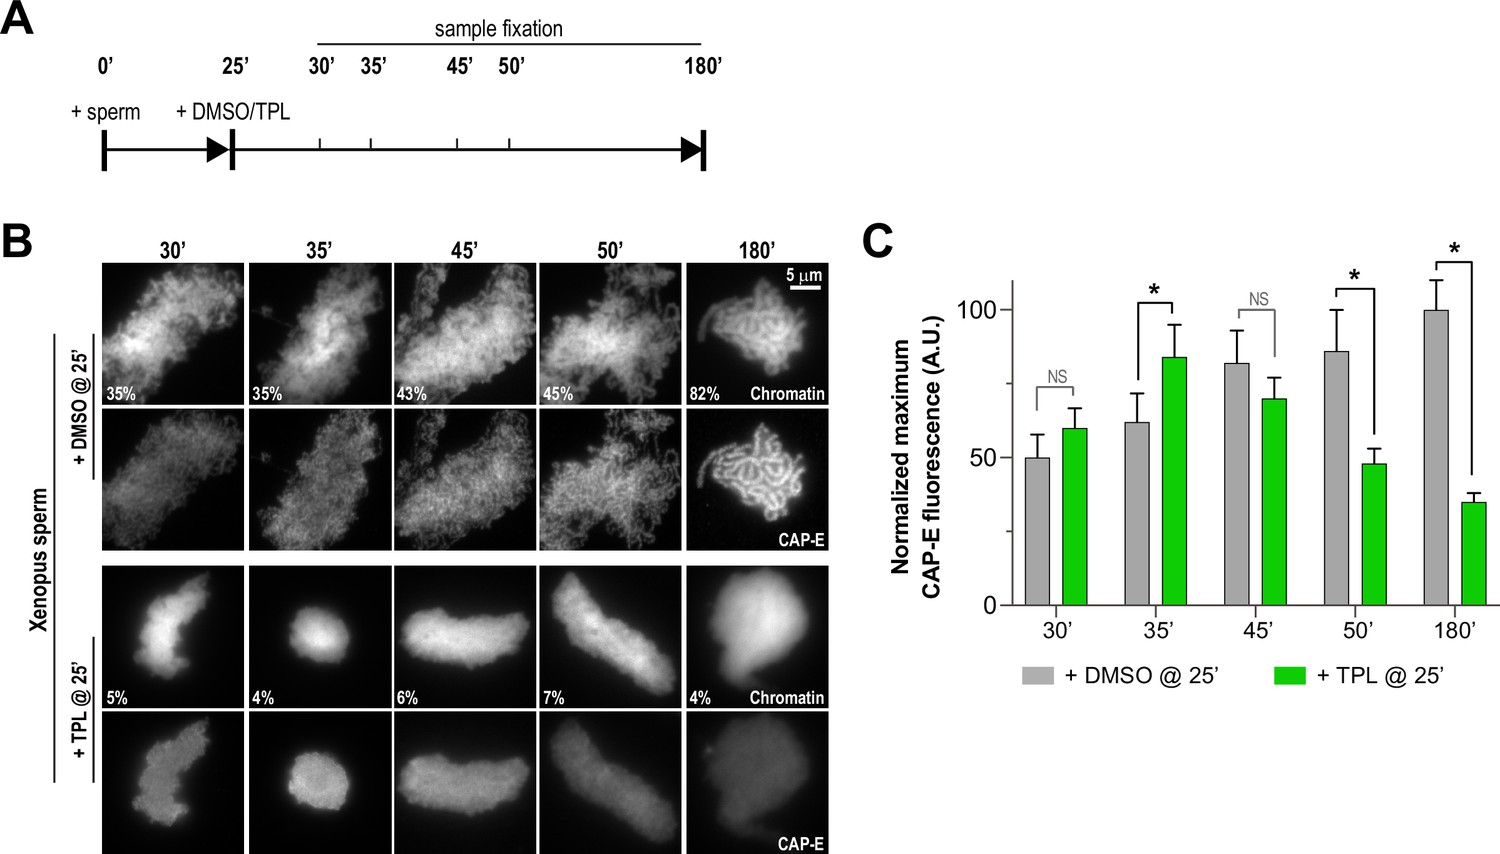
Triptolide perturbs condensation prior to its effects on condensin levels.
(A) Schematic of assay to test the timing of triptolide-induced defects in condensation and condensin levels. After a twenty-five minute incubation, either DMSO or triptolide (TPL) was added, and samples were taken at indicated times and processed for immunofluorescence. (B) Representative immunofluorescence images of DMSO or triptolide treated extracts at indicated timepoints. Chromatids were labeled with Hoechst and anti-CAP-E (condensin I and II). Note that condensation is already lost in in the first timepoint after triptolide addition, as in Figure 2A. Mean condensation parameters for each condition are indicated in lower left corner of each image. (C) Quantification of fluorescence intensity of CAP-E from experiment in (B), normalized to the 180 min DMSO-treated sample. n = 50 structures for each condition. Error bars represent SD, and asterisks indicate a statistically significant difference (*, p < 0.001). A.U., arbitrary units. Two biological replicates were performed, quantified structures are from a single experiment.
Figure 4—figure supplement 1
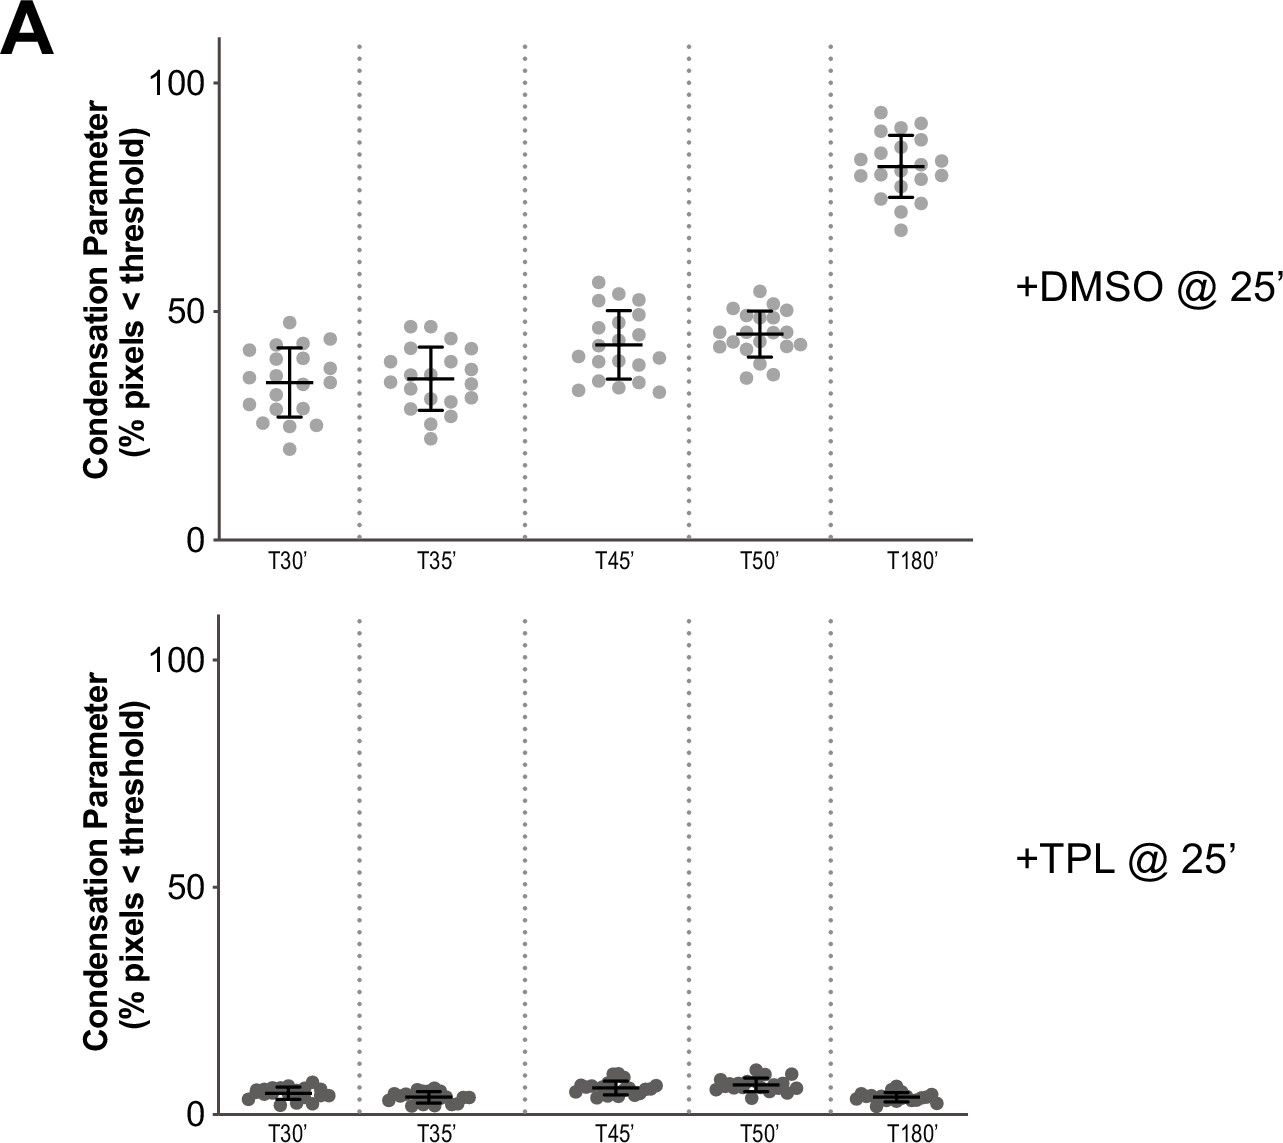
Condensation parameters of condensation kinetics after DMSO or Triptolide treatment.
(A) Scatter plots of the percentage of pixels below a threshold of 35% of image maximum fluorescence intensity (the condensation parameter), for each drug condition and indicated time point. Error bars represent SD, and the mean values are indicated. n = 20 structures for each condition. Two biological replicates were performed, quantified structures are from a single experiment.
Figure 4—figure supplement 2

Triptolide perturbs condensation prior to its effects on condensin levels.
(A) Left: Representative immunofluorescence images of DMSO or triptolide-treated extracts at indicated timepoints. Chromatids were labeled with DAPI and anti-CAP-E (condensin I & II). Right: Quantification of fluorescence intensity of CAP-E, normalized to the 180 min DMSO-treated sample. This data is also shown in Figure 4B in grayscale. (B) Left: Representative immunofluorescence images of DMSO or triptolide treated extracts at indicated timepoints. Chromatids were labeled with DAPI and anti-CAP-D3 (condensin II). Right: Quantification of fluorescence intensity of CAP-D3, normalized to the 180 min DMSO-treated sample. (C) Left: Representative immunofluorescence images of DMSO or triptolide treated extracts at indicated timepoints. Chromatids were labeled with DAPI and anti-XPB (TFIIH complex). Right: Quantification of fluorescence intensity of XPB, normalized to the 180 min DMSO-treated sample. n = 50 structures for each condition. Error bars represent SD, and asterisks indicate a statistically significant difference (*, p < 0.001). A.U., arbitrary units. Two biological replicates were performed, quantified structures are from a single experiment.
Figure 5 with 2 supplements

Partial histone H3/H4 depletion rescues chromosome condensation in the absence of TFIIH activity.
(A) Representative fluorescence images of mouse sperm nuclei incubated with ∆IgG or ∆H4K12ac extracts and spun onto coverslips at indicated timepoints. DMSO or Triptolide were added at t = 25’, immediately after sample acquisition for imaging. Chromatin was stained with Hoechst. Mean condensation parameters for each condition are indicated in lower left corner of each image. (B) Representative immunofluorescence images of mouse sperm nuclei incubated with ∆IgG or ∆H4K12ac extracts for 180 min. DMSO or triptolide were added at t = 25’. Chromatids were labeled with anti-XPB, anti-CAP-E (condensin I and II), or anti-histone H3, and co-stained with Hoechst. (C) Quantification of fluorescent intensity of indicated proteins from (B), normalized to DMSO. n = 50 structures for each condition. Error bars represent SD, and asterisks indicate a statistically significant difference (*, p < 0.001). A.U., arbitrary units. Two biological replicates were performed, quantified structures are from a single experiment. (D) Model depicting the role of the TFIIH complex in regulating condensin dynamics. Our data are consistent with a model in which TFIIH alters the chromatin environment to allow condensins to load and extrude loops of DNA.
Figure 5—figure supplement 1
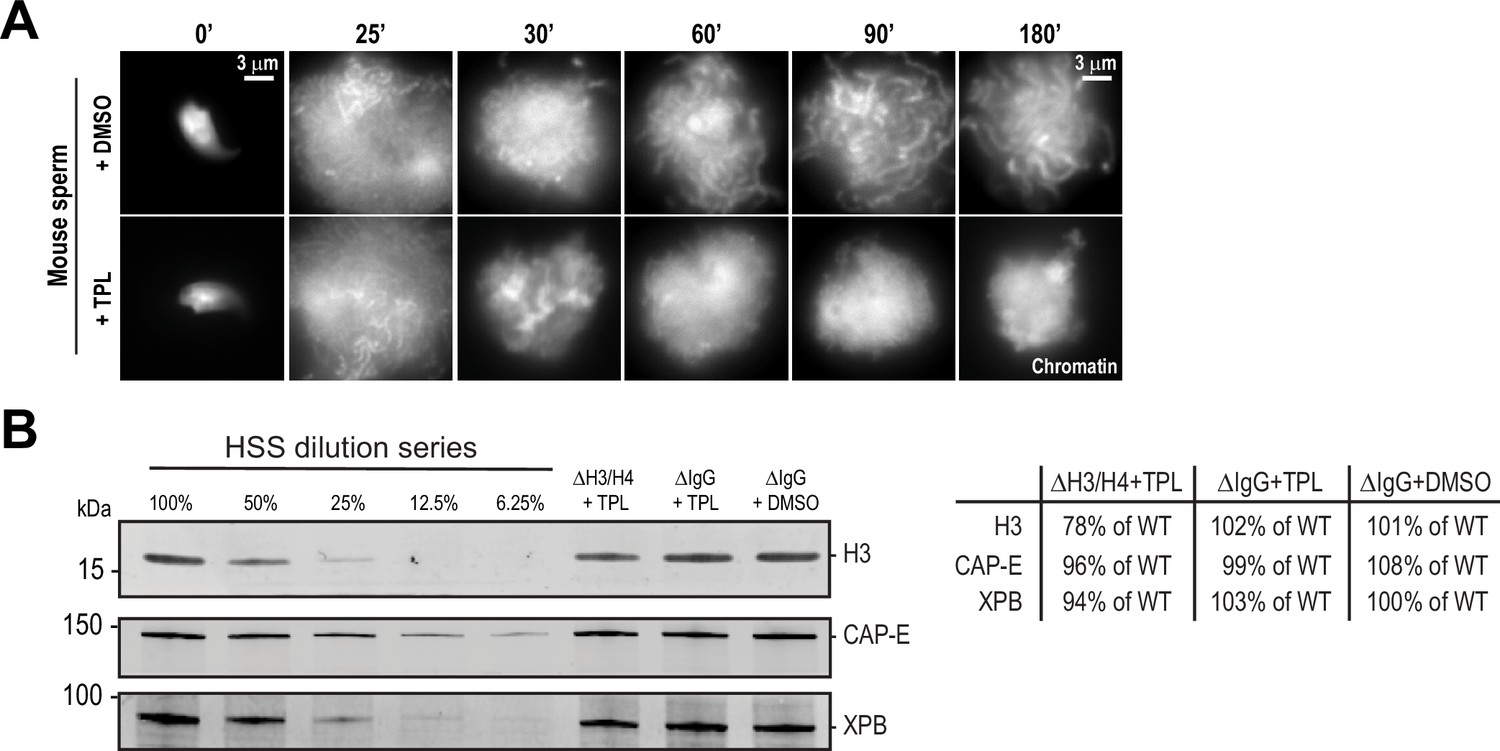
Effects of triptolide and histone depletion on condensation using mouse sperm.
(A) Representative fluorescence images of chromatid assembly at steady state with mouse sperm nuclei in egg extracts (180 min after sperm nuclei addition) in the presence of indicated inhibitors. Triptolide or DMSO control was added at 25 min after nuclei addition. Triptolide was added at 50 μM. (B) Western blot for histone H3, CAP-E, and XPB in histone H4K12ac or IgG-depleted extracts in the presence of triptolide (TPL) or DMSO. Relative percentage of protein remaining after indicated treatments is shown.
-
Figure 5—figure supplement 1—source data 1
Source data for Figure 5—figure supplement 1B.
- https://cdn.elifesciences.org/articles/75475/elife-75475-fig5-figsupp1-data1-v2.zip
Figure 5—figure supplement 2

Condensation parameters of condensation kinetics after DMSO or Triptolide treatment.
(A) Scatter plots of the percentage of pixels below a threshold of 35% of image maximum fluorescence intensity (the condensation parameter), for each drug condition and indicated time point, see Figure 5A for images. Error bars represent SD, and the mean values are indicated. n = 20 structures for each condition. Two biological replicates were performed, quantified structures are from a single experiment.
Tables
Key resources table
| Reagent type (species) or resource | Designation | Source or reference | Identifiers | Additional information |
|---|---|---|---|---|
| Antibody | Anti-XPB (rabbit polyclonal) | Novus Biologicals | Cat# NB100-61060, RRID:AB_925377 | IF (1:200), WB (1:1000)IP (0.24 µg antibody per µl beads and 0.24 µg antibody per µl extract)Immunodepletion (0.24 µg Antibody per µl beads and 1.44 µg Antibody per µl extract) |
| Antibody | Anti-XPB (mouse monoclonal) | Millipore | Cat# MABE1123 | IF (1:50) |
| Antibody | Anti-p62 (rabbit polyclonal) | Abcam | Cat# ab232982 | WB (1:400) |
| Antibody | Anti-XPF (rabbit polyclonal) | Gift of Puck Knipscheer, Hubrecht Institute Klein Douwel et al., 2014 | Custom | WB (1:10,000) |
| Antibody | Anti-ERCC1 (rabbit polyclonal) | Gift of Puck Knipscheer, Hubrecht Institute Klein Douwel et al., 2014 | Custom | WB (1:10,000)Immunodepletion (0.24 µg antibody per µl of beads and 1.44 µg of antibody per µl of extract) |
| Antibody | Anti-CAP-E Serum (rabbit polyclonal) | This study | HL7914 | Immunodepletion (24 µl of serum per µl extract and 3 µl of serum per µl of beads)IP (3 µl of serum per µl HSS and 3 µl of serum per µl of beads)Refer to ‘Antibody Production’ section in Methods |
| Antibody | Anti-CAP-D3 (rabbit polyclonal) | Gift of Alexei Arnaoutov and Mary Dasso, NICHD Bernad et al., 2011 | Custom | IF (1:100)WB (1:400) |
| Antibody | Anti-CAP-C (rabbit polyclonal) | Gift of Alexei Arnaoutov and Mary Dasso, NICHD Bernad et al., 2011 | Custom | IF (1:100)WB (1:500) |
| Antibody | Anti-CAP-E (rabbit polyclonal) | Gift of Alexei Arnaoutov and Mary Dasso, NICHD Bernad et al., 2011 | Custom | IF (1:100)WB (1:1,000) |
| Antibody | Anti-CAP-G (rabbit polyclonal) | Gift of Susannah Rankin, Oklahoma Medical Research Foundation | OMRF191 | WB (1:5,000) |
| Antibody | Anti-Topo II (rabbit polyclonal) | Gift of Yoshi Azuma, University of Kansas Pandey et al., 2020 | Custom | IF (1:200) |
| Antibody | Anti-Histone H3 (rabbit polyclonal) | Abcam | Cat# ab1791, RRID:AB_302613 | IF (1:400)WB (1:500) |
| Antibody | Anti-Histone (T3ph) (rabbit monoclonal) | Abcam | Cat# ab78351, RRID:AB_1566301 | WB (1:10,000) |
| Antibody | Anti-histone H4K12ac (mouse monoclonal) | Gift of Hiroshi Kimura,Tokyo Institute of Technology Hayashi-Takanaka et al., 2015 | Custom | Immunodepletion (0.24 µg antibody per µl beads and 4.15 µg antibody per µl extract) |
| Antibody | Anti-α-Tubulin (mouse, monoclonal) | MilliporeSigma | Cat# T9026, RRID:AB_477593 | WB (1:20,000) |
| Antibody | Anti-CDK1T116Phos (rabbit polyclonal) | Cell Signaling Technology | Cat# 9,114 S, RRID:AB_2074652 | WB (1:500) |
| Antibody | Anti-SUPT16H (rabbit polyclonal) | Abcam | Cat# ab204343 | IF (1:100) |
| Antibody | Alexa Fluor 488 anti-rabbit IgG (donkey polyclonal) | Jackson ImmunoResearch | Cat# 711-545-152, RRID:AB_2313584 | IF (1:400) |
| Antibody | Alexa Fluor 647 anti-rabbit IgG (goat polyclonal) | Jackson ImmunoResearch | Cat# 111-605-144, RRID:AB_2338078 | IF (1:400) |
| Antibody | Alexa Fluor 488 anti-mouse IgG (goat polyclonal) | Jackson ImmunoResearch | Cat#115-545-166, RRID:AB_2338852 | IF (1:400) |
| Antibody | IRDye 800 CW anti-rabbit IgG (H + L) (goat polyclonal) | LI-COR Biosciences | Cat# 926–32211, RRID:AB_621843 | WB (1:17,500) |
| Antibody | IRDye 680 LT anti-mouse IgG (H + L) (goat polyclonal) | LI-COR Biosciences | Cat# 926–68020, RRID:AB_10706161 | WB (1:17,500) |
| Antibody | IgG (rabbit polyclonal) | MilliporeSigma | Cat# I5006, RRID:AB_1163659 | Immunodepletion (used as control at 0.24 µg antibody per µl of beads) |
| Peptide, recombinant protein | xCAP-E C-terminal peptide | Vivitide | Custom | NH2-CSKTKERRNRMEVDK-COOH |
| Other | Protein A Dynabeads | Thermo Fisher Scientific | Cat# 10,002D | Immunodepletion and Immunoprecipitation |
| Chemical compound, drug | BS3 (bis(sulfosuccinimidyl) suberate) | Thermo Fisher Scientific | Cat# A39266 | 4 mM |
| Chemical compound, drug | Triptolide | Tocris or MilliporeSigma | Tocris Cat# 3,253MilliporeSigma Cat# T3652 | 50 µM |
| Chemical compound, drug | α-amanitin | Tocris | Cat# 4,025 | 54.4 µM |
| Chemical compound, drug | Actinomycin D | Tocris | Cat# 1,229 | 0.05 µM, 0.4 µM, 4.0 µM |
| Chemical compound, drug | THZ1 | Cayman | Cat# 9002215–1 | 30 µM |
| Chemical compound, drug | DRB | Cayman | Cat# 10010302 | 100 µM |
| Chemical compound, drug | RNase A | Thermo Fisher Scientific | Cat# EN0531 | 100 µg/ml |
| Chemical compound, drug | RNase H | Thermo Fisher Scientific | Cat# EN0201 | 0.2 Units/µl |
| Other | Hoechst Stain | Thermo Fisher Scientific | Cat# H3569 | 0.5 µg/ml |
| Other | Bio-Rad Trans-Blot Nitrocellulose | Bio-Rad | Cat# 170–4159 | Western blot |
| Biological sample (Xenopus laevis) | Xenopus laevis, 9 + cm mature females, pigmented | NASCO | Cat# LM00535M | Female, adult frogs |
| Biological sample (Xenopus laevis) | Xenopus laevis, 7.5–9 cm mature males, pigmented | NASCO | Cat# LM00715MX | Male, adult frogs |
| Software, algorithm | Fiji v2.1.0/1.53 f | Fiji | RRID: SCR_002285 | Image analysis and quantification |
| Software, algorithm | GraphPad Prism v9 | GraphPad | RRID: SCR_002798 | Graph creation and statistical analysis |
| Software, algorithm | NIS Elements AR 4.20.02 | Nikon Instruments | RRID: SCR_014329 | Capture and process chromatin images |
| Software, algorithm | Licor Image Studio v3.1 | LI-COR Biosciences | RRID: SCR_013715 | Capture and process Western blot images |
| Software, algorithm | Adobe Illustrator CC v25.4.3 | Adobe | RRID: SCR_010279 | Organize and prepare figures |
Additional files
Download links
A two-part list of links to download the article, or parts of the article, in various formats.
Downloads (link to download the article as PDF)
Open citations (links to open the citations from this article in various online reference manager services)
Cite this article (links to download the citations from this article in formats compatible with various reference manager tools)
The TFIIH complex is required to establish and maintain mitotic chromosome structure
eLife 11:e75475.
https://doi.org/10.7554/eLife.75475


