A novel mechanism of bulk cytoplasmic transport by cortical dynein in Drosophila ovary
- Department of Cell and Developmental Biology, Feinberg School of Medicine, Northwestern University, United States
Figures
Figure 1 with 1 supplement

Dynein activity is required for Drosophila oocyte growth.
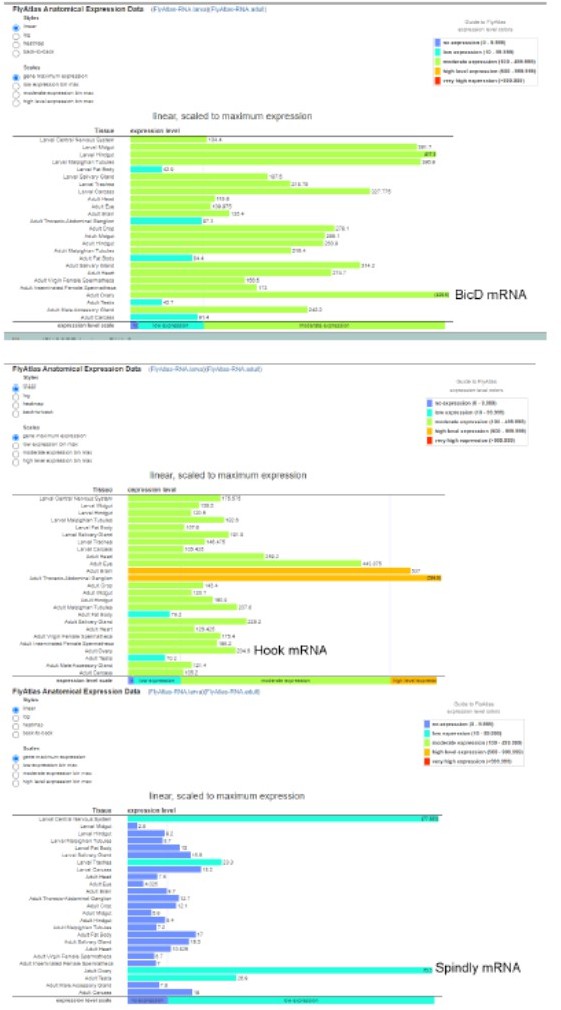
(A) A cartoon illustration of cytoplasmic dynein and its regulators. The dynein core complex is composed of dimers of dynein heavy chain (orange), dynein intermediate chain (gray), dynein light intermediate chain (blue), and three types of dynein light chains (green). Dynein activity is regulated by the dynactin complex (brown, with p150Glued highlighted in red) and the Lis1-NudE complex (Lis1, yellow; NudE, magenta). A dynein activating adaptor, BicD (purple), is also shown to illustrate the linkage of the dynein complex with a cargo. To note: other cargo adaptors instead of BicD, such as Spindly, HOOK1/3, ninein/ninein- like(NINL), and RAB11 family-interacting protein 3, can be used for dynein activation and cargo recruitment (not shown) (Reck-Peterson et al., 2018). BICDR1 and HOOK3 could recruit two dyneins for increased force and speed (not shown) (Reck-Peterson et al., 2018). (B) Summary of oocyte growth phenotypes in listed genetic background (all with one copy of maternal αtub-Gal4[V37]). Classifications of oocyte growth phenotypes are included in Figure 1—figure supplement 1A. Dhc64C-RNAi (#1) is the RNAi line used for all Dhc64C-RNAi experiments in this study. (C-D’’) Phalloidin and Orb staining in control (C-C’’) and Dhc64C-RNAi (D-D’’) ovarioles. Oocytes and Orb staining are highlighted with either yellow arrowheads and brackets (C-D and C’’-D’’), or with yellow painting (C’-D’). Scale bars, 50 µm. (E) Summary of the Orb staining phenotypes in stage 8 (left) and stage 9 (right) egg chambers in listed genotypes (all with one copy of maternal αtub-Gal4[V37]). Descriptions of Orb concentration and Orb dispersion are included in Figure 1—figure supplement 1B. (F) Summary of oocyte growth phenotypes in RNAi lines against three listed dynein activating adaptors, BicD, Spindly and Hook (all with one copy of maternal αtub-Gal4[V37]).
Figure 1—figure supplement 1
Summary of dynein-related RNAi phenotypes.
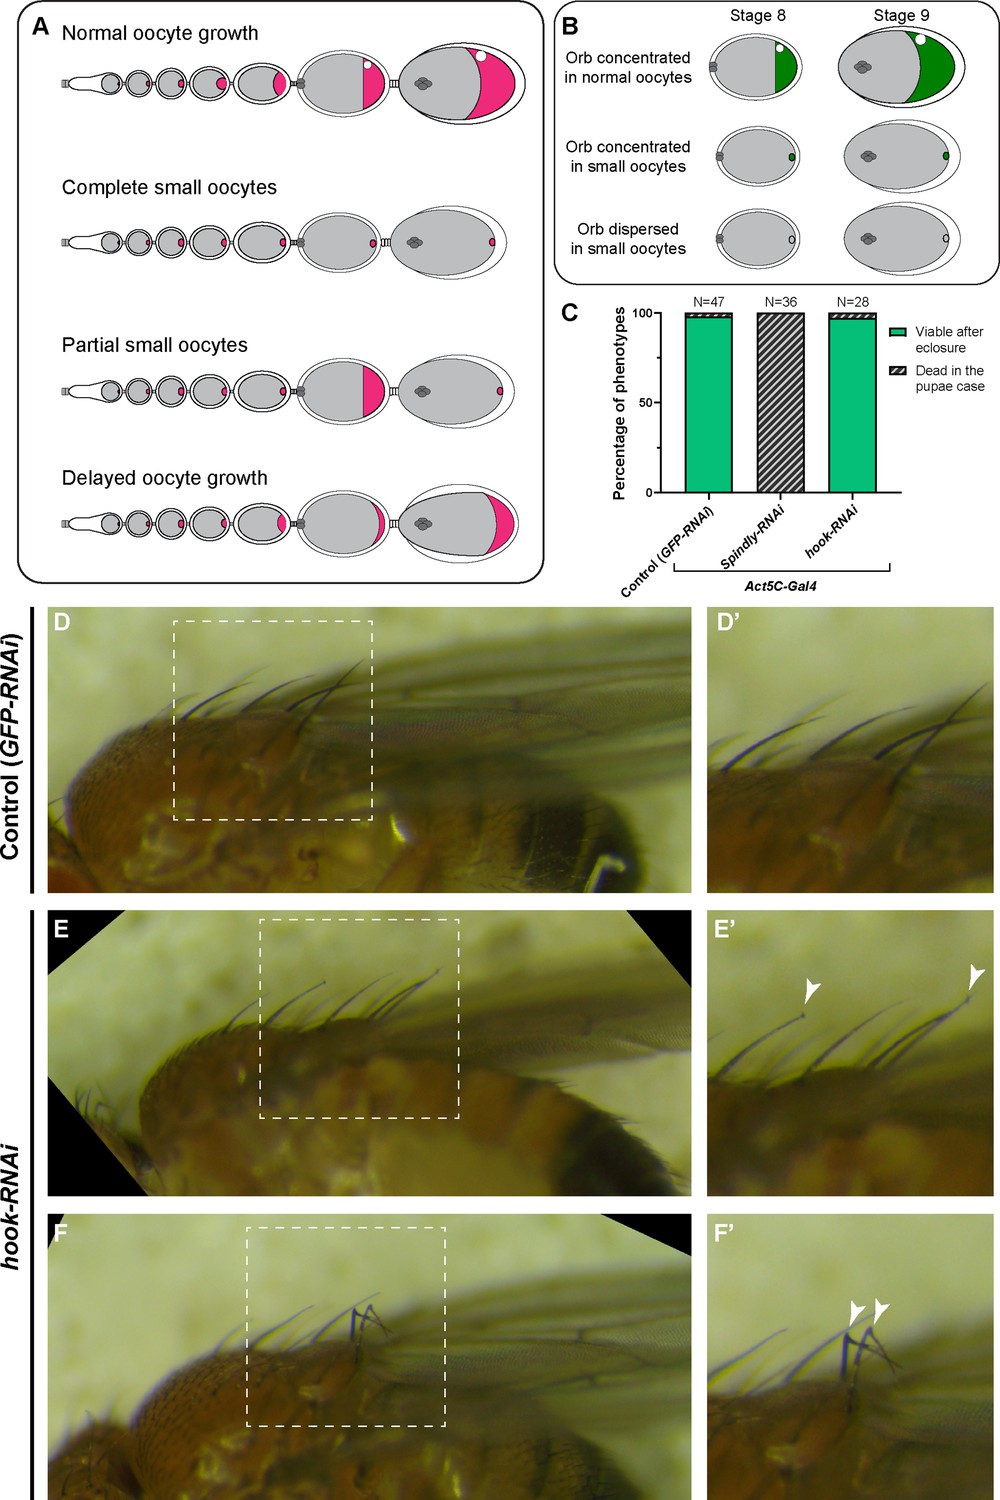
(A) A cartoon illustration of oocyte growth phenotypes (oocytes are highlighted in magenta): (1) normal oocyte growth: all egg chambers in the single ovariole have normal-sized oocytes according to the stages; (2) complete small oocytes: oocyte growth is completely arrested throughout the stages, (3) partial small oocyte growth: some egg chambers display oocyte growth arrest, while others have normal-size oocytes in the same ovariole; (4) delayed oocyte growth: oocytes are smaller compared to wild-type at all stages. (B) A cartoon illustration of Orb staining phenotypes (Orb staining is shown in green). The Orb staining in stage 8 and stage 9 egg chambers were characterized into either Orb concentrated in the oocyte (the average fluorescent intensity of Orb staining in the oocyte is >2 x higher than in the nurse cells) and Orb dispersed in the oocyte (the average fluorescent intensity of Orb staining in the oocyte is <2 x higher than in the nurse cells). (C) Viability assay (from pupae to adults) in listed genotypes. As the Act5C-Gal4 transgene is balanced with a TM6B (Tb) balancer, only non-Tb pupae were selected for this assay. (D-F’) Bristle phenotypes in control (D) and in hook-RNAi (E–F) male adults. Control and hook-RNAi are of the same genotypes as (C). Mild (E) and severe (F) hooked bristle phenotypes are seen in Act5C>hook-RNAi flies. (D’-F’) Zoom-in images of bristles in the white dashed box in (D–F). Hooked bristles are highlighted with white arrowheads.
Figure 2 with 11 supplements
Microtubule movement within nurse cells and from nurse cells to the oocyte.
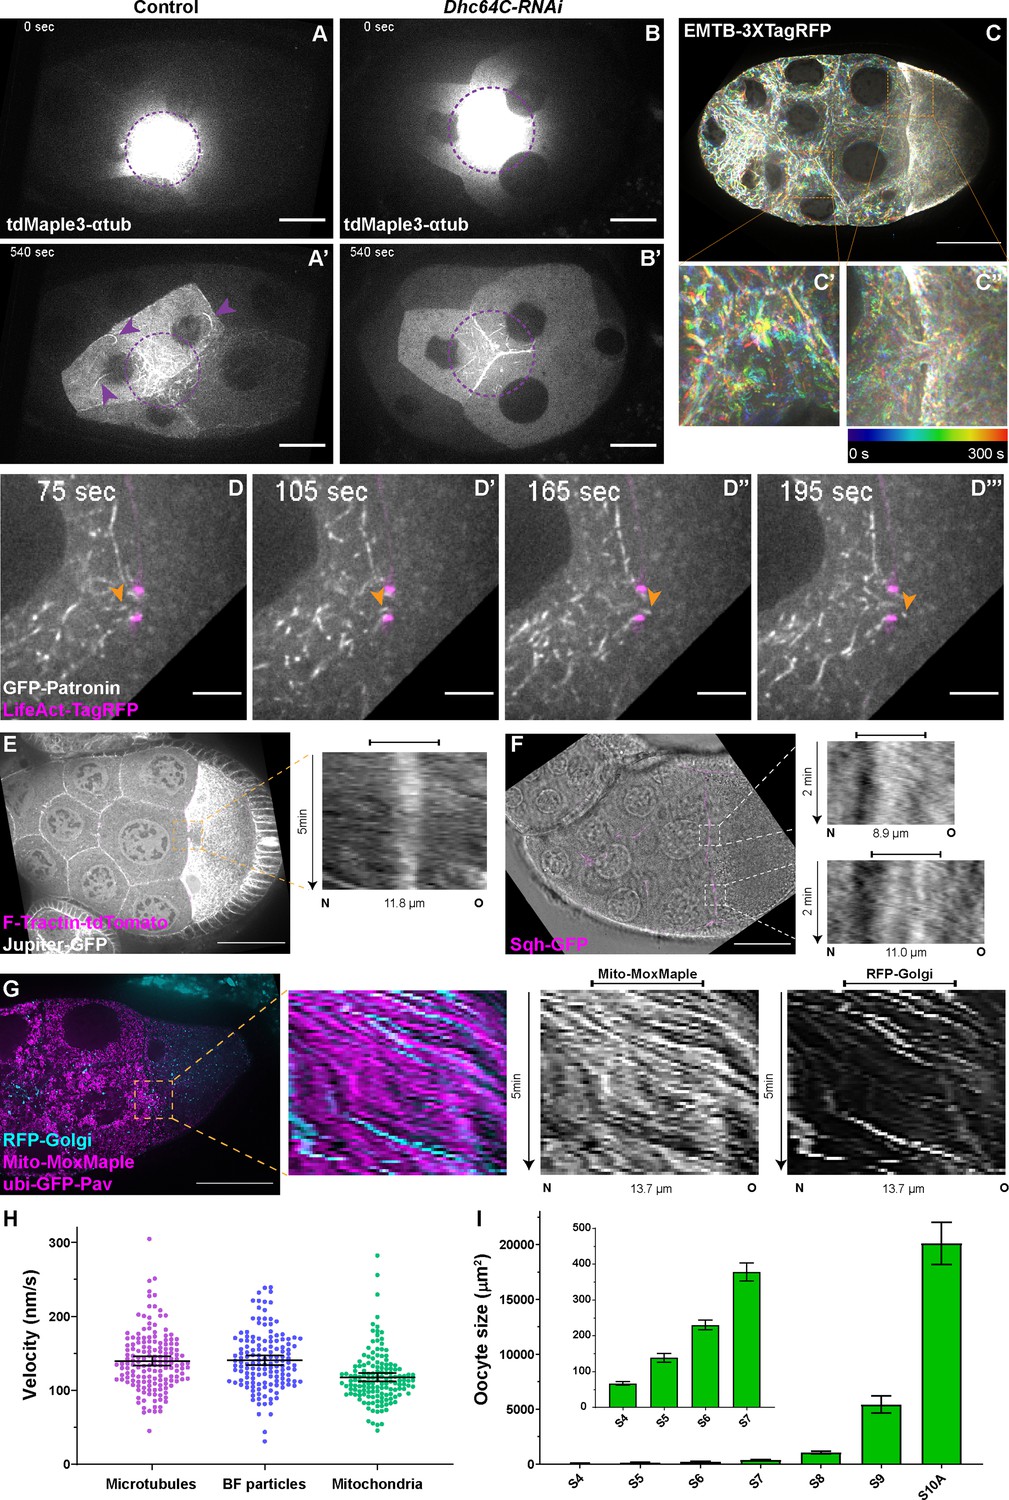
(A-B’) Microtubule movement labeled with photoconverted tdMaple3-αtub in control and Dhc64C-RNAi nurse cells. Photoconversion area is highlighted with a dotted purple circle and microtubules outside of the photoconversion zone are highlighted with purple arrowheads. Scale bars, 20 µm. See also Figure 2—video 1 and Figure 2—video 5. (C-C’’) Microtubule movement is visualized by a 3XTagRFP-tagged microtubule binding domain of human Ensconsin/MAP7 (EMTB-3XTagRFP). Temporal color-coded hyperstacks are used to show the microtubule movement in a whole egg chamber (C) and zoom-in areas (the dashed orange boxes) within a nurse cell (C’) and in a nurse cell-oocyte ring canal (C’’). Scale bar, 50 µm. See also Figure 2—video 2. (D-D’’’) microtubule movement labeled with a GFP-tagged microtubule minus-end binding protein Patronin. The ring canal is labeled with LifeAct-TagRFP. One microtubule moving through the ring canal is highlighted with orange arrowheads. Scale bars, 10 µm. See also Figure 2—video 3. (E) Microtubule movement is visualized by a GFP protein trap line of an endogenous microtubule binding protein, Jupiter (Jupiter-GFP). The ring canal is labeled with F-Tractin-tdTomato. A kymograph of Jupiter-GFP in the nurse cell-oocyte ring canal (the dashed orange box) is used to show the microtubule movement from the nurse cell to the oocyte. See also Figure 2—video 4. (F) Cytoplasmic advection is visualized by bright-field imaging. The ring canals are labeled with a GFP-tagged myosin-II light chain, Sqh-GFP. Kymographs of the two nurse cell-oocyte ring canals (the dashed white boxes) are used to show the cytoplasmic advection from the nurse cells to the oocyte. See also Figure 2—video 7. (G) Bulk movement of two types of cargoes, mitochondria (Mito-MoxMaple3, without photoconversion, magenta) and Golgi units (RFP-Golgi, cyan), through the nurse cell-oocyte ring canal, labeled with GFP-Pav (magenta). Kymographs of mitochondria and Golgi units in the nurse cell-oocyte ring canal (the dashed orange box) is used to show that both cargoes move at a similar speed through the ring canal to the oocyte. See also Figure 2—video 8. (E–G) The capped line on top of the kymograph indicates the ring canal region. Scale bars, 50 µm. (H) Quantification of the velocities of microtubules, small particles in bright-field images (BF particles) and mitochondria in nurse cell-oocyte ring canals of stage 9 egg chambers. The black bars on top of scattered plots stand for mean ± 95% confidence intervals: microtubules (Jupiter-GFP) 139.7 ± 6.2 nm/s (N = 159); BF particles, 140.8 ± 6.4 nm/s (N = 143); mitochondria (Mito-MoxMaple3), 117.6 ± 5.7 nm/s (N = 147). Unpaired t tests with Welch’s correction were performed in following groups: microtubules and BF particles, p = 0.8080 (n.s.); microtubules and mitochondria, p < 0.0001 (****); BF particles and mitochondria, p < 0.0001 (****). (I) Measurement of oocyte sizes in egg chambers of different stages (mean ± 95% confidence intervals): stage 4, 67.2 ± 4.9 µm2 (N = 57); stage 5, 139.0 ± 12.6 µm2 (N = 58); stage 6, 230.5 ± 13.4 µm2 (N = 62); stage 7, 378.4 ± 25.1 µm2 (N = 38); stage 8, 1067.3 ± 120.0 µm2 (N = 41); stage 9, 5432.8 ± 771.8 µm2 (N = 69); stage 10 A, 20105.0 ± 1930.0 µm2 (N = 31).
Figure 2—figure supplement 1
Microtubule in the ring canals and oocyte growth at different stages.
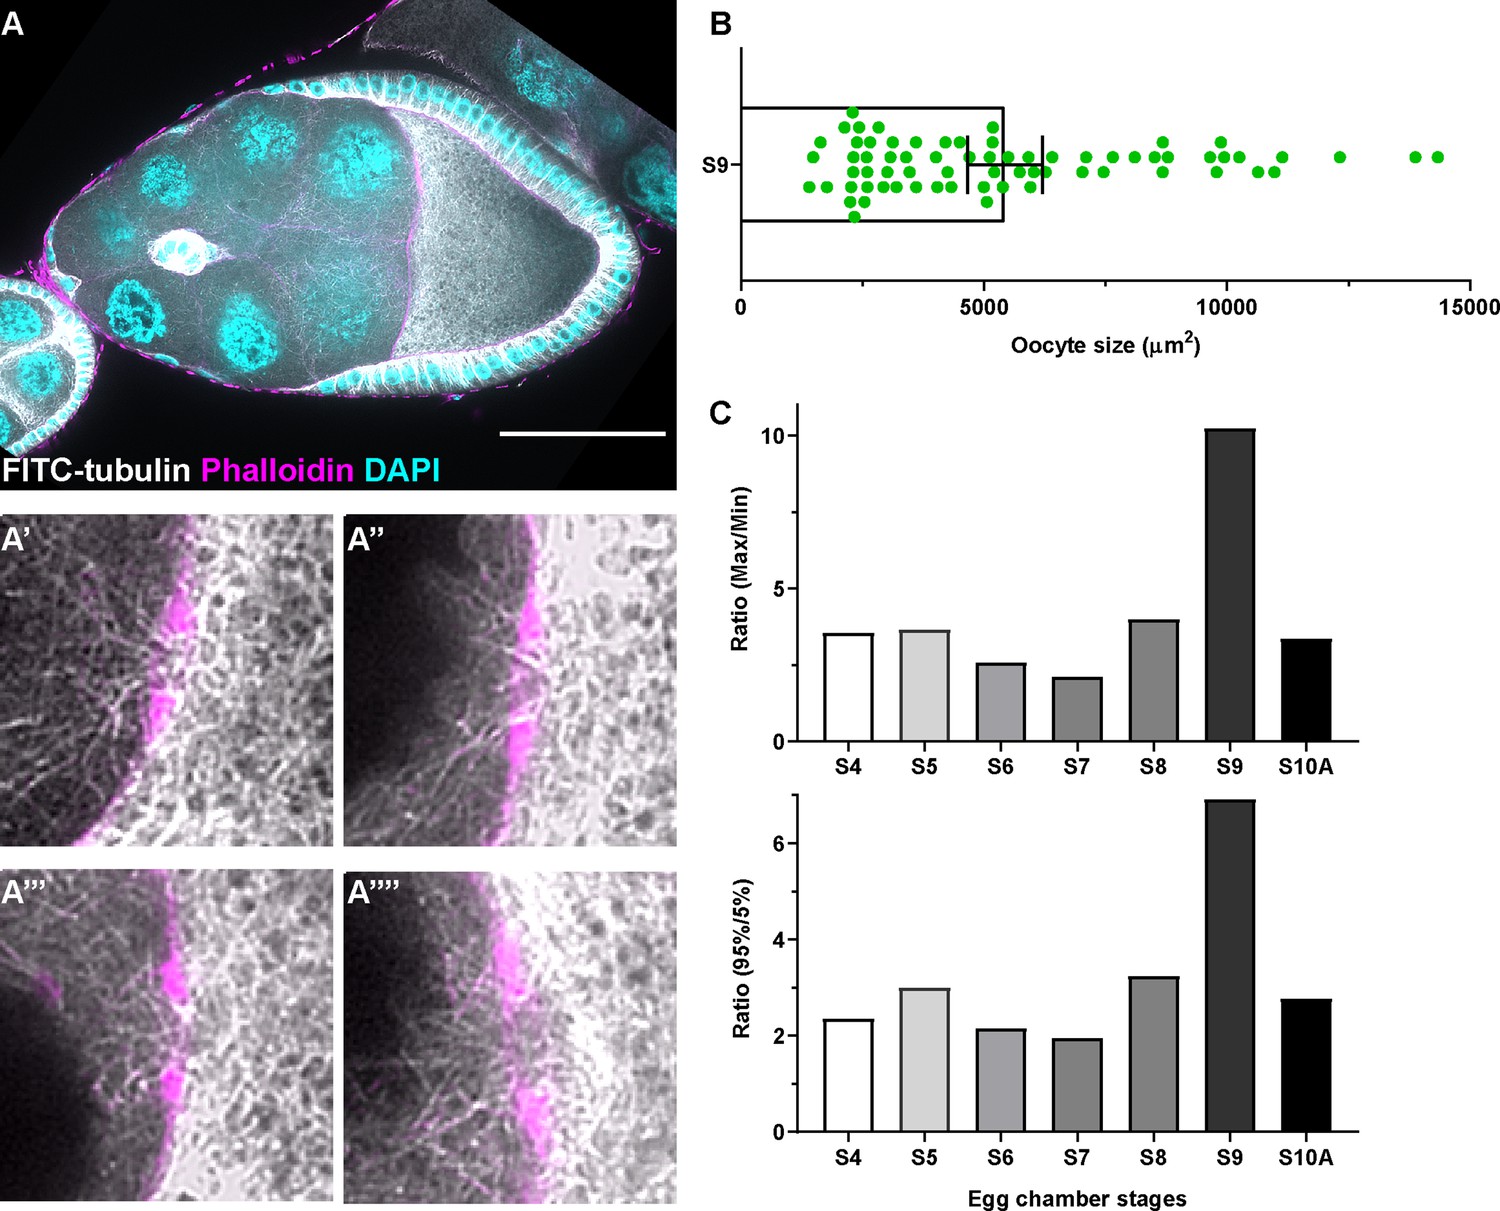
(A) Tubulin staining in a control stage 9 egg chamber. Microtubules can be seen in all four ring canals connecting nurse cells with the oocyte (A’-A’’’’). Ring canals are labeled with rhodamine-conjugated phalloidin. Scale bar, 50 µm. (B) The scattered plot of oocyte size in stage 9 egg chambers (black bars on top of the scatter plot, mean ± 95% confidence intervals). N = 69. (C) Ratio of either maximum oocyte size / minimum oocyte size (top) or ratio of 95% percentile oocyte size / 5% percentile oocyte size (bottom) at listed stages.
Figure 2—figure supplement 2
Myosin-II activity is dispensable for oocyte growth during mid-oogenesis.
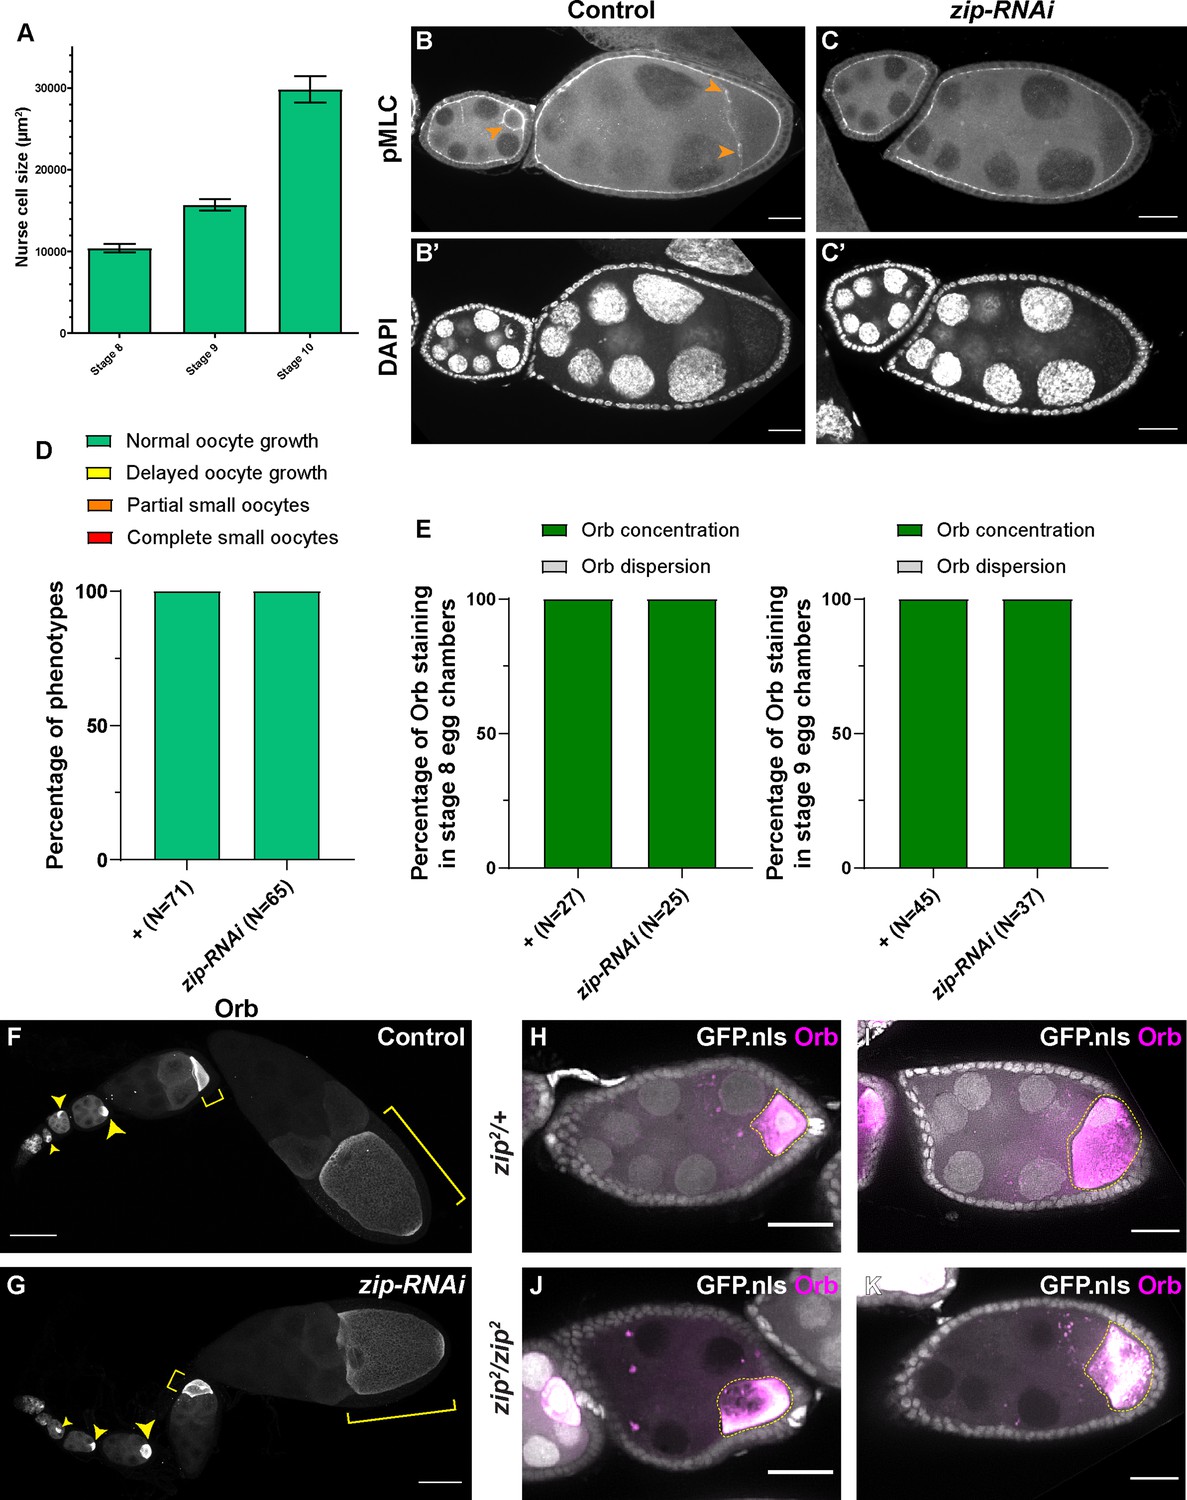
(A) Nurse cell size in stage 8 to stage 10 egg chambers (mean ± 95% confidence intervals). Stage 8, N = 13; stage 9, N = 23; stage 10, N = 14. (B-C’) Phospho-myosin-II light chain (pMLC) antibody staining in control and in zip-RNAi samples. The pMLC staining between the nurse cells and the oocytes is abolished in zip-RNAi (C), compared to control (B, pointed with orange arrowheads). To note, the pMLC staining at the apical side of the somatic follicle cells is not affected by the germline knockdown of zip-RNAi and serves as an internal control of the antibody staining. Scale bars, 20 µm. (D–E) Summaries of oocyte growth phenotypes (D) and Orb staining phenotypes (E) in control and in zip-RNAi. Both control and zip-RNAi carry one copy of maternal αtub-Gal4[V37]. (F–G) Characteristic Orb staining in control (F) and zip-RNAi (G) ovarioles. Oocytes are highlighted with either yellow arrowheads or yellow brackets. Scale bars, 50 µm. Both samples carry one copy of maternal αtub-Gal4[V37]. (H–K) Orb staining in zip2 heterozygous (H–I) and homozygous (J-K, marked with the absence of nuclear-localized GFP signal) egg chambers. Among 46 zip2 homozygous egg chambers examined, 28 egg chambers have proper oocyte specification (shown by Orb concentration). 25 of 28 zip2 homozygous egg chambers display no major growth defects in mid-oogenesis. To note: (1) the Orb staining signal bleeds through to the GFP channel; (2) Orb staining becomes chunky and less evenly localized in the zip2 homozygous oocytes. Scale bars, 50 µm.
Figure 2—video 1
Microtubule movement (labeled with locally photoconverted tdMaple3-αtub) in nurse cells and from the nurse cell to the oocyte via a ring canal (labeled with ubi-GFP-Pav).
To note: the signal observed in the oocyte was a combination of microtubule movement through the ring canal and soluble tubulin incorporated into newly-formed microtubules in the oocyte. Scale bars, 20 µm. Related to Figure 2.
Figure 2—video 2
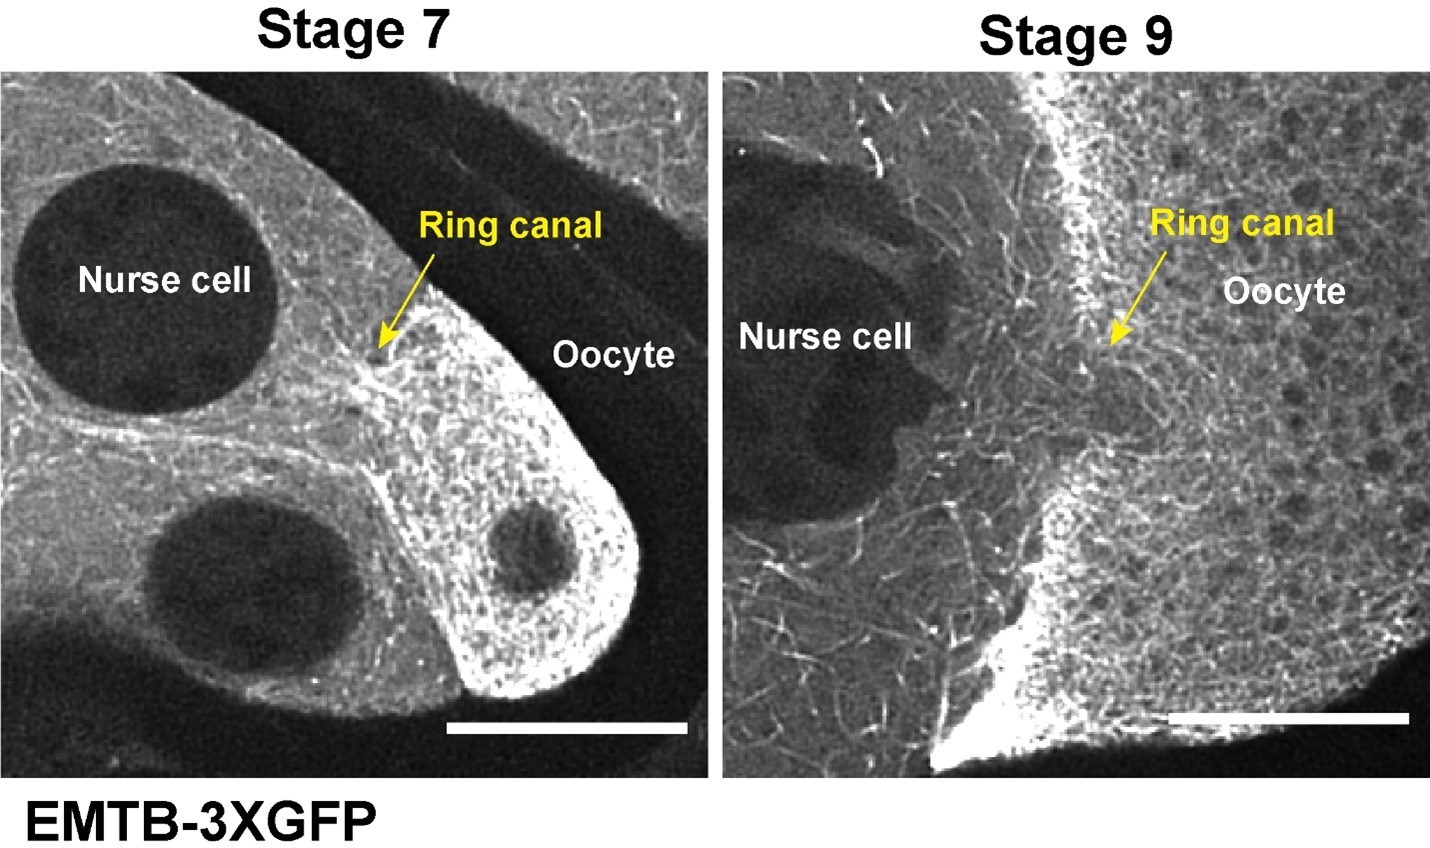
Microtubules labeled with fluorescently tagged human MAP7/Ensconsin microtubule binding domain (EMTB) move in nurse cells and through the nurse cell-oocyte ring canal in stage 9 egg chambers.
Ring canals in EMTB-3XTagRFP are labeled with GFP-Pav in magenta. Comparison of EMTB-labeled microtubules in the ring canals at stage 7 and stage 9 is included at the end. Scale bars, 50 µm for the whole egg chambers, and 20 µm for the zoom-in ring canals, respectively. Related to Figure 2.
Figure 2—video 3
Microtubules labeled with an ectopically-expressed GFP-tagged minus-end binding protein, Patronin (GFP-Patronin) move in nurse cells and from the nurse cell to the oocyte through the ring canal (labeled with LifeAct-TagRFP in magenta).
Scale bars, 50 µm for the whole egg chamber, and 10 µm for the zoom-in ring canals. Related to Figure 2.
Figure 2—video 4
Microtubules labeled with a GFP-tagged endogenous microtubule-associated protein Jupiter (Jupiter-GFP) in nurse cells and in the nurse cell-oocyte ring canal (labeled with F-Tractin-tdTomato in magenta).
Scale bar, 50 µm. Related to Figure 2.
Figure 2—video 5
No microtubule movement (labeled with locally photoconverted tdMaple3-αtub) in Dhc64C-RNAi nurse cells, compared to control.
Scale bars, 20 µm. Related to Figure 2.
Figure 2—video 6
Microtubule movement (labeled with a GFP-tagged endogenous MAP, Jupiter-GFP) in nurse cell-oocyte ring canals (labeled with GFP-Pav) in control, zip-RNAi and Dhc64C-RNAi.
Scale bars, 10 µm. Related to Figure 2.
Figure 2—video 7
Cytoplasmic advection from the nurse cells to the oocyte through ring canals (labeled with Sqh-GFP in magenta).
Scale bar, 50 µm. Related to Figure 2.
Figure 2—video 8
Bulk movement of mitochondria (labeled with Mito-MoxMaple3, without photoconversion, magenta) and Golgi units (labeled with RFP-Golgi, cyan) through the nurse cell-oocyte ring canal (labeled with GFP-Pav, magenta) in a stage 9 egg chamber.
Scale bar, 50 µm. Related to Figure 2.
Figure 2—video 9
Mitochondria movement (labeled with Mito-MoxMaple3, after global photoconversion, gray) in control, zip-RNAi and Dhc64C-RNAi.
Ring canals are labeled with GFP-Pav (magenta). Scale bars, 50 µm. Related to Figure 2.
Figure 3 with 5 supplements

Dynein-dependent GEM particle movement in the egg chambers.
(A–B) Cartoon illustrations of two possible mechanisms of dynein-dependent cargo transfer from the nurse cell to the oocyte. (C) A schematic illustration of the GEM construct. 120 copies of a sapphire-tagged Pyrococcus furiosus Encapsulin scaffold protein self-assemble into a 40 nm particle. (D-E’) Temporal color-coded hyperstacks of GEM particles in control (D-D’) and Dhc64C-RNAi (E-E’). Oo, the oocyte. Scale bars, 20 µm. See also Figure 3—video 3. (F–G) Quantifications of total (F) and average (G) fluorescent intensities of GEM particles in control and Dhc64C-RNAi. The values shown in the graphs are mean ± 95% confidence intervals. (F) Control, N = 22; Dhc64C-RNAi, N = 27. Unpaired t test with Welch’s correction between control and Dhc64C-RNAi: p < 0.0001 (****). (G) Control, N = 22; Dhc64C-RNAi, N = 27. Unpaired t test with Welch’s correction between control and Dhc64C-RNAi: p < 0.0001 (****). (H–K) Quantifications of velocities (H, J) and trajectories (I, K) of GEM movement in control and Dhc64C-RNAi. The number of particles tracked: control, N = 7656; Dhc64C-RNAi, N = 2083. (H–I) The values shown in the graphs are mean ± 95% confidence intervals. (H) Unpaired t test with Welch’s correction between control and Dhc64C-RNAi: p < 0.0001 (****). (I) Unpaired t test with Welch’s correction between control and Dhc64C-RNAi: p < 0.0001 (****). (J–K) Histograms of velocities (J) and trajectories (K) of GEM movement in control and Dhc64C-RNAi (the same set of data used in H-I).
Figure 3—figure supplement 1
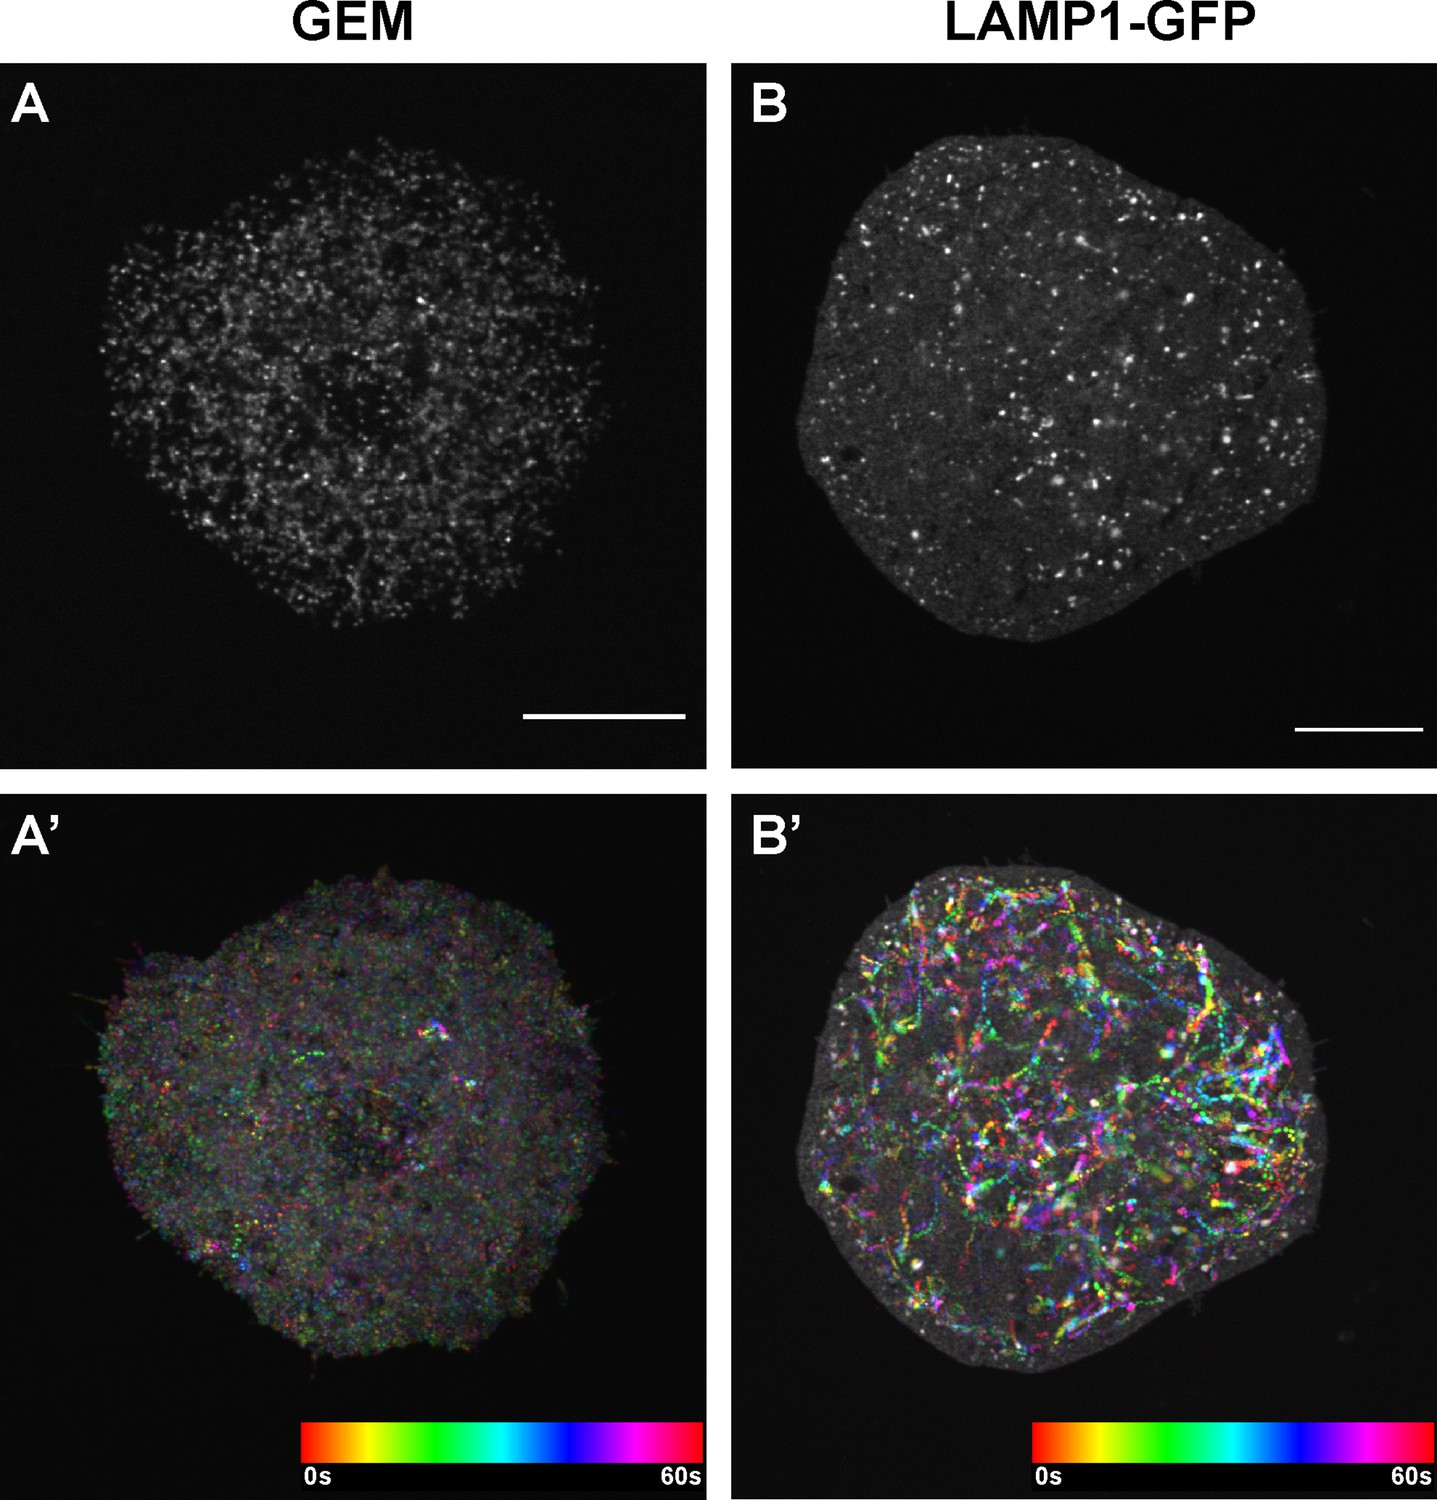
GEMs and lysosomes in Drosophila S2R + cells.
Single frame images (A–B) and temporal color-coded hyperstacks (A’-B’) of GEM particles (labeled with pAC-Gal4 + pUASp-GEM) (A-A’) and lysosomes (labeled with pAC-LAMP1-GFP) (B-B’) in Drosophila S2R + cells plated on Concanavalin-A coated coverslips. Scale bars, 10 µm.
Figure 3—video 1
Mitochondria movement (labeled with Mito-MoxMaple3, without photoconversion, left) and microtubule movement (labeled with EMTB-3XTagRFP, right) in a nurse cell-oocyte ring canal (labeled with GFP-Pav, left).
Scale bars, 50 µm in the whole egg chamber, and 10 µm in the zoom-in ring canal, respectively. Related to Figure 3.
Figure 3—video 2
The movement of Golgi units (labeled with RFP-Golgi, left) and microtubules (labeled with Jupiter-GFP, right) in a nurse cell-oocyte ring canal (labeled with F-Traction-tdTomato, left).
Scale bars, 50 µm in the whole egg chamber, and 10 µm in the zoom-in ring canal, respectively. Related to Figure 3.
Figure 3—video 3
GEM particles in a control egg chamber and in a Dhc64C-RNAi egg chamber.
Scale bars, 20 µm. Related to Figure 3.
Figure 3—video 4
GEM particles transport through a nurse cell-oocyte ring canal (labeled with F-Tractin-tdTomato, magenta) in control.
Scale bar, 10 µm. Related to Figure 3.
Figure 4 with 2 supplements
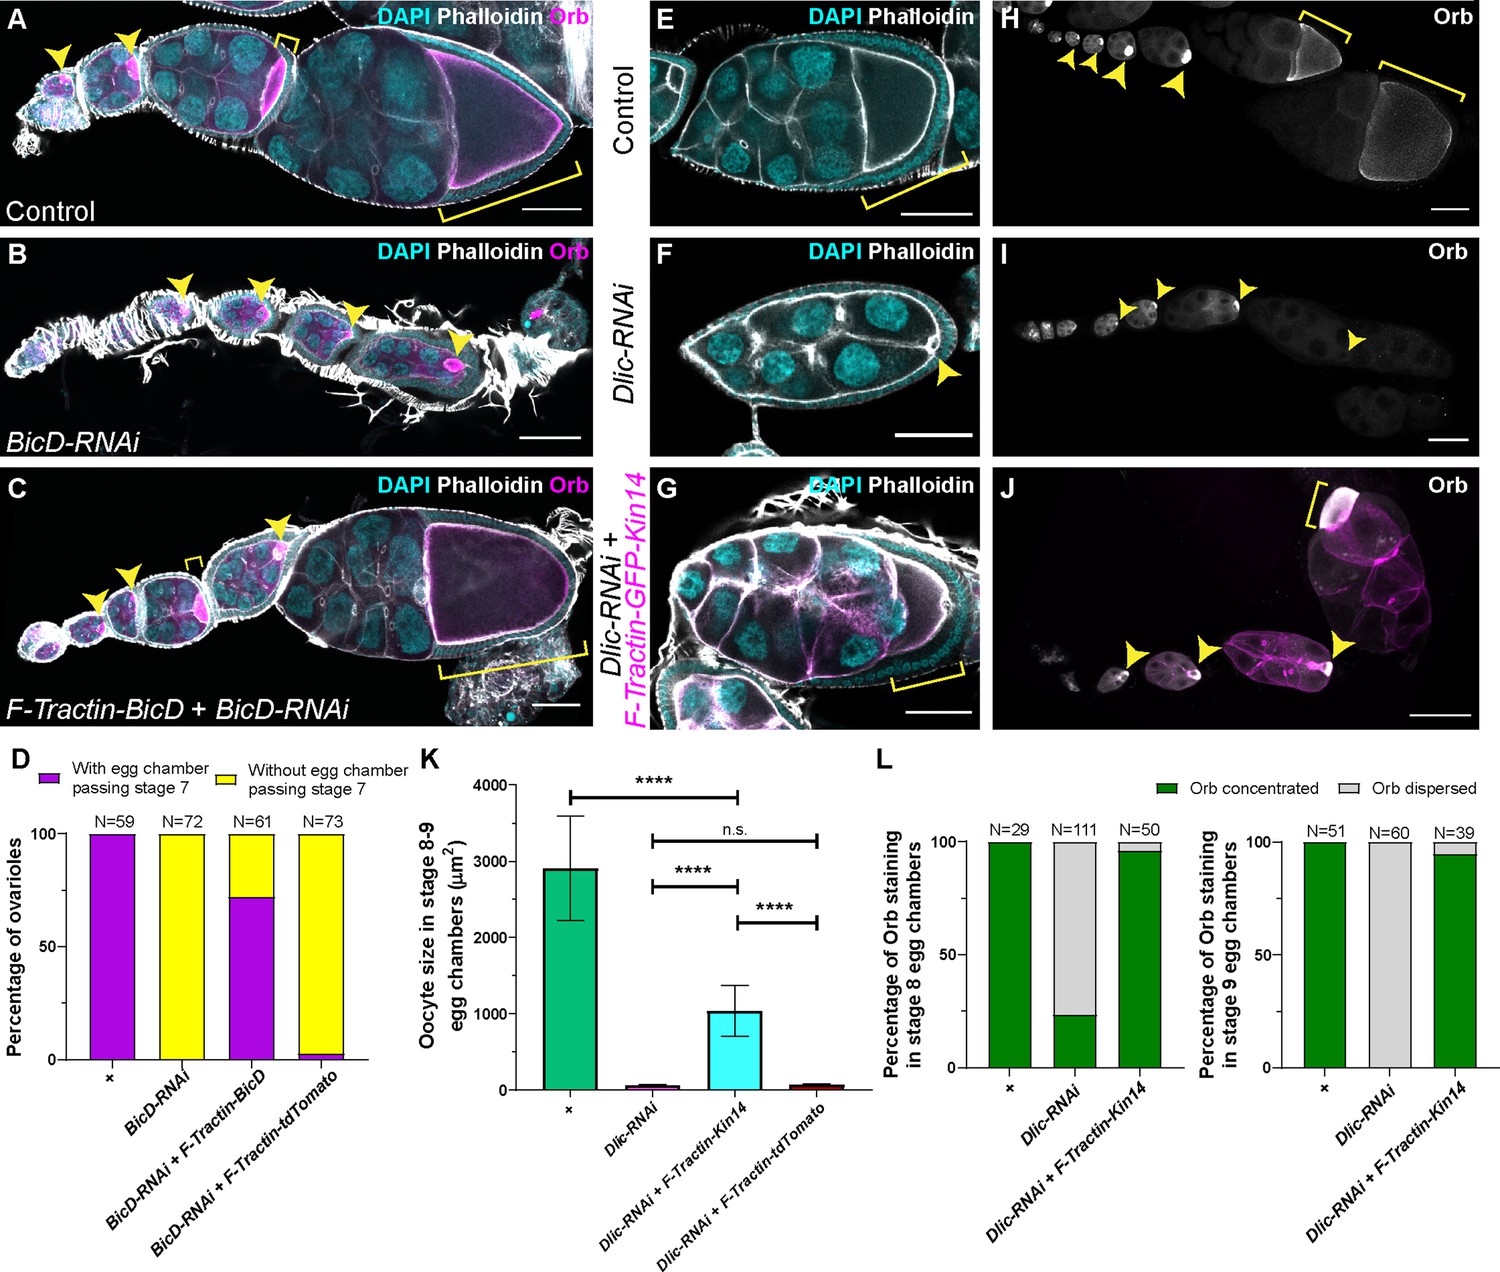
A cortically anchored minus-end motor is sufficient to drive oocyte growth.
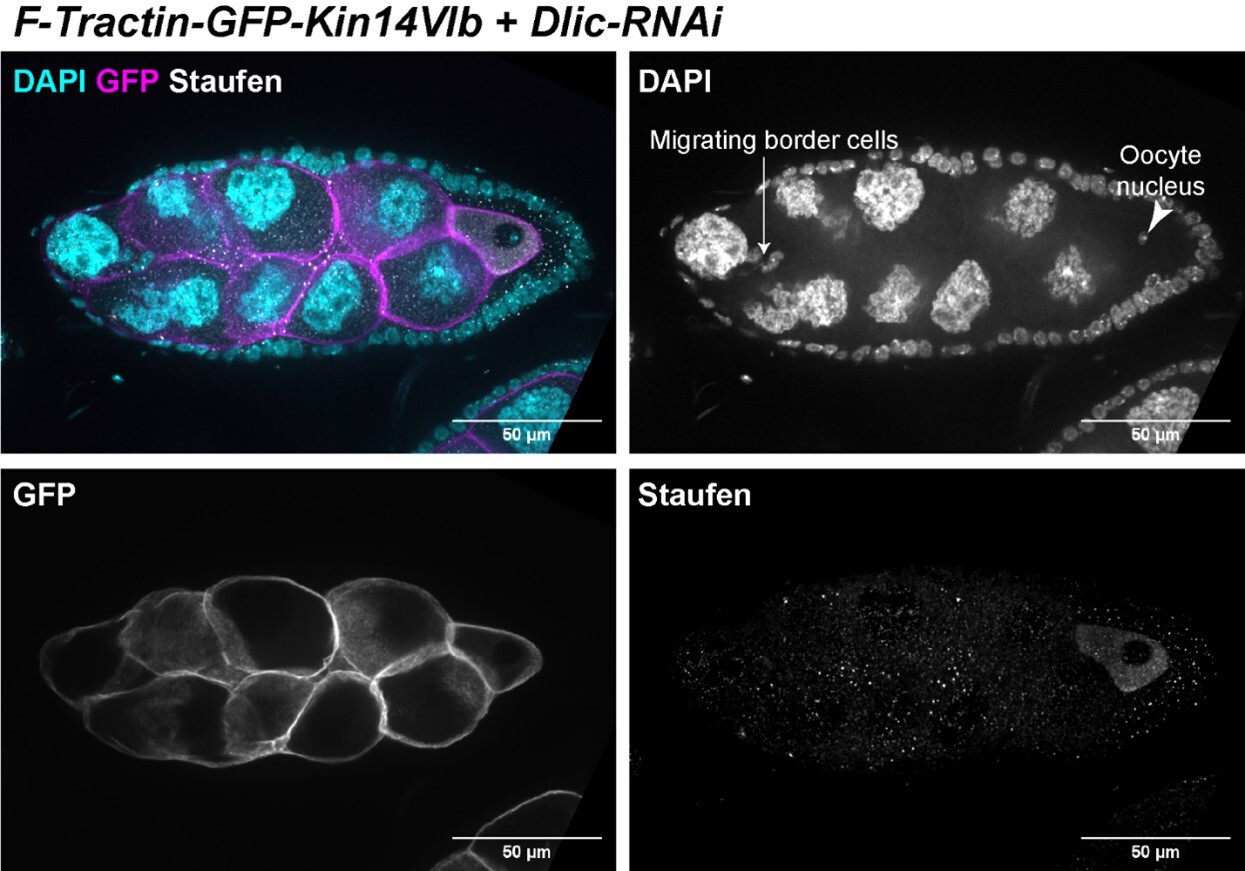
(A–C) Oocyte growth defect in BicD-RNAi is rescued by a cortically restricted BicD construct. (D) Summary of percentages of ovarioles with and without egg chamber(s) passing stage 7. Staging of BicD-RNAi egg chambers is determined by the nurse cell size. (E–J) The defects of oocyte growth and Orb concentration in Dlic-RNAi are rescued by a cortically recruited plant Kin14 (Kin14VIb) construct. Phalloidin and DAPI staining (E–G) or Orb staining (H–J) in control (E, H), Dlic-RNAi (F, I) and Dlic-RNAi rescued by F-tractin-GFP-Kin14 (G, J). (K) Quantification of oocyte size in stage 8~9 egg chambers in listed genotypes. The values shown in the graph are mean ± 95% confidence intervals. Control, N = 40; Dlic-RNAi, N = 49; Dlic-RNAi+ F-Tractin-Kin14, N = 33; Dlic-RNAi+ F-Tractin-tdTomato, N = 42. Unpaired t test with Welch’s correction were performed in following groups: between control and Dlic-RNAi, p < 0.0001 (****); between control and Dlic-RNAi+ F-Tractin-Kin14, p < 0.0001 (****); between control and Dlic-RNAi+ F-Tractin-tdTomato, p < 0.0001 (****); between Dlic-RNAi and Dlic-RNAi+ F-Tractin-Kin14, p < 0.0001 (****); between Dlic-RNAi and Dlic-RNAi+ F-Tractin-tdTomato, p = 0.2107 (n.s.); between Dlic-RNAi+ F-Tractin-Kin14 and Dlic-RNAi+ F-Tractin-tdTomato, p < 0.0001 (****). (L) Summary of Orb staining phenotypes in stage 8 (left) and stage 9 (right) egg chambers in listed genotypes. Oocytes are highlighted with either yellow arrowheads or yellow brackets. All listed genotypes carried one copy of maternal αtub-Gal4[V37]. Scale bars, 50 µm.
Figure 4—figure supplement 1
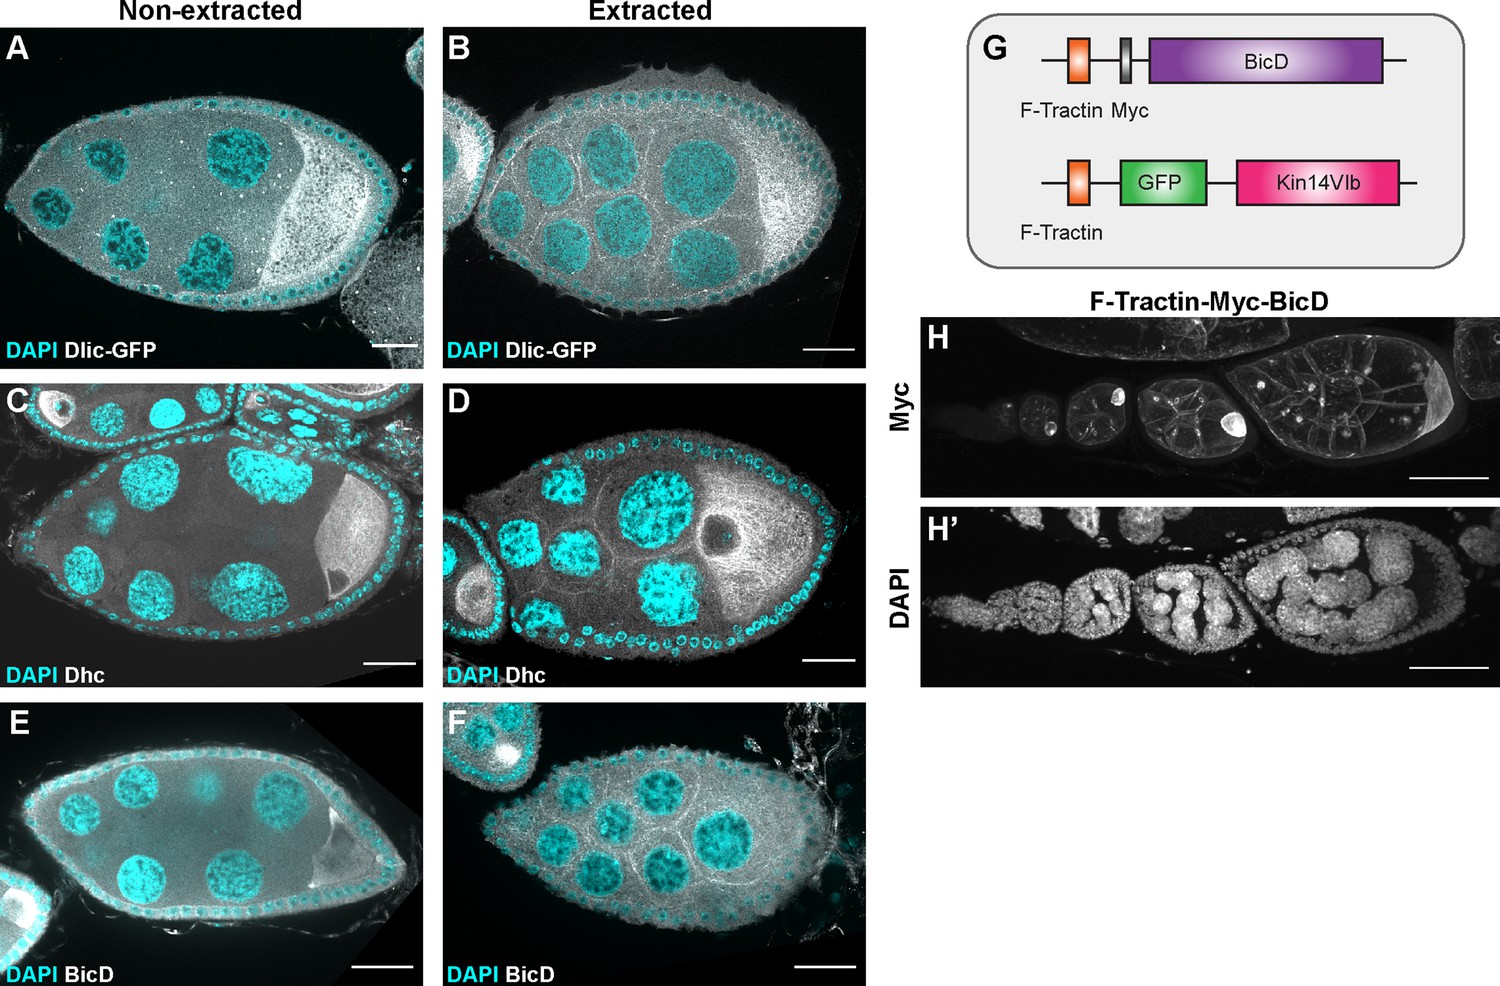
The recruitment of dynein to nurse cell cortex.
(A–F) Dlic-GFP under its endogenous promoter (A–B), DHC antibody staining (C–D) and BicD antibody staining (E–F) in non-extracted (A, C, E) and extracted (B, D, F) samples. After extraction, Dlic-GFP, Dhc staining and BicD staining all show clear cortical localization in nurse cells. Scale bars, 20 µm. (G) A schematic illustration of the cortically recruited BicD and Kin14 constructs. (H-H’) F-Tractin-Myc-BicD is predominantly localized to the cell cortex. The expression is driven by one copy of maternal αtub-Gal4[V37]. Scale bars, 50 µm.
Figure 4—video 1
Mitochondria movement (labeled with Mito-MoxMaple3, after global photoconversion) in the nurse cell-oocyte ring canals of control, Dlic-RNAi and Dlic-RNAi+ F-Tractin-GFP-Kin14VIb rescued samples.
Ring canals are either labeled with GFP-Pav (in control and Dlic-RNAi samples) or F-Tractin-GFP-Kin14VIb (in the Dlic-RNAi+ F-Tractin-GFP-Kin14VIb rescued sample), in magenta. Scale bars, 20 µm. Related to Figure 4.
Figure 5 with 2 supplements
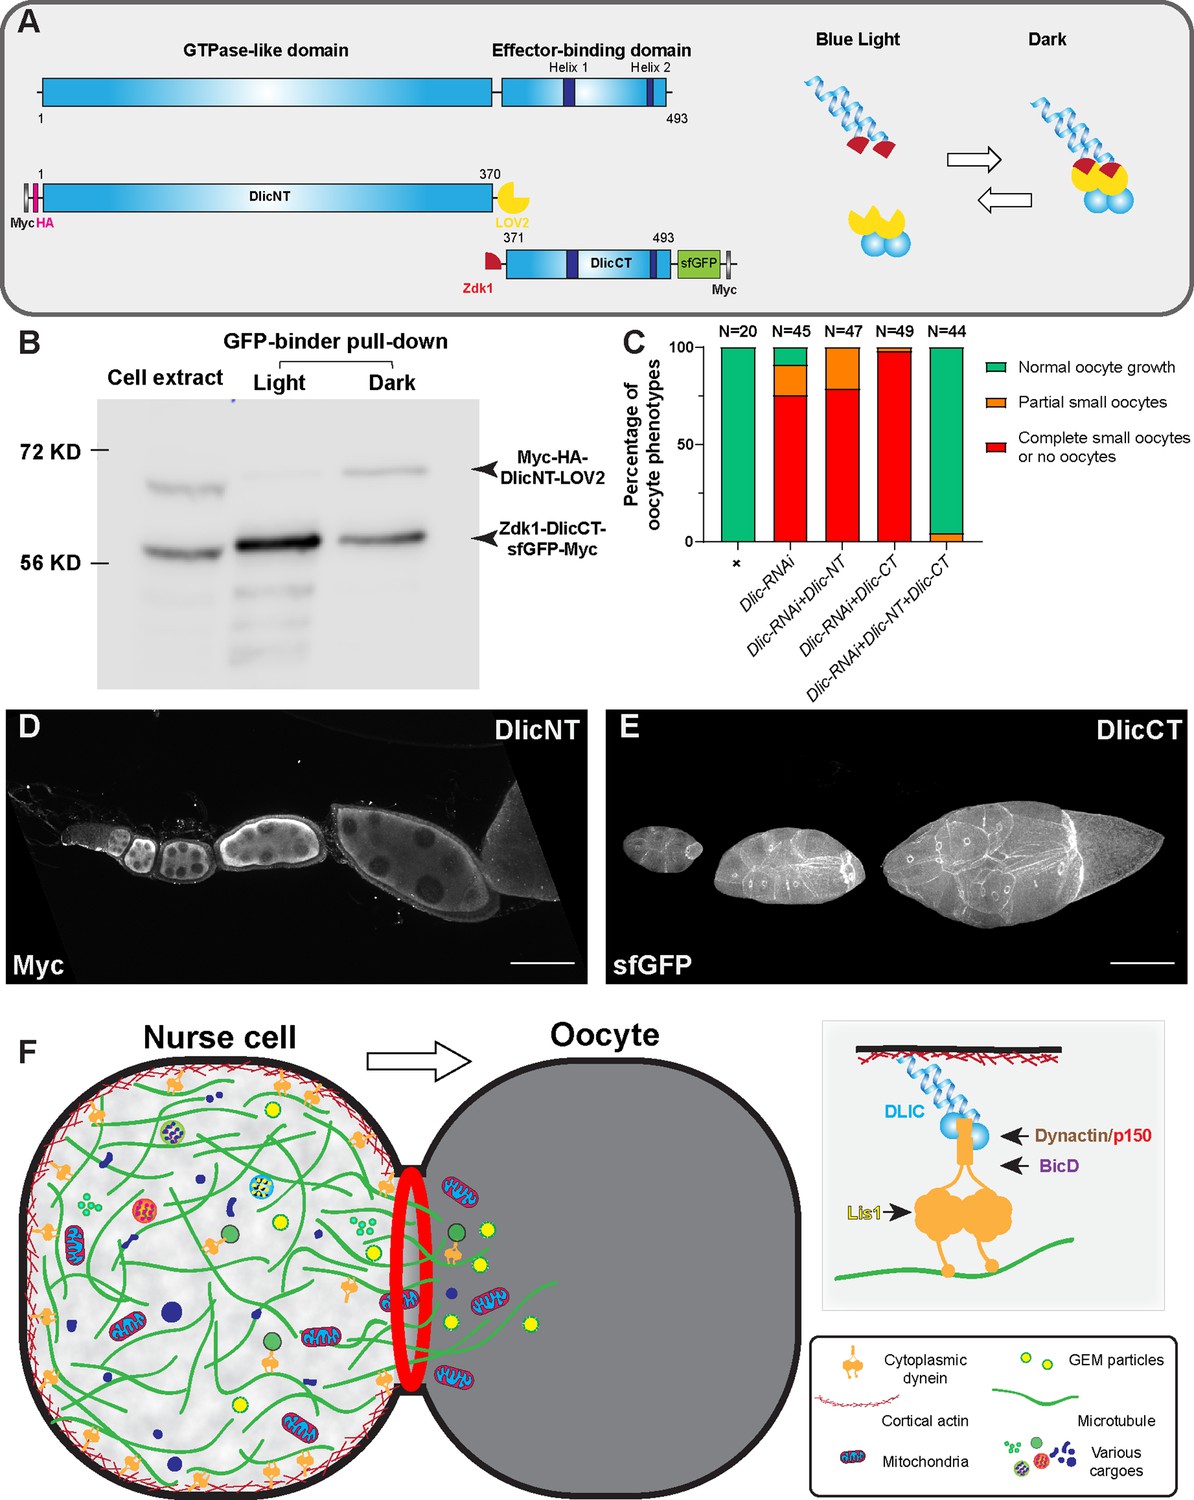
The dynein complex is tethered to the nurse cell cortex via Dlic and glides microtubules to create cytoplasmic advection to the growing oocyte.
(A) A schematic illustration of Drosophila Dlic and Dlic truncations (DlicNT and DlicCT). C-terminus of DlicNT and N-terminus of DlicCT are tagged with the LOVTRAP probes, LOV2 and Zdk1, respectively. LOV2 interacts with Zdk1 in dark, and dissociates from Zdk1 in the presence of blue light. (B) Zdk1-DlicCT interacts with DlicNT-LOV2 in dark. GFP-binder was used to pull down Zdk1-DlicCT in cell extracts from HEK293T cells expressing both DlicNT and DlicCT constructs, and anti-Myc antibody was used to probe for Dlic truncations. Lane 1: cell extract; Lane 2: GFP-binder pulldown sample in light; lane 3; GFP-binder pulldown sample in dark. The raw unedited blots can be found in Figure 5—source data 1: (1) the raw pulldown blot; (2) the labeled pulldown blot. (C) Coexpression of DlicNT and DlicCT truncations reuses the oogenesis defects caused by Dlic-RNAi, while DlicNT truncation or DlicCT truncation alone fails to rescue. The expression is driven by one copy of nos-Gal4-VP16. (D–E) DlicNT and DlicCT localizations in the germ line. The expression is driven by one copy of maternal αtub-Gal4[V37]. A small Z-projection (~5 µm) is used to show the DlicNT localization, while a whole ovariole z-projection ( ~ 40 µm) is used to show the DlicCT cortical localization. To note: overexpression of DlicNT driven by maternal αtub-Gal4[V37] results in delayed oocyte growth. Scale bars, 50 µm. (F) The model of cortically anchored dynein transferring cytoplasmic contents to the growing oocyte via gliding microtubules. Dynein light intermediate chain (Dlic) recruits dynein heavy chain to the cell cortex, while the Dynactin/p150 complex, BicD and Lis1 are required for dynein activation. See also Figure 5—video 1.
-
Figure 5—source data 1
Zdk1-DlicCT interacts with DlicNT-LOV2 in dark.
- https://cdn.elifesciences.org/articles/75538/elife-75538-fig5-data1-v2.zip
Figure 5—figure supplement 1

Cortical localization of Dlic C-terminus is independent of BicD, Dynactin/p150, Lis1 and Shot.
DlicCT localizations in control (A), BicD-RNAi (B), Dynactin/p150 inhibited (Glued∆C, C), Lis1-RNAi (D) and shot-RNAi shot∆EGC/+ (E) egg chambers. Whole ovariole z-projections (30 ~ 40 µm) are used to show the DlicCT cortical localization. The numbers of ovarioles examined: Control, N = 28; BicD-RNAi, N = 39; Glued∆C, N = 30; Lis1-RNAi, N = 29; shot-RNAi shot∆EGC/+, N = 33. All listed genotypes are with one copy of maternal αtub-Gal4[V37]. Scale bars, 50 µm.
Figure 5—video 1
Cortical dynein glides microtubules and transfers cytoplasm to the Drosophila oocyte.
Related to Figure 5.
Author response image 1
Author response image 2
Author response image 3
Tables
Appendix 1—key resources table
| Reagent type (species) or resource | Designation | Source or reference | Identifiers | Additional information |
|---|---|---|---|---|
| gene (Drosophila melanogaster) | BicD | doi: 10.7554/ eLife.10140 (Del Castillo et al., 2015) | CG6605 | |
| gene (Drosophila melanogaster) | Dlic | Thomas Hays lab (University of Minnesota); doi:10.1091/mbc. E08-05-0483 (Mische et al., 2008) | CG1938 | |
| gene (Rattus norvegicus) | Inositol trisphosphate 3-kinase A (lTPKA) | doi:10.1091/mbc. E09-01-0083 (Johnson and Schell, 2009); doi:10.1016 /j. ydbio.2014.06.022 (Spracklen et al., 2014) | Gene ID: 81677 | |
| gene (Pyrococcus furiosus) | PfV | Addgene plasmid # 116933; doi:10.1016 /j.cell. 2018.05.042 (Delarue et al., 2018) | GenBank: AB214633.1; RRID:Addgene_116933 | |
| gene (Physcomitrella patens) | Kin14VIb | Gohta Goshima lab; doi:10.1038/NPLANTS.2015.87 (Jonsson et al., 2015) | ||
| genetic reagent (Drosophila melanogaster) | mat αtub-Gal4[V37] | Bloomington Drosophila Stock Center | BDSC: 7063; FlyBase ID: FBti0016914 | |
| genetic reagent (Drosophila melanogaster) | Act5C-Gal4 | Bloomington Drosophila Stock Center | BDSC: 3954; FlyBase ID: FBti0012292 | |
| genetic reagent (Drosophila melanogaster) | nos-Gal4-VP16 | Edwin Ferguson lab (University of Chicago); doi: 10.1016 / s0960-9822(98)70091-0 (Van Doren et al., 1998) | ||
| genetic reagent (Drosophila melanogaster) | UAS-Dhc64C-RNAi | Bloomington Drosophila Stock Center | BDSC: 36583; FlyBase ID: FBti0146459; TRiP.GL00543 | |
| genetic reagent (Drosophila melanogaster) | UAS-Dhc64C-RNAi | Bloomington Drosophila Stock Center | BDSC: 36698; FlyBase ID: FBti0146710; TRiP.HMS01587 | |
| genetic reagent (Drosophila melanogaster) | UASp-Gl∆C | Thomas Hays lab (University of Minnesota); doi:10.1091/mbc. E06-10-0959 (Mische et al., 2007) | Line # 16.1 | |
| genetic reagent (Drosophila melanogaster) | UAS-Lis1-RNAi | Graydon Gonsalvez lab (Augusta University); doi:10.1534/genetics. 115.180018 (Liu et al., 2015) | ||
| genetic reagent (Drosophila melanogaster) | UAS-BicD-RNAi | Bloomington Drosophila Stock Center | BDSC: 35405; FlyBase ID: FBti0144407; TRiP.GL00325 | |
| genetic reagent (Drosophila melanogaster) | UAS-Spindly-RNAi | Bloomington Drosophila Stock Center | BDSC: 34933; FlyBase ID: FBti0144908; TRiP.HMS01283 | |
| genetic reagent (Drosophila melanogaster) | UAS-hook-RNAi | Bloomington Drosophila Stock Center | BDSC: 64663; FlyBase ID: FBti0183911; TRiP.HMC05698 | |
| genetic reagent (Drosophila melanogaster) | UAS-GFP-RNAi | Bloomington Drosophila Stock Center | BDSC: 41551; FlyBase ID: FBti0148872 | |
| genetic reagent (Drosophila melanogaster) | UASp-tdMaple3- αtub84B | Our lab; doi:10.1073/pnas. 1522424113 (Lu et al., 2016) | ||
| genetic reagent (Drosophila melanogaster) | UASp-EMTB- 3XTagRFP | Our lab; doi:10.7554/eLife. 54216 (Lu et al., 2020) | ||
| genetic reagent (Drosophila melanogaster) | mat αtub67C- EMTB-3XGFP- sqh 3'UTR | Yu-Chiun Wang lab (RIKEN Center for Biosystems Dynamics Research) (an unpublished gift) | ||
| genetic reagent (Drosophila melanogaster) | UASp-GFP- Patronin | Uri Abdu lab (Ben Gurion University); doi:10.7554/eLife.54216 (Lu et al., 2020); doi:10.1083/jcb.201709174 (Lu et al., 2018); doi:10.1242/bio.039552 (Baskar et al., 2019); doi:10.1016 /j.cub. 2021.05.010 (Lu et al., 2021) | ||
| genetic reagent (Drosophila melanogaster) | Jupiter-GFP | Yale GFP Protein Trap Database doi: 10.1073/pnas. 261408198 (Morin et al., 2001); doi:10.1016 /j.cub. 2013.04.050 (Lu et al., 2013b); doi:10.1091/mbc. E14-10-1423 (Lu et al., 2015); doi:10.1002 /cm. 20124 (Karpova et al., 2006) | ZCL2183; FlyBase ID: FBal0286259 | |
| genetic reagent (Drosophila melanogaster) | UASp-LifeAct- TagRFP | Bloomington Drosophila Stock Center | BDSC: 58714; FlyBase ID: FBti0164964 | |
| genetic reagent (Drosophila melanogaster) | UASp-F-Tractin- tdTomato | Bloomington Drosophila stock center; doi:10.1016 /j. ydbio.2014.06.022 (Spracklen et al., 2014) | BDSC: 58989; FlyBase ID: FBti0164816 | |
| genetic reagent (Drosophila melanogaster) | UAS-zip-RNAi | Bloomington Drosophila Stock Center | BDSC: 37480; FlyBase ID: FBti0146538; TRiP.GL00623 | |
| genetic reagent (Drosophila melanogaster) | hs-Flp12; Sco/CyO | Bloomington Drosophila stock center | BDSC: 1929; FlyBase ID: FBti0000784 | |
| genetic reagent (Drosophila melanogaster) | FRTG13 zip2/CyO | Bloomington Drosophila stock center | BDSC: 8739; FlyBase ID: FBti0001247 and FBal0018863 | |
| genetic reagent (Drosophila melanogaster) | FRTG13 Ubi-GFP.nls | Bloomington Drosophila stock center | BDSC: 5826; FlyBase ID: FBti0001247, FBti0016099 and FBti0016100 | |
| genetic reagent (Drosophila melanogaster) | Sqh-GFP | Bloomington Drosophila stock center | BDSC: 57145; FlyBase ID: FBti0150058 | |
| genetic reagent (Drosophila melanogaster) | UASp-Mito- MoxMaple3 | Our lab; doi:10.1016 / j.cub.2021.05.010 (Lu et al., 2021) | ||
| genetic reagent (Drosophila melanogaster) | ubi-GFP-Pav | David Glover lab (Caltech); doi: 10.1242/jcs. 115.4.725 (Minestrini et al., 2002) | ||
| genetic reagent (Drosophila melanogaster) | UASp-RFP-Golgi | Bllomington stock center; doi:10.1038 /s41598- 017-05679-1 (Chowdhary et al., 2017); doi:10.1016 /j.cub. 2021.05.010 (Lu et al., 2021) | BDSC: 30908; FlyBase ID: FBti0129915 | |
| genetic reagent (Drosophila melanogaster) | pDlic-Dlic-GFP | Thomas Hays (University of Minnesota) (Neisch et al., 2021)doi: https://doi.org/10.1101/2021.09.27.462070 | ||
| genetic reagent (Drosophila melanogaster) | shot∆EGC | Ferenc Jankovics, Institute of Genetics, Biological Research Centre of the Hungarian Academy of Sciences; doi:10.1242/jcs.193003 (Takács et al., 2017) | ||
| genetic reagent (Drosophila melanogaster) | UASp-shot-RNAi | Our lab; doi:10.1016 / j.cub.2021.05.010 (Lu et al., 2021) | ||
| genetic reagent (Drosophila melanogaster) | UASp-Dlic-RNAi | Generated in this study (available upon request, contact vgelfand@northwestern.edu) | ||
| genetic reagent (Drosophila melanogaster) | UASp-GEM | Generated in this study (available upon request, contact vgelfand@northwestern.edu) | ||
| genetic reagent (Drosophila melanogaster) | UASp-F-Tractin- Myc-BicD | Generated in this study (available upon request, contact vgelfand@northwestern.edu) | ||
| genetic reagent (Drosophila melanogaster) | UASp-F-Tractin- GFP-Kin14VIb | Generated in this study (available upon request, contact vgelfand@northwestern.edu) | ||
| genetic reagent (Drosophila melanogaster) | UASp-Myc-HA- DlicNT-LOV2 | Generated in this study (available upon request, contact vgelfand@northwestern.edu) | ||
| genetic reagent (Drosophila melanogaster) | UASp-Zdk1-DlicCT- sfGFP-Myc | Generated in this study (available upon request, contact vgelfand@northwestern.edu) | ||
| cell line (Drosophila melanogaster) | S2R + cells | Drosophila Genomics Resource Center (DGRC) | Stock Number: 150; RRID:CVCL_Z831 | Tested negative for mycoplasma; authenticated by the vendor |
| cell line (Homo sapiens) | HEK293T cells | ATCC; doi: 10.1096/ fj.201800604R (Robert et al., 2019) | CRL-3216 | Tested negative for mycoplasma; authenticated by the vendor |
| transfected construct (Drosophila melanogaster) | pcDNA3.1(+)-Myc- HA-DlicNT-LOV2 | Generated in this study (available upon request, contact vgelfand@northwestern.edu) | Contains Drosophila Dlic residues 1–370 and LOVTRAP probe LOV2[WT] | For transfection of HEK293T cells |
| transfected construct (Drosophila melanogaster) | pcDNA3.1(+)-Zdk1- DlicCT-sfGFP-Myc | Generated in this study (available upon request, contact vgelfand@northwestern.edu) | Contains LOVTRAP probe Zdk1 and Drosophila Dlic residues 371–493 | For transfection of HEK293T cells |
| antibody | anti-Orb antibody (Mouse monoclonal) | Developmental Studies Hybridoma Bank (DSHB) | orb 4H8; RRID: AB_528418 | (1:5) dilution |
| antibody | FITC-conjugated anti-β tubulin antibody (Mouse monoclonal) | ProteinTech | Cat#: CL488-66240; RRID: AB_2883292 | (1:100) dilution |
| antibody | anti-Drosophila dynein heavy chain antibody (Mouse monoclonal) | Developmental Studies Hybridoma Bank (DSHB) | 2C11-2; RRID: AB_2091523 | (1:50) dilution |
| antibody | anti-Myc antibody (Mouse monoclonal) | doi: 10.1126/science.1061086 (Karcher et al., 2001) | Purified from Hybridoma cell line MYC 1-9E10.2 (RRID:CVCL_G671) | (1:100) dilution |
| antibody | anti-BicD antibody (Mouse monoclonal) | Developmental Studies Hybridoma Bank (DSHB) | anti-Bicaudal-D 4C2; RRID: AB_528103 | (1:5) dilution |
| antibody | anti-phospho-myosin light chain 2 (Ser19) (Rabbit polyclonal) | Cell Signaling | Cat# 3671; RRID: AB_330248 | (1:100) dilution |
| antibody | Fluorescein (FITC) affiniPure anti- Mouse IgG (H + L) (Goat polyclonal) | Jackson ImmunoResearch | Cat# 115-095-062; RRID: AB_2338594 | 10 µg/ml |
| antibody | Rhodamine (TRITC) affiniPure anti- Mouse IgG (H + L) (Goat polyclonal) | Jackson ImmunoResearch | Cat# 115-025-003; RRID: AB_2338478 | 10 µg/ml |
| antibody | Fluorescein (FITC) affiniPure anti- Rabbit IgG (H + L) (Goat polyclonal) | Jackson ImmunoResearch | Cat#111-095-003; RRID: AB_2337972 | 10 µg/ml |
| antibody | HRP affiniPureanti-mouse IgG (H + L) (Goat polyclonal) | Jackson ImmunoResearch | Cat# 115-035-003; RRID: AB_10015289 | 10 µg/ml |
| recombinant DNA reagent (Drosophila melanogaster) | pWalium22- Dlic3’UTR-shRNA | Generated in this study (available upon request, contact vgelfand@northwestern.edu) | Targeting Dlic 3’UTR 401–421 nt, 5’-AGAAATTTAAC AAAAAAAAAA –3’ | DNA plasmid for generating transgenic flies |
| recombinant DNA reagent (Pyrococcus furiosus) | pUASp-GEM | Generated in this study (available upon request, contact vgelfand@northwestern.edu) | Subcloned from pCDNA3.1-pCMV-PfV-GS-Sapphire (Addgene plasmid # 116933; RRID:Addgene_116933) | DNA plasmid for generating transgenic flies |
| recombinant DNA reagent (Drosophila melanogaster) | pUASp-F-Tractin-Myc-BicD | Generated in this study (available upon request, contact vgelfand@northwestern.edu) | Includes the actin binding domain of rat Inositol trisphosphate 3-kinase A (lTPKA residues 9–40), Myc and Drosophila BicD | DNA plasmid for generating transgenic flies |
| recombinant DNA reagent (Physcomitrella patens) | pUASp-F-Tractin-GFP-Kin14VIb | Generated in this study (available upon request, contact vgelfand@northwestern.edu) | Includes the actin binding domain of rat Inositol trisphosphate 3-kinase A (lTPKA residues 9–40), GFP and Physcomitrella patens kinesin14VIb | DNA plasmid for generating transgenic flies |
| recombinant DNA reagent (Drosophila melanogaster) | pUASp-Myc-HA-DlicNT-LOV2-attB | Generated in this study (available upon request, contact vgelfand@northwestern.edu) | Contains Drosophila Dlic residues 1–370 and LOVTRAP probe LOV2[WT] | DNA plasmid for generating transgenic flies |
| recombinant DNA reagent (Drosophila melanogaster) | pUASp-Zdk1-DlicCT-sfGFP-Myc-attB | Generated in this study (available upon request, contact vgelfand@northwestern.edu) | Contains LOVTRAP probe Zdk1 and Drosophila Dlic residues 371–493 | DNA plasmid for generating transgenic flies |
| chemical compound, drug | Rhodamine-labeled phalloidin | Thermo Fisher Scientific | Cat# R415 | 0.2 µg/ml |
| chemical compound, drug | DAPI | Sigma-Aldrich (MilliporeSigma) | D9542-1MG | 1 µg/ml |
| chemical compound, drug | 16% Paraformaldehyde Aqueous Solution, EM Grade | Fisher Scientific (Electron Microscopy Science) | Cat# 50-980-487 (EMS 15710) | 4% or 8% for fixation |
Additional files
Download links
A two-part list of links to download the article, or parts of the article, in various formats.
Downloads (link to download the article as PDF)
Open citations (links to open the citations from this article in various online reference manager services)
Cite this article (links to download the citations from this article in formats compatible with various reference manager tools)
A novel mechanism of bulk cytoplasmic transport by cortical dynein in Drosophila ovary
eLife 11:e75538.
https://doi.org/10.7554/eLife.75538


