Comprehensive interrogation of the ADAR2 deaminase domain for engineering enhanced RNA editing activity and specificity
- Department of Bioengineering, University of California San Diego, United States
- Division of Biological Sciences, University of California San Diego, United States
Figures
Figure 1 with 3 supplements
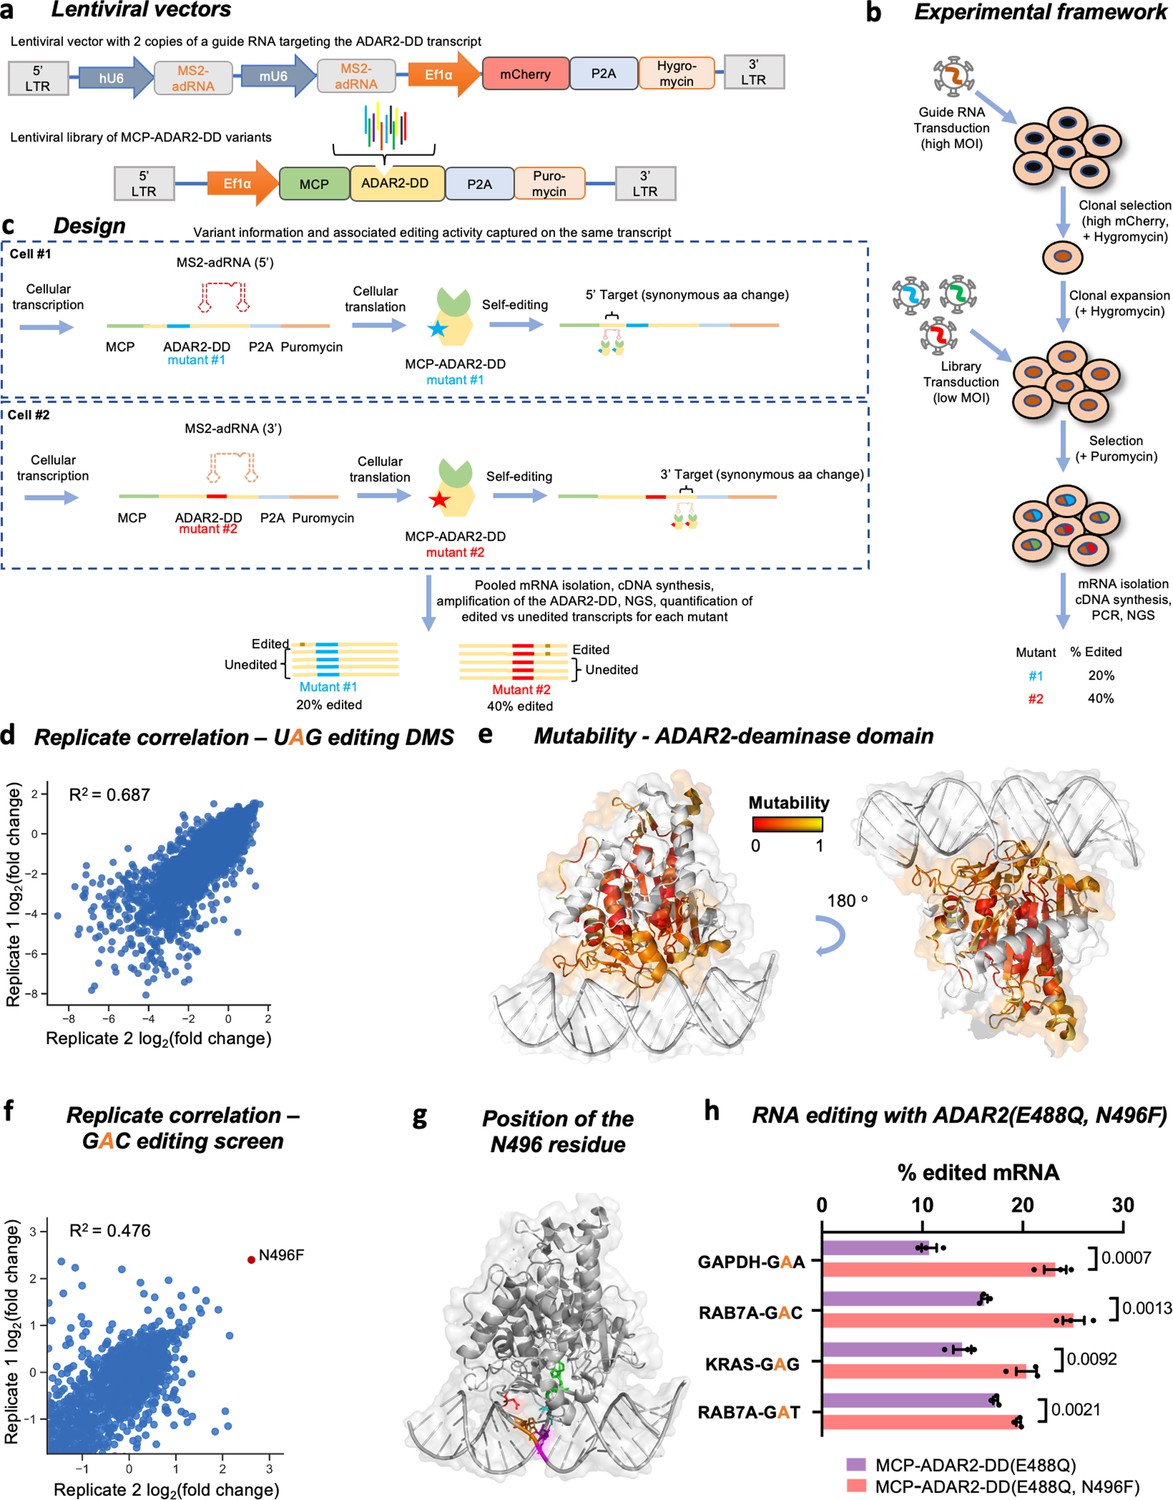
Overview of the ADAR2 deaminase domain (ADAR2-DD) deep mutational scan (DMS) and 5’-GAN-3’ enhancer editing screen.
(a) Lentiviral vectors comprising two copies of MS2-adRNA both targeting either a 5’ or a 3’ UAG target site for the DMS were created. For the 5’-GAN-3’ enhancer screen, the MS2-adRNAs targeted a 5’ or 3’ GAC site. The lentiviral vector alco contained a mCherry and hygromycin resistance marker. Libraries of single amino acid variants of the ADAR2-DD were created in a second lentiviral with a puromycin selection marker. For the 5’-GAN-3’ enhancer screen, the corresponding library was created in the hyperactive ADAR2-DD(E488Q) backbone. (b) HEK293FT cells were transduced with the MS2-adRNA lentiviruses at a high multiplicity of infection (MOI) and upon hygromycin selection, a single clone with high mCherry expression was selected. Four independent clonal cell lines were created, harboring MS2-adRNA targeting the 5’ and 3’ UAG and GAC sites. The clonal cell line bearing the MS2-adRNA was then transduced with the lentiviral library of MCP-ADAR2-DD variants at a low MOI to ensure delivery of a single variant per cell. Cells were then selected with puromycin. (c) During the processes of cellular transcription and translation, each cell produces the MS2-adRNA as well as MCP-ADAR2-DD variant. Upon translation in the cell, each MCP-ADAR2-DD variant, in combination with the MS2-adRNA, edits its own transcript creating a synonymous change. Cells were harvested, mRNA isolated and regions of the ADAR2-DD were amplified and sequenced. The fraction of edited reads was then computed for each mutant. (d) Replicate correlation for the ADAR2-DD DMS. The X and Y axes represent the log2 fold change in editing as compared to the ADAR2. (e) Structure of the ADAR2-DD bound to its substrate (PDB 5HP3) with the degree of mutability of each residue as measured by the DMS highlighted. Residues that are highly intolerant to mutations are colored red while residues that are highly mutable are colored yellow. Residues not assayed in this DMS are colored white. (f) Using the library chassis of the DMS, a screen of deaminase domain mutants (in an E488Q background) was performed to mine variants with improved activity against 5’-GAN-3’ RNA motifs. Replicate correlation for the 5’-GAN-3’ enhancer mutant screen. The X and Y axes represent the log2 fold change in editing as compared to the ADAR2. (g) Structure of the ADAR2-DD(E488Q) bound to its substrate (PDB 5ED1) with the N496 residue highlighted in red, the E488Q residue in cyan, the target adenosine in green, the orphaned cytosine in magenta, and the adenosine on the unedited strand that base pairs with the 5’ uracil flanking the target adenosine in orange. (h) The E488Q, N496F double mutant was validated by editing a GAA motif in the GAPDH CDS, a GAG motif in the KRAS CDS and GAC, GAT motifs in the RAB7A 3’ UTR. Values represent mean ± SEM (n = 3). p-Values were computed using a two-tailed unpaired t-test. All experiments were carried out in HEK293FT cells.
-
Figure 1—source data 1
ADAR2 deaminase domain deep mutational scan and 5’-GAN-3’ enhancer editing screen.
- https://cdn.elifesciences.org/articles/75555/elife-75555-fig1-data1-v2.xlsx
Figure 1—figure supplement 1
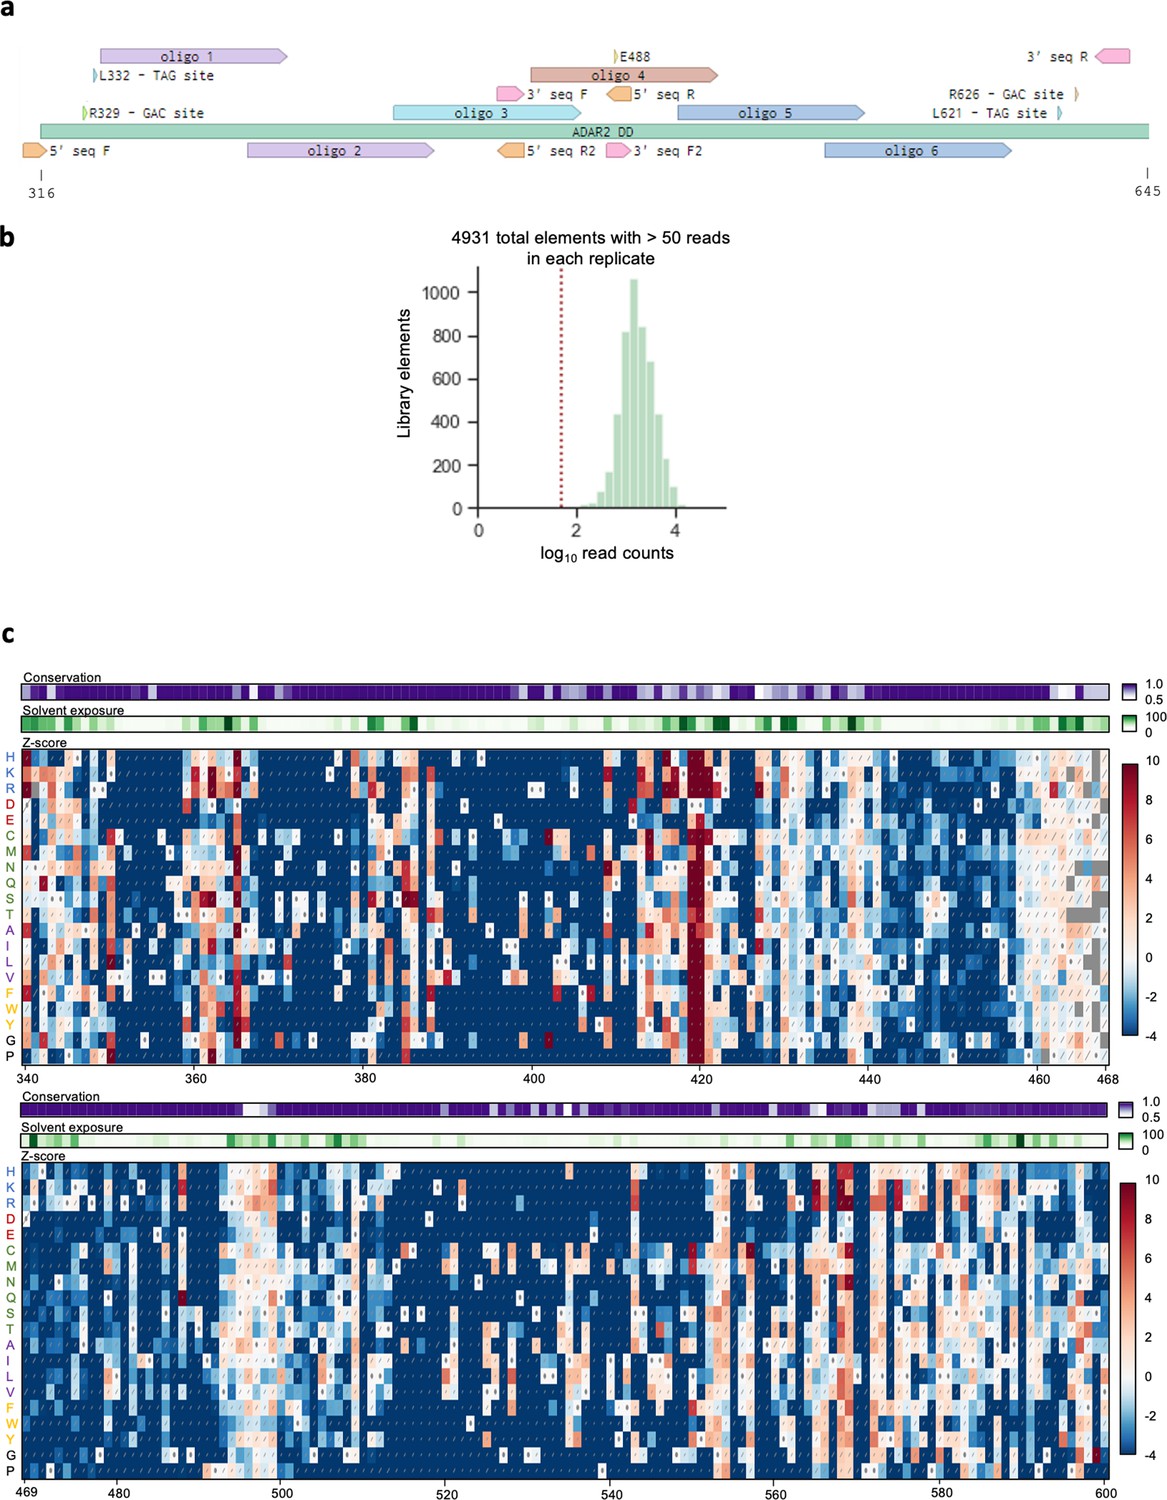
Deep mutational scan (DMS) of the ADAR2 deaminase domain (ADAR2-DD).
(a) Schematic of the ADAR2-DD showing oligonucleotide pools used to create the DMS library along with editing sites and primer binding sites. Oligonucleotide libraries 1, 2, and 3 were assayed for editing at the sites located at the 5’ end while libraries 4, 5, and 6 were assayed for editing at the 3’ end. Libraries 1 and 2 were amplified using primers 5’ seq F and 5’ seq R2, library 3 with 5’ seq F and 5’ seq R, library 4 with 3’ seq F and 3’ seq R and libraries 5 and 6 with 3’ seq F2 and 3’ seq R. (b) Histogram of variant counts from the DMS; 4958 of the 4959 variants were detected with 4931 variants showing >50 reads per replicate. (c) Heatmaps illustrating impact of single amino acid substitutions in residues 340–600 on the ability of the ADAR2-DD to edit a UAG motif. Rectangles are colored according to the scale bar on the right depicting the Z-score. Diagonal bars indicate standard error. The amino acids in the wild-type ADAR2-DD are indicated in the heatmap with a∙. Amino acids are indicated on the left and grouped based on type of amino acid: positively charged, negatively charged, polar-neutral, non-polar, aromatic, and unique. The heatmap bars at the top represent amino acid conservation score and surface exposure, respectively.
Figure 1—figure supplement 2
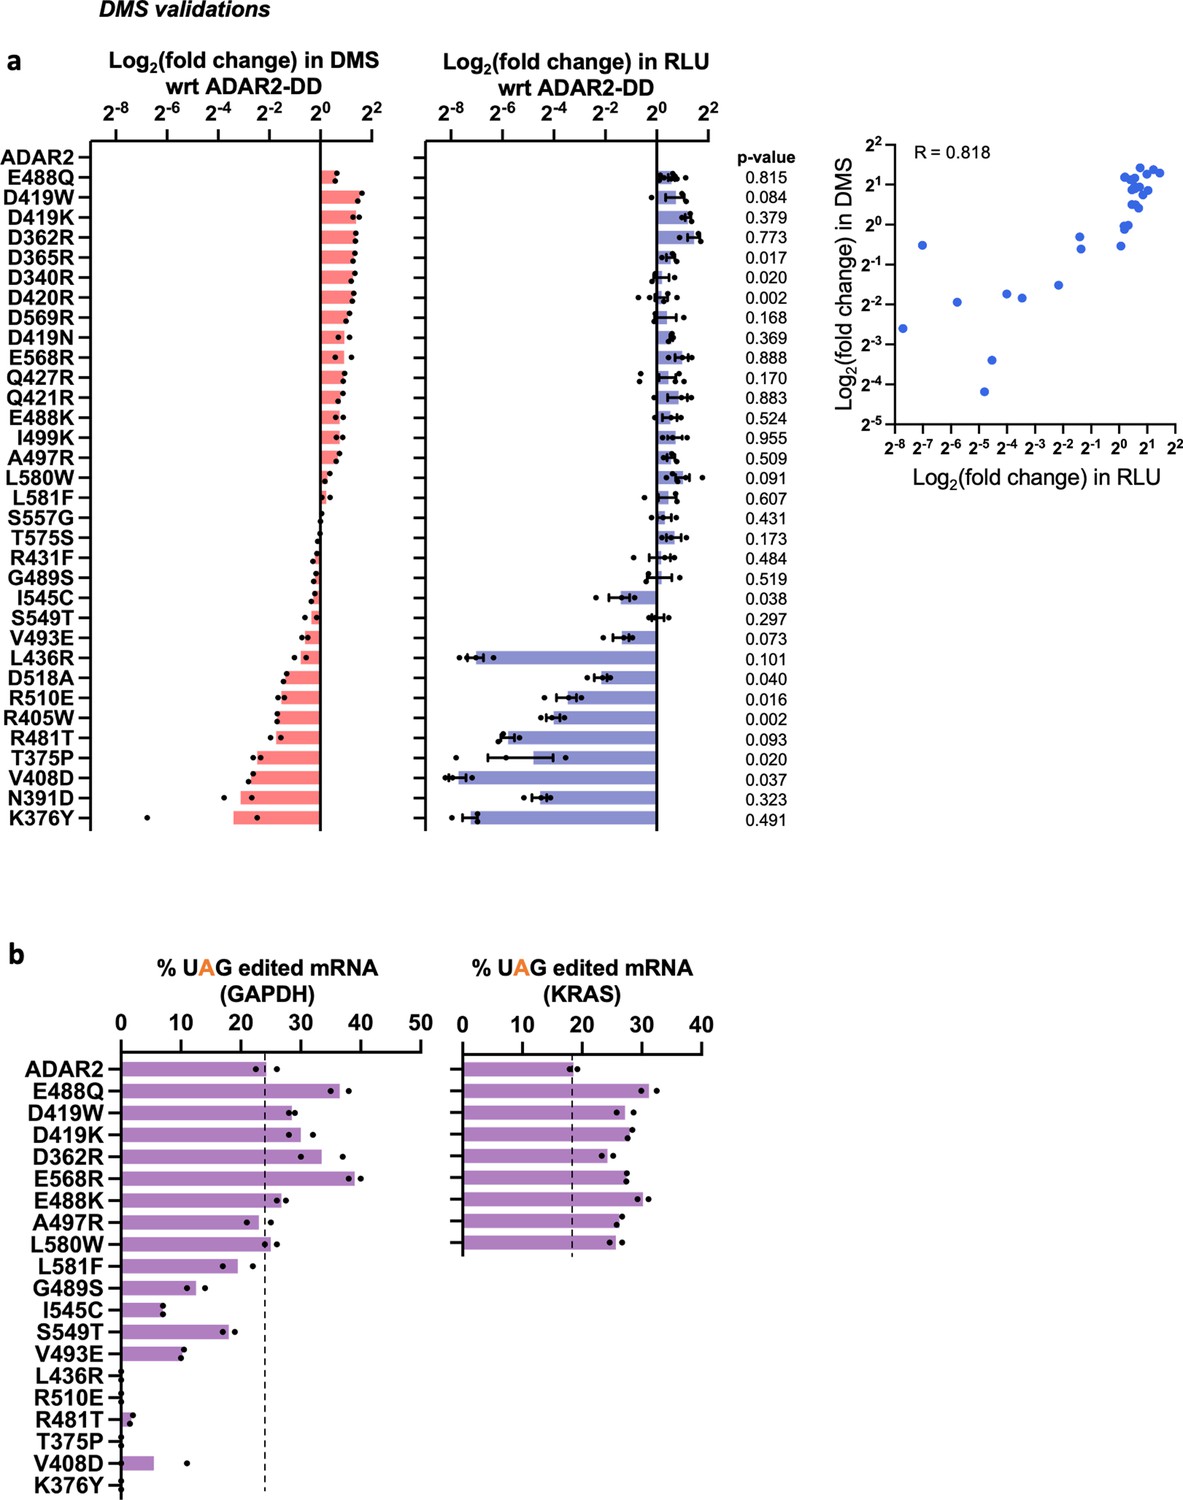
Characterization of ADAR2 deaminase domain (ADAR2-DD) mutants.
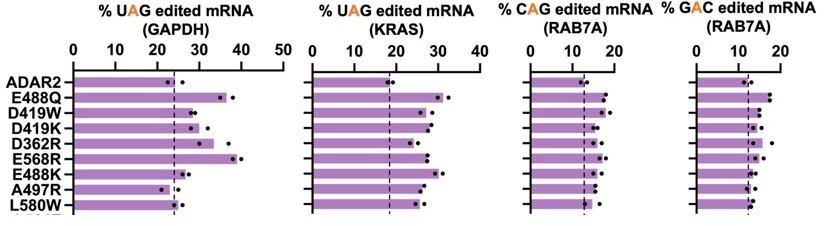
(a) A panel of mutants from the pooled deep mutational scan (DMS) screens were individually validated in an arrayed luciferase assay using a cluc reporter bearing a UAG stop codon. The plots represent log2 fold change as compared to the wild-type ADAR2 for (i) the DMS screen and (ii) the arrayed luciferase assay. Values represent mean ± SEM for the luciferase assay (n > 2) and mean for the DMS (n = 2). p-Values were computed using Welch’s t-test; 72% of the validated samples were not significantly different from the data obtained in the screen (p > 0.05). Panel (iii) depicts the correlation between the luciferase assay and the DMS. The Pearson correlation between the arrayed validations and the data obtained in the screen was 0.818 while the Spearman (rank) correlation was 0.824. (b) A subset of mutants from panel a were validated by editing UAG sites in the GAPDH and KRAS CDS. Values represent mean (n = 2). All experiments were carried out in HEK293FT cells.
Figure 1—figure supplement 3
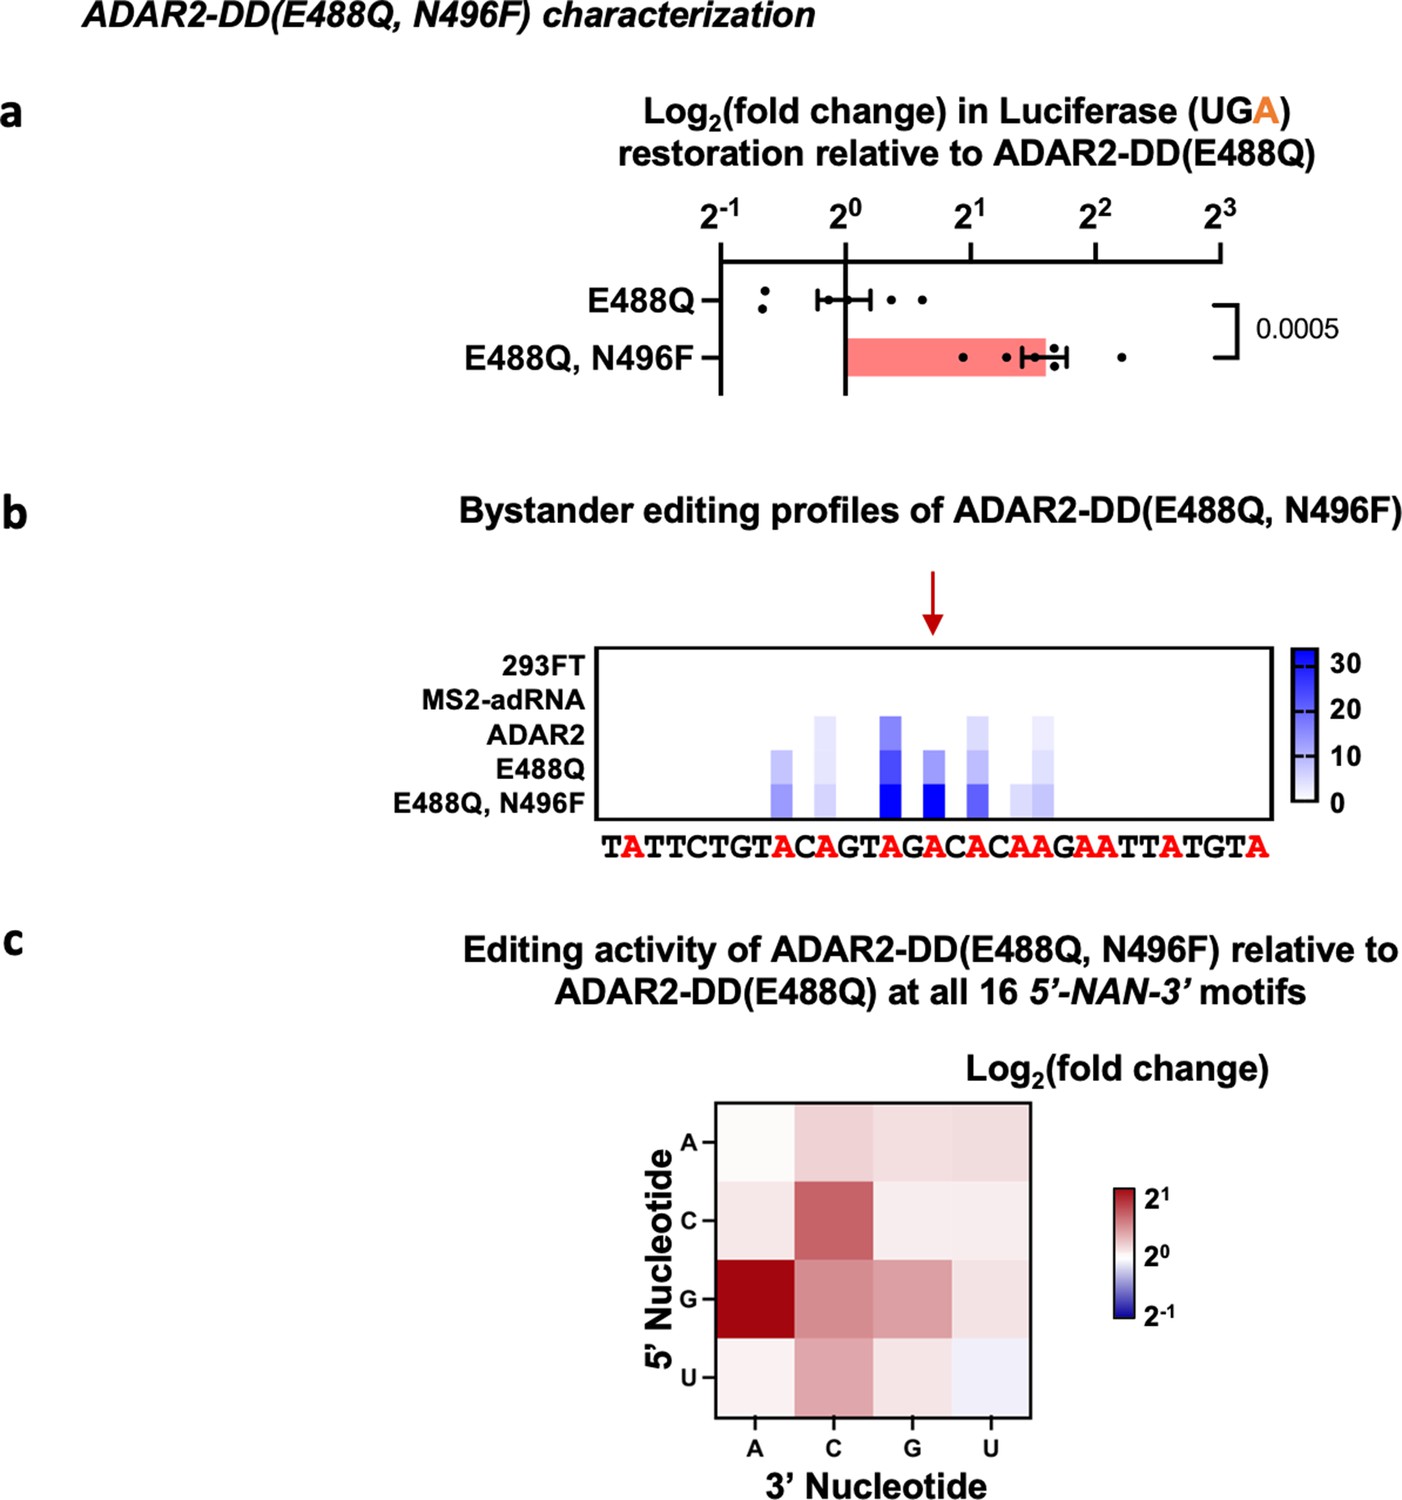
Characterization of ADAR2 deaminase domain (ADAR2-DD) E488Q, N496F mutant.
(a) The E488Q, N496F double mutant was validated in a luciferase assay using a cluc reporter bearing a UGA stop codon. The plot represents log2 fold change as compared to the ADAR2-DD(E488Q). Values represent mean ± SEM (n = 6). p-Values were computed using a two-tailed unpaired t-test. (b) Heatmap depicting hyper-editing observed with the N496F, E488Q double mutant corresponding to the RAB7A plot in Figure 1g. The red arrow indicates the target. (c) Editing activity of the E488Q, N496F double mutant against all 16 5’-GAN-3’ motifs was measured relative to the E488Q. Values represent mean (n = 2). All experiments were carried out in HEK293FT cells.
Figure 2 with 1 supplement
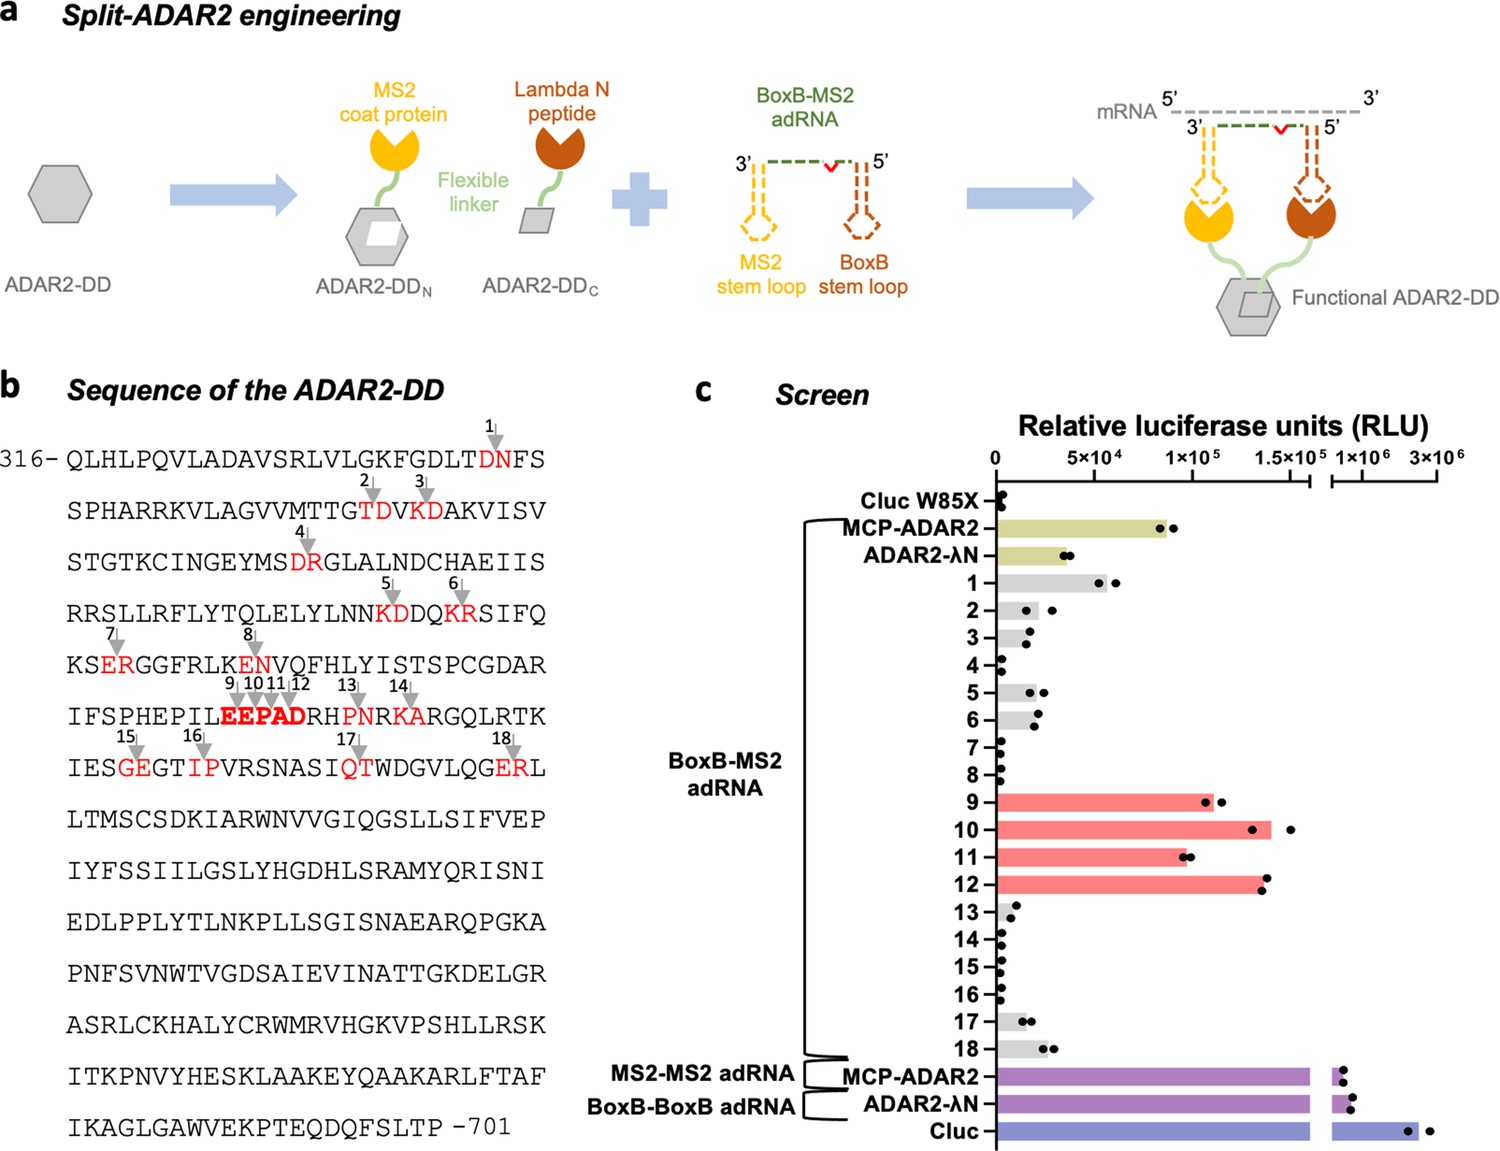
Engineering split-ADAR2 deaminase domains (ADAR2-DD).
(a) Schematic of the split-ADAR2 engineering approach. (b) Sequence of the ADAR2-DD. The protein was split between residues labelled in red, and a total of 18 pairs were evaluated. (c) The ability of each split pair from (b) to correct a premature stop codon when transfected with a chimeric BoxB-MS2 ADAR-recruiting RNA (adRNA) was assayed via a luciferase assay. The pairs 1–18 correspond to the residues in red in (b) in the order in which they appear. The residues in (b) in bold red correspond to pairs 9–12. Values represent mean (n = 2). All experiments were carried out in HEK293FT cells.
-
Figure 2—source data 1
Engineering split-ADAR2 deaminase domains.
- https://cdn.elifesciences.org/articles/75555/elife-75555-fig2-data1-v2.xlsx
Figure 2—figure supplement 1
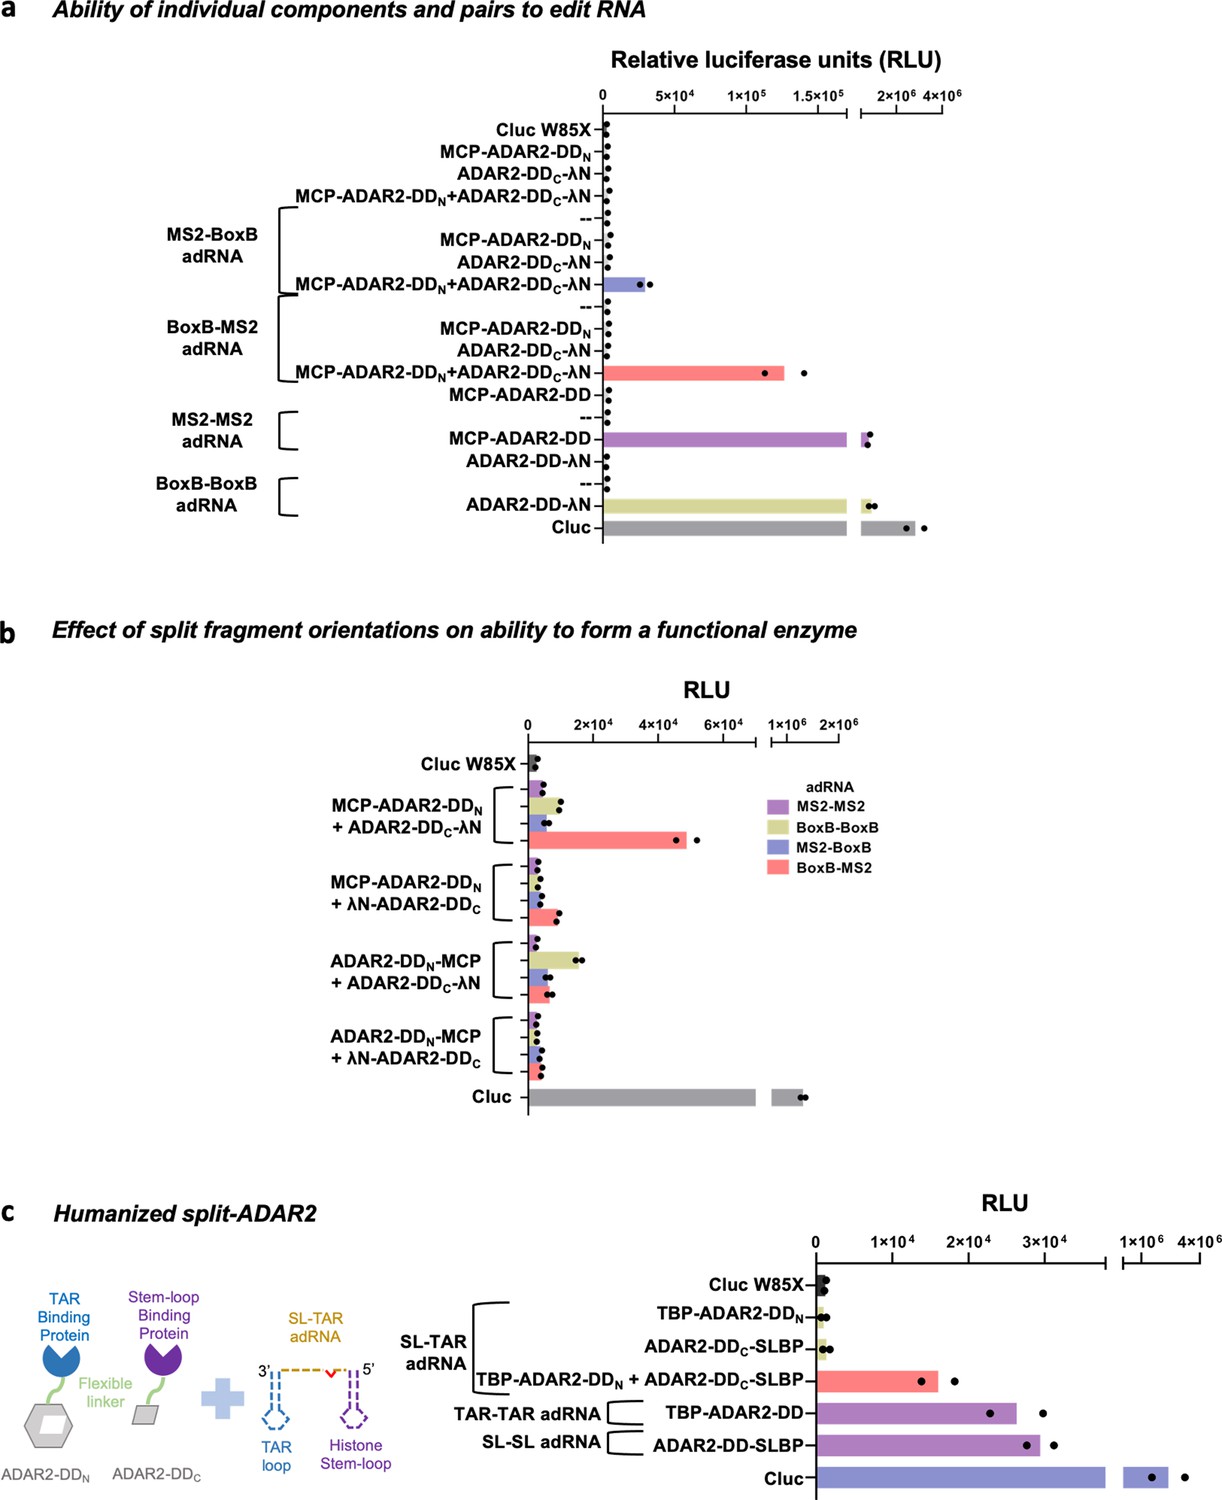
Optimization of the split-ADAR2 deaminase constructs.
(a) All components of the split-ADAR2 system were tested for their ability to edit RNA via the luciferase assay. Restoration of luciferase activity is observed only when every component is delivered. Values represent mean (n = 2). (b) The importance of orientation of the N- and C-terminal fragments in forming a functional ADAR2 deaminase domain (ADAR2-DD) is assayed via the luciferase assay. Chimeric and non-chimeric ADAR-recruiting RNA (adRNA) are used to recruit the split-ADAR2 pairs. Values represent mean (n = 2). (c) Engineering of humanized split-ADAR2 variant based on pair 12 and assayed of its ability to correct a stop codon in the cluc transcript. Values represent mean (n = 2). All experiments were carried out in HEK293FT cells.
Figure 3 with 3 supplements

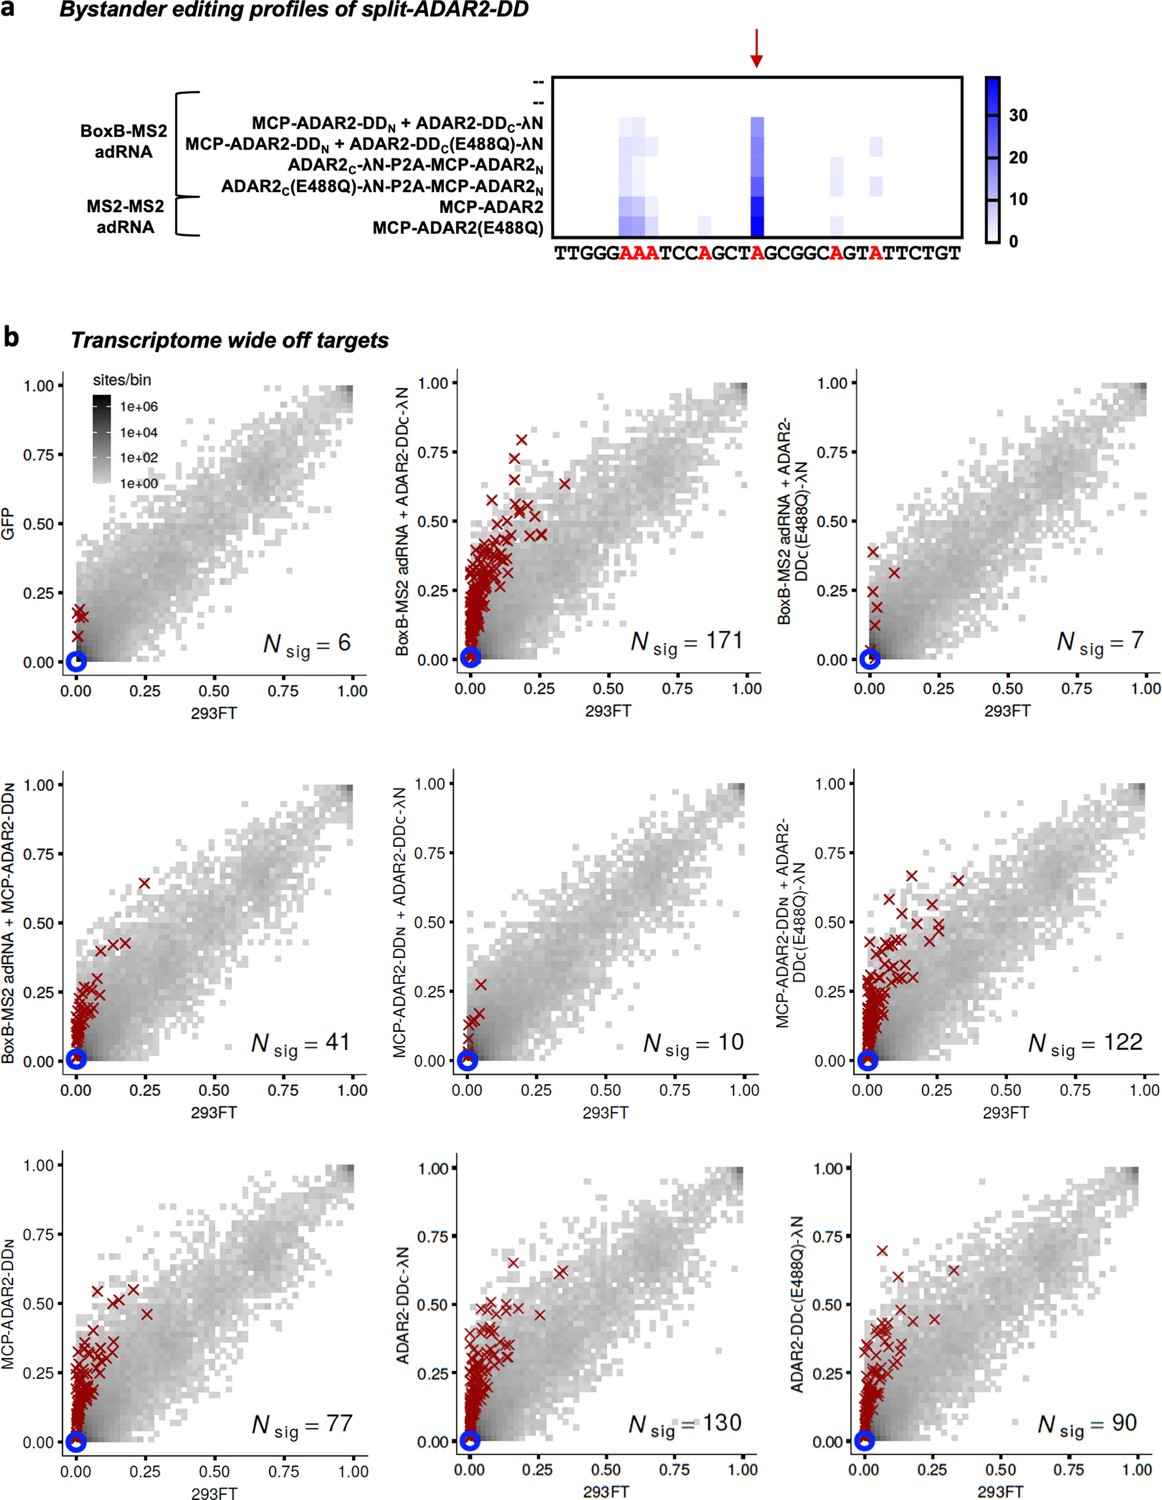
Characterizing the split-ADAR2 deaminase domains.
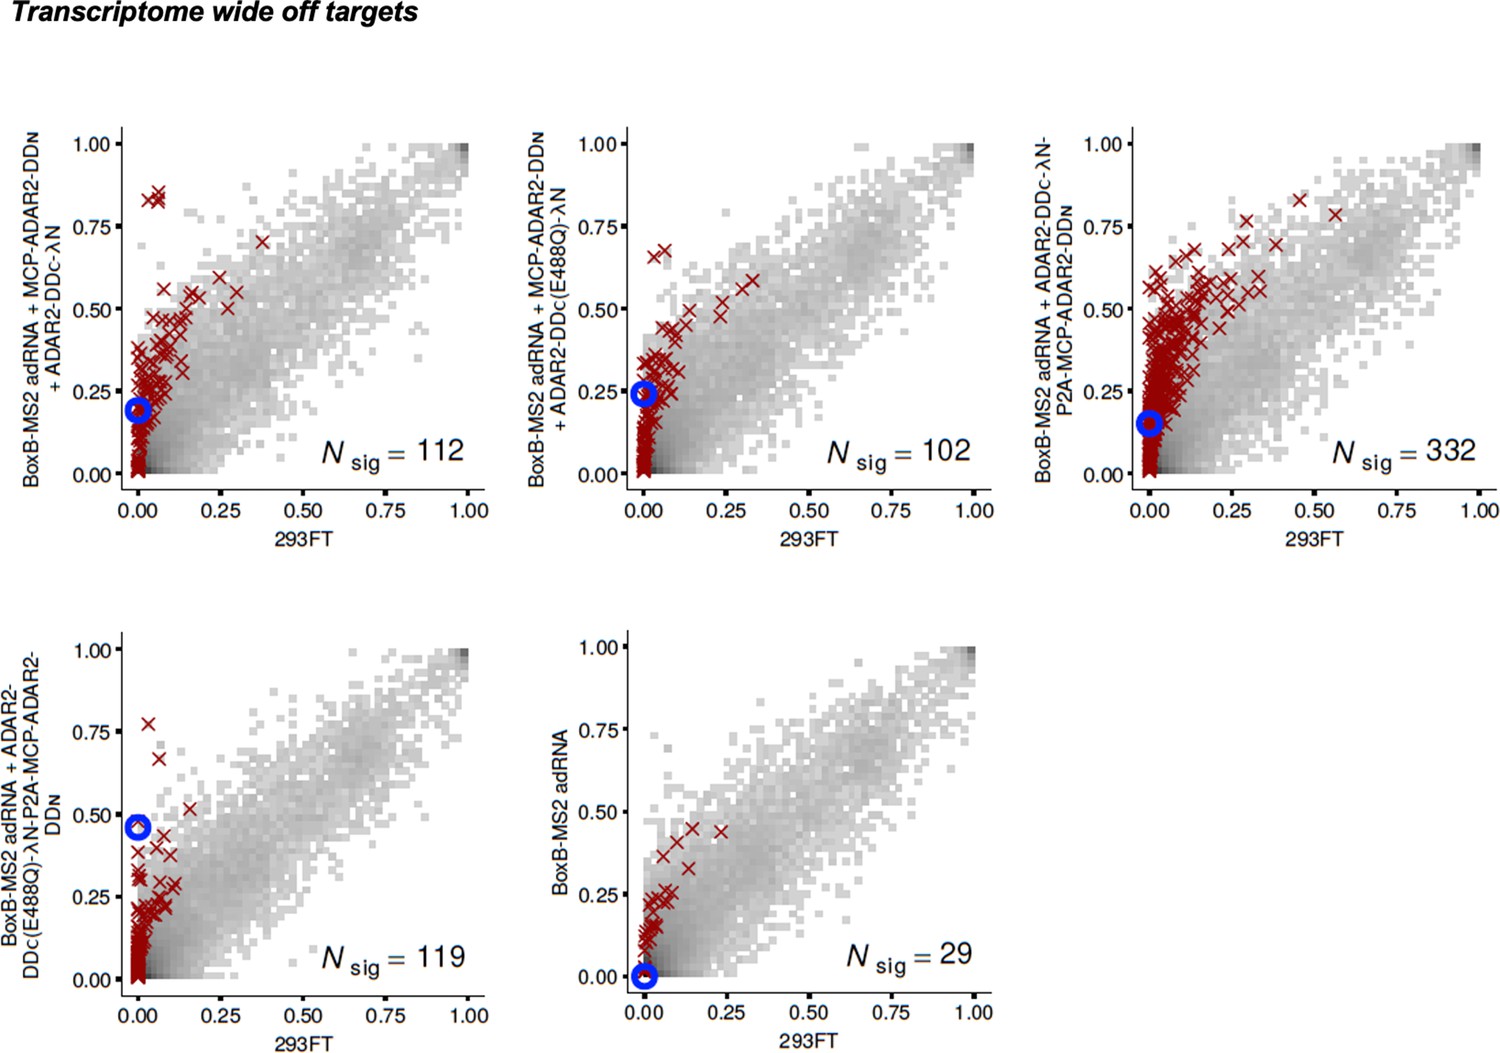
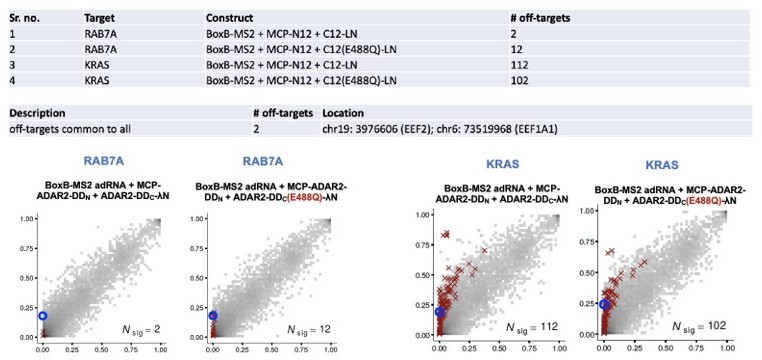
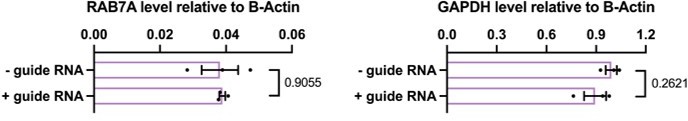
(a) The components of the split-ADAR2 system based on pair 12 were tested for their ability to edit the RAB7A transcript. Editing was observed only when every component was delivered. Values represent mean ± SEM (n = 3). (b) 2D histograms comparing the transcriptome-wide A-to-G editing yields observed with each construct (y-axis) to the yields observed with the control sample (x-axis). Each histogram represents the same set of reference sites, where read coverage was at least 10 and at least one putative editing event was detected in at least one sample. Bins highlighted in red contain sites with significant changes in A-to-G editing yields when comparing treatment to control sample. Red crosses in each plot indicate the 100 sites with the smallest adjusted p-values. Blue circles indicate the intended target A-site within the RAB7A transcript. (c) The split-ADAR2 system was assayed for editing the KRAS and CKB transcripts. Values represent mean ± SEM (n = 3). All experiments were carried out in HEK293FT cells.
-
Figure 3—source data 1
Characterizing the split-ADAR2 deaminase domains.
- https://cdn.elifesciences.org/articles/75555/elife-75555-fig3-data1-v2.xlsx
Figure 3—figure supplement 1
Specificity profiles of the ADAR2 deaminase expression constructs.
(a) Heatmap depicting hyper-editing observed with the split-ADAR2 system corresponding to the plot in Figure 3a. The red arrow indicates the target adenosine. (b) 2D histograms comparing the transcriptome-wide A-to-G editing yields (fraction of edited transcripts) observed with constructs from Figure 3a (y-axis) to the yields observed with the control sample (x-axis). Each histogram represents the same set of 27,587 reference sites, where read coverage was at least 10 and at least one putative editing event was detected in at least one sample. Bins highlighted in red contain sites with significant changes in A-to-G editing yields when comparing treatment to control sample. Red crosses in each plot indicate the 100 sites with the smallest adjusted p-values. Blue circles indicate the intended target A-site within the RAB7A transcript. Large counts in bins near the lower-left corner likely correspond not only to low editing yields in both test and control samples, but also to sequencing errors and alignment errors. Large counts in bins near the upper-right corner of each plot likely correspond to homozygous single nucleotide polymorphisms (SNPs), as well as other differences between the reference genome and the genome of the HEK293FT cell line used in the experiments.
Figure 3—figure supplement 2
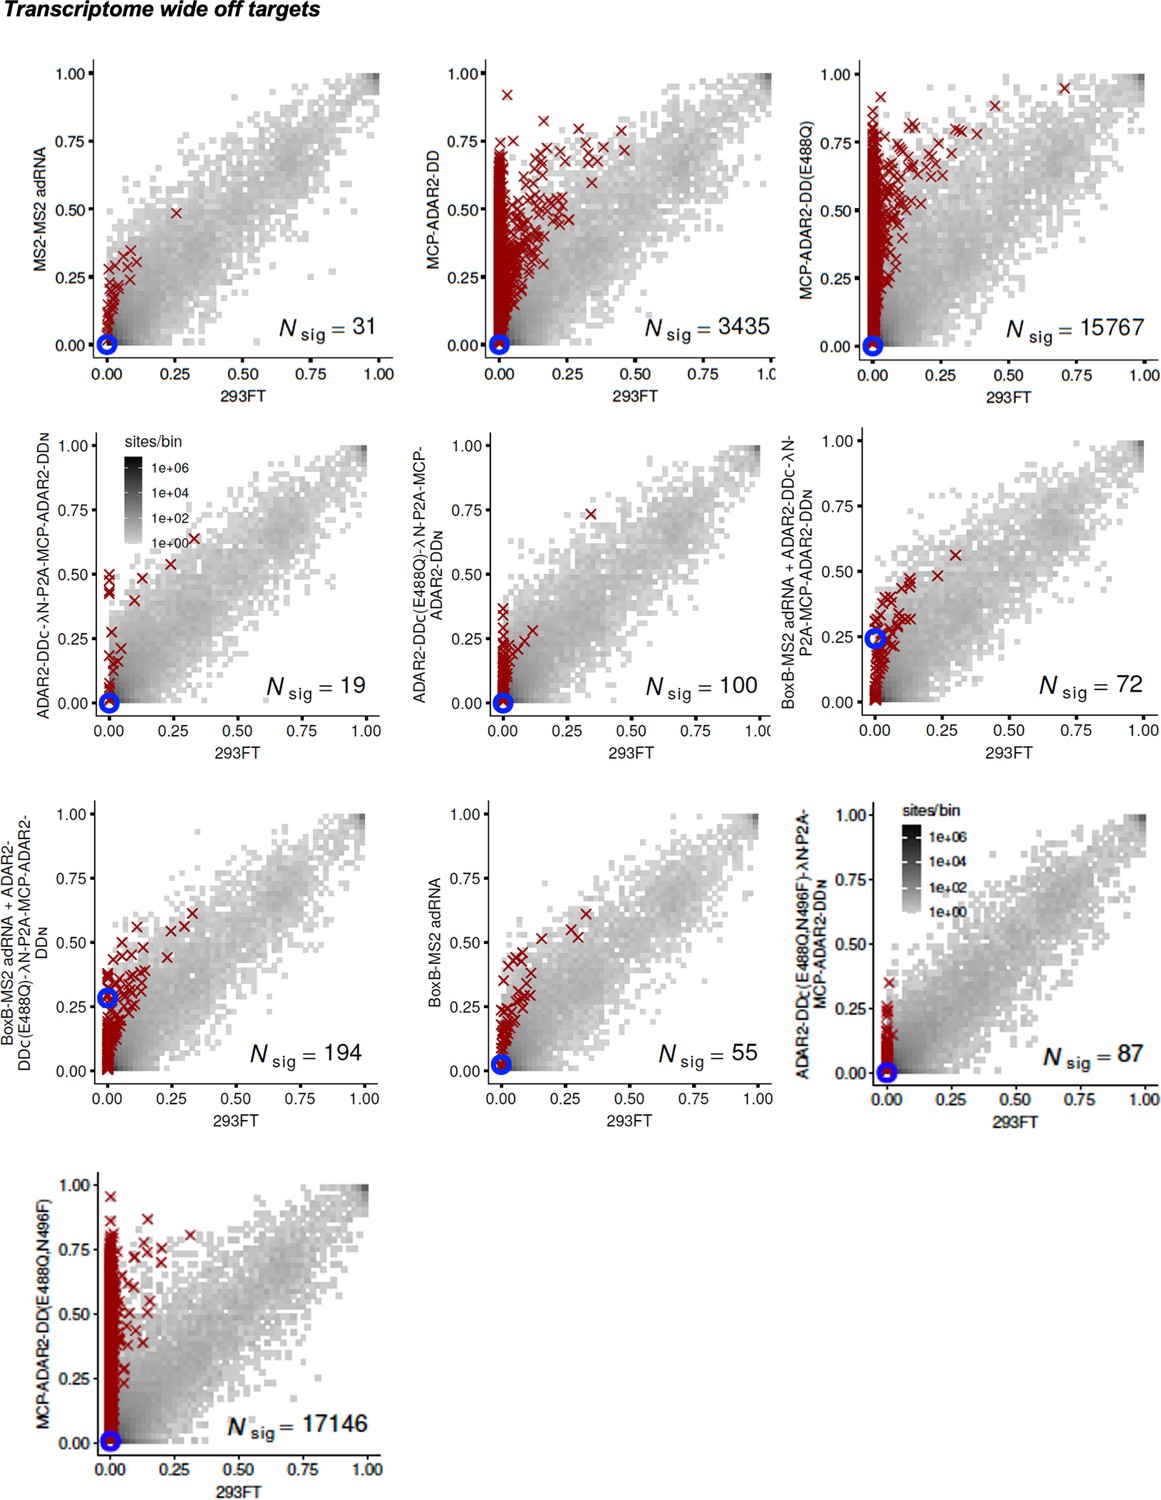
Specificity profiles of the ADAR2 deaminase expression constructs.
2D histograms comparing the transcriptome-wide A-to-G editing yields observed with each split-ADAR2 construct (y-axis) to the yields observed with the control sample (x-axis). Blue circles indicate the intended target A-site within the RAB7A transcript.
Figure 3—figure supplement 3
Specificity profiles of the split-ADAR2 deaminase expression constructs.
2D histograms comparing the transcriptome-wide A-to-G editing yields observed with each split-ADAR2 construct (y-axis) to the yields observed with the control sample (x-axis). Blue circles indicate the intended target A-site within the KRAS transcript.
Figure 4
Optimizing and expanding the utility of split-ADAR2 deaminase domains (ADAR2-DD).
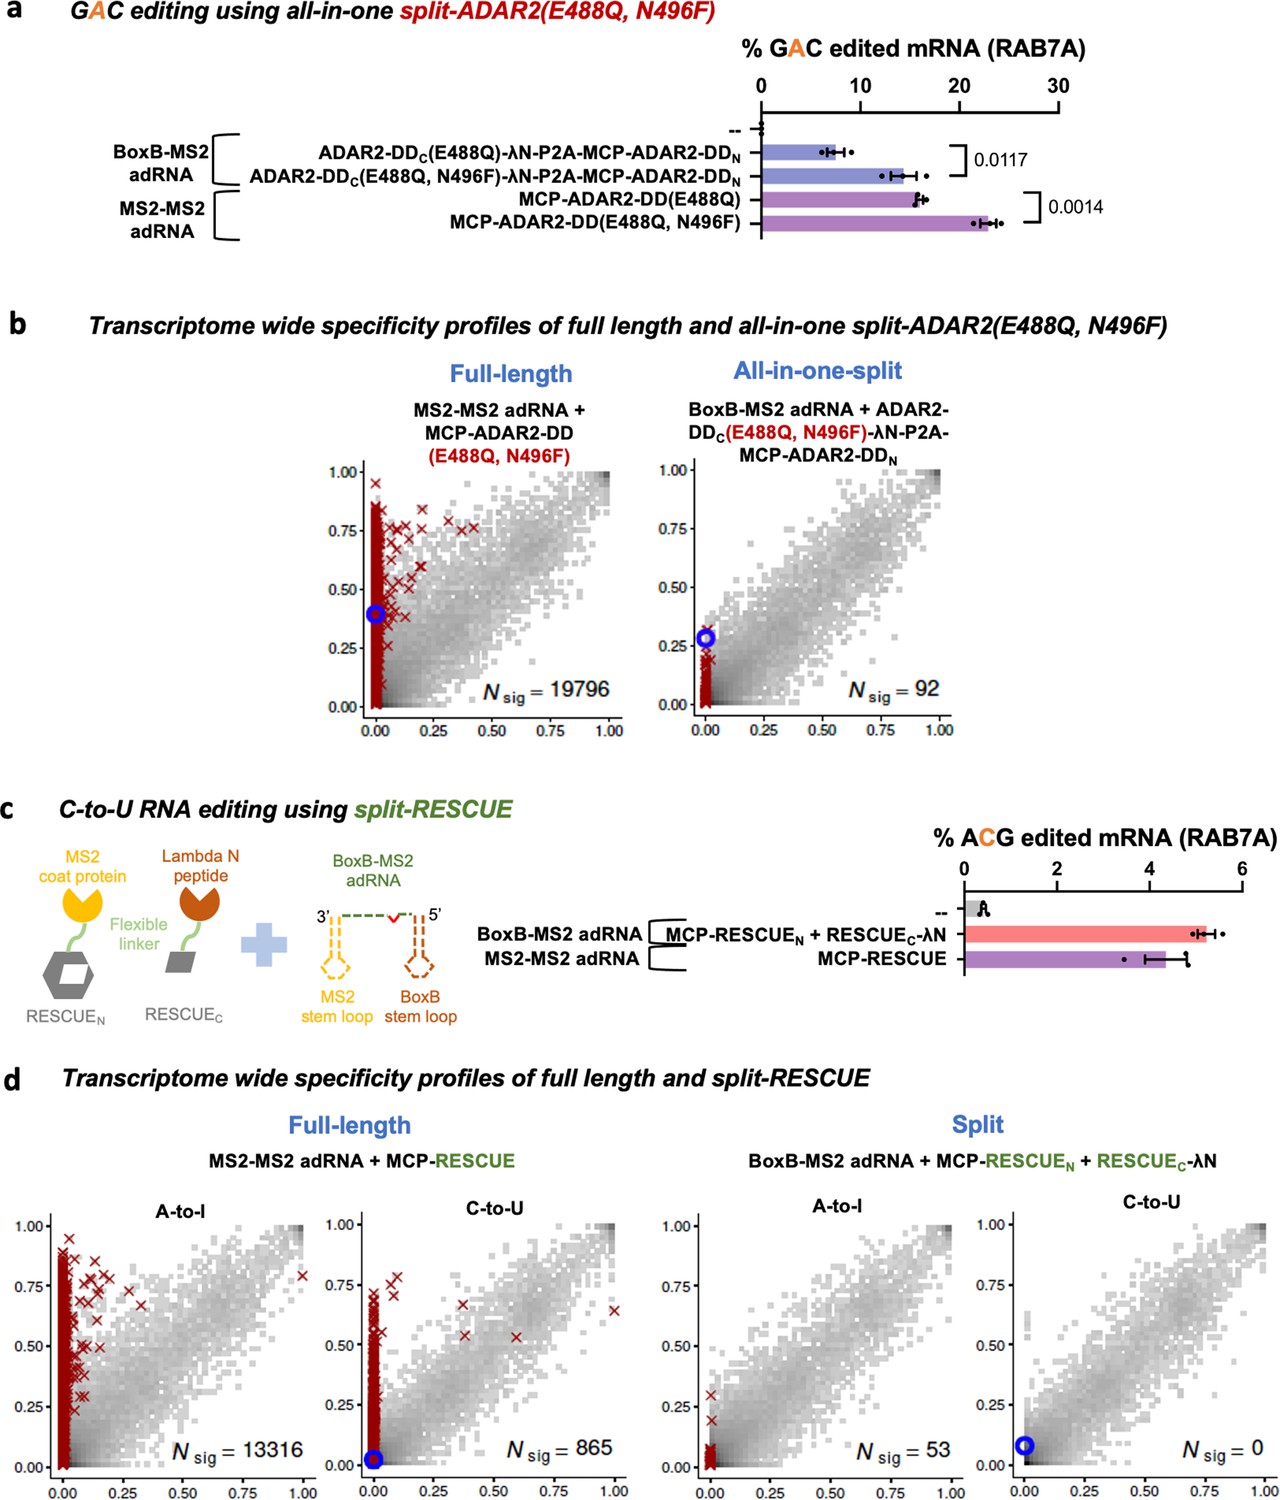
(a) A split-ADAR2-DD(E488Q, N496F) was engineered and used to edit a GAC motif in the RAB7A transcript. Values represent mean ± SEM (n = 3). (b) 2D histograms comparing the transcriptome-wide A-to-G editing yields observed with full-length and split-ADAR2-DD(E488Q, N496F) constructs. Blue circles indicate the intended target UAG site within the RAB7A transcript. (c) A split-RESCUE was engineered and assayed for cytosine to uracil (C-to-U) editing of the RAB7A transcript. Values represent mean ± SEM (n = 3), quantified by NGS. (d) 2D histograms comparing the transcriptome-wide A-to-G and C-to-U editing yields observed with full-length and split RESCUE constructs. Blue circles indicate the intended target C site within the RAB7A transcript. All experiments were carried out in HEK293FT cells.
-
Figure 4—source data 1
Optimizing and expanding the utility of split-ADAR2 deaminase domains.
- https://cdn.elifesciences.org/articles/75555/elife-75555-fig4-data1-v2.xlsx
Author response image 1
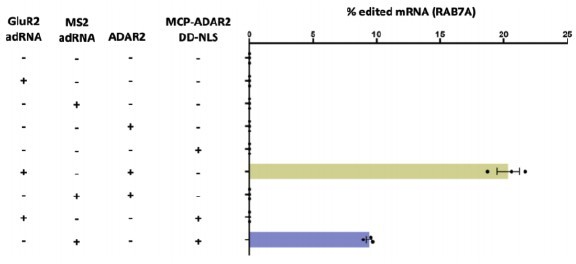
Specifically, on-target RNA editing by MCP–ADAR2 DD-NLS required co-expression of the MS2 adRNA.
GluR2 adRNA and MS2 adRNA used in this experiment had an antisense domain of length 20. Values represent mean ± s.e.m. (n = 3). All experiments were carried out in HEK293T cells.
Author response image 2
Author response image 3
Author response image 4
Author response image 5
Additional files
-
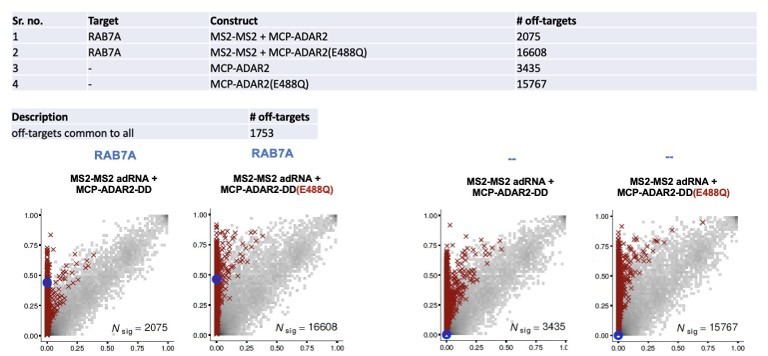
Supplementary file 1
Off-target characterization of the split-ADAR2 constructs.
- https://cdn.elifesciences.org/articles/75555/elife-75555-supp1-v2.xlsx
-
Transparent reporting form
- https://cdn.elifesciences.org/articles/75555/elife-75555-transrepform1-v2.docx
Download links
A two-part list of links to download the article, or parts of the article, in various formats.
Downloads (link to download the article as PDF)
Open citations (links to open the citations from this article in various online reference manager services)
Cite this article (links to download the citations from this article in formats compatible with various reference manager tools)
Comprehensive interrogation of the ADAR2 deaminase domain for engineering enhanced RNA editing activity and specificity
eLife 11:e75555.
https://doi.org/10.7554/eLife.75555


