Investigating the composition and recruitment of the mycobacterial ImuA′–ImuB–DnaE2 mutasome
- SAMRC/NHLS/UCT Molecular Mycobacteriology Research Unit, DSI/NRF Centre of Excellence for Biomedical TB Research, Department of Pathology, University of Cape Town, South Africa
- Institute of Infectious Disease and Molecular Medicine, University of Cape Town, South Africa
- Laboratory of Microbiology and Microsystems, School of Life Sciences, Swiss Federal Institute of Technology in Lausanne (EPFL), Switzerland
- Advanced Imaging Center, Howard Hughes Medical Institute, United States
- Department of Cell and Chemical Biology, Leiden University Medical Center, Netherlands
- Department of Integrative Biomedical Sciences, University of Cape Town, South Africa
- Confocal and Light Microscope Imaging Facility, Department of Human Biology, University of Cape Town, South Africa
- Helmholtz Centre for Infection Research, Helmholtz Institute for Pharmaceutical Research Saarland, Germany
- German Centre for Infection Research (DZIF), Partner Site Hannover-Braunschweig, Germany
- Laboratory of Genomic Integrity, Eunice Kennedy Shriver National Institute of Child Health and Human Development, United States
- Wellcome Centre for Infectious Diseases Research in Africa, University of Cape Town, South Africa
- Institute of Biotechnology, Vilnius University, Lithuania
Figures
Figure 1 with 1 supplement
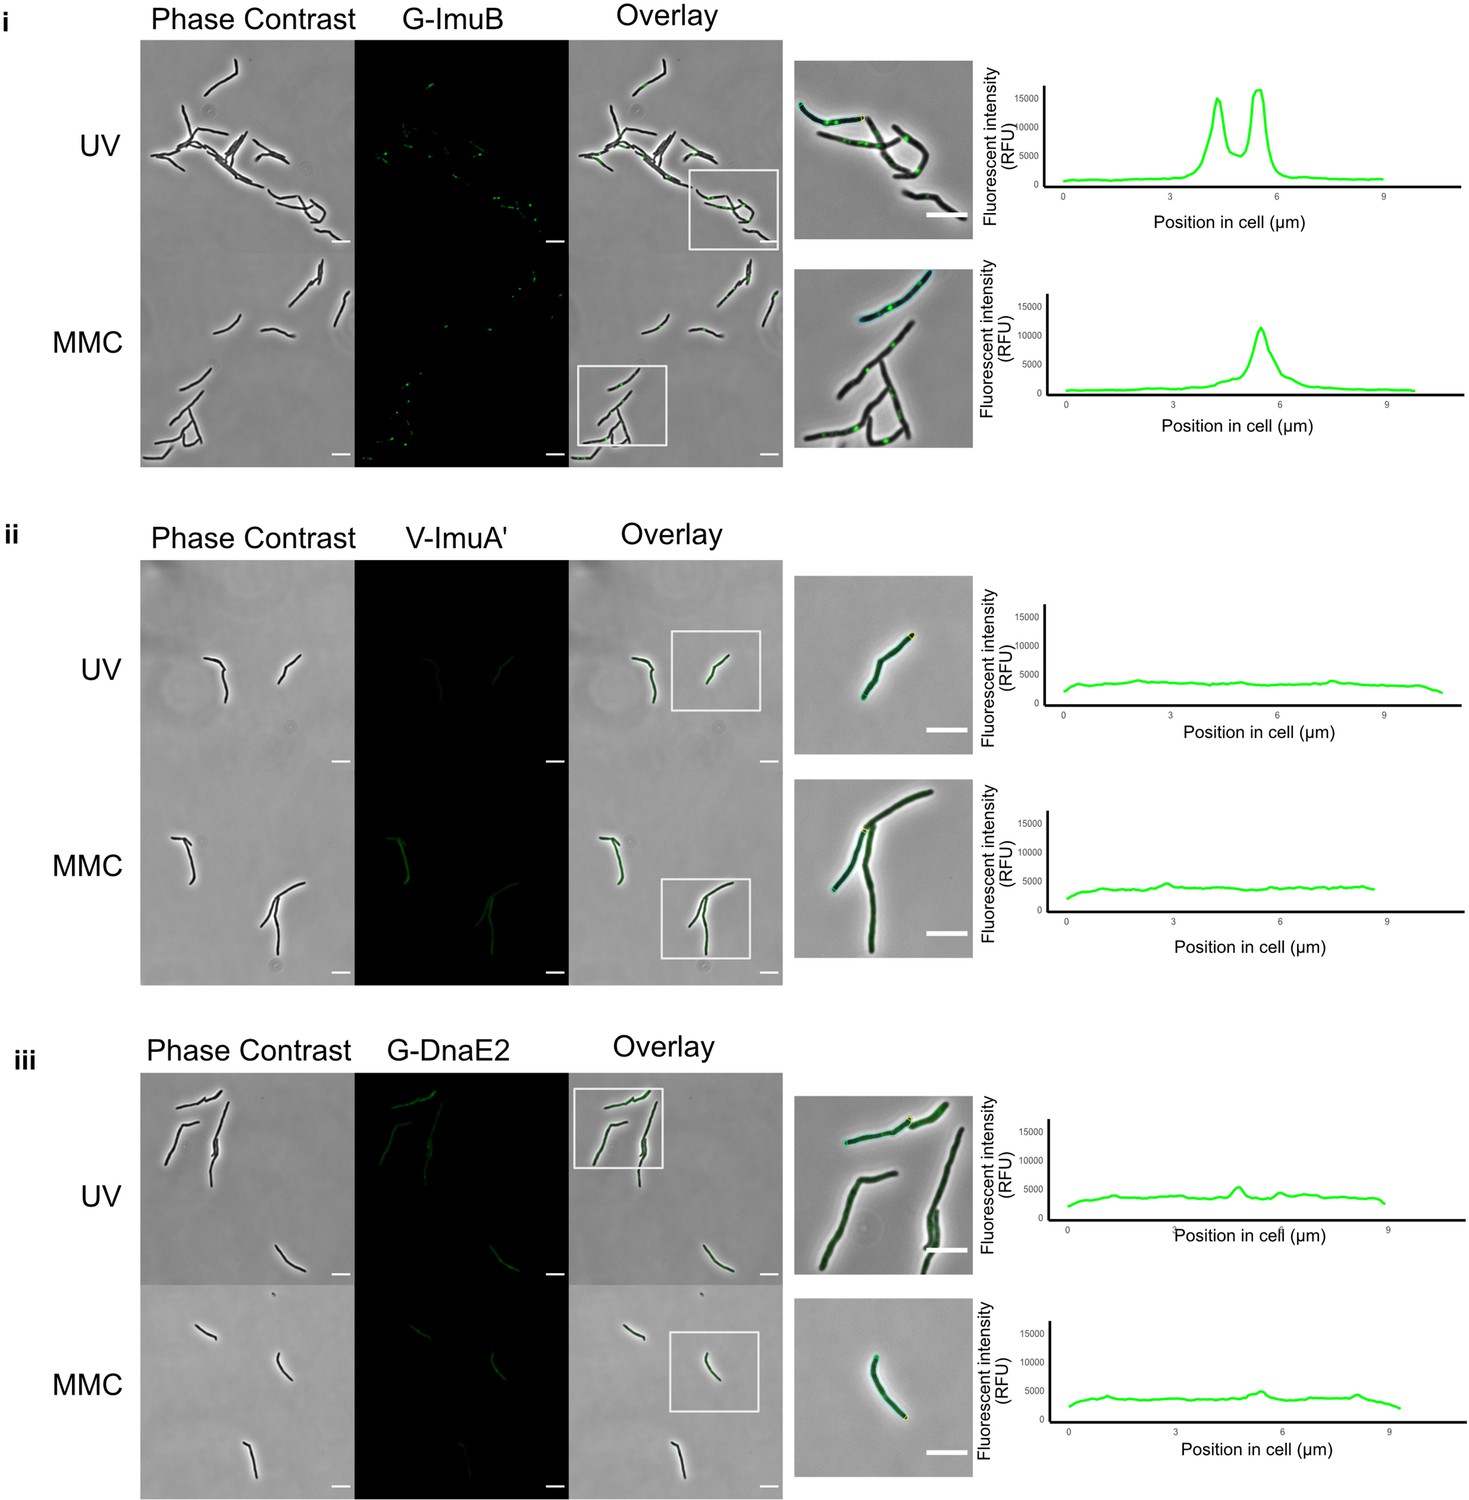
Visualization of the mycobacterial mutasome components.
Representative stills from fluorescence microscopy experiments of M. smegmatis expressing translational reporters of the different mutasome components in their respective knockout backgrounds. Phase-contrast and fluorescence images of M. smegmatis expressing (i) G-imuB, (ii) V-imuA′, and (iii) G-dnaE2 alleles are represented following 4 hr exposure to ultra-violet (UV) and 1× minimun inhibitory concentration (MIC) mitomycin C (MMC). White boxes indicate zoomed-in regions shown in the panels at right. The far right-hand panels indicate the fluorescence intensity determined along the longitudinal axis of a representative cell from each reporter mutant; the specific cell analyzed is outlined in the corresponding image to the left of the graph. Fluorescence microscopy experiments were repeated two to four times. Scale bars, 5 µm. Source data are available in Figure1.zip which can be accessed at http://doi.org/10.5061/dryad.76hdr7szc.
Figure 1—figure supplement 1
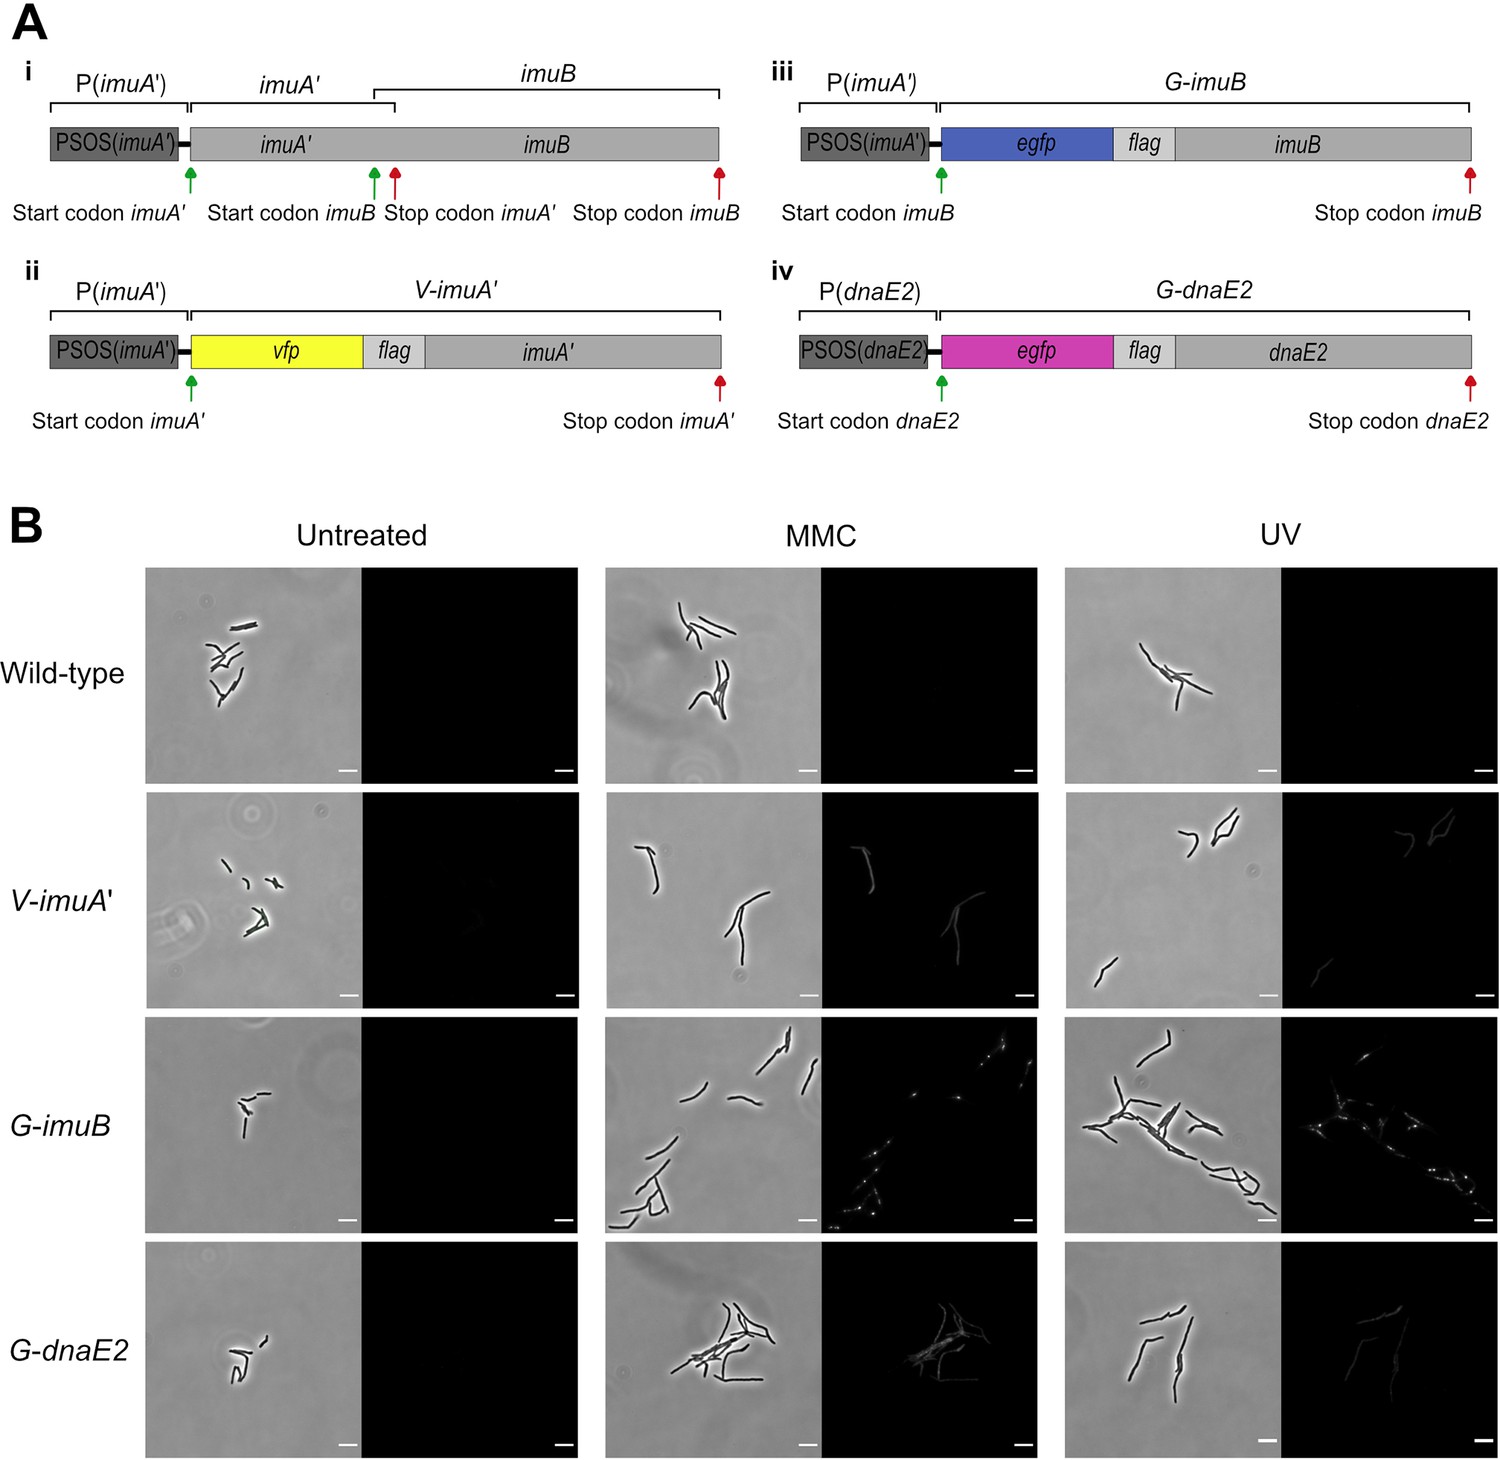
Design and representative fluorescent images of the mutasome translational reporters.
(A) Construction of the reporter mutants, indicating: (i) the genomic organization of the wild-type M. smegmatis imuA′–imuB operon; (ii) the PSOS(imuA′)-egfp-imuB construct encoding G-ImuB; (iii) the design of the V-imuA′ gene utilizing the native imuA′ promoter to control expression of a single VFP-ImuA′-encoding ORF; and (iv) the egfp-dnaE2 allele used in the G-DnaE2 reporter. (B) Representative brightfield and fluorescent images of wild-type, V-ImuA′, G-ImuB, and G-DnaE2 translational reporter strains untreated (left panel), and following exposure to ultra-violet (UV) (middle panel) or 1× MIC mitomycin C (MMC) (right panel). Scale bars, 5 μm.
Figure 2 with 1 supplement
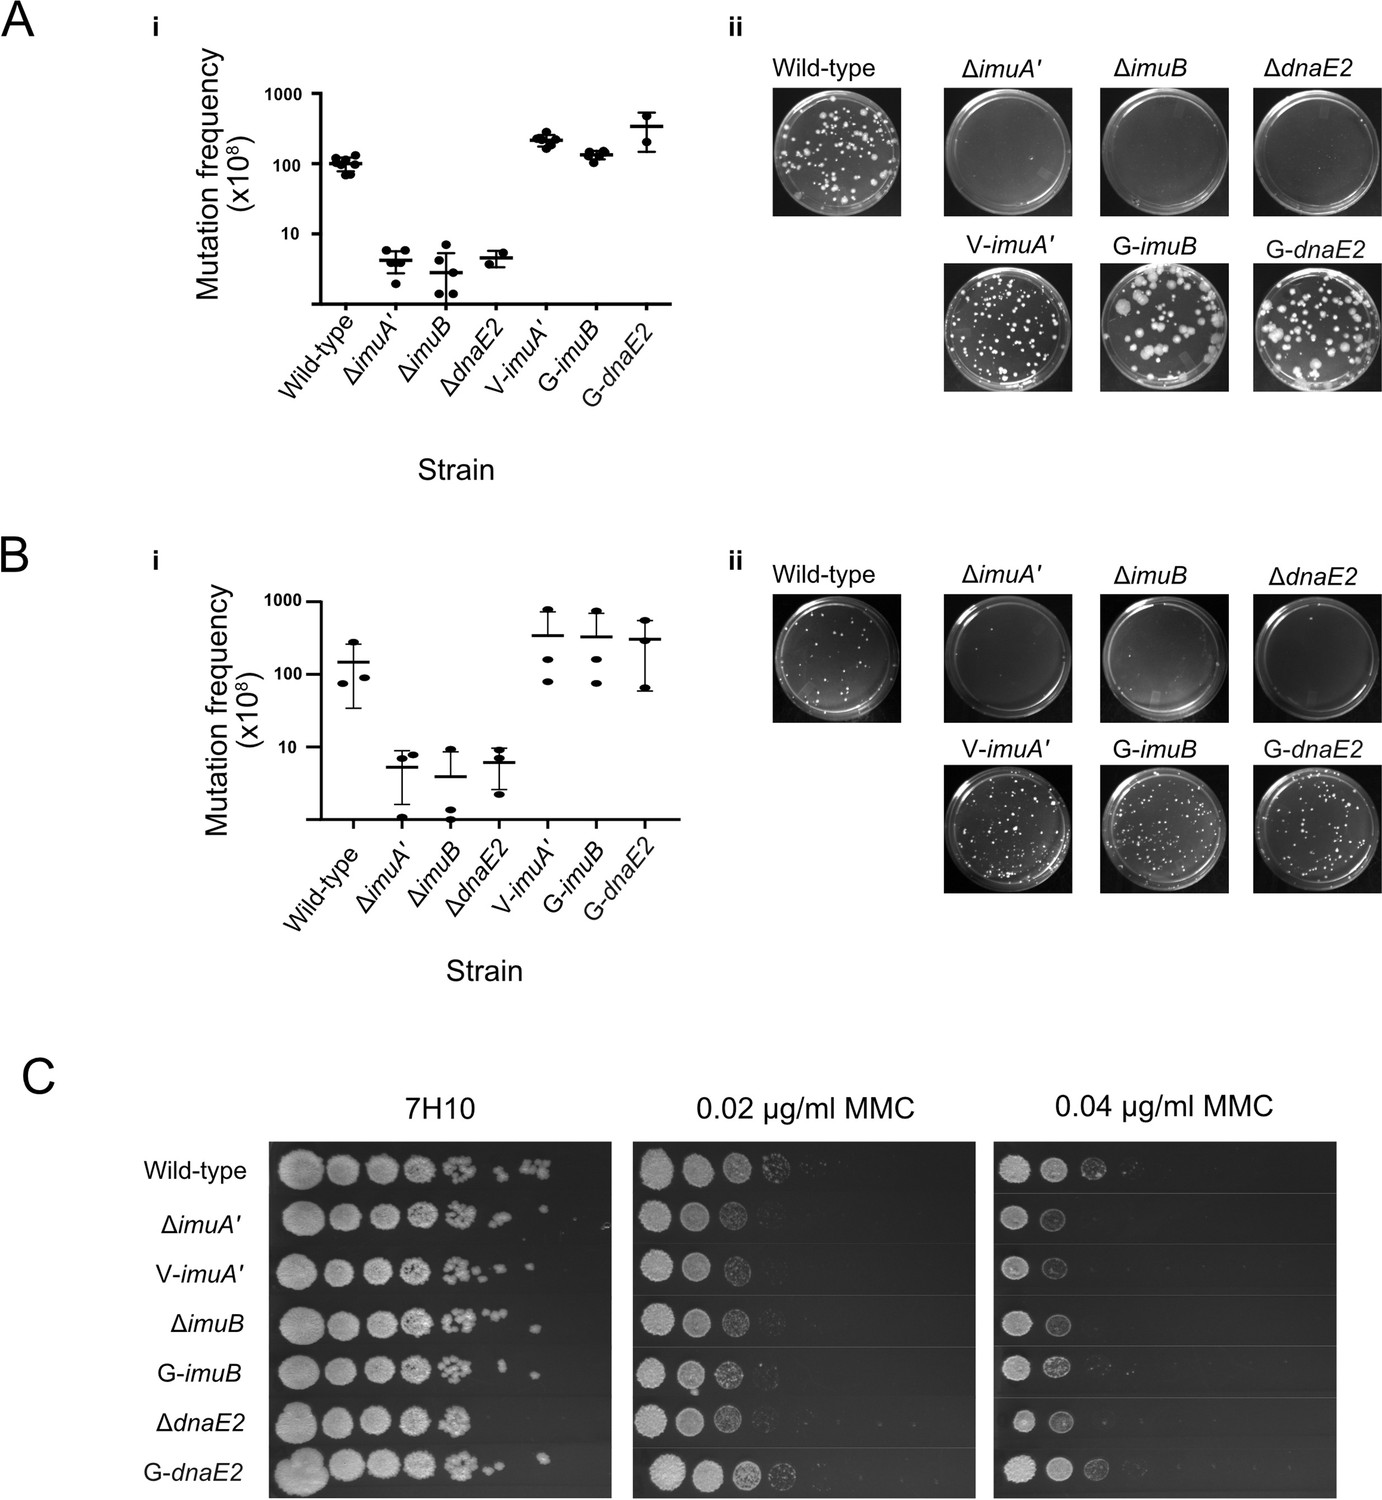
Functional validation of translational reporters.
(A) N-terminally tagged fluorescence reporter mutants of M. smegmatis ImuA′, ImuB, and DnaE2 retain function in DNA damage-induced mutagenesis. Cultures of M. smegmatis deletion mutants and complemented derivatives were exposed to 25 mJ/cm2 of 254 nm ultra-violet (UV) light and allowed to recover for 3 hr before selection of rifampicin (RIF)-resistant mutants on RIF-containing 7H10 solid agar plates. (i) Mutation frequencies were calculated as a fraction of the CFU/ml of each culture prior to exposure to UV irradiation. Complementation with the corresponding fluorescence reporter alleles restored the resistance frequencies of the three mutasome knockout mutants (ΔimuA′, ΔimuB, and ΔdnaE2) to levels observed in wild-type M. smegmatis. (ii) Representative RIF-containing plates with RIF-resistant mutants. (B) The same strains were exposed to 0.5× MIC mitomycin C (MMC) for 6 hr before plating on RIF-containing 7H10 solid plates. (i) Mutation frequencies were calculated as a fraction of the CFU/ml of each culture prior to exposure to MMC. As for the UV-induced mutagenesis assay, the fluorescence reporter alleles restored mutation frequencies to wild-type levels. (ii) Representative images of the RIF-containing plates with RIF-resistant mutants. (C) Serial dilutions of M. smegmatis deletion mutants and complemented strains were spotted on standard 7H10 and MMC-containing 7H10 plates. Results represent a minimum of three replicates for each strain. Source data are available in Figure2.zip which can be accessed at http://doi.org/10.5061/dryad.76hdr7szc.
Figure 2—figure supplement 1
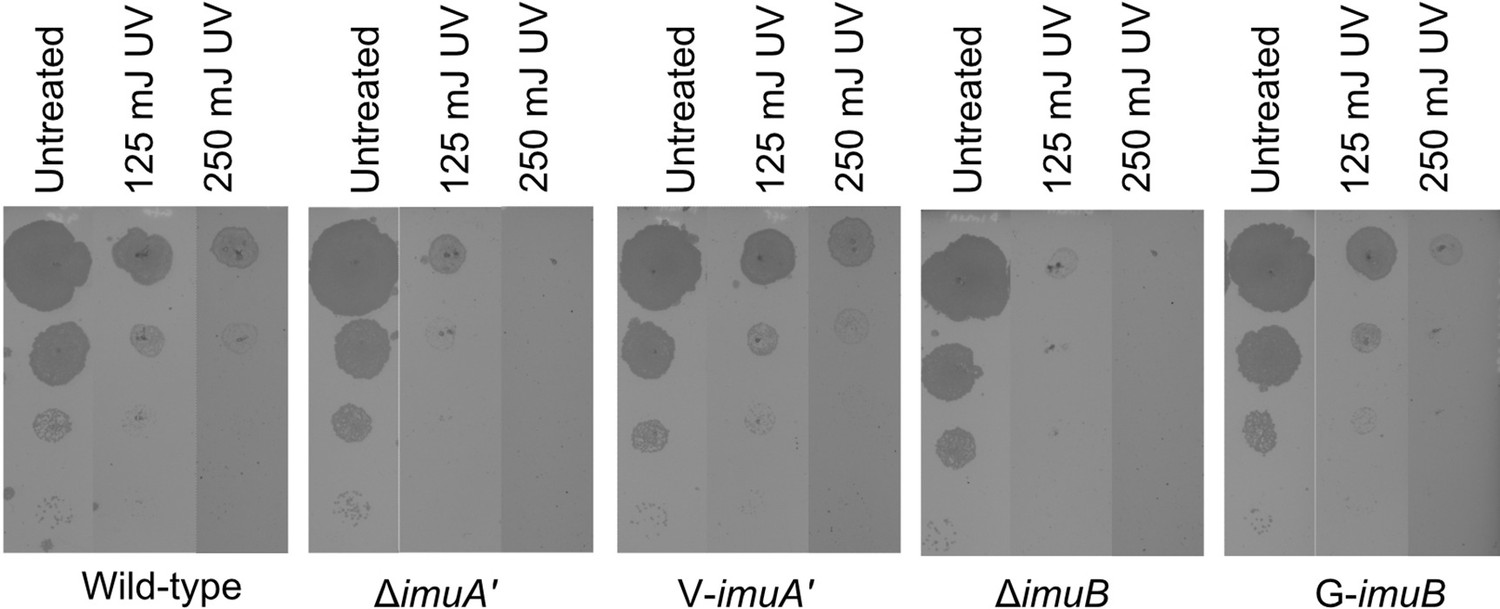
V-ImuA’ and G-ImuB fluorescent bioreporters restore ultra-violet (UV)-induced DNA damage sensitivities of the corresponding ΔimuA’ and ΔimuB deletion mutants.
For this assay, a 10-fold dilution series was spotted on standard, antibiotic-free 7H10 plates, allowed to dry, and then exposed to UV at the indicated doses, after which plates were incubated at 37°C for 3 days and imaged.
Figure 3 with 2 supplements
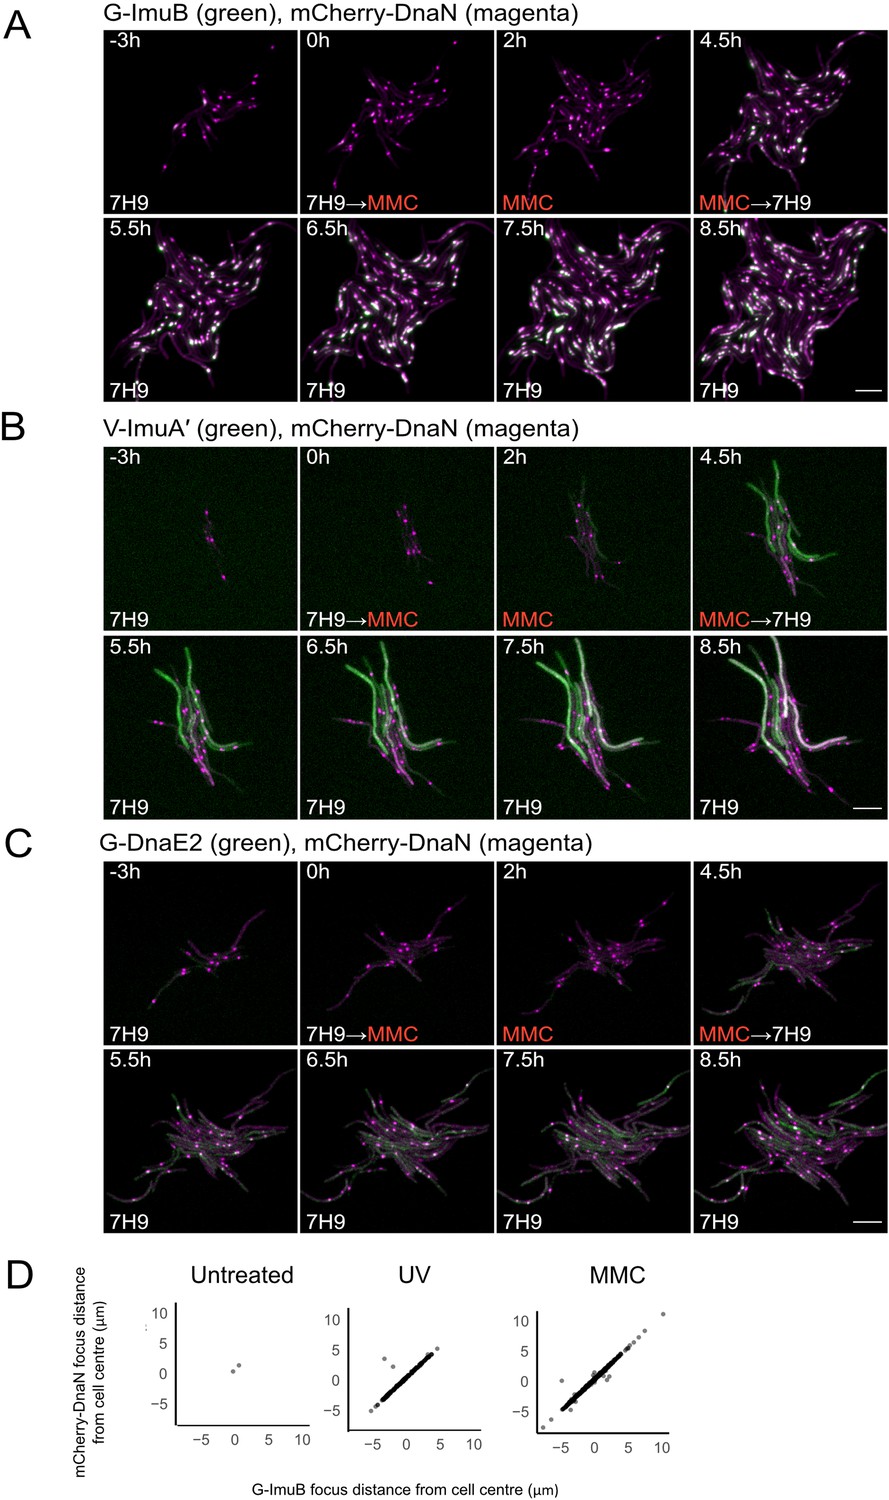
Representative time-lapse series of single cells of M. smegmatis expressing the mutasome reporters in combination with mCherry-DnaN.
(A) G-ImuB (green) and mCherry-DnaN (magenta), (B) V-ImuA′ (green) and mCherry-DnaN (magenta), and (C) G-DnaE2 (green) and mCherry-DnaN (magenta). Overlapping signals are viewed as white. The cells were exposed to 0.5× MIC MMC from time 0 hr until 4.5 hr, after which the medium was switched back to standard 7H9/OADC medium. Up to 80 XY points were imaged at 10-min intervals on fluorescence and phase channels for up to 36 hr. The experiments were repeated two to four times. Numbers indicate hours elapsed; scale bars, 5 μm. 7H9, Middlebrook 7H9 medium; MMC, mitomycin C. (D) Population-scale analysis of cells with both mCherry-DnaN foci and G-ImuB foci showed distinct overlap in location suggesting co-occurrence of the respective proteins. Source data are available in Figure3.zip which can be accessed at http://doi.org/10.5061/dryad.76hdr7szc.
Figure 3—figure supplement 1
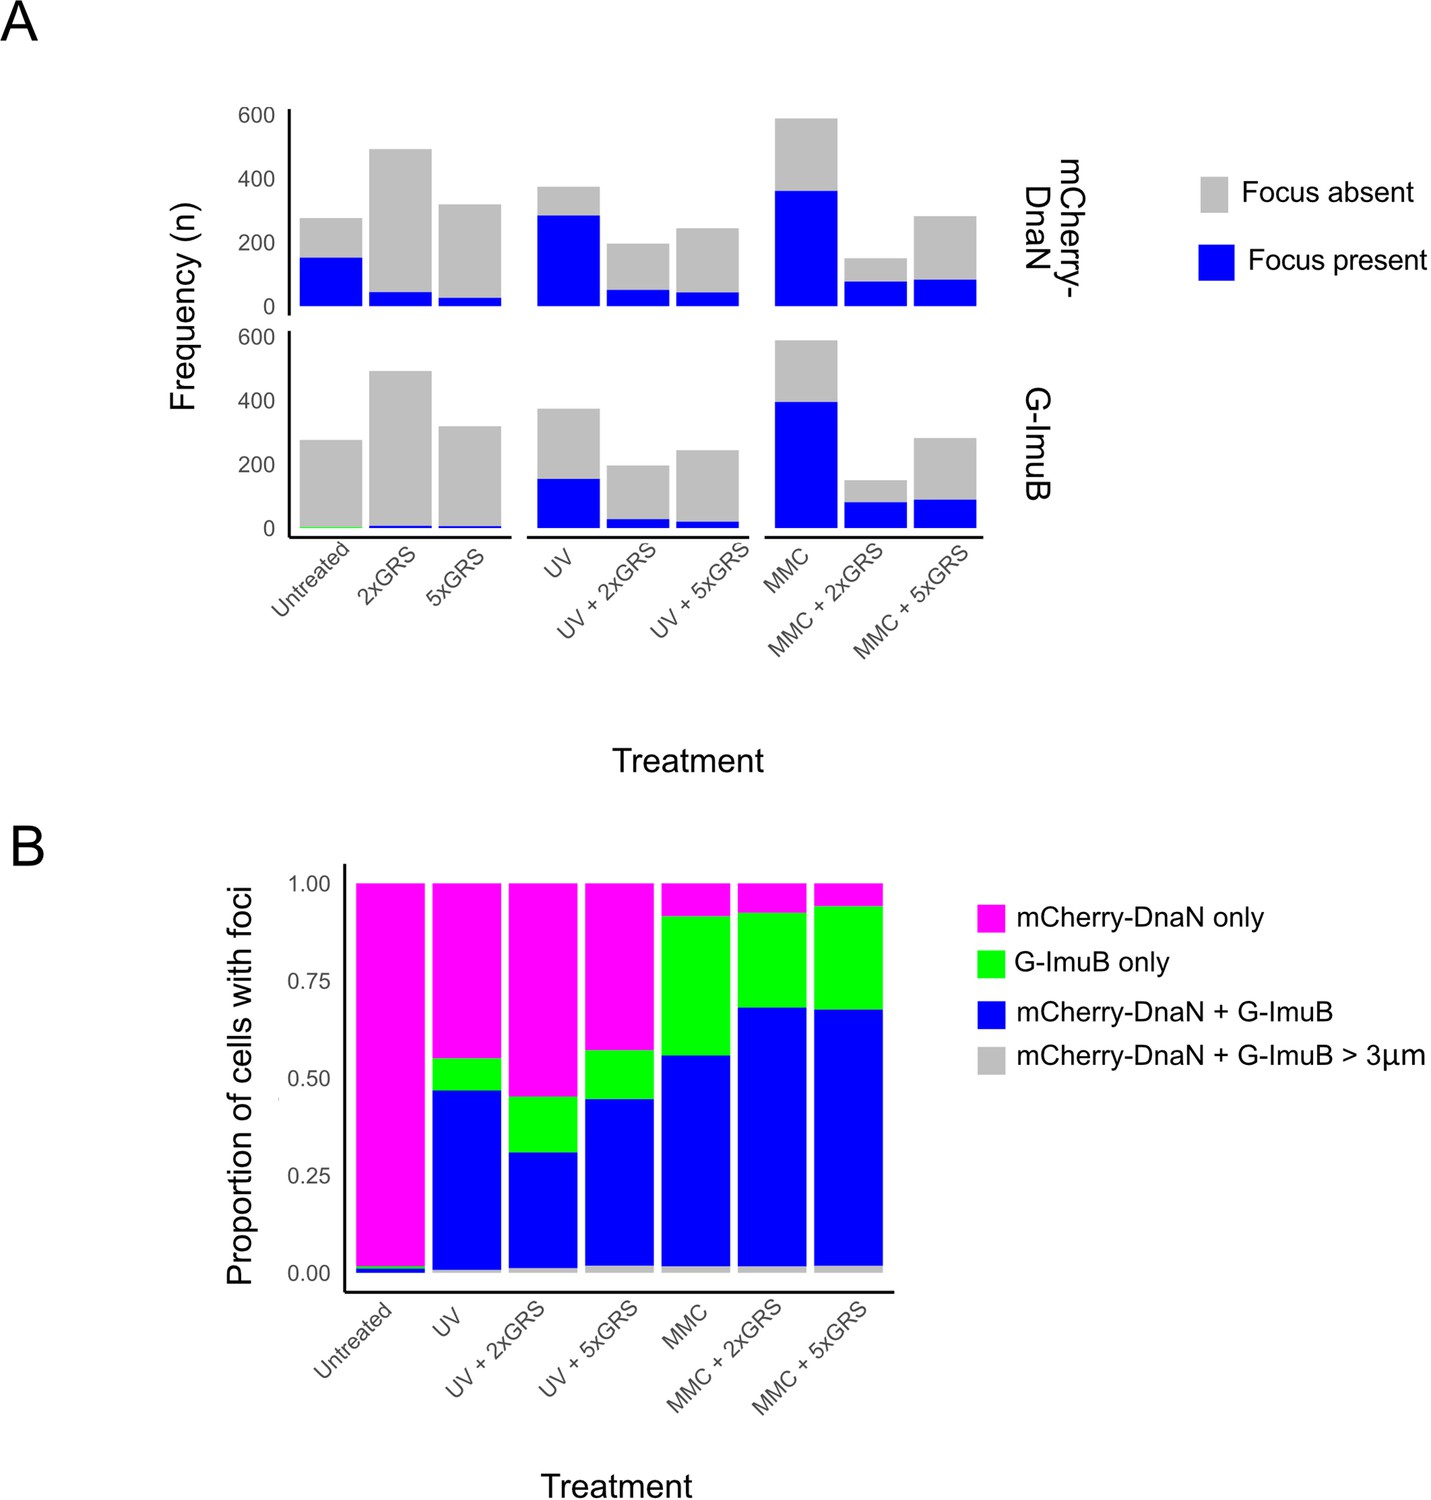
mCherry-DnaN and G-ImuB focus formation following DNA damage treatment.
(A) Frequency of mCherry-DnaN (top panel) and G-ImuB (bottom panel) foci following different DNA damage treatments. (B) Population analysis of cells with foci showing the proportion of cells containing either mCherry-DnaN or G-ImuB alone, mCherry-DnaN and G-ImuB located within 0.3 µm of each other, or mCherry-DnaN and G-ImuB located further than 0.3 µm apart. MMC, mitomycin C; GRS, griselimycin.
Figure 3—figure supplement 2
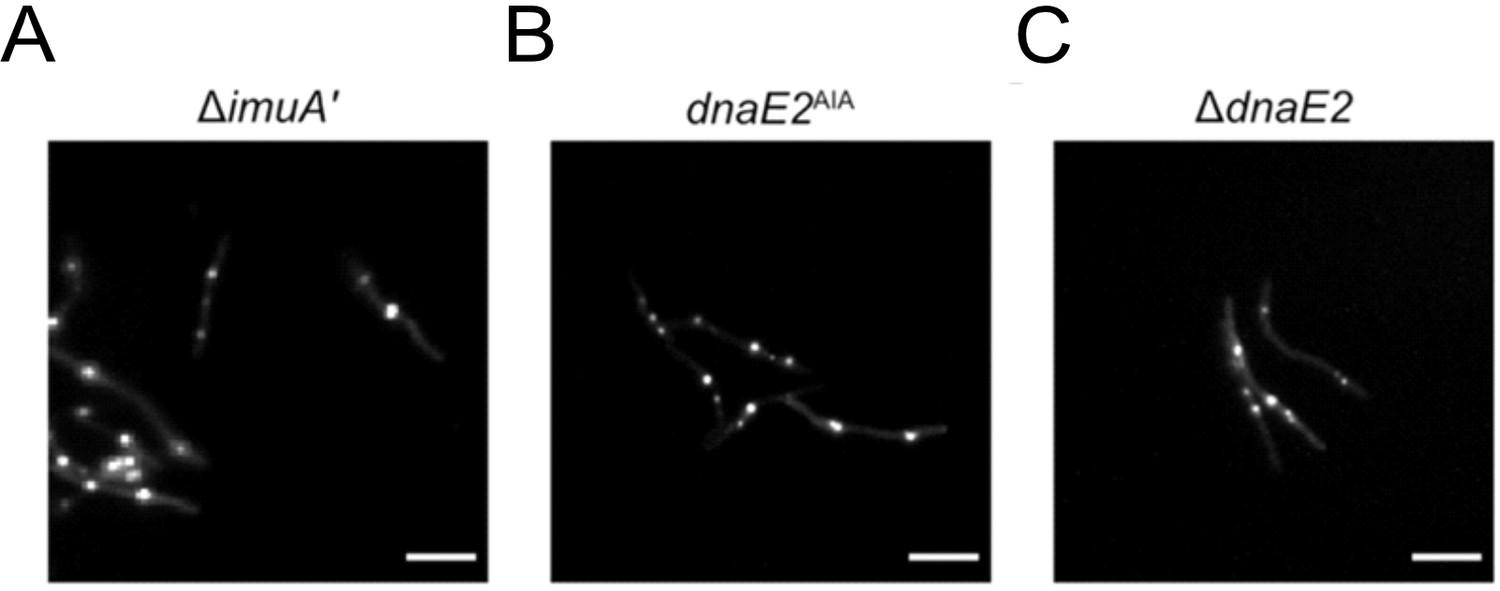
Formation of fluorescent EGFP-ImuB foci in the absence of functional mutasome components.
Each panel represents the expression of EGFP-ImuB foci following 1× MIC mitomycin C (MMC) treatment in different genetic backgrounds: (A) ΔimuA′, (B) dnaE2AIA, and (C) ΔdnaE2. Scale bars, 5 μm.
Figure 4 with 1 supplement
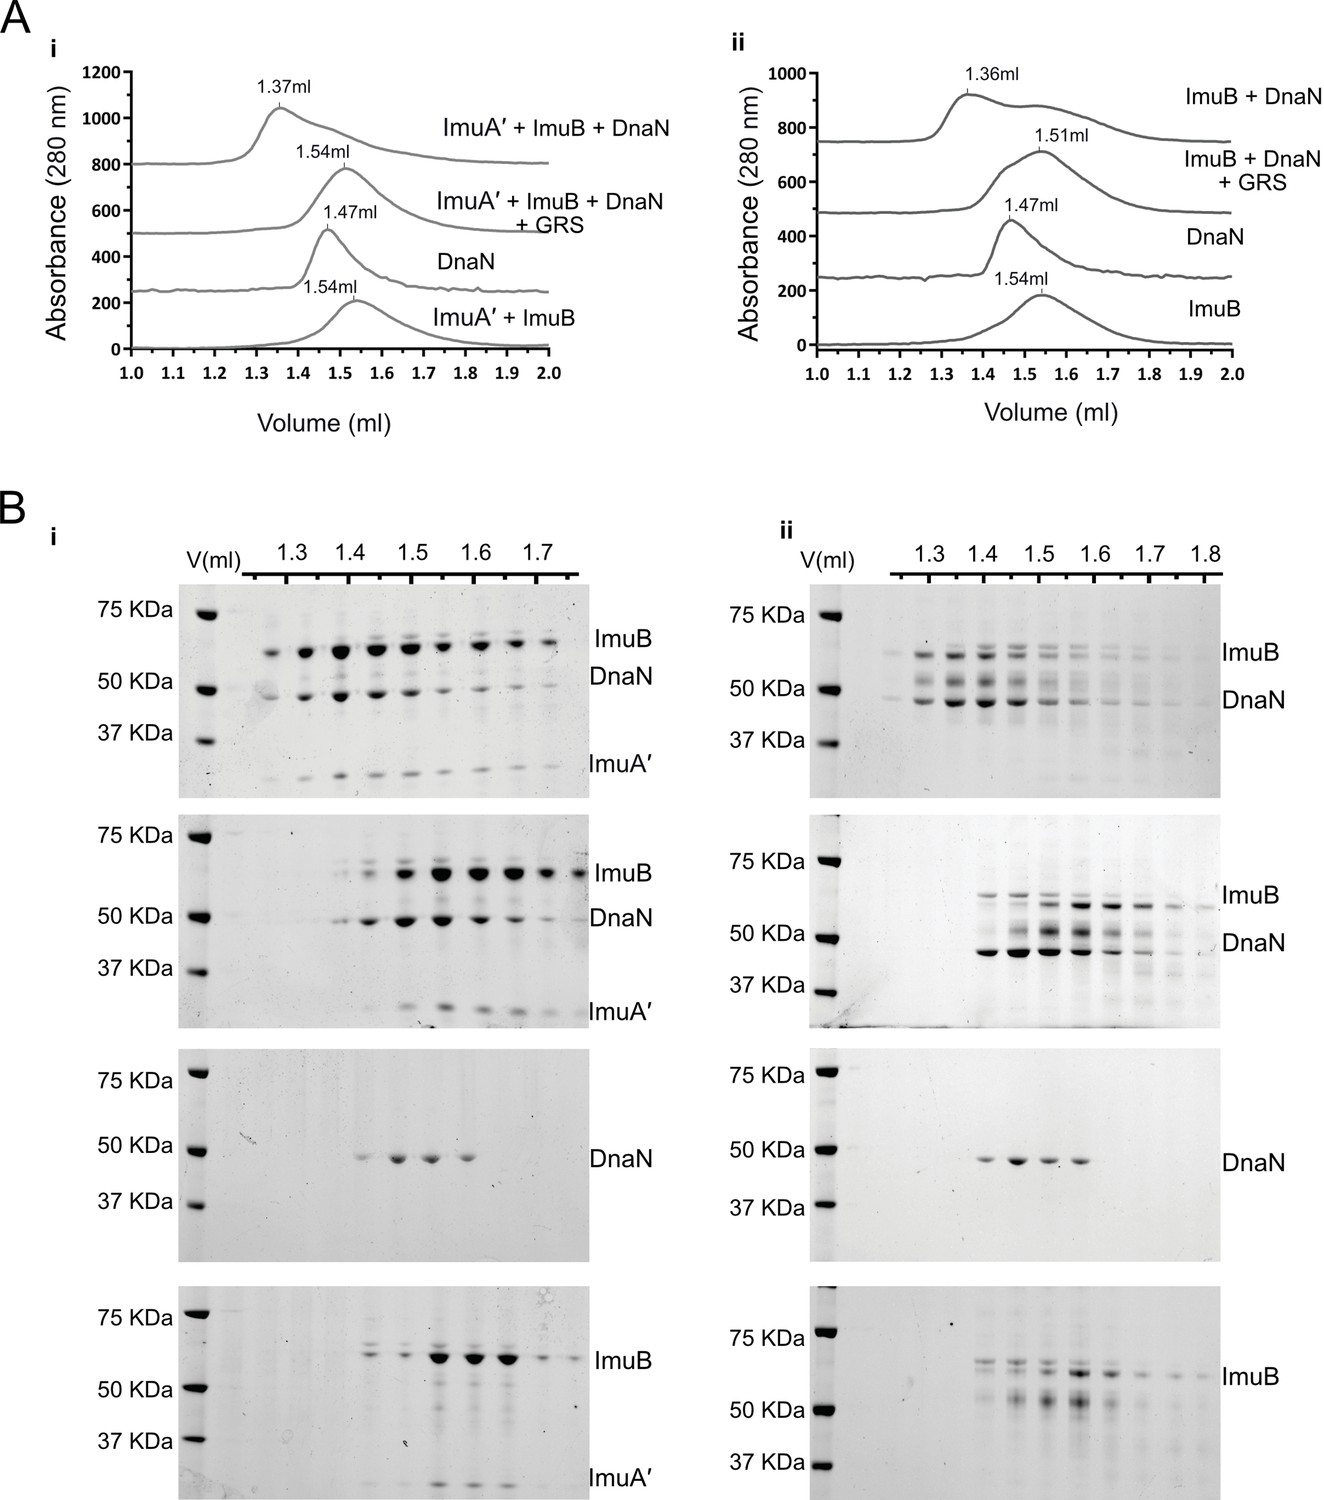
ImuB and ImuA′–ImuB interact with DnaN and these interactions are disrupted by griselimycin (GRS).
(A) Gel filtration profiles of M. smegmatis (i) ImuA′B-DnaN and (ii) ImuB-DnaN complexes in the absence or presence of 15 μM GRS. For these experiments, 5 μM DnaN was added to 10 μM of (i) ImuA′B or (ii) ImuB. The gel filtration profiles of the individual proteins (ImuB and DnaN) or complex (ImuA′–ImuB) are shown for comparative purposes, and all curves were scaled for clarity. (B) Sodium dodecyl sulfate–polyacrylamide gel electrophoresis (SDS–PAGE) analysis of sequential fractions of the gel filtration runs. Gels are sorted in the same order as the corresponding gel filtration profiles shown in A. Source data are available in Figure4.zip which can be accessed at http://doi.org/10.5061/dryad.76hdr7szc.
Figure 4—figure supplement 1
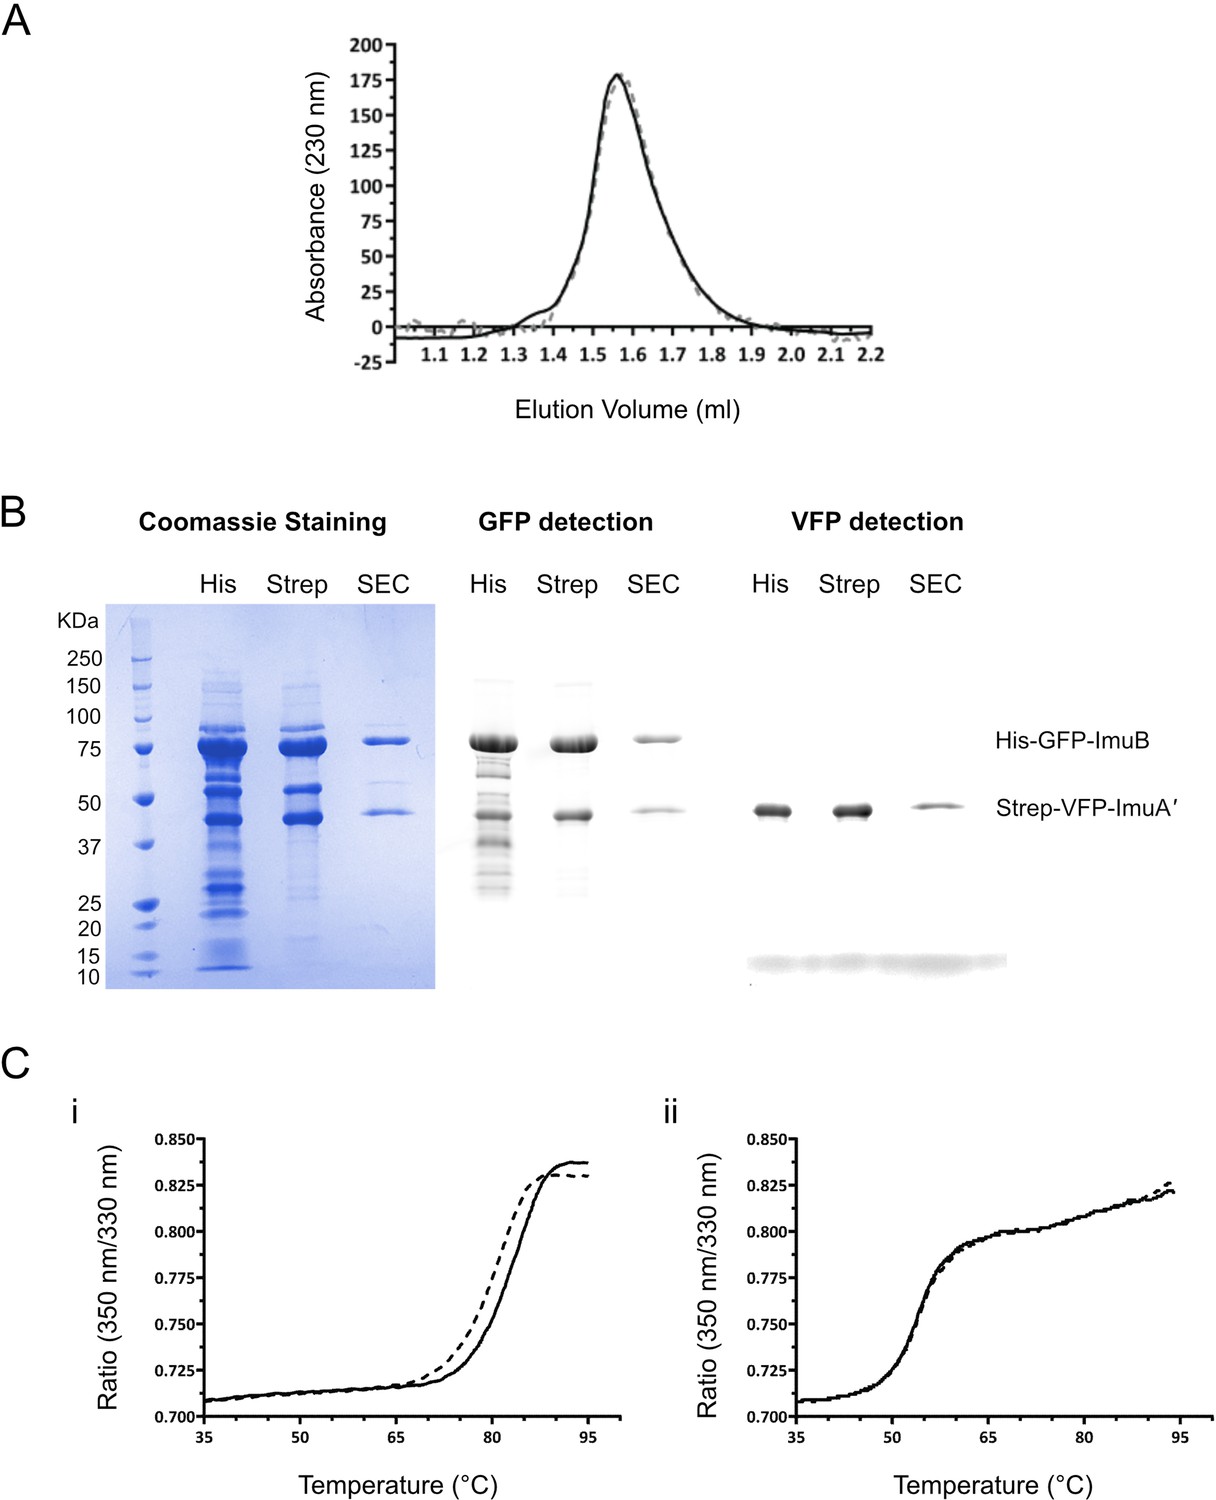
Biochemical confirmation of stable ImuA′–ImuB complex formation and griselimycin (GRS)-binding DnaN.
(A) M. smegmatis ImuA′ and ImuB form a stable complex. Gel filtration profiles of the ImuA′B complex at 14 μM (solid line) and 0.4 μM (dashed line) show identical elution volumes, indicating that the complex does not dissociate at these concentrations. For purposes of comparison, the gel filtration profiles were scaled. (B) His-GFP-ImuB and Strep-YFP-ImuA′ were co-expressed in E. coli and three steps of purification were performed. The lysate was initially loaded on a His-trap column and the ImuA′–ImuB complex was eluted with an imidazole gradient (His). Next, the His-Trap elution fractions were loaded on a Strep-trap column and ImuA′–ImuB complex was eluted using a desthiobiotin gradient (Strep). Lastly, the Strep-trap’s elution fraction was loaded in a size-exclusion chromatography column (SEC). Throughout all chromatography steps ImuB and ImuA′ were eluted together as a stable complex. His-GFP-ImuB and Strep-YFP-ImuA′ corresponding bands are indicated. (C) GRS binds M. smegmatis DnaN. (i) Melting curve of DnaN (5 μM) in the absence (dashed line) and presence (solid line) of 15 μM GRS. Addition of GRS results in an increase of 3°C in the protein melting temperature. (ii) Melting curve of ImuA′–ImuB complex (5 μM) in the absence (dashed line) and presence (solid line) of GRS. Addition of GRS (15 μM) does not alter the protein melting temperature (54.3°C).
Figure 5 with 1 supplement
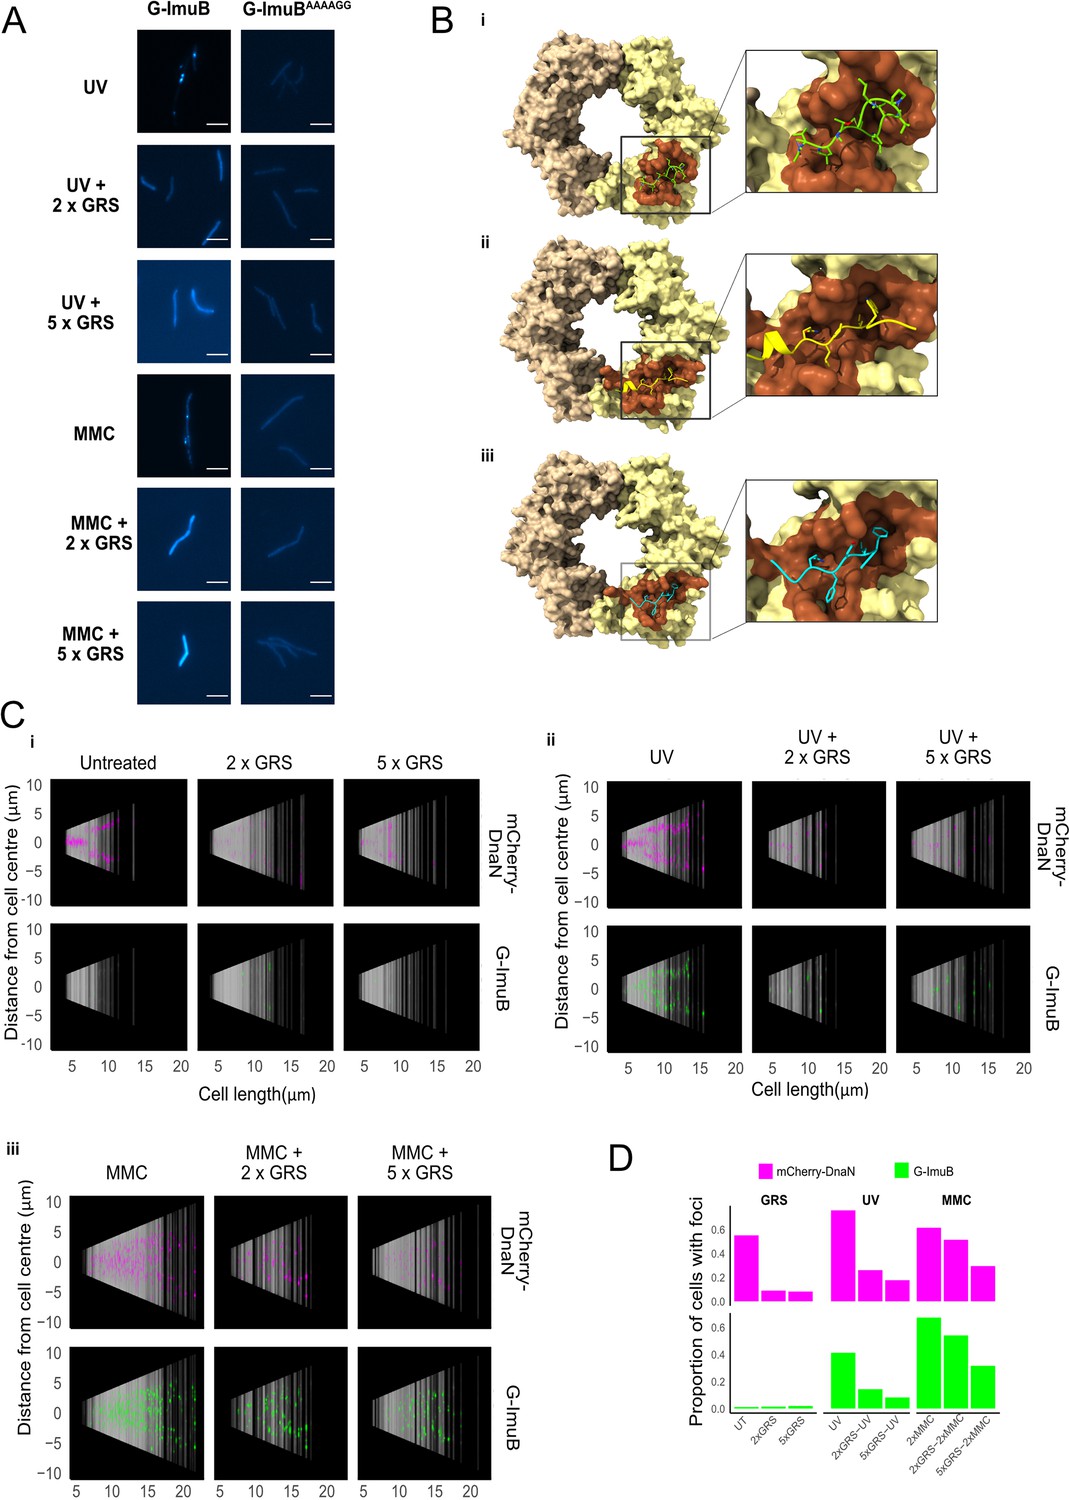
Disrupting the ImuB–β clamp interaction.
(A) Representative images of G-ImuB exposed to 2× MIC mitomycin C (MMC) for 4 hr (top panel) or 2× MIC MMC plus griselimycin (GRS) for 4 hr (center panel), and the G-ImuBAAAAGG mutant exposed to 2× MIC MMC for 4 hr (bottom panel). Scale bars, 5 μm. (B) Interactions of M. smegmatis β clamp with (i) GRS, (ii) ImuB, or (iii) the replicative DNA PolIIIα subunit, DnaE1. The interaction of the β clamp with GRS is represented by the X-ray structure of the complex (PDB id: 5AGU). Predicted interactions with ImuB (S347-I359) and DnaE1 (M947-G954) are derived from the respective AlphaFold models. Interacting peptides are shown as smoothed traces with side chains. The brown β clamp region indicates residues in contact with corresponding peptides. Molecular contacts were derived from 3D structures using the VoroContacts web server. Detailed contact data are provided separately (Supplementary file 1 – DnaN Contact Data). (C) Cells aligned by mid-cell position, arranged according to cell length and colored (magenta – mCherry-DnaN foci, green – G-ImuB foci) according to fluorescence intensity, showing the presence of G-ImuB foci following MMC treatment and the lack of foci after GRS exposure. G-ImuBAAAAGG shows no foci after MMC treatment, similar to the G-ImuB strain following GRS exposure. (D) Proportions of cells containing either mCherry-DnaN or G-ImuB foci following exposure to GRS alone at 2× MIC or 5× MIC, or in combination with either single-dose ultra-violet (UV) or MMC at 2× MIC or 5× MIC. Additional Source data are available in Figure5.zip, accessible at http://doi.org/10.5061/dryad.76hdr7szc.
Figure 5—figure supplement 1
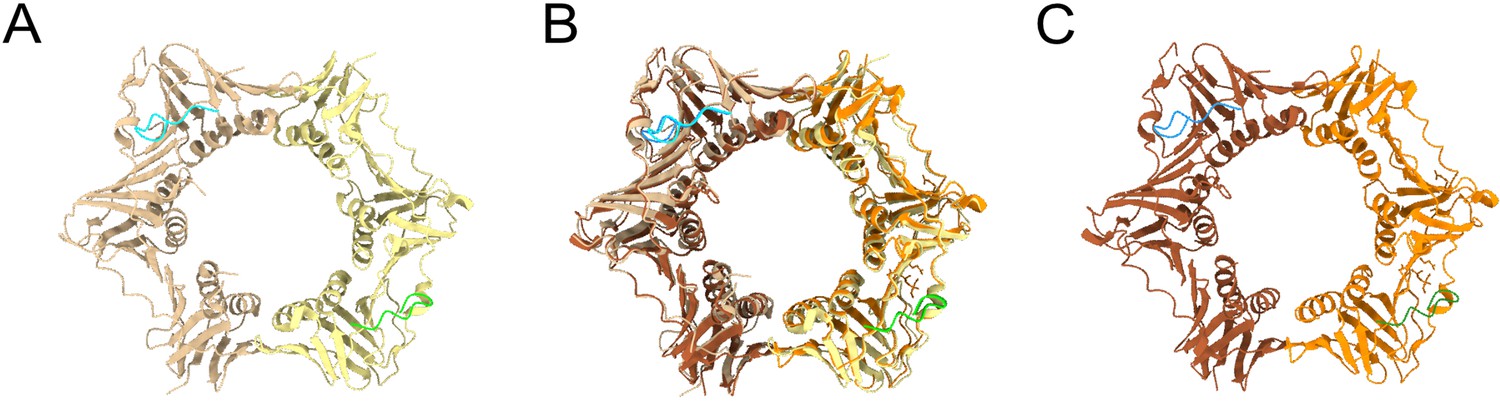
Comparison of M. smegmatis and M. tuberculosis β sliding clamps bound to griselimycin (GRS) crystal structures.
(A) M. smegmatis β clamp bound to GRS (PDB id: 5AH2). Each DnaN monomer is represented by a different color and each monomer is bound to GRS which is represented in blue and green. (B) Superimposed structures of M. smegmatis and M. tuberculosis. (C) M. tuberculosis β clamp bound to GRS (PDB id: 5AGU). Each DnaN monomer is represented by a different color and each monomer is bound to GRS which is represented in blue and green.
Videos
Video 1
Time-lapse microscopy of G-ImuB and mCherry-DnaN dual reporter.
Representative time-lapse movie of the reporter strain expressing G-ImuB and mCherry-DnaN. Bacteria were imaged on fluorescence and phase channels for up to 36 hr at 10-min intervals. Treatment with MMC (100 ng/ml) was at 0–4.5 hr. This experiment was repeated six times. Numbers indicate the hours elapsed in the time-lapse experiment. 7H9, Middlebrook 7H9/OADC; MMC, mitomycin C. Scale bar, 5 μm. G-ImuB, green; mCherry-DnaN, magenta; overlay, white.
Video 2
Time-lapse microscopy of V-ImuA′ and mCherry-DnaN dual reporter.
Representative time-lapse movie of the reporter strain expressing V-ImuA' and mCherry-DnaN. Bacteria were imaged on fluorescence and phase channels for up to 36 hr at 10-min intervals. Treatment with MMC (100 ng/ml) was at 0–4.5 hr. This experiment was repeated three times. Numbers indicate the hours elapsed in the time-lapse experiment. 7H9, Middlebrook 7H9/OADC; MMC, mitomycin C. Scale bar, 5 μm. V-ImuA', green; mCherry-DnaN, magenta; overlay, white.
Video 3
Time-lapse microscopy of G-DnaE2 and mCherry-DnaN dual reporter.
Representative time-lapse movie of the reporter strain expressing G-DnaE2 and mCherry-DnaN. Bacteria were imaged on fluorescence and phase channels for up to 36 hr at 10-min intervals. Treatment with MMC (100 ng/ml) was at 0–4.5 hr. This experiment was repeated three times. Numbers indicate the hours elapsed in the time-lapse experiment. 7H9, Middlebrook 7H9/OADC; MMC, mitomycin C. Scale bar, 5 μm. G-DnaE2, green; mCherry-DnaN, magenta; overlay, white.
Additional files
-
Supplementary file 1
DnaN contact data.
- https://cdn.elifesciences.org/articles/75628/elife-75628-supp1-v2.xlsx
-
Supplementary file 2
Key reagents.
- https://cdn.elifesciences.org/articles/75628/elife-75628-supp2-v2.xlsx
-
Transparent reporting form
- https://cdn.elifesciences.org/articles/75628/elife-75628-transrepform1-v2.pdf
Download links
A two-part list of links to download the article, or parts of the article, in various formats.
Downloads (link to download the article as PDF)
Open citations (links to open the citations from this article in various online reference manager services)
Cite this article (links to download the citations from this article in formats compatible with various reference manager tools)
Investigating the composition and recruitment of the mycobacterial ImuA′–ImuB–DnaE2 mutasome
eLife 12:e75628.
https://doi.org/10.7554/eLife.75628


