A non-transcriptional function of Yap regulates the DNA replication program in Xenopus laevis
- Paris-Saclay Institute of Neuroscience, CNRS, Université Paris-Saclay, CERTOFrance, France
- Université Paris-Saclay, CEA, CNRS, Institute for Integrative Biology of the Cell (I2BC), France
Figures
Figure 1 with 3 supplements

Yap is recruited to chromatin during DNA replication and the absence of Yap accelerates DNA synthesis in Xenopus egg extracts.
(A) Sperm nuclei were incubated in Xenopus egg extracts in the absence (Control) or presence of geminin (+Gem). Chromatin was isolated for immunoblotting at indicated times points before and during DNA replication. (B) Quantification of chromatin-bound Yap: percentage of optical densities of the Yap bands relative to that in the control condition at 90 min in isolated chromatin fractions. The number, n, of analysed fractions per time point during DNA replication is indicated for each bar. Statistical differences according to Mann-Whitney test (p-values indicated; ns, not significant). Data is reported as mean ± SEM. (C) Western blot showing the efficiency of Yap protein depletion in Xenopus egg extracts. Extracts were immunodepleted with either a rabbit anti-Yap antibody (ΔYap) or a rabbit IgG as a control (ΔMock). Tubulin was used as a loading control. (D) Mock- or Yap-depleted extracts were supplemented with sperm nuclei and incubated with rhodamine-dUTP for 60 min. Sperm nuclei were localized by Hoechst fluorescence to define regions of interest (as exemplified for one nucleus with yellow dotted circle). Scale bar = 20 μm. (E) Rhodamine-dUTP incorporation was quantified as fluorescence intensity per nucleus (arbitrary units (AU); scatter blot with mean and SD; Mann-Whitney Test, two-tailed; p-value indicated). (F) Mean increase of fluorescence per nucleus after Yap depletion versus Mock depletion from six independent experiments (scatter blot with mean with SD; one sample t-test, two-tailed, p-value indicated). (G) Mock- or Yap-depleted extracts were supplemented with sperm nuclei and [α32P]dCTP for different times, DNA was purified, counted for [32P] incorporation and absolute DNA synthesis was calculated as ng of synthetized DNA per µg of total DNA. Means ± SEM from three independent experiments are shown. (H) Violin plot showing ΔYap/ΔMock ratio of incorporation from eight independent nascent DNA strands experiments. The percentage of incorporation was fractionated in four intervals to distinguish early (0–25%), mid (25–50%), late (51–75%), and very late (76–100%) phases of the replication process. The red dashed line highlights a ΔYap/ΔMock ratio of 1 that indicates no difference in the level of DNA synthesis between the two conditions, with the red dot indicating the mean and the red error bar the SEM; Wilcoxon signed ranked test, p-values: p=0.002 (0–25%, n=12), p=0.014 (26–50%, n=11), p=0.16 (51–75%, n=6), p=0.0002 (76–100%, n=13).
-
Figure 1—source data 1
Related to Figure 1.
- https://cdn.elifesciences.org/articles/75741/elife-75741-fig1-data1-v2.zip
Figure 1—figure supplement 1
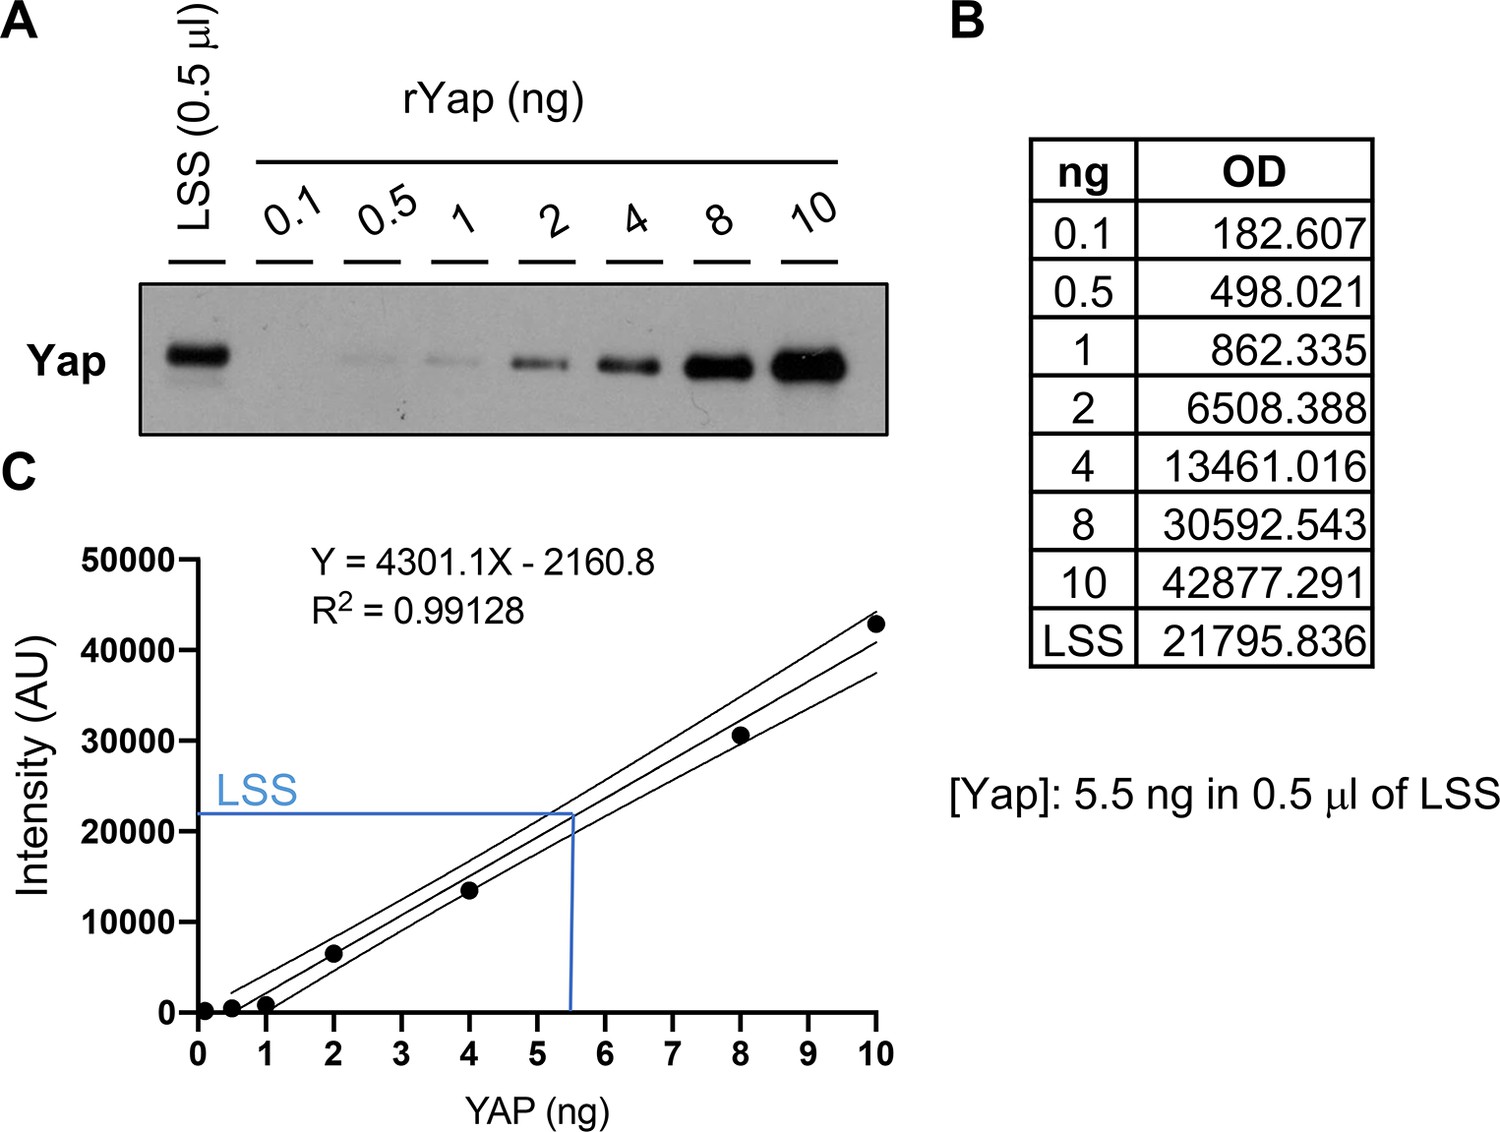
Yap protein concentration in Xenopus egg extracts.
(A) Western blot showing different amounts of recombinant Yap (rYap) used to estimate endogenous Yap in egg extracts (LSS for low-speed supernatant). (B, C) The optical densities (OD) of the protein bands from (A) were used to plot a standard curve and to calculate Yap amount in the LSS.
-
Figure 1—figure supplement 1—source data 1
Related to Figure 1—figure supplement 1.
- https://cdn.elifesciences.org/articles/75741/elife-75741-fig1-figsupp1-data1-v2.zip
Figure 1—figure supplement 2
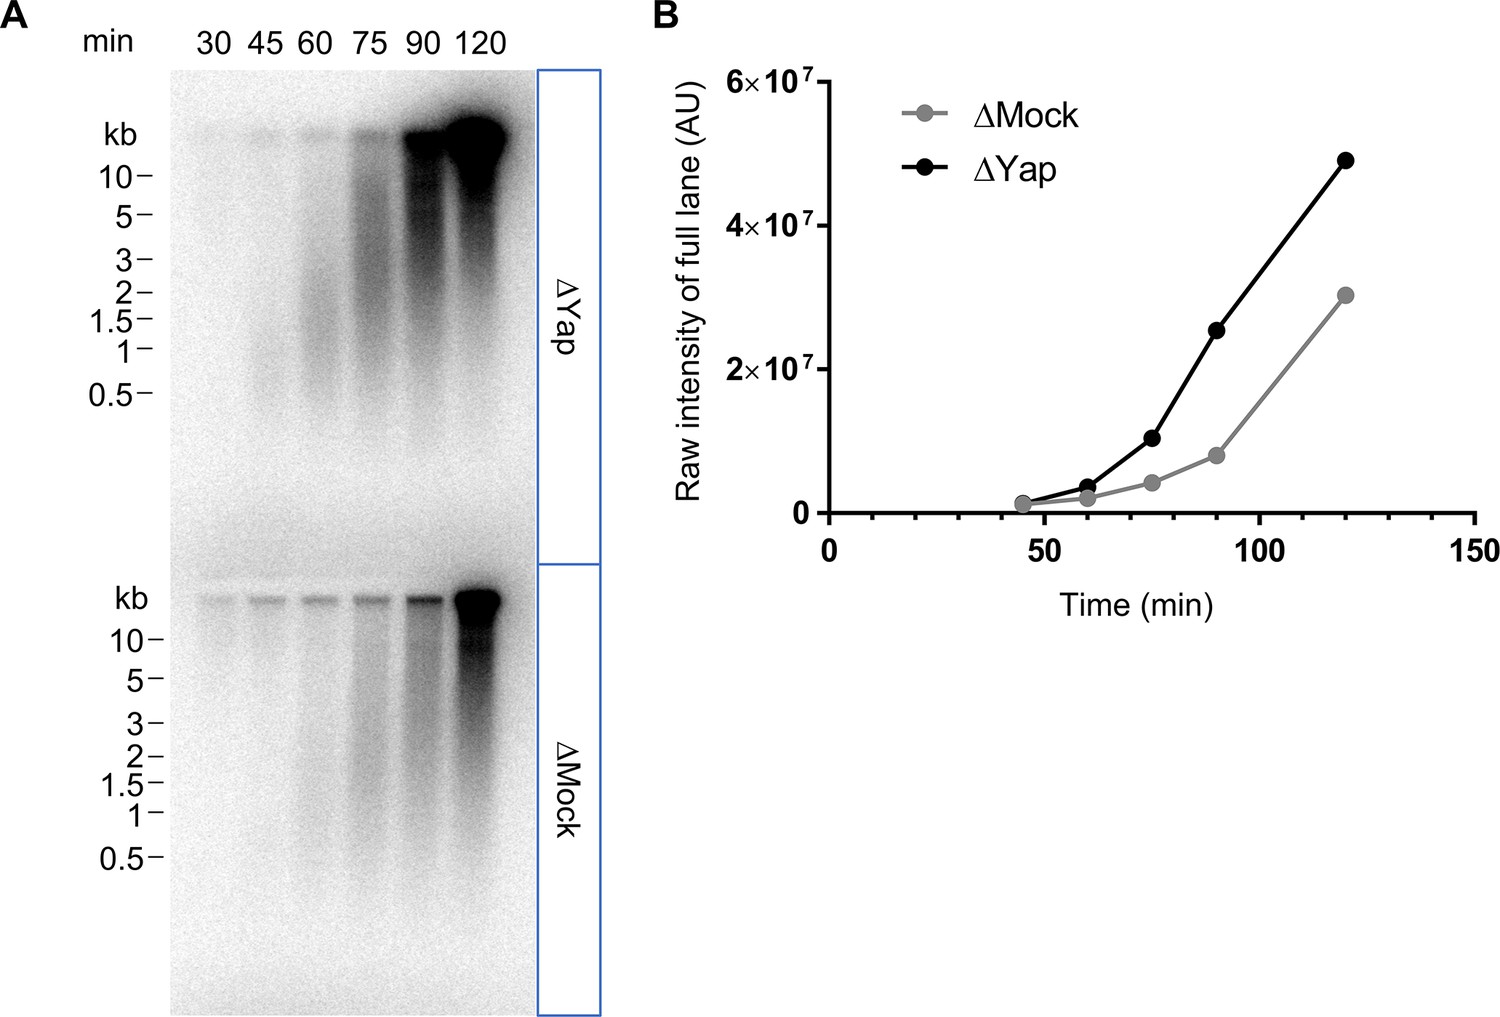
Yap depletion increases nascent strand synthesis in egg extracts.
(A) Immunodepleted extracts with either a rabbit anti-Yap antibody (ΔYap) or a rabbit IgG as a control (ΔMock) were supplemented with sperm nuclei and incubated with [α32P]dCTP for the indicated times in order to label nascent DNA increasing in length during replication. Nascent DNA strands synthesized were analysed using alkaline gel electrophoresis. (B) The level of radioactivity incorporation was quantified for each lane and plotted as raw intensity values (arbitrary units (AU)).
-
Figure 1—figure supplement 2—source data 1
Related to Figure 1—figure supplement 2.
- https://cdn.elifesciences.org/articles/75741/elife-75741-fig1-figsupp2-data1-v2.zip
Figure 1—figure supplement 3
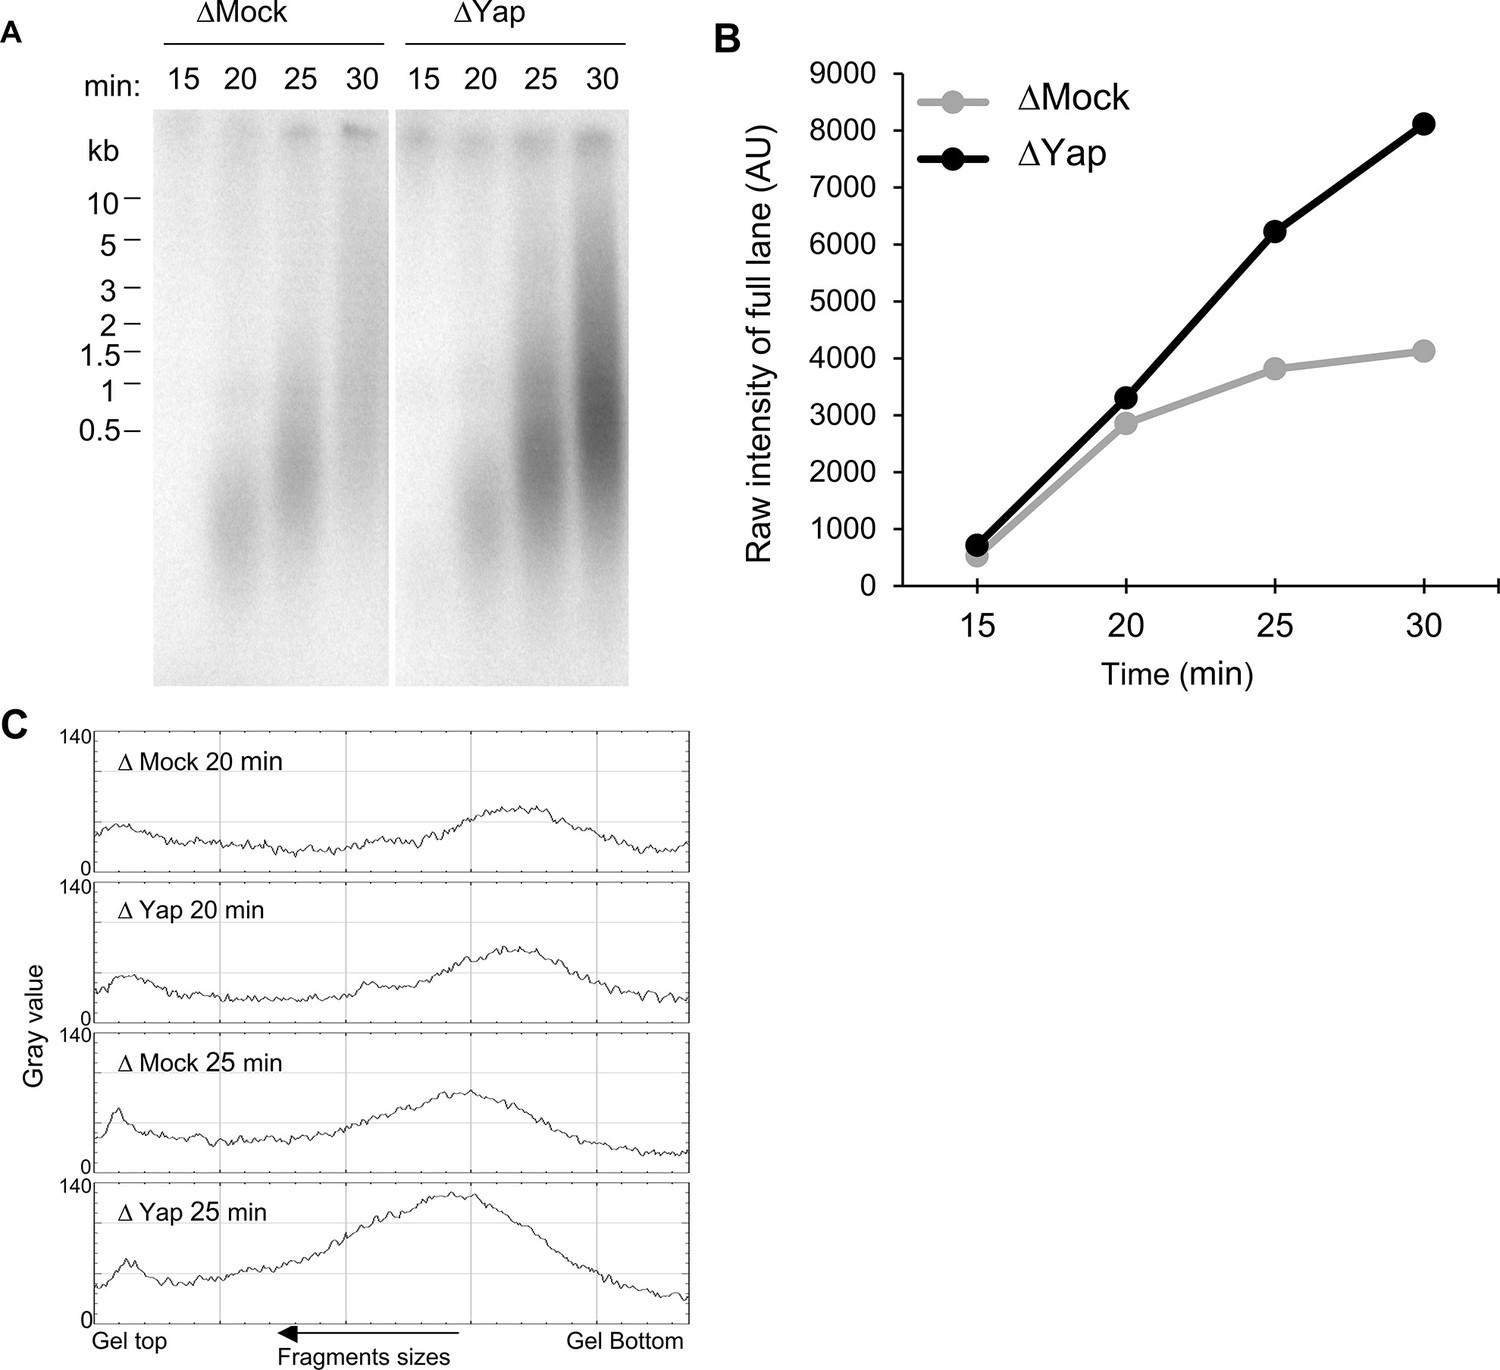
Yap depletion does not affect entry into S-phase.
(A) Nascent DNA strands synthesized during early S-phase were analysed at the indicated times by alkaline gel electrophoresis, as described in Figure 1—figure supplement 2A. (B) The amount of radioactivity incorporation was quantified for each lane and plotted as raw intensity values. Very similar incorporation is observed at the earliest time points (15–20 min) before getting higher in Yap-depleted (ΔYap) compared to control-depleted extracts (ΔMock) (25–30 min). (C) Grey scale profile (ImageJ) of lanes at 20 and 25 min, showing that size distribution of nascent strands is nearly identical in both conditions, and therefore entry in S-phase is unchanged after Yap depletion.
-
Figure 1—figure supplement 3—source data 1
Related to Figure 1—figure supplement 3.
- https://cdn.elifesciences.org/articles/75741/elife-75741-fig1-figsupp3-data1-v2.zip
Figure 2
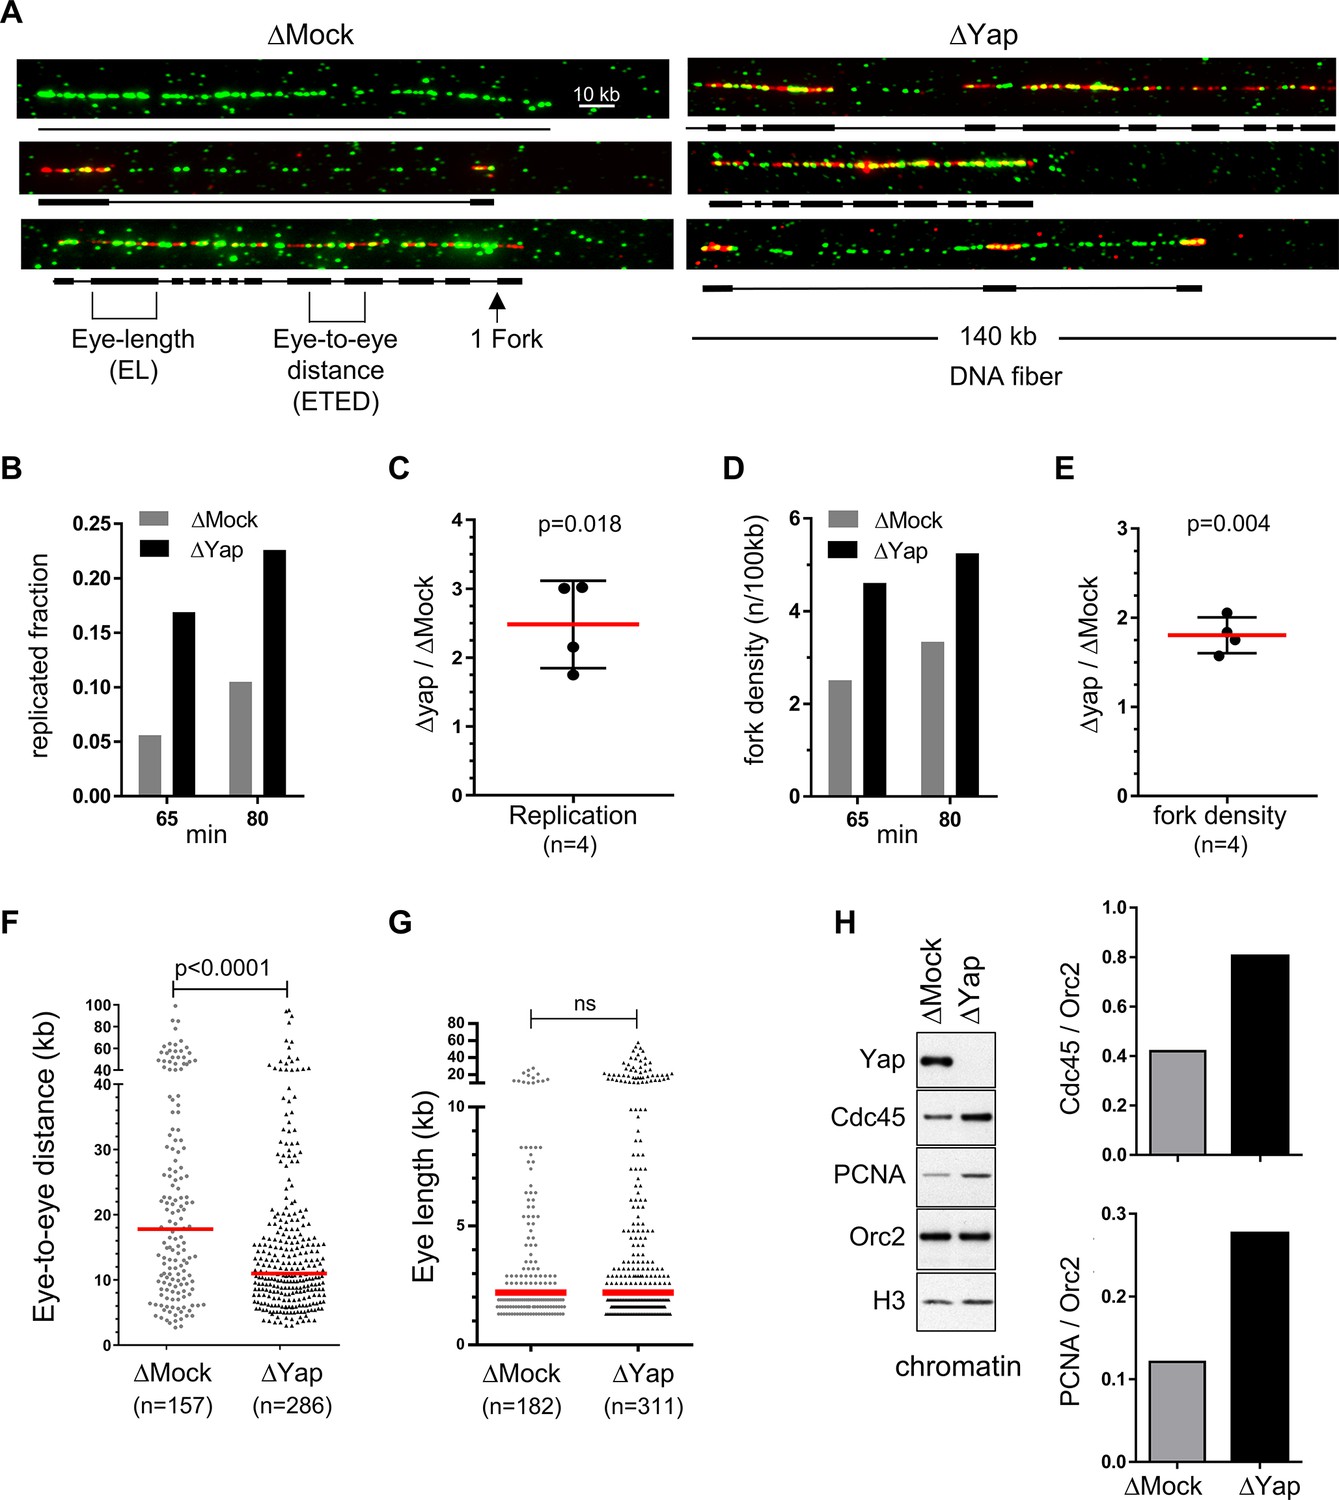
Egg extracts lacking Yap exhibit more active replication origins.
Sperm nuclei were incubated in egg extracts in the presence of biotin-dUTP and DNA combing was performed. (A) Three representative combed DNA fibers from one combing experiment (replicate 1) after 55 min biotin-dUTP incubation in either Mock- or Yap-depleted extracts (green: whole DNA labelling; red: biotin labelled replication eyes). (B) Replicated fraction of one combing experiment (replicate 2) at two time points (min). (C) Scatter plots of ΔYap/ΔMock ratios of replicated fractions of both combing experiments at 2 time points, with mean and standard deviation, p value from one-sample t-test compared to theoretical mean 1. (D) Fork density (number of forks/100 kb) of one combing experiment (replicate 2) at two time points (min). (E) Scatter plots of ΔYap/ΔMock ratios of fork densities of both combing experiments at 2 time points, with mean and standard deviation, p value from one-sample t-test compared to theoretical mean 1. (F) Eye-to-eye distance (ETED) distributions of one combing experiment (replicate 2) at 80 min after Mock- or Yap-depletion, scatter dot plots with median (red bar), Mann-Whitney test. (G) The eye length (EL) distributions of one combing experiment (replicate 2) at 65 min after Mock- or Yap- depletion, scatter dot plots with median (red bar), Mann-Whitney test; ns, non-significant. (H) Left panel: western blot of chromatin bound proteins after Mock- or Yap-depletion at early S-phase with indicated antibodies. Right panel: quantification of Cdc45/Orc2 and PCNA/Orc2 ratios.
-
Figure 2—source data 1
Related to Figure 2.
- https://cdn.elifesciences.org/articles/75741/elife-75741-fig2-data1-v2.zip
Figure 3
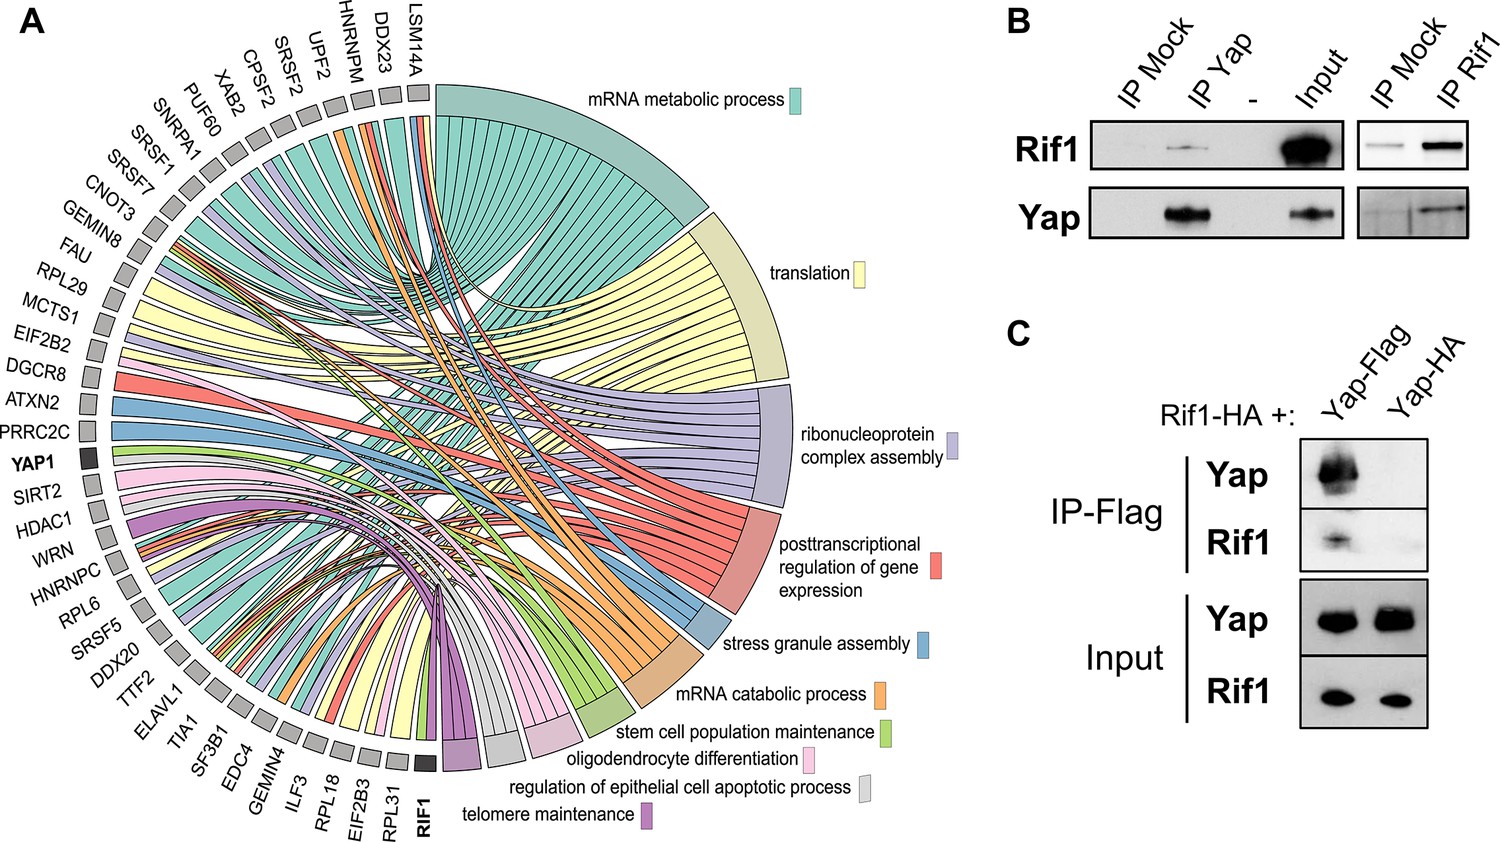
Rif1 interacts with Yap.
(A) Chord plot representation related to GO annotations belonging to biological processes of proteins enriched by at least threefold in Yap versus control co-immunoprecipitations performed in S-phase egg extracts. Note that Yap and Rif1 are both functionally associated with stem cell population maintenance (light green). (B) Anti-Yap (IP Yap), anti-Rif1 (IP Rif1), or control (IP Mock) antibodies coupled to Sepharose beads were incubated in S-phase egg extracts; immunoprecipitates were subjected to gel electrophoresis and western blotted using the indicated antibodies. -, unloaded lane. (C) Extracts from HEK293T cells transfected with the indicated tagged constructs were immunoprecipitated using anti-Flag antibodies. The input and immunoprecipitates were subjected to gel electrophoresis and western blotted using the indicated antibodies.
-
Figure 3—source data 1
Related to Figure 3.
- https://cdn.elifesciences.org/articles/75741/elife-75741-fig3-data1-v2.zip
Figure 4
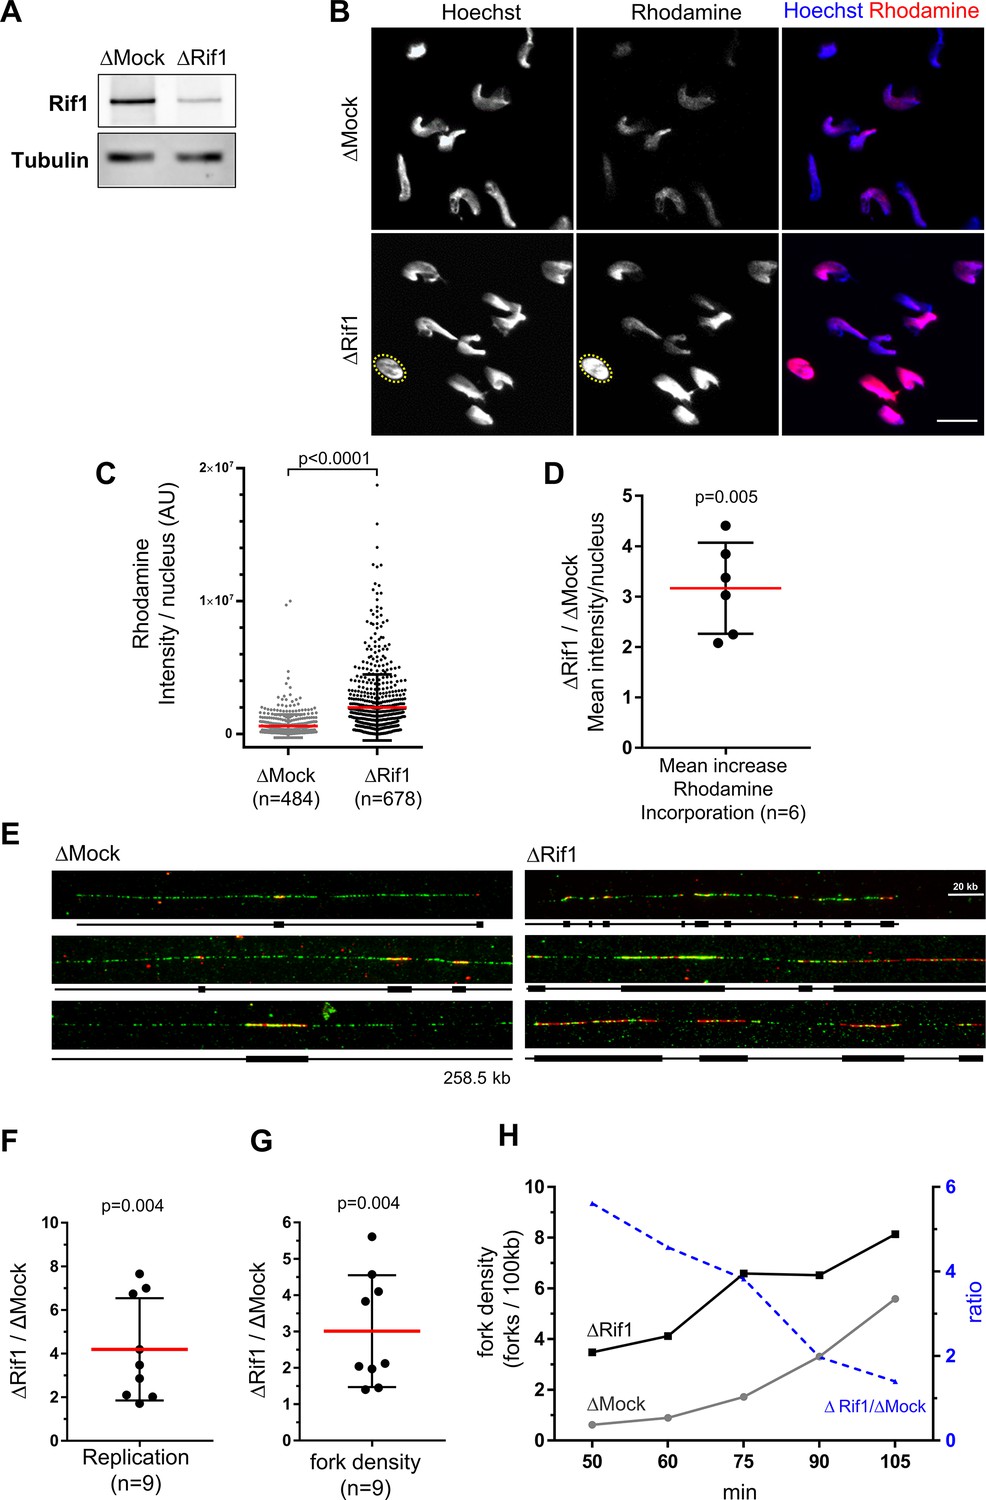
Rif1 depletion increases global fork density in egg extracts.
(A) Western blot of egg extracts after Mock- or Rif1-depletion using the indicated antibodies. Tubulin is used as a loading control. (B) Mock- or Rif1-depleted extracts were incubated with sperm nuclei and rhodamine-dUTP. Replicating sperm nuclei were localized by Hoechst fluorescence (as exemplified for one nucleus with yellow dotted circle). Scale bar = 20 μm. (C) Rhodamine-dUTP incorporation was quantified as fluorescence intensity per nucleus (AU for arbitrary units), scatter plot with Mean ± SD (Mann-Whitney test, two-tailed, p-value indicated). (D) Mean increase of fluorescence/nucleus after Yap-depletion versus Mock-depletion from six independent experiments, scatter plot with mean ± SD, one-sample t-test (two tailed), p-value indicated. (E) Sperm nuclei were incubated in egg extracts in the presence of biotin-dUTP and DNA combing was performed. Three representative combed DNA fibers replicated in either the Mock- or Rif1-depleted extracts from one combing experiment (replicate 1) at 75 min (green: whole DNA labelling; red: biotin-labelled replication eyes). (F, G) Replicated fractions (F) and fork density (number of forks/100 kb) (G) from two independent experiments at several time periods of biotin-dUTP incorporation, Scatter plots of ΔRif1/ΔMock ratios with mean and standard deviation, p values from one-sample t-test compared to theoretical mean 1. (H) Fork density and fork density ratios of one combing experiment (replicate 1) at different time points (min).
-
Figure 4—source data 1
Related to Figure 4.
- https://cdn.elifesciences.org/articles/75741/elife-75741-fig4-data1-v2.zip
Figure 5 with 1 supplement

Yap and Rif1 depletions accelerate cell cycles in early Xenopus embryos.
(A) Time course analysis of Yap expression throughout development by western blot. Tubulin is used as a loading control. (B) Diagram of the experimental procedure used in (C). (C) Evaluation of the number of cells per Xenopus embryo, at stage 7, following Yap expression perturbations. The number of cells per embryo within a defined area (black boxes on the right pictures) was quantified (top panel). Data are shown as individual value plots with error bars (mean ± SEM) in red; Mann-Whitney test; p-values indicated; ns, not significant. X. laevis embryos were microinjected at the one-cell stage as shown in the table to obtain four different levels of Yap expression: unaffected situation (control), gain of function (GOF), loss of function (Yap-depleted) and a restored expression (rescue). Yap levels of expression were monitored by western blot (bottom panel, tubulin is used as a loading control). Representative images of injected embryos are shown on the right. Scale bar = 500 μm. Trim-Control = pre-immune serum + TRIM21; Trim-Yap = anti Yap antibody + TRIM21, Control-MO = control morpholino (MO), yap-MO = morpholino targeting yap mRNA, Control mRNA = GFP mRNA, yap-mRNA = mRNA encoding yap that is non-targetable by the yap-MO. (D) Evaluation of the number of cells in Xenopus embryos at stage 7 within a defined area (black boxes on the bottom pictures) following Yap or Rif1 depletions. The number of cells per embryo was quantified as in (C). Protein depletion efficiencies were assessed by western blot (middle panel). Representative images of injected embryos are shown at the bottom. Scale bar = 500 μm.
-
Figure 5—source data 1
Related to Figure 5.
- https://cdn.elifesciences.org/articles/75741/elife-75741-fig5-data1-v2.zip
Figure 5—figure supplement 1
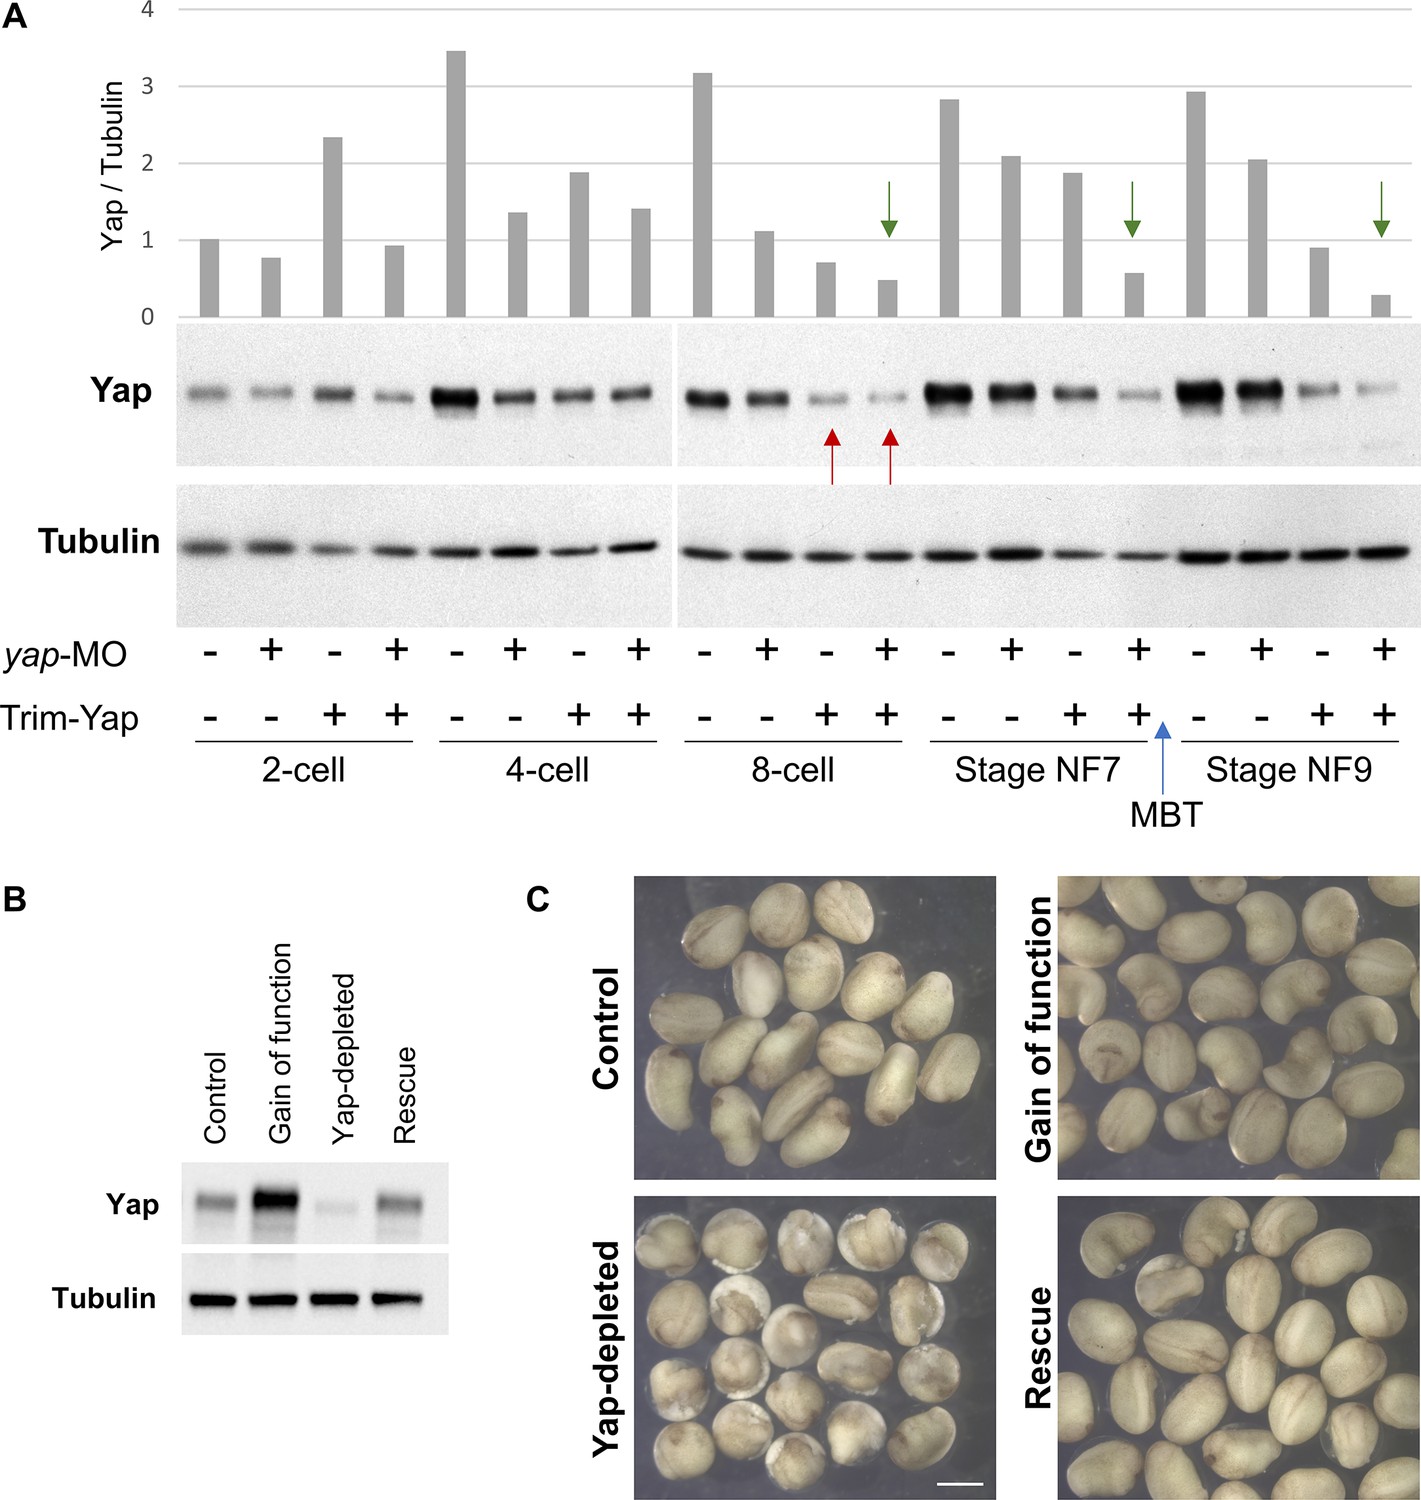
Yap knockdown using the Trim-Away strategy is effective at very early stages of development.
(A) Western blot performed on whole protein extracts from a pool of 8 embryos injected with either control morpholinos (-) or yap morpholinos (yap-MO, +), and/or pre-immune serum +TRIM21 (-) or anti-Yap antibodies + TRIM21 (Trim-Yap, +). Embryos were injected at the one-cell stage, then harvested at different times during development as indicated. The mid-blastula transition (MBT, blue arrow) as well as the time at which Yap depletion becomes observable (red arrows) are indicated. Green arrows indicate that Trim-Away and morpholino combined are more effective. Ratios of optical densities (OD) from Yap bands normalized to OD of tubulin bands are shown on the top panel. (B, C) Embryos injected as in Figure 5C were allowed to develop until the neurula stage. The levels of Yap protein at this stage were monitored by western blot (B). Pictures of the resulting embryos are shown for each condition (C). Scale bar = 1 mm.
-
Figure 5—figure supplement 1—source data 1
Related to Figure 5—figure supplement 1.
- https://cdn.elifesciences.org/articles/75741/elife-75741-fig5-figsupp1-data1-v2.zip
Figure 6 with 2 supplements

rif1 is expressed in retinal stem cells and its knockdown leads to small eye phenotype.
(A) Schematic transversal section of a Xenopus tadpole retina (RPE: retinal pigmented epithelium; NR: neural retina; ON: optic nerve). Within the ciliary marginal zone (CMZ; lower diagram), retinal stem cells (RSC) reside in the most peripheral margin, while early (P1) and late (P2) progenitors are located more centrally. (B) Retinal sections from stage 41 Xenopus tadpoles following in situ hybridization for rif1 expression (left panels, in purple) or immunostained for Rif1 (middle panel Rif1 alone in white and right panel in red along with nuclei counterstained with Hoechst in blue). The images on the lower panels are higher magnification of the CMZ (delineated dotted lines on the top panels). (C) CMZ region of retinal sections from stage 41 Xenopus tadpoles co-immunostained for Yap, Rif1 along with nuclei counterstained with Hoechst. The left panel shows a merged picture of Yap (green) and Rif1 (Magenta). (D) Diagram showing the experimental procedure used in (E). One cell-stage embryos are microinjected with Control MO or rif1-MO and analysed at stage 41. The western blot shows the efficiency of the MO at depleting Rif1 in embryos. (E) Tadpoles microinjected with MO as shown in (D) and corresponding dissected eyes (right panels). (F) The area of dissected eyes was measured for 10 embryos per condition. Data are shown as individual value plots with error bars (mean with SEM in red; Mann-Whitney test, p-value indicated). Scale bar = 50 µm in (B, C), 1 mm in (E, tadpoles) and 100 µm in (E, dissected eyes).
-
Figure 6—source data 1
Related to Figure 6.
- https://cdn.elifesciences.org/articles/75741/elife-75741-fig6-data1-v2.zip
Figure 6—figure supplement 1
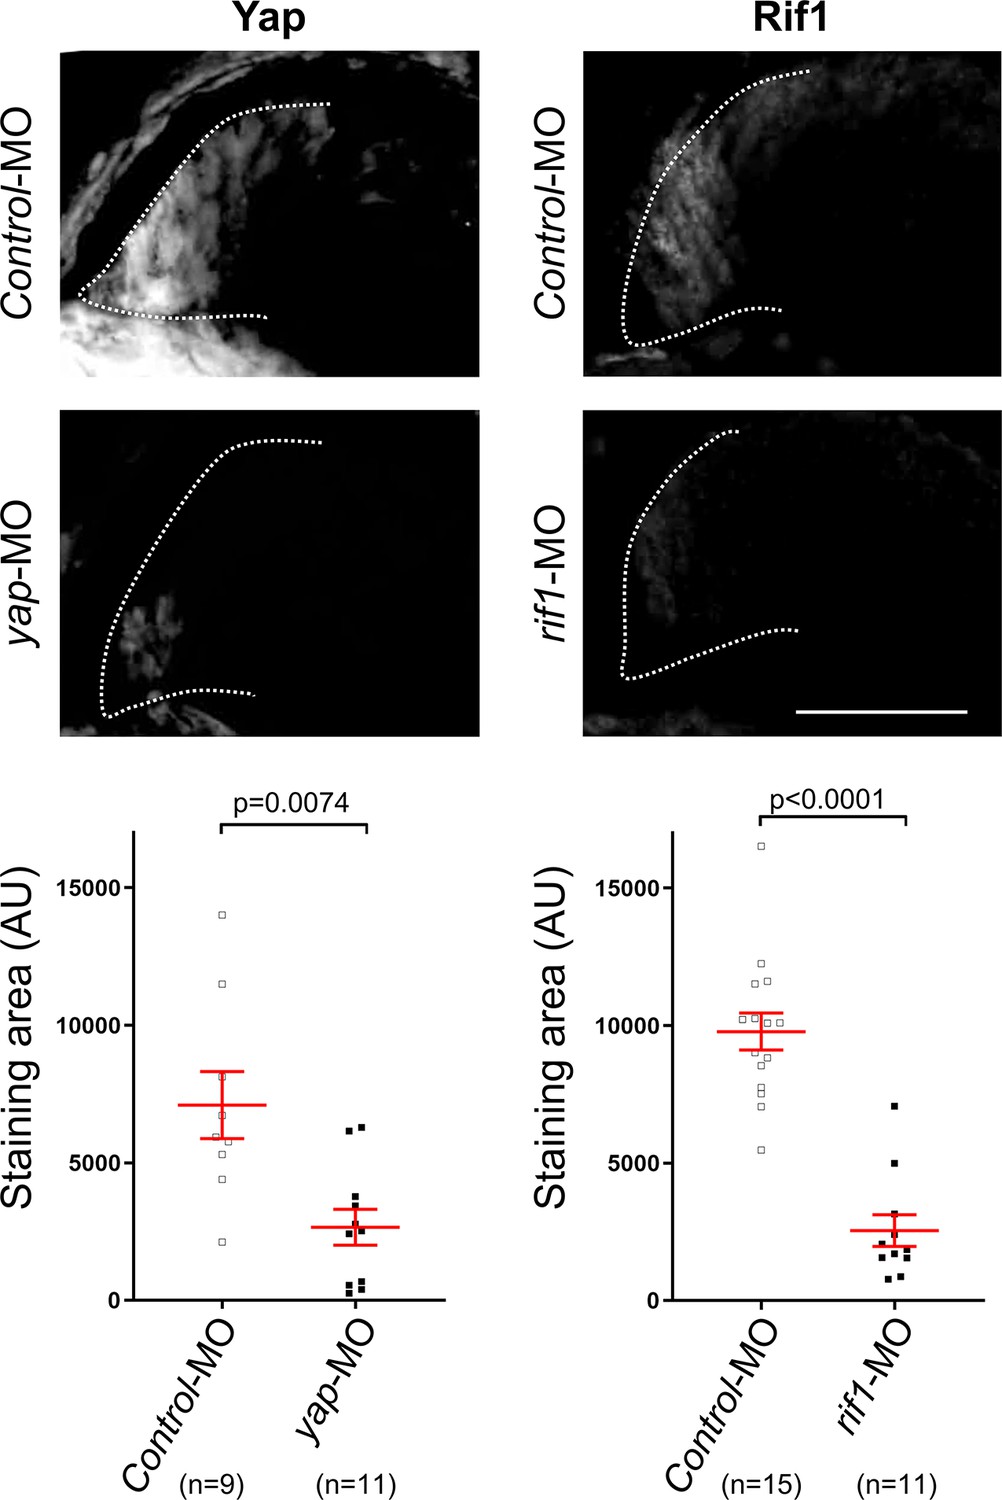
Validation of the specificity of YAP and Rif1 antibodies.
Retinal sections from stage 41 Xenopus tadpoles microinjected at the one-cell stage with either control-MO, yap-MO or rif1-MO as indicated and immunostained for either Yap or Rif1. The staining area was determined for at least 9 sections (each section from different retinas) per condition (AU: arbitrary unit). Data are shown as individual value plots with error bars (mean ± SEM in red, Mann-Whitney test; p values indicated). Scale bar = 50 μm.
-
Figure 6—figure supplement 1—source data 1
Related to Figure 6—figure supplement 1.
- https://cdn.elifesciences.org/articles/75741/elife-75741-fig6-figsupp1-data1-v2.zip
Figure 6—figure supplement 2
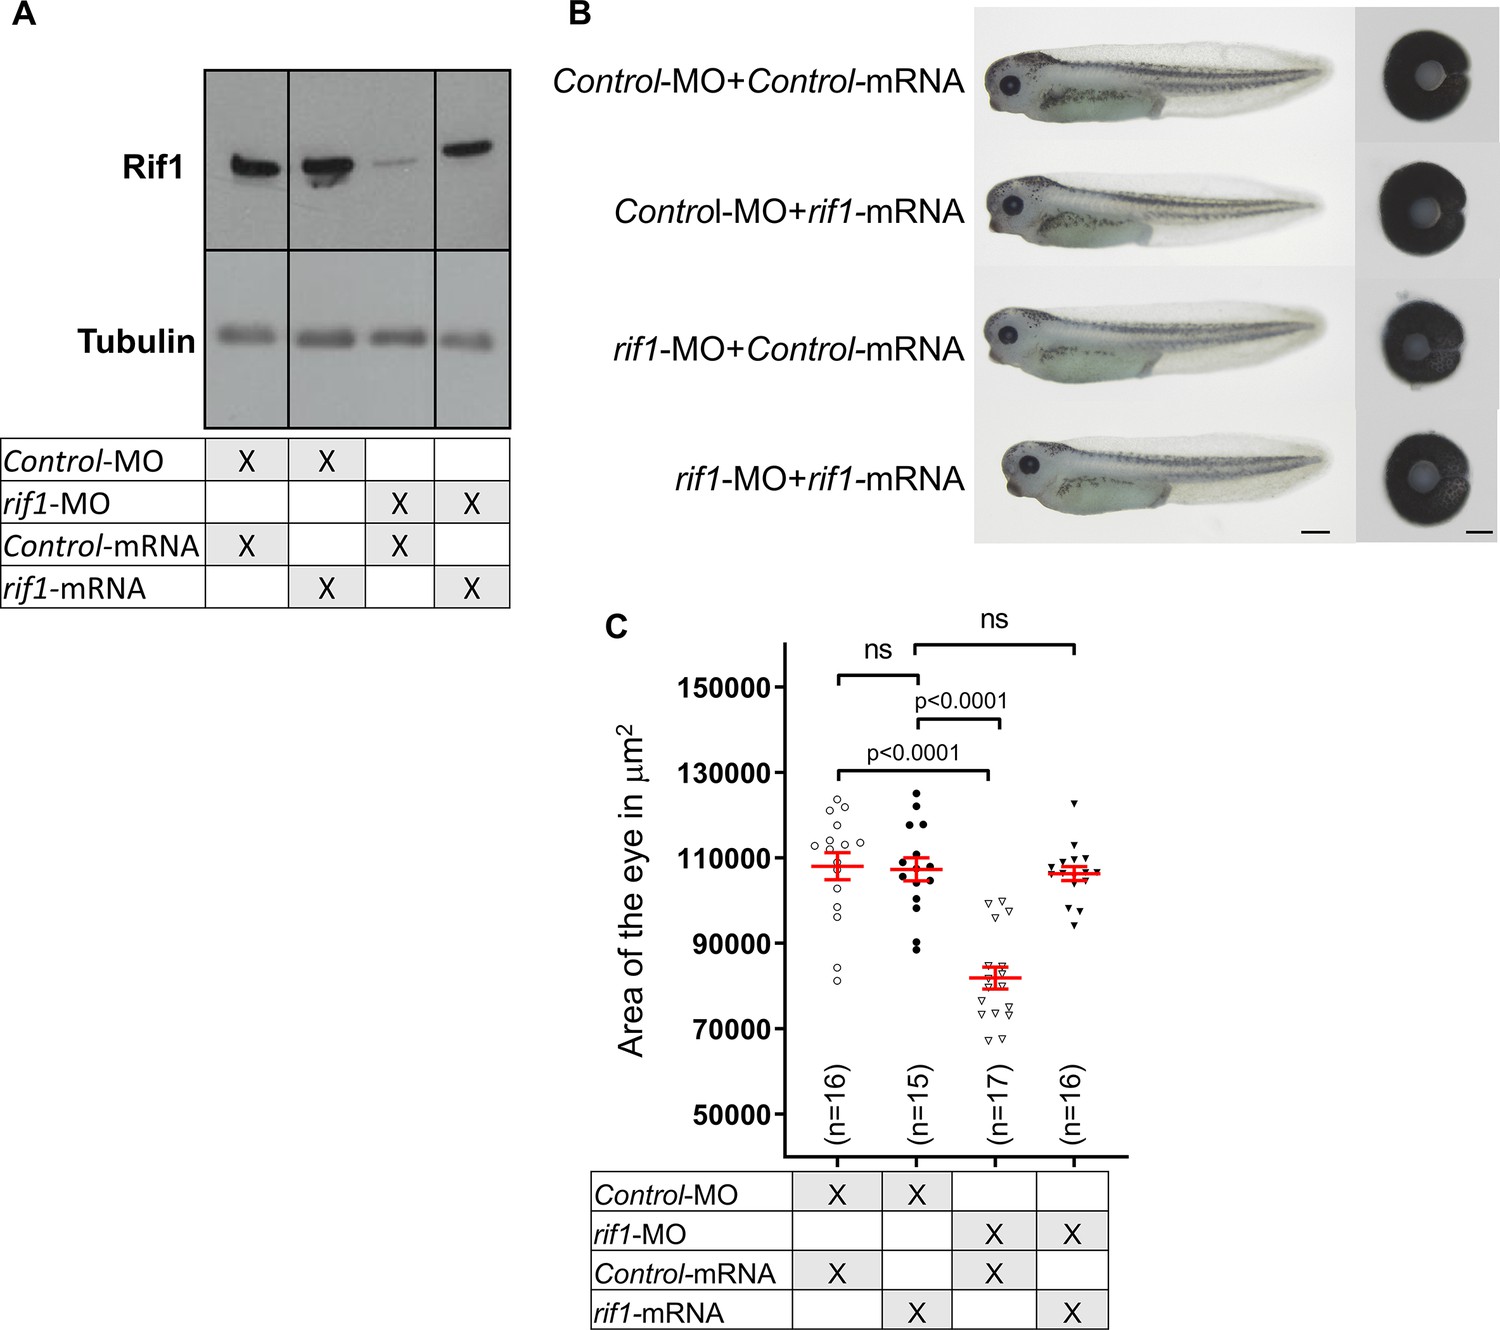
The rif1-MO-induced small eye phenotype is rescued by co-injection with rif1 mRNA.
(A) Western blot analysis showing the levels of Rif1 proteins in tadpoles at stage 41 following microinjection at one-cell stage as indicated in the table of either Control-MO or rif1-MO together with GFP-mRNA (Control-mRNA) or rif1-mRNA. Tubulin is used as a loading control. (B) Lateral views and dissected eyes of stage 41 tadpoles following one-cell stage microinjection of MO and mRNA as indicated. (C) Quantification of dissected eye areas. The rif1-MO-induced small eye phenotype is rescued by co-injection of rif1 mRNA. Of note a suboptimal dose of rif1 mRNA was used for the rescue experiment so that it does not alone generate any eye phenotype. The number of analysed tadpoles is indicated for each condition. Data are shown as individual value plots with error bars (mean ± SEM in red; Mann-Whitney test, p-values indicated). Scale bar = 500 μm for tadpoles and 50 μm for dissected eyes.
-
Figure 6—figure supplement 2—source data 1
Related to Figure 6—figure supplement 2.
- https://cdn.elifesciences.org/articles/75741/elife-75741-fig6-figsupp2-data1-v2.zip
Figure 7
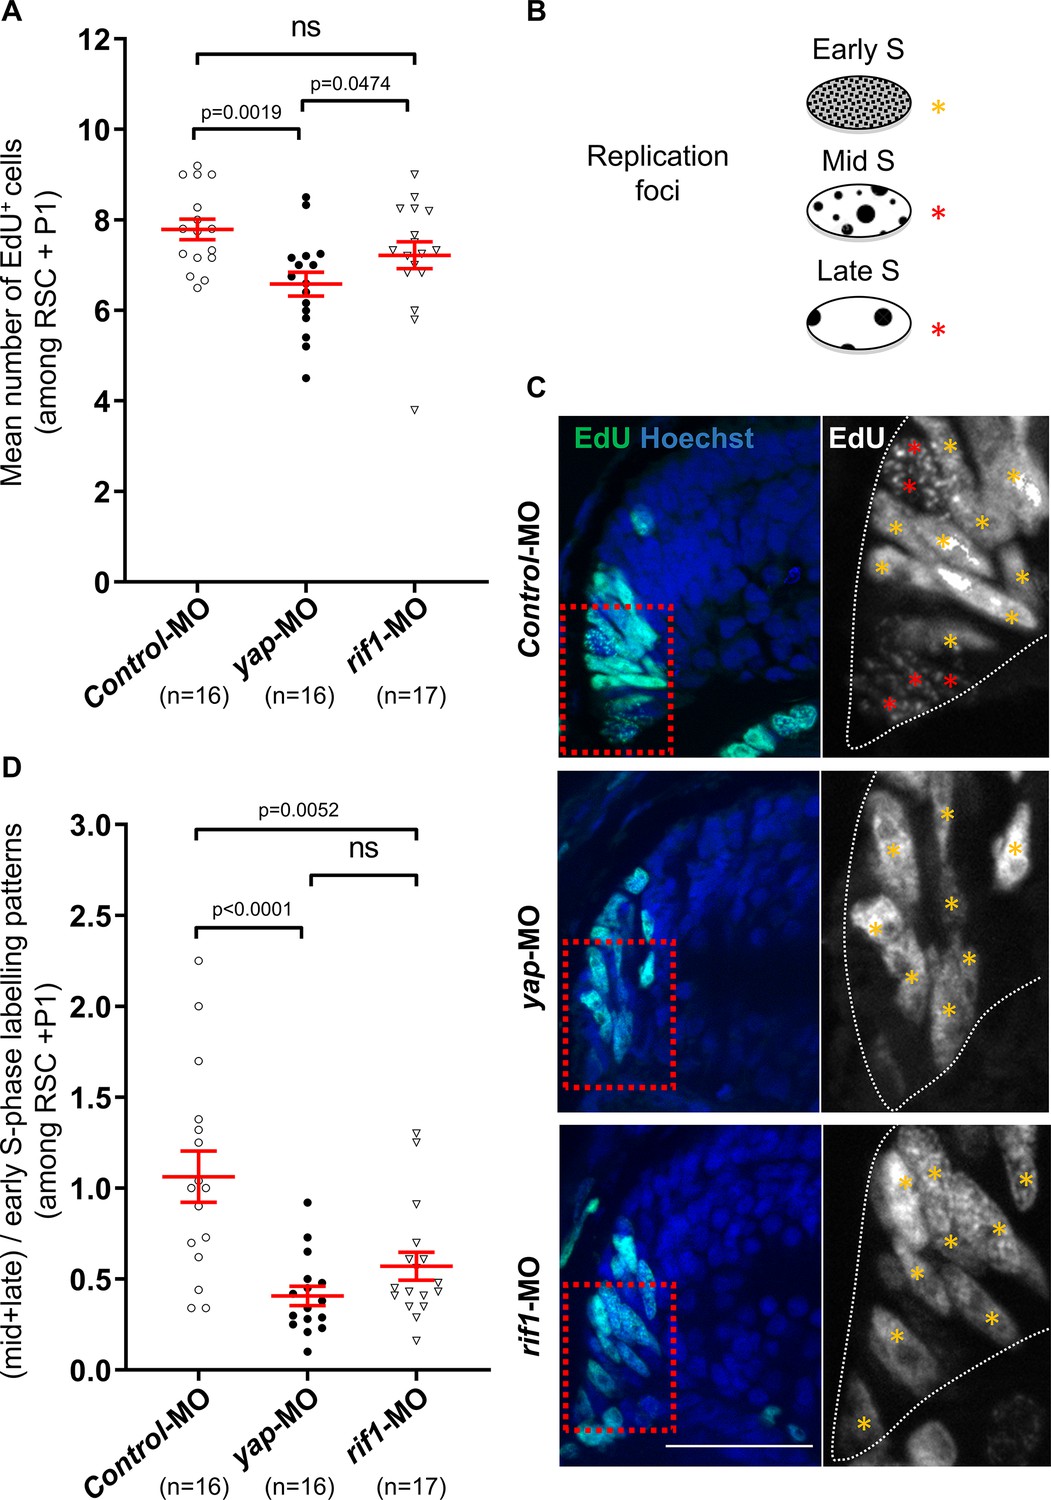
rif1 loss of function affects DNA replication timing in retinal stem/early progenitor cells.
(A) One-cell stage embryos were microinjected with either the control-MO (Control), yap-MO or rif1-MO and analysed for EdU-labelling (1 hr-pulse) at stage 41. Quantifications of EdU+ cell number in the retinal stem cells (RSC) and early progenitors (P1) regions (see diagram shown in Figure 6A). The number of analysed retinas is indicated for each condition. Data are shown as individual value plots with error bars (mean ± SEM in red; Mann-Whitney test; p-values indicated; ns, non-significant). (B) Schematic representation of the replication foci observed during S-phase progression as inferred from EdU labelling. Orange stars indicate typical early S replication patterns (homogeneous staining) while red stars indicate mid/late S replication ones (punctuated staining). (C) Retinal sections from stage 41 Xenopus tadpoles treated as described in (A). The region enlarged on the right panels is delineated with red dashed lined boxes. The outlines of the CMZ are highlighted by dotted white lines in the enlargements. Nuclei are counterstained with Hoechst. Scale bar = 50 μm. (D) Quantifications of the ratio of (mid + late)/early-like foci patterns in the retinal stem cells (RSC) and early progenitors (P1) regions. The number of analysed retinas is indicated for each condition. Data are shown as individual value plots with error bars (mean ± SEM in red; Mann-Whitney test; p-values indicated; ns, non-significant).
-
Figure 7—source data 1
Related to Figure 7.
- https://cdn.elifesciences.org/articles/75741/elife-75741-fig7-data1-v2.zip
Figure 8
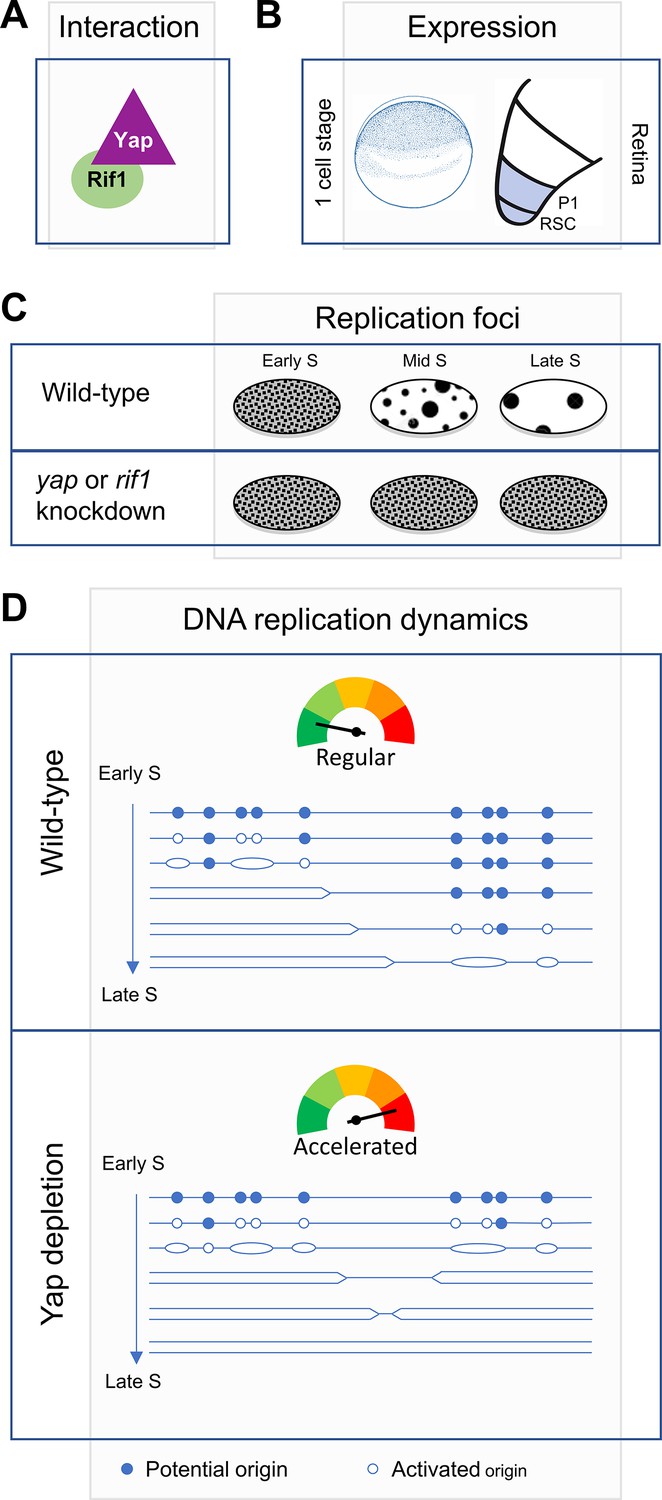
Diagram illustrating Yap function in the control of DNA replication dynamics.
We found that Yap and Rif1 can interact (A) and are co-expressed in Xenopus early embryos as well as in retinal stem (RSC)/progenitor cells (P1) (B). (C) We found that yap and rif1 knockdowns in retinal stem/progenitor cells similarly alter the proper repartition of early and late-like patterns of replication foci (this study and Cabochette et al., 2015). (D) We propose a model where Yap and Rif1 would ensure the proper orchestration of the RT program during early development. The schematic representation of the replication program was adapted from Gaboriaud J and Wu PJ (Gaboriaud and Wu, 2019). Based on our assays in vitro in egg extracts and in vivo in early embryos, we propose that following Yap depletion (bottom panel), the number of firing origins is increased, and S-phase length is reduced compared to a wild-type situation (top panel).
Author response image 1
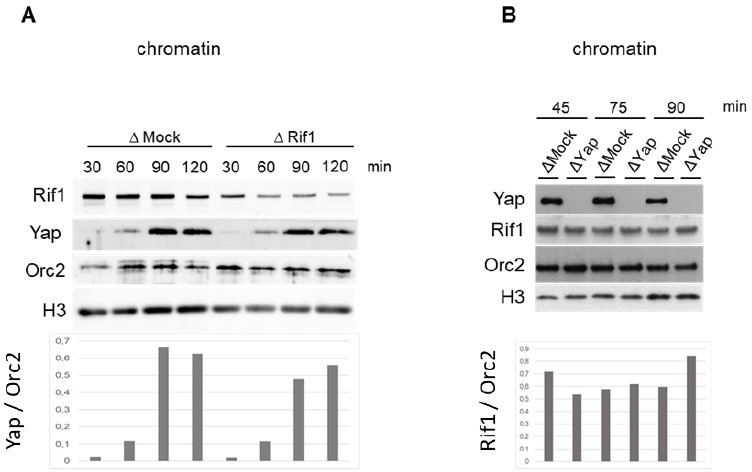
Rif1 depletion (A) or Yap depletion (B) does not inhibit Yap or Rif1 recruitment, respectively, onto chromatin in egg extracts.
Tables
Key resources table
| Reagent type (species) or resource | Designation | Source or reference | Identifiers | Additional information |
|---|---|---|---|---|
| Antibody | Anti-human MCM2 (rabbit polyclonal) | Bethyl lab, Euromedex, Souffelweyersheim, France | Cat# A300-191 RRID: AB_162709 | WB (1:2000) |
| Antibody | Anti-Xenopus MCM7 (rabbit polyclonal) | Gift from R. A. Laskey | doi: 10.1073/pnas.93.19.10189 | WB (1:1000) |
| Antibody | Anti-α Tubulin (mouse monoclonal) | Sigma, Saint-Quentin-Fallavier, France | Cat# T5168 RRID: AB_477579 | WB (1:10,000) |
| Antibody | Anti-rat PCNA (mouse monoclonal) | ThermoFisher, Illkirch, France | Cat# MA5-11358 RRID: AB_10982348 | WB (1:500) |
| Antibody | Anti-human Yap (mouse monoclonal) | Abcam Cambridge, UK | Cat# Ab56701 RRID: AB_2219140 | WB (1:1000), IHC (1:50) |
| Antibody | Anti-human Yap (rabbit polyclonal) | Abcam Cambridge, UK | Cat# Ab62752 RRID: AB_956477 | Immunodepletion (1 µl per 20 µl extract), IP (1 µl per 20 µl extract) |
| Antibody | Anti-human H3 (rabbit polyclonal) | Abcam Cambridge, UK | Cat# Ab1791 RRID: AB_302613 | WB (1:10000) |
| Antibody | Anti-Flag (rabbit polyclonal) | Cell Signaling, OZYME, Saint-Cyr-l'École, France | Cat# F7425 RRID: AB_439687 | IP (1 µl per test) |
| Antibody | Anti-human ssDNA (mouse monoclonal) | Merck Millipore, Guyancourt, France | Cat# MAB3034 RRID: AB_11212688 | DNA combing (1:50) |
| Antibody | Anti-Xenopus Yap (rabbit polyclonal) | This paper Covalab, Villeurbanne, France | IHC (1:100), WB (1:2000), IP (1 µl per 2,5 µl extract) Immunodepletion (1 µl per 2,5 µl extract), Trim away (50 nl per injection) | |
| Antibody | Anti-Xenopus Rif1(rabbit polyclonal) | This paper Covalab, Villeurbanne, France | doi: 10.1093/n10.1093/nar/gkab756 | IHC (1:100), WB (1:2000), IP (1 µl per 2 µl extract) Immunodepletion(1 µl per 2 µl extract), Trim away (50 nl per injection) |
| Antibody | Anti-Mouse IgG (rabbit polyclonal) | Sigma, Saint-Quentin-Fallavier, France | Cat# M7023 RRID: AB_260634 | Immunodepletion (1 µl per 2 µl extract) |
| Antibody | Anti-mouse Alexa 488 (rabbit polyclonal) | ThermoFisher, Illkirch, France | Cat# A11059 RRID: AB_2534106 | DNA combing (1:50) IHC (1:50) |
| Antibody | Anti-rabbit Alexa 448 (goat polyclonal) | ThermoFisher, Illkirch, France | Cat# A11008 RRID: AB_143165 | DNA combing (1:50) |
| Antibody | Anti-mouse Alexa 594 (goat polyclonal) | ThermoFisher, Illkirch, France | Cat# A11005 RRID: AB_2534073 | DNA combing (1:50), IHC (1:1000) |
| Antibody | Anti-mouse Alexa 488 (rabbit polyclonal) | ThermoFisher, Illkirch, France | Cat# A11001 RRID: AB_2534069 | IHC (1:1000) |
| Antibody | Anti-streptavidin biotinylated (goat polyclonal) | Eurobio, Les Ulis, France | Cat# BA-0500 RRID: AB_2336221 | DNA combing (1:50), IHC (1:50) |
| Antibody | Anti-mouse IgG HRP (goat polyclonal) | Sigma, Saint-Quentin-Fallavier, France | Cat# A4416 RRID: AB_258167 | WB (1:10000) |
| Antibody | Anti-rabbit IgG HRP (donkey polyclonal) | GE Healthcare, France | Cat# NA934 RRID: AB_772206 | WB (1:10000) |
| Peptide, recombinant protein | Streptavidin Alexa 594 | ThermoFisher, Illkirch, France | Cat# S11227 | (1:50) DNA combing |
| Sequence-based reagent | yap-MO | This paper | Morpholinos Gene Tools, LLC | 5’TAGGAGACTGTG PGTCACTTCACC 3’ |
| Sequence-based reagent | rif1-MO | This paper | Morpholinos Gene Tools, LLC | 5’AATCCACAGAA CAGACGACAGCCAT 3’ |
| Sequence-based reagent | Control-MO | This paper | Morpholinos control (Gene Tools Standard Control) Gene Tools, LLC | 5'CCTCTTACCTCA GTTACAATTTATA 3' |
| Recombinant DNA reagent | HLTV-hTRIM21 | Gift from Leo James | RRID: Addgene_104973 doi:10.1038/s41596-018-0028-3 | Protein expression |
| Recombinant DNA reagent | Xenopus rif1 C-Terminal cloned in pET30a vector | Gift from A. Kumagai and W. Dunphy | doi:10.4161/cc.11.6.19636 | Protein expression |
| Recombinant DNA reagent | His-tagged Xenopus Yap cloned in pFastBac1vector | Invitrogen | baculovirus Bac-to-Bac expression system Cat# 10359016 | Protein expression |
Additional files
-
Supplementary file 1
Depletion of Yap increases replication origin firing in Xenopus egg extracts.
Extended DNA combing data to Figure 2 of 2 independent experiments, Replicate 1 and Replicate 2.
- https://cdn.elifesciences.org/articles/75741/elife-75741-supp1-v2.docx
-
Supplementary file 2
Depletion of Rif1 increases replication origin firing in Xenopus egg extracts.
Extended DNA combing data to Figure 4 of 2 independent experiments, Replicate 1 and Replicate 2.
- https://cdn.elifesciences.org/articles/75741/elife-75741-supp2-v2.docx
-
Transparent reporting form
- https://cdn.elifesciences.org/articles/75741/elife-75741-transrepform1-v2.docx
Download links
A two-part list of links to download the article, or parts of the article, in various formats.
Downloads (link to download the article as PDF)
Open citations (links to open the citations from this article in various online reference manager services)
Cite this article (links to download the citations from this article in formats compatible with various reference manager tools)
A non-transcriptional function of Yap regulates the DNA replication program in Xenopus laevis
eLife 11:e75741.
https://doi.org/10.7554/eLife.75741


