Decoding the activated stem cell phenotype of the neonatally maturing pituitary
- Laboratory of Tissue Plasticity in Health and Disease, Cluster of Stem Cell and Developmental Biology, Department of Development and Regeneration, KU Leuven, Belgium
- Laboratory of Morphology, Biomedical Research Institute, Hasselt University, Belgium
- Center for Cancer Biology, VIB, Belgium
- Laboratory for Translational Genetics, Department of Human Genetics, KU Leuven, Belgium
Figures
Figure 1 with 2 supplements

Single-cell transcriptomics of the neonatal maturing pituitary and its activated stem cell compartment.
(A) Left: UMAP plot of neonatal and adult anterior pituitary (AP) combined. Middle: UMAP plot of the annotated cell clusters in the integrated AP samples (i.e., collective single-cell transcriptome datasets from neonatal and adult AP). Somato, somatotropes; Lacto, lactotropes; (Prolif) Cortico, (proliferating) corticotropes; Gonado, gonadotropes; Thyro, thyrotropes; Melano, melanotropes; SC1 and SC2, stem cell clusters 1 and 2; EC, endothelial cells; IC, immune cells; MC, mesenchymal cells; PL, posterior lobe cells; Gonado Prog, gonadotrope progenitor cells; Gonado Prec, gonadotrope precursor cells. Right: Bar plots showing proportions of each cell cluster at both ages. (B) Dot plot displaying percentage of cells (dot size) expressing indicated marker genes with average expression levels (color intensity; see scales on top) in the collective AP samples (i.e., adult and neonatal AP). (C) Top: Heatmap displaying scaled expression of selected epithelial and mesenchymal marker genes in the stem cell clusters SC1, SC2, and Prolif SC of neonatal and adult AP. Bottom: Immunofluorescence staining of CK8/18 (green), VIM (red/green), and SOX2 (red) in neonatal and adult AP. Nuclei are stained with Hoechst33342 (blue). Boxed area is magnified (scale bar, 100 µm).
Figure 1—figure supplement 1
Single-cell transcriptomics of the neonatal maturing pituitary and its activated stem cell compartment.
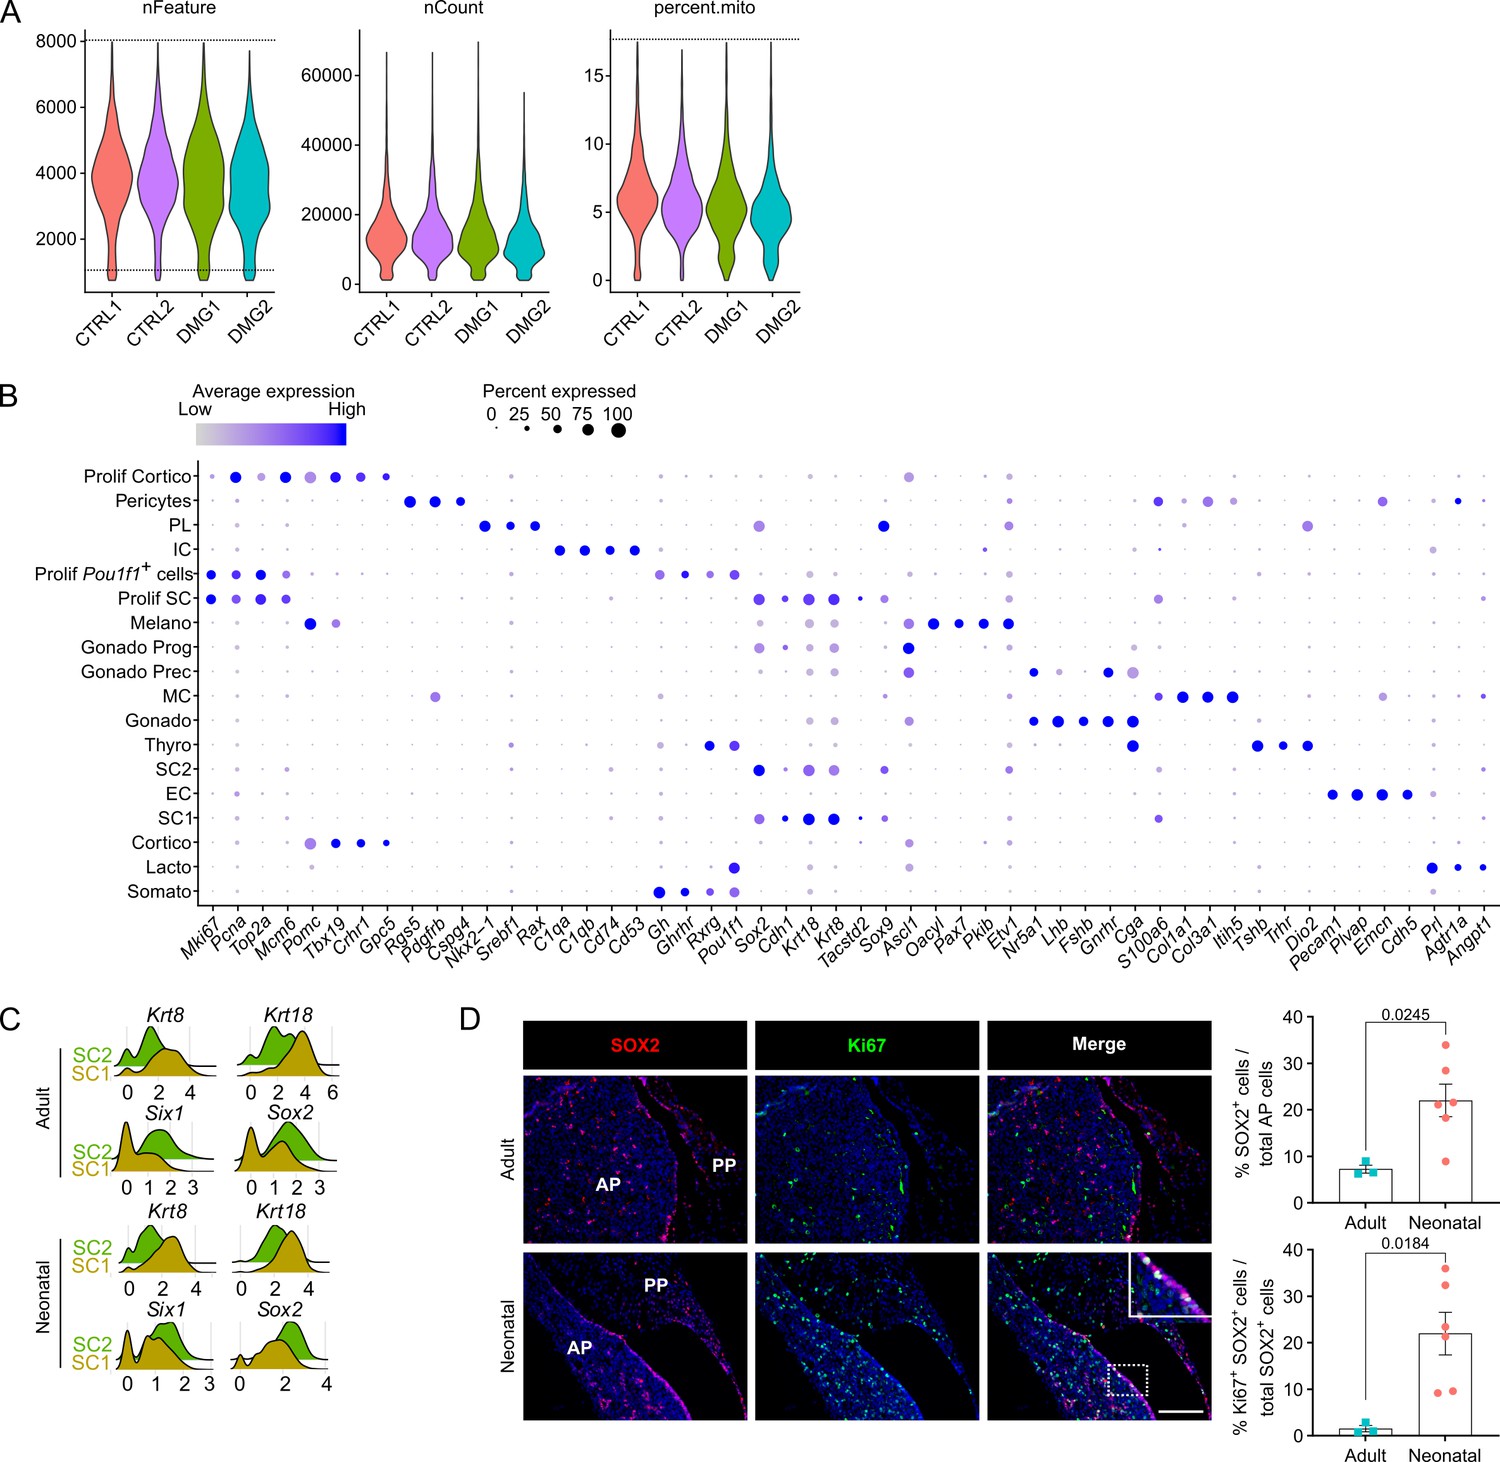
(A) Violin plots showing distribution of number of genes detected per cell (nFeature), total counts per cell (nCount), and percentage of mitochondrial content (percent.mito) per sequenced neonatal anterior pituitary (AP) sample (CTRL, control; DMG, damaged; two biological replicates each). Dashed lines indicate cutoff values for filtering low-quality/dead cells and doublet exclusion, that is removing cells with nFeature below 750 and above 8000 (representing potential doublets) and with percent.mito above 17.5%. (B) Dot plot displaying percentage of cells (dot size) expressing indicated marker genes with average expression levels (color intensity; see scales on top) in the collective AP samples (i.e., adult and neonatal AP). (C) Ridge plot displaying mRNA expression level of indicated genes in SC1 and SC2 of adult and neonatal AP. (D) Left: Immunofluorescence staining of SOX2 (red) and Ki67 (green) in adult and neonatal pituitary (separate channels and merge). Nuclei are stained with Hoechst33342 (blue). Boxed area is magnified (scale bar, 100 μm). Right: Bar graphs showing proportion of SOX2+ cells in adult and neonatal AP, or of SOX2+Ki67+ cells in SOX2+ cell population (mean ± standard error of the mean [SEM]). Data points represent biological replicates (n = 3 for Adult, n = 6 for Neonatal; unpaired t-test).
Figure 1—figure supplement 2
Single-cell transcriptomics of the neonatal maturing pituitary and its activated stem cell compartment.
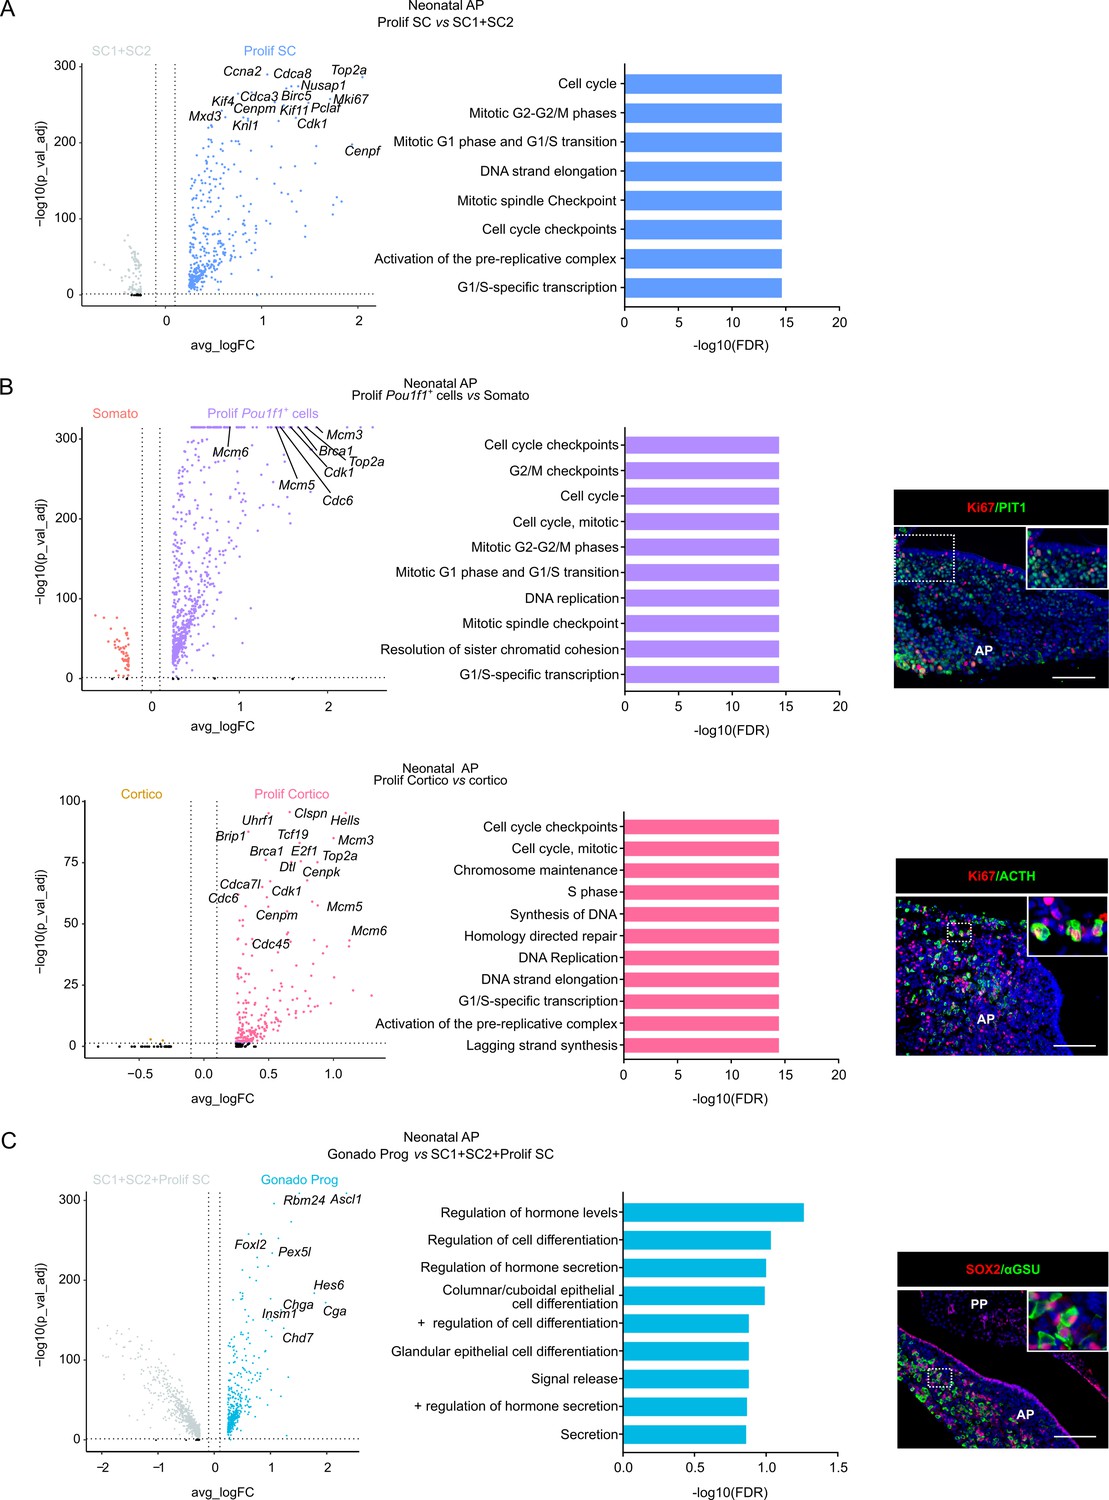
(A) Left: Volcano plot displaying differentially expressed genes (DEGs) in neonatal anterior pituitary (AP). Colored dots represent significantly up- (blue) and down- (gray) regulated genes in Prolif SC versus SC1 and SC2. A selection of cell cycle-associated genes is indicated. Right: DEG-associated Gene Ontology (GO) terms linked with cell cycle processes enriched in Prolif SC versus SC1+SC2 of neonatal AP. (B) Left: Volcano plot displaying DEGs in neonatal AP. Colored dots represent significantly up- (purple, pink) and down- (orange, yellow) regulated genes in Prolif Pou1f1+ cells versus Somato and Prolif Cortico versus Cortico, respectively. A selection of cell cycle-associated genes is indicated. Middle: DEG-associated GO terms linked with cell cycle processes enriched in Prolif Pou1f1+ cells versus Somato or Prolif Cortico versus Cortico, respectively, of neonatal AP. Right: Immunofluorescence staining of Ki67 (red) and PIT1 or ACTH (both green) in neonatal pituitary. Nuclei are labeled with Hoechst33342 (blue). Boxed areas are magnified (scale bar, 100 μm). (C) Left: Volcano plot displaying DEGs in neonatal AP. Colored dots represent significantly up- (blue) and down- (gray) regulated genes in Gonado Prog versus SC1, SC2, and Prolif SC. A selection of endocrine/secretory-associated genes is indicated. Middle: DEG-associated GO terms linked with endocrine/secretory processes enriched in the Gonado Prog versus SC1+SC2 +Prolif SC of neonatal AP. Right: Immunofluorescence staining of SOX2 (red) and αGSU (green) in neonatal pituitary. Nuclei are labeled with Hoechst33342 (blue). Boxed area is magnified (scale bar, 100 μm).
-
Figure 1—figure supplement 2—source data 1
Differentially expressed gene (DEG) and Gene Ontology (GO) analysis in Prolif SC versus SC1+SC2 of neonatal anterior pituitary (AP).
(A) DEG analysis in Prolif SC versus SC1+SC2 of neonatal AP. The columns represent: gene names (Gene), p values (p_val), average log fold change expression (avg_logFC; positive values indicate upregulation and negative values downregulation in Prolif SC), percentage of cells expressing the indicated gene in Prolif SC (pct.1) and in SC1+SC2 (pct.2), and the FDR adjusted p value (p_val_adj). (B) Gene Ontology (GO) analysis of genes upregulated in Prolif SC versus SC1+SC2 in neonatal AP. Analyses were performed using Reactome overrepresentation analysis. Pathway name, number of mapped identifiers that match the pathway (#Entities found), total number of identifiers in the pathway (#Entities total), total entities in the pathway/total number of entities for the entire species (Entities ratio), p value, FDR, and −log10(FDR) are shown in the columns. Associated with Figure 1—figure supplement 2A.
- https://cdn.elifesciences.org/articles/75742/elife-75742-fig1-figsupp2-data1-v2.xlsx
-
Figure 1—figure supplement 2—source data 2
Differentially expressed gene (DEG) and Gene Ontology (GO) analysis in Prolif Pou1f1+ and Prolif Cortico cells versus Somato and Cortico, respectively, of neonatal anterior pituitary (AP).
(A) Differentially expressed gene (DEG) analysis in Prolif Pou1f1+ cells versus Somato of neonatal anterior pituitary (AP). (B) DEG analysis in Prolif Cortico versus Cortico of neonatal AP. The columns represent: gene names (Gene), p values (p_val), average log fold change expression (avg_logFC; positive values indicate upregulation and negative values downregulation in first mentioned cluster), percentage of cells expressing the indicated gene in the first mentioned cluster (pct.1) and in the second mentioned cluster (pct.2), and the FDR adjusted p value (p_val_adj). (C) Gene Ontology (GO) analysis of genes upregulated in Prolif Pou1f1+ cells versus Somato in neonatal AP. (D) GO analysis of genes upregulated in Prolif Cortico versus Cortico in neonatal AP. Analyses were performed using Reactome overrepresentation analysis. Pathway name, number of mapped identifiers that match the pathway (#Entities found), total number of identifiers in the pathway (#Entities total), total entities in the pathway/total number of entities for the entire species (Entities ratio), p value, FDR, and −log10(FDR) are shown in the columns. Associated with Figure 1—figure supplement 2B.
- https://cdn.elifesciences.org/articles/75742/elife-75742-fig1-figsupp2-data2-v2.xlsx
-
Figure 1—figure supplement 2—source data 3
Differentially expressed gene (DEG) and Gene Ontology (GO) analysis in Gonado Prog versus SC1+SC2+Prolif SC of neonatal anterior pituitary (AP).
(A) DEG analysis in Gonado Prog versus SC1+SC2+Prolif SC of neonatal AP. The columns represent: gene names (Gene), p values (p_val), average log fold change expression (avg_logFC; positive values indicate upregulation and negative values downregulation in Gonado Prog), percentage of cells expressing the indicated gene in Gonado Prog (pct.1) and in SC1+SC2+Prolif SC (pct.2), and the FDR adjusted p value (p_val_adj). (B) Gene Ontology (GO) analysis of genes upregulated in Gonado Prog versus SC1+SC2+Prolif SC in neonatal AP. Analysis was performed using Gorilla. Pathway name, p value, FDR q-value, enrichment score [(b/n)/(B/N)], and −log10(FDRq) are shown in the columns. N, total number of genes; B, total number of genes associated with a specific GO term; n, number of genes in the top of the user’s input list or in the target set when appropriate; b, number of genes in the intersection. Associated with Figure 1—figure supplement 2C.
- https://cdn.elifesciences.org/articles/75742/elife-75742-fig1-figsupp2-data3-v2.xlsx
Figure 2 with 3 supplements
Organoids from neonatal pituitary recapitulate its stem cell phenotype.
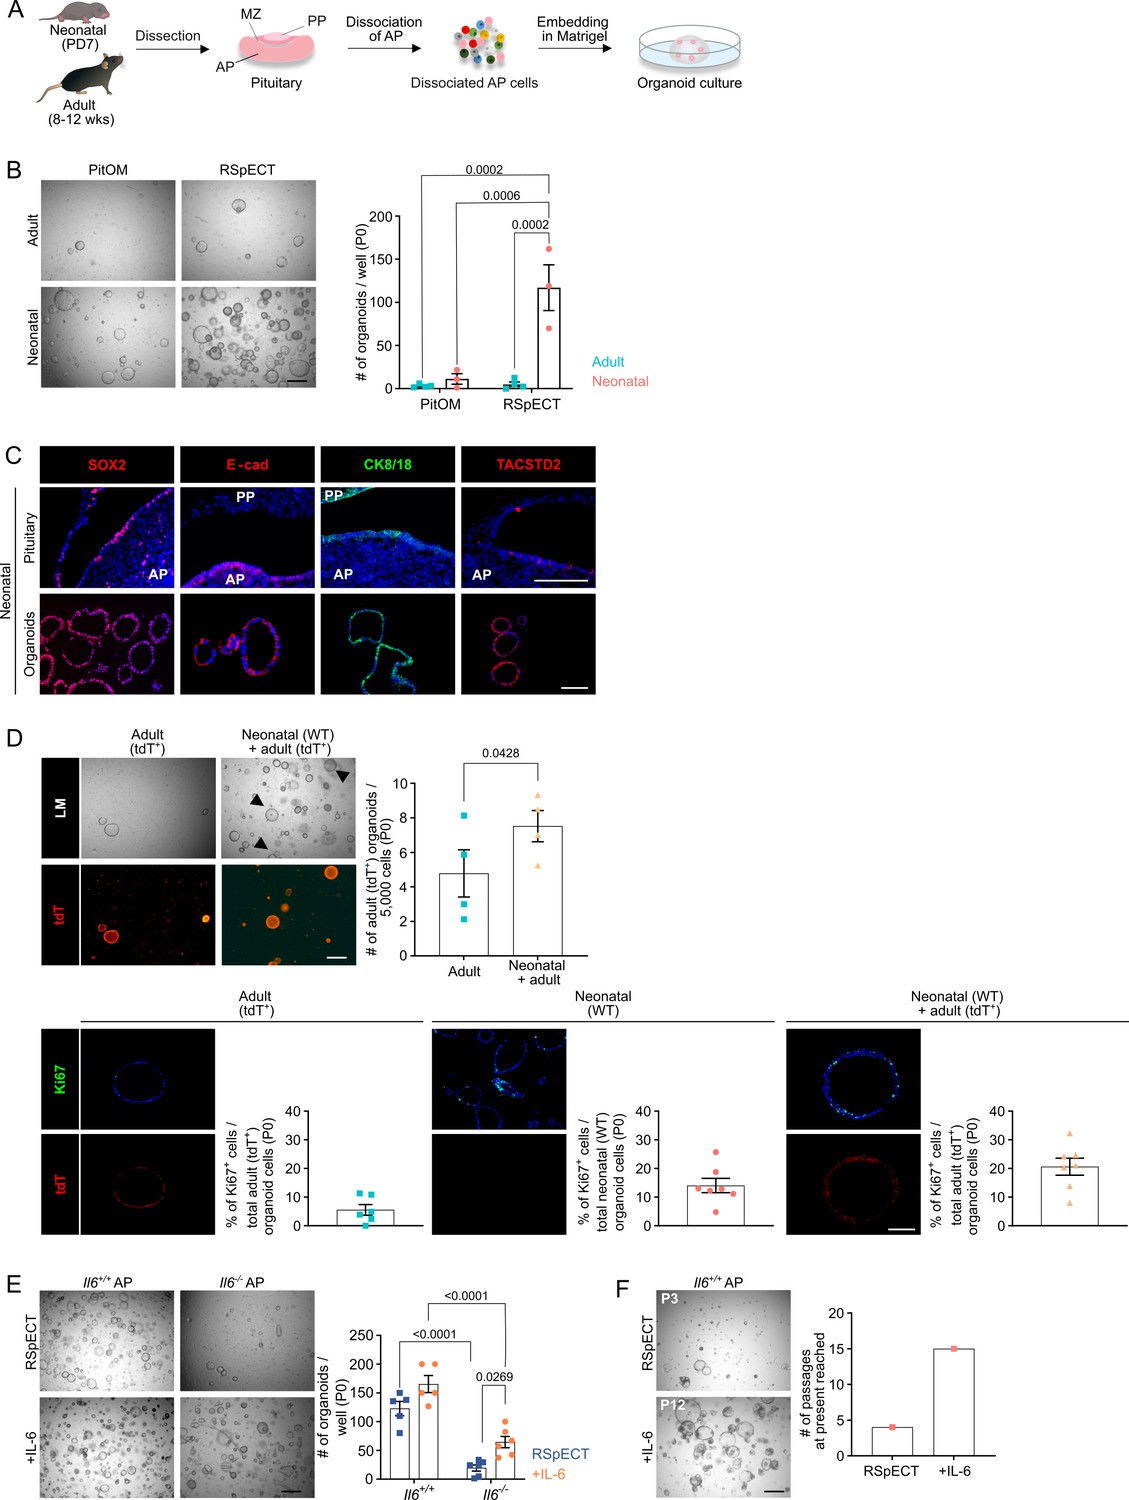
(A) Experimental schematic for organoid culturing. PD, postnatal day; wks, weeks; MZ, marginal zone; PP, posterior pituitary. Mouse icons obtained from BioRender. (B) Organoid formation efficiency (passage 0, P0) from adult and neonatal anterior pituitary (AP) cultured in PitOM or RSpECT medium. Left: Representative brightfield pictures of organoid cultures (scale bar, 500 μm). Right: Bar graph indicating number of organoids developed per well (mean ± standard error of the mean [SEM]). Data points represent biological replicates (n = 4 for Adult, n = 3 for Neonatal; two-way analysis of variance (ANOVA) with Tukey’s multiple comparison test). (C) Immunofluorescence staining of SOX2, E-cadherin (E-cad), TACSTD2 (all red), and CK8/18 (green) in neonatal pituitary and derived organoids. Nuclei are labeled with Hoechst33342 (blue) (scale bar, 100 μm). (D) Organoid formation efficiency (P0) starting from AP cells of adult ROSA26mT/mG (tdTomato+ (tdT)) mice, or from a 1:1 mixture of adult ROSA26mT/mG and neonatal wild type (WT) AP cells (P0). Top left: Light microscopic (LM) and epifluorescence (tdT) pictures. Arrowheads indicate tdT+ organoids (scale bar, 500 µm). Top right: Bar graph indicating number of adult (tdT+) organoids developing per 5000 cells in indicated cultures (mean ± SEM). Data points represent biological replicates (n = 4, paired t-test). Bottom: Immunofluorescence staining of Ki67 (green) and tdT (red) in AP organoids derived from adult ROSA26mT/mG, neonatal WT or a 1:1 mixture of adult ROSA26mT/mG and neonatal WT AP cells. Nuclei are labeled with Hoechst33342 (blue) (scale bar, 100 μm). Bar graphs showing percentage of Ki67+ cells in organoids as indicated (mean ± SEM). Data points represent individual organoids (n = 3). (E) Organoid formation efficiency from AP of neonatal Il6+/+ and Il6−/− mice in RSpECT with or without interleukin-6 (IL-6) (P0). Left: Representative brightfield pictures of organoid cultures (scale bar, 500 μm). Right: Bar plot showing number of organoids developed per well in conditions as indicated (mean ± SEM). Data points represent biological replicates (n = 5 for Il6+/+, n = 6 for Il6−/−; two-way ANOVA with Tukey’s multiple comparison test). (F) Neonatal AP organoid passageability with or without IL-6. Left: Representative brightfield images at indicated passage (scale bar, 500 µm). Right: Bars depicting the passage number reached at the end of this study.
Figure 2—figure supplement 1
Organoids from neonatal pituitary recapitulate its stem cell phenotype.
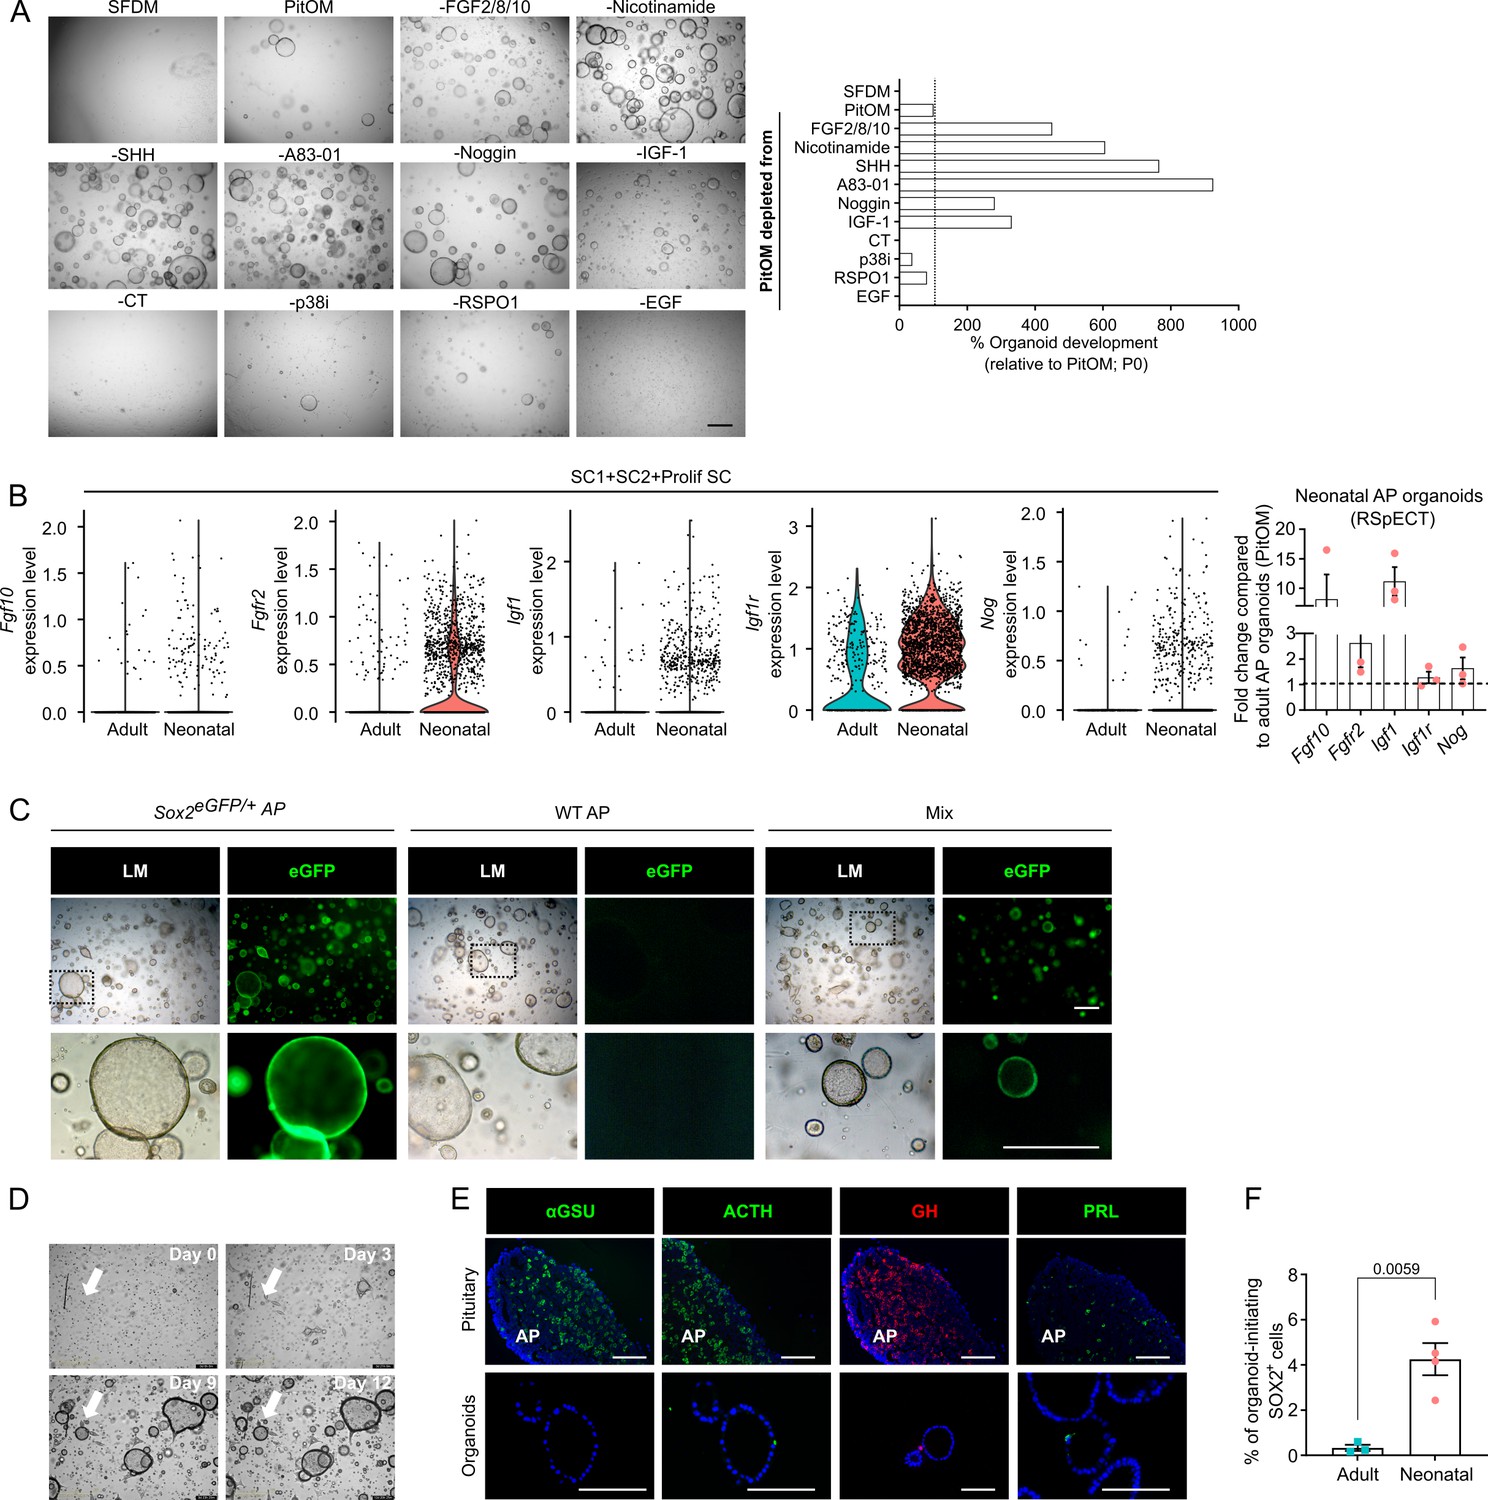
(A) Organoid development from neonatal anterior pituitary (AP) cells in PitOM lacking the indicated factors (P0). Left: Representative brightfield pictures of organoid cultures (scale bar, 500 μm). Right: Bar plot showing percentage organoids developed per well in indicated conditions (relative to PitOM, set as 100% [dashed line]). (B) Left: Violin plots displaying mRNA expression level of indicated genes in adult and neonatal SC clusters (SC1+SC2+Prolif SC) as exposed by single-cell RNA-sequencing (scRNA-seq) analysis. Right: Bar plots depicting relative expression level of indicated genes in neonatal AP organoids (relative to adult AP organoids, set as 1 [dashed line]) (mean ± standard error of the mean [SEM]), grown in RSpECT (P0). Data points represent biological replicates (n = 3). (C) Organoid formation from AP cells of neonatal Sox2eGFP/+ or wildtype (WT) mice, or from a 1:1 mixture (Mix) of neonatal Sox2eGFP/+ and WT AP cells (P0). Light microscopic (LM) and epifluorescence (enhanced green fluorescent protein [eGFP]) images are shown. Boxed areas are magnified in the bottom row (scale bars, 500 µm). (D) Representative, still brightfield images of live time-lapse recordings (Video 1) of neonatal AP organoid formation (P0) using IncuCyte S3 at days indicated. Arrow points to a single structure at consecutive days of culture, starting from an individual cell. (E) Immunofluorescence staining of αGSU, ACTH, PRL (all green), and GH (red) in neonatal pituitary and derived organoids. Nuclei are labeled with Hoechst33342 (blue) (scale bar, 100 μm). (F) Bar graph showing percentage of organoid-initiating SOX2+ cells per well of 10,000 seeded adult or neonatal AP cells (mean ± SEM). Data points represent biological replicates (n = 3 for Adult, n = 4 for Neonatal; unpaired t-test).
Figure 2—figure supplement 2
Organoids from neonatal pituitary recapitulate its stem cell phenotype.
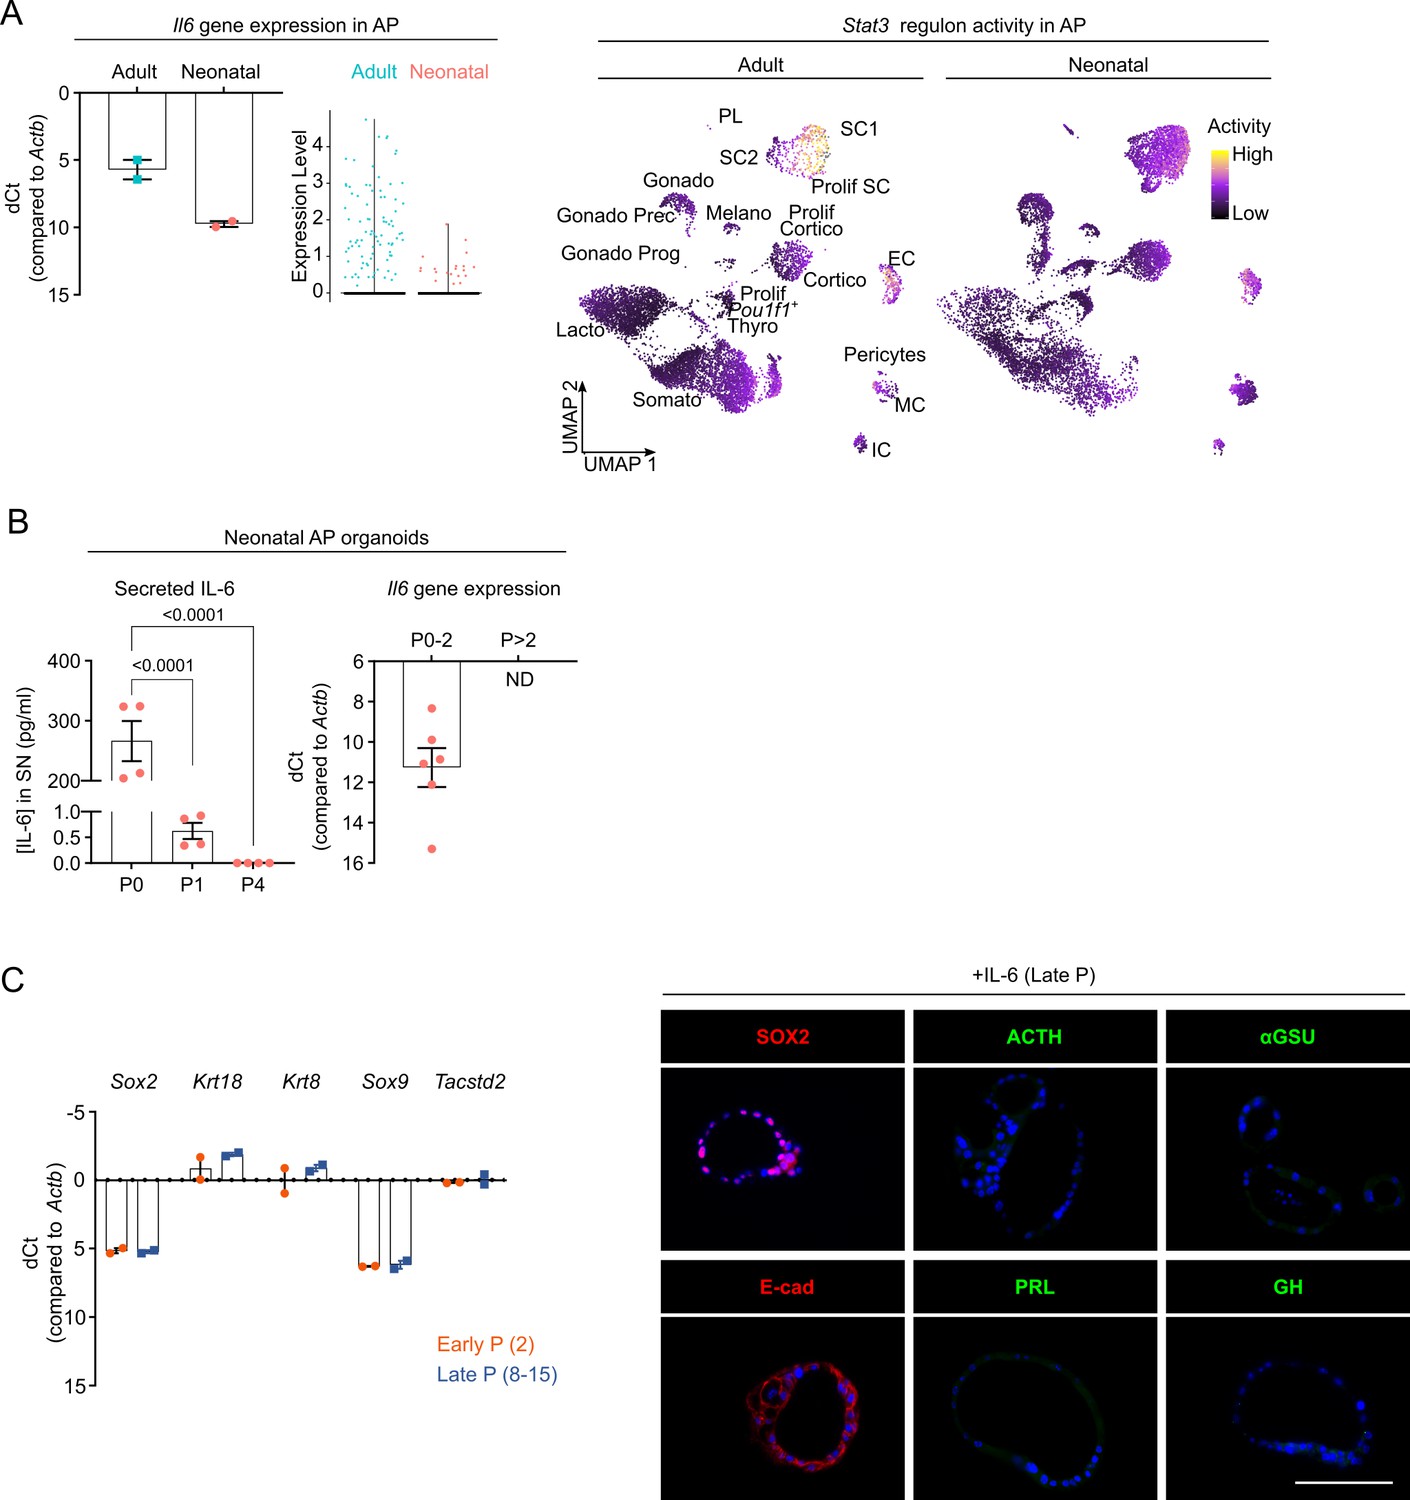
(A) Left: Bar plot depicting relative Il6 gene expression level as determined by RT-qPCR (mean ± standard error of the mean [SEM]). Data points represent biological replicates (n = 2). Middle: Violin plot displaying mRNA expression level of Il6 in adult and neonatal anterior pituitary (AP) as exposed by single-cell RNA-sequencing (scRNA-seq) analysis. Right: Stat3 regulon activity projected on UMAP plot of adult and neonatal AP, with indication of cell clusters. (B) Left: Bar graph displaying interleukin-6 (IL-6) protein levels in supernatant (SN) medium from neonatal AP organoid cultures at indicated passages (mean ± SEM). Data points represent technical replicates (n = 2; one-way analysis of variance (ANOVA) with Dunnett’s multiple comparisons test). Right: Bar plot depicting relative gene expression level of Il6 in neonatal AP organoids at indicated passages (mean ± SEM). Data points represent biological replicates (n = 6). ND, not detectable. (C) Left: Bar graph showing relative gene expression levels of indicated genes in early (P2) and late (P8–15) passage organoids from neonatal AP (mean ± SEM). Data points represent biological replicates (n = 2). Right: Immunofluorescence staining of SOX2 and E-cad (red) and ACTH, αGSU, PRL, and GH (all green) in IL-6-expanded, late passage organoids from neonatal AP. Nuclei are labeled with Hoechst33342 (blue) (scale bar, 100 μm).
Figure 2—figure supplement 3
Organoids from neonatal pituitary recapitulate its stem cell phenotype.
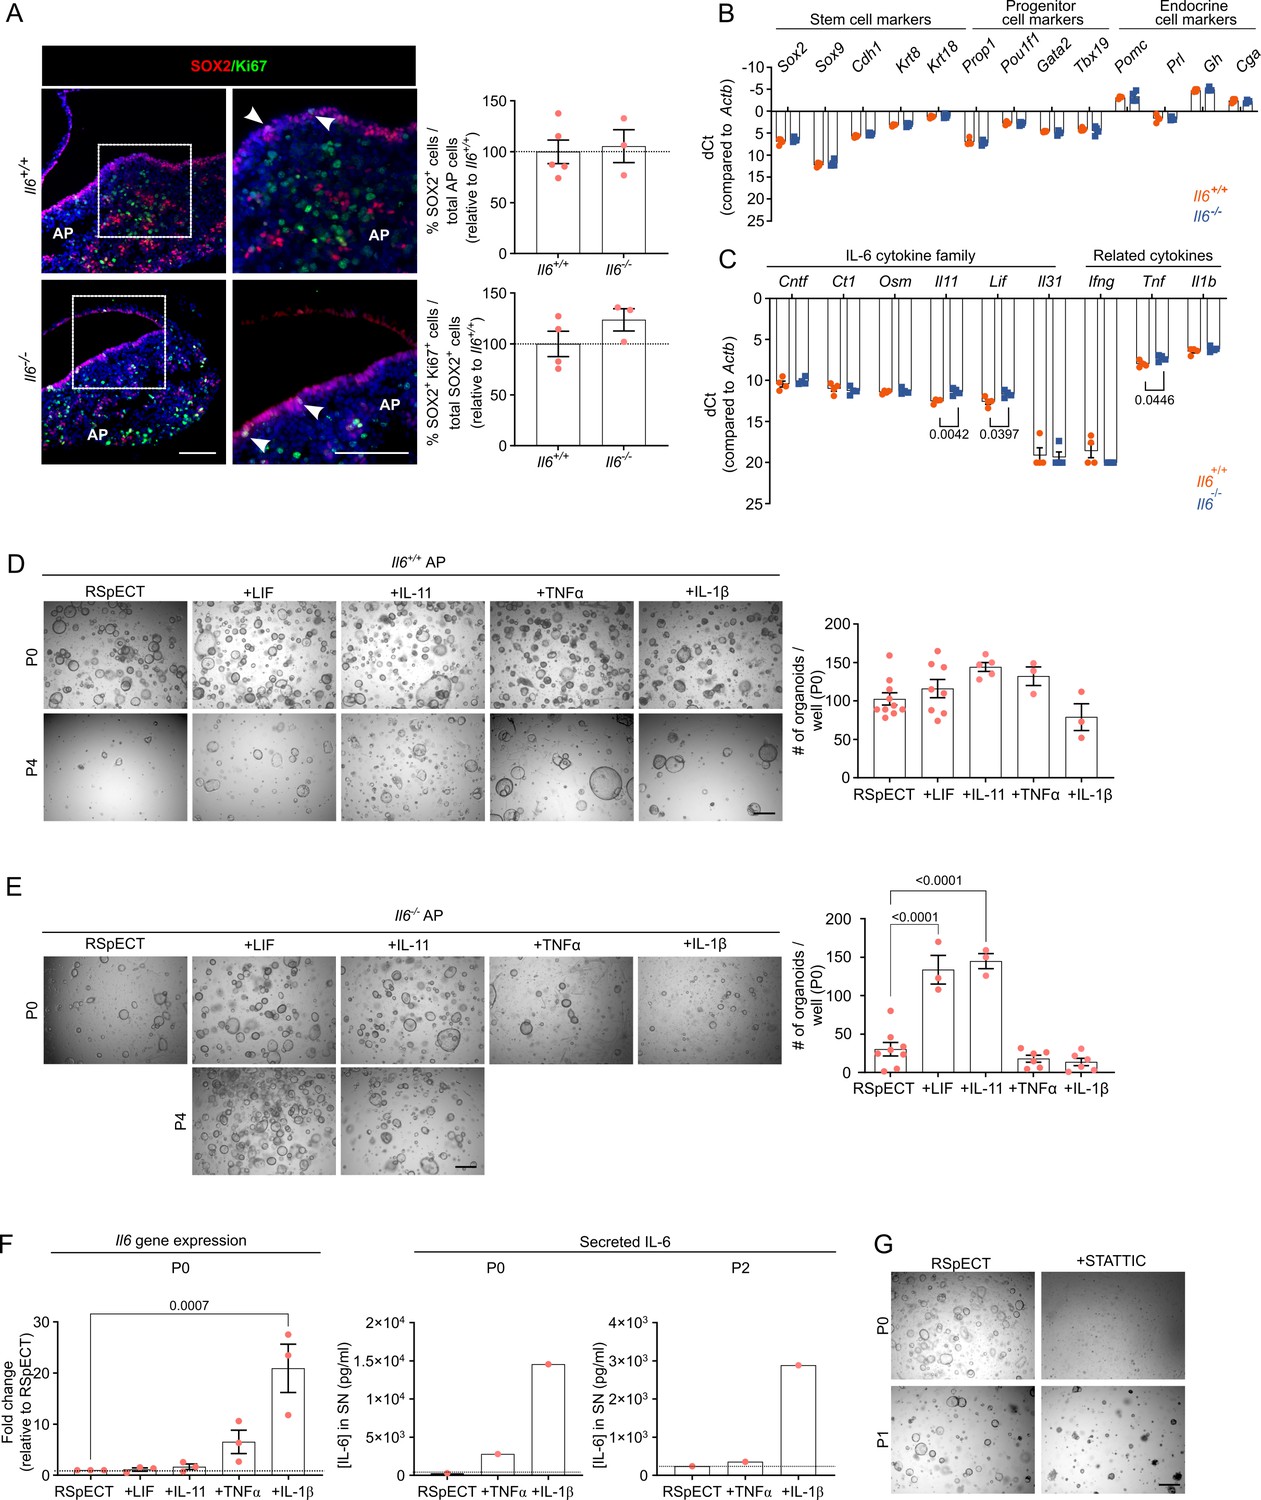
(A) Left: Immunofluorescence staining of SOX2 (red) and Ki67 (green) in Il6+/+ and Il6−/− neonatal pituitary. Nuclei are labeled with Hoechst33342 (blue). Boxed areas are magnified. Arrowheads indicate SOX2+Ki67+ cells (scale bar, 100 μm). Right: Bar graphs showing proportion of SOX2+ cells in Il6−/− neonatal anterior pituitary (AP) and of SOX2+Ki67+ cells in SOX2+ cell population (relative to Il6+/+ AP, set as 100% [dashed line]) (mean ± standard error of the mean [SEM]). Data points represent biological replicates (n = 4–5 for Il6+/+, n = 3 for Il6−/−). (B) Bar graph showing relative gene expression levels of indicated genes in Il6+/+ and Il6−/− neonatal AP (mean ± SEM). Data points represent biological replicates (n = 4). (C) Bar graph showing relative gene expression levels of indicated genes in Il6+/+ and Il6−/− neonatal AP (mean ± SEM). Data points represent biological replicates (n = 4; unpaired t-test). (D) Organoid development and expansion from WT (Il6+/+) neonatal AP cells, cultured and exposed to cytokines as indicated. Left: Representative brightfield pictures of organoid cultures (scale bar, 500 μm). Right: Bar graphs showing number of organoids developed per well under the conditions as indicated (mean ± SEM). Data points represent biological replicates (n = 10 for RSpECT, n = 8 for +LIF, n = 5 for +IL-11, n = 3 for +TNFα and +IL-1β). (E) Organoid development and expansion from Il6−/− neonatal AP cells, cultured and exposed to cytokines as indicated. Left: Representative brightfield pictures of organoid cultures (scale bar, 500 μm). Right: Bar graphs showing number of organoids formed per well under the conditions as indicated (mean ± SEM). Data points represent biological replicates (n = 8 for RSpECT, n = 6 for +TNFα and +IL-1β, n = 3 for +IL-11 and +LIF; one-way analysis of variance (ANOVA) with Dunnett’s multiple comparisons test). (F) Left: Bar graph depicting relative gene expression level of Il6 (relative to expression in RSpECT, set as 1 [dashed line]) (mean ± SEM). Data points represent biological replicates (n = 3; two-way ANOVA with Dunnett’s multiple comparisons test). Right: IL-6 protein level in SN medium (collected 3 days after seeding/passaging) of neonatal AP organoids in indicated passages and culture conditions (mean ± SEM). Data point represents mean of two technical replicates (n = 1). (G) Representative brightfield pictures of organoid cultures from neonatal AP treated with STATTIC, or not (RSpECT), in indicated passages (scale bar, 500 μm).
Figure 3 with 2 supplements
Neonatal pituitary stem cells show a pronounced WNT profile.
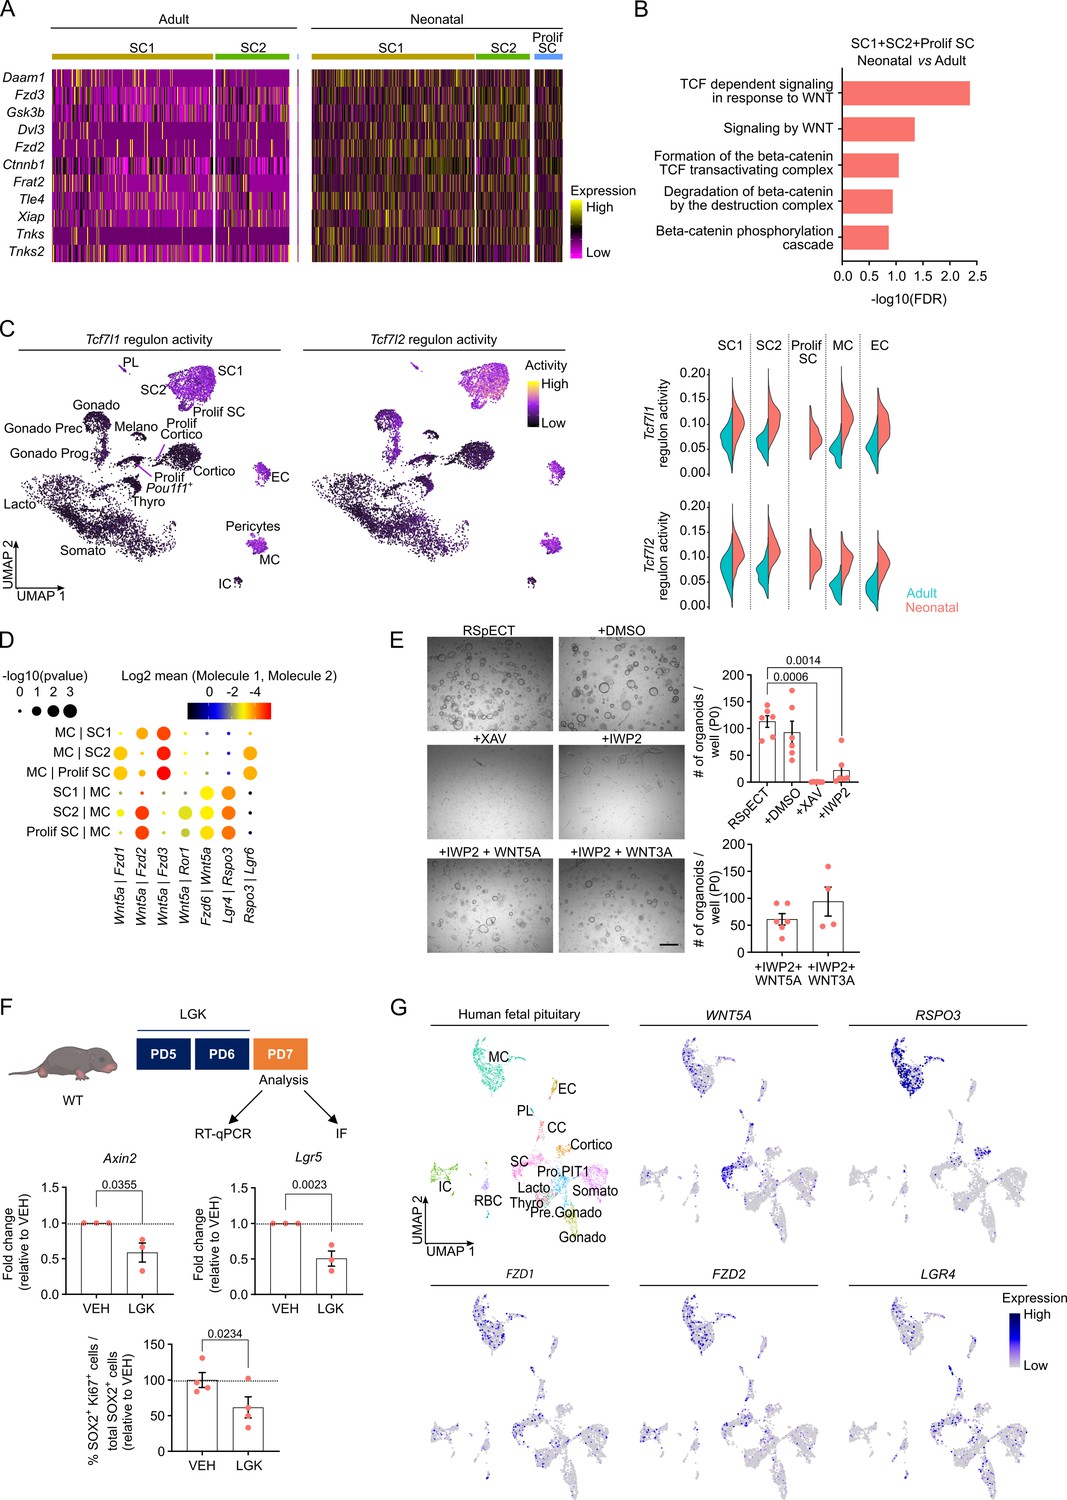
(A) Heatmap displaying scaled expression of selected WNT-associated differentially expressed genes (DEGs) in the stem cell clusters SC1, SC2, and Prolif SC between adult and neonatal anterior pituitary (AP). (B) DEG-associated Gene Ontology (GO) terms linked with WNT signaling enriched in SC1, SC2, and Prolif SC of neonatal versus adult AP. (C) Left: Tcf7l1 and Tcf7l2 regulon activity projected on UMAP plot of neonatal AP, with indication of cell clusters. Right: Violin plots displaying regulon activity of Tcf7l1 and Tcf7l2 in the indicated clusters of adult and neonatal AP. (D) Dot plot displaying selected WNT-associated ligand–receptor interactions revealed by CellPhoneDB in neonatal SC1, SC2, Prolif SC, and MC clusters. p values are indicated by dot size, means of average expression of interacting molecule 1 in cluster 1 and interacting molecule 2 in cluster 2 are specified by color intensity (see scales on top). (E) Organoid development from neonatal AP cells, cultured and exposed to compounds as indicated (P0). Left: Representative brightfield pictures of organoid cultures (scale bar, 500 μm). Right: Bar graphs showing number of organoids formed per well under conditions as indicated (mean ± standard error of the mean [SEM]). Data points represent biological replicates (n = 6; one-way analysis of variance (ANOVA) with Tukey’s multiple comparisons test). (F) Top: Schematic of in vivo treatment schedule and analysis. IF, immunofluorescence. Mouse icon obtained from BioRender. Middle: Bar plots depicting relative expression level of indicated genes in neonatal AP of mice treated as indicated (relative to vehicle [VEH], set as 1 [dashed line]) (mean ± SEM) (n = 3; unpaired t-test). Bottom: Bar graph showing percentage of SOX2+Ki67+ cells in SOX2+ cell population in neonatal AP of mice treated as indicated (relative to VEH, set as 100% [dashed line]) (mean ± SEM). Data points represent biological replicates (n = 4; paired t-test). (G) UMAP plot of the annotated cell clusters in human fetal pituitary (Zhang et al., 2020) and projection of selected WNT-associated genes’ expression. PL, posterior lobe (pituicyte) cells; CC, cell cycle cells; RBC, red blood cells; Pro.PIT1, progenitor cells of PIT1 lineage; Pre.Gonado, precursor cells of gonadotropes.
-
Figure 3—source data 1
Differentially expressed gene (DEG) and Gene Ontology (GO) analysis in SC1+SC2+Prolif SC of neonatal versus adult anterior pituitary (AP).
(A) DEG analysis in SC1+SC2+Prolif SC of neonatal versus adult AP. The columns represent: gene names (Gene), p values (p_val), average log fold change expression (avg_logFC; positive values indicate upregulation and negative values downregulation in neonatal), percentage of cells expressing the indicated gene in neonatal (pct.1) and in adult (pct.2), and the FDR adjusted p value (p_val_adj). (B) Gene Ontology (GO) analysis of genes upregulated in neonatal versus adult SC1+SC2+Prolif SC. Analyses were performed using Reactome overrepresentation analysis. Pathway name, number of mapped identifiers that match the pathway (#Entities found), total number of identifiers in the pathway (#Entities total), total entities in the pathway/total number of entities for the entire species (Entities ratio), p value, FDR, and −log10(FDR) are shown in the columns. Associated with Figure 3A, B.
- https://cdn.elifesciences.org/articles/75742/elife-75742-fig3-data1-v2.xlsx
Figure 3—figure supplement 1
Neonatal pituitary stem cells show a pronounced WNT profile.
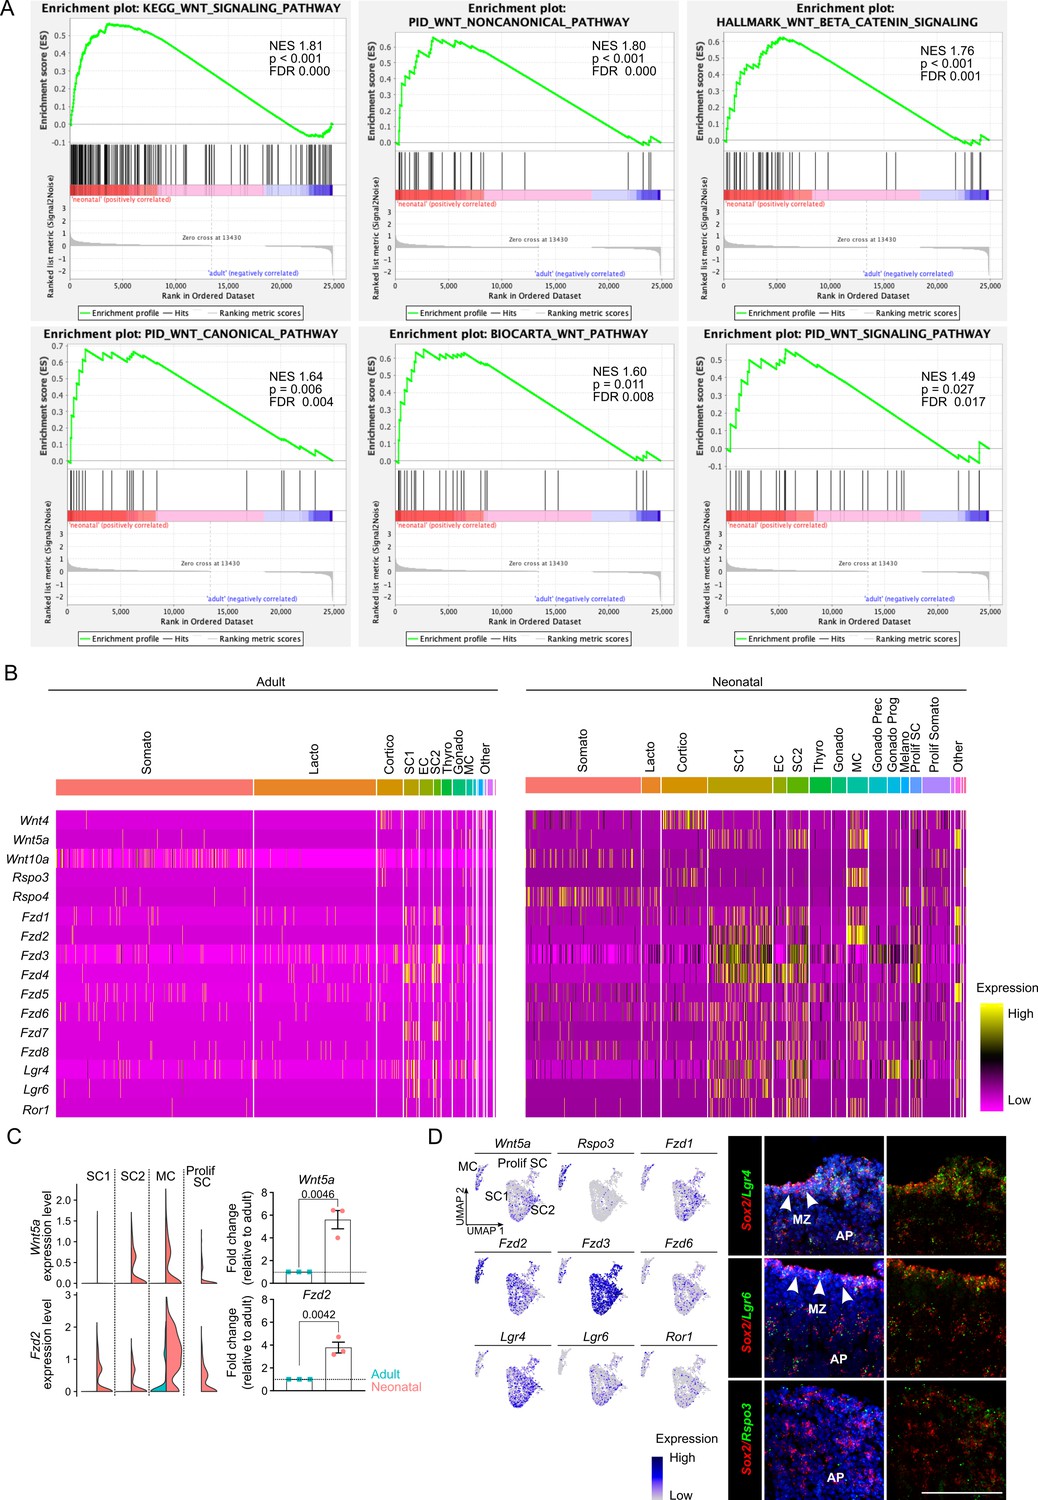
(A) Differentially expressed gene (DEG)-based GSEA plots of indicated WNT-related hallmarks in neonatal versus adult stem cell clusters (SC1, SC2, and Prolif SC). Normalized enrichment score (NES), and p and FDR values are listed. (B) Heatmaps displaying scaled expression of several WNT ligand and receptor genes in adult and neonatal anterior pituitary (AP). (C) Left: Violin plots displaying mRNA expression level of indicated genes in SC1, SC2, MC, and Prolif SC of adult and neonatal AP. Right: Bar graphs displaying relative gene expression of indicated genes in neonatal AP, as determined by RT-qPCR (relative to expression in adult AP, set as 1 [dashed line]) (mean ± standard error of the mean [SEM]). Data points represent biological replicates (n = 3; unpaired t-test). (D) Left: Projection on UMAP plot of selected WNT-associated genes’ expression in neonatal stem cell (SC1, SC2, and Prolif SC) and MC clusters, with indication of cell clusters. Right: RNAscope in situ hybridization analysis of neonatal pituitary for Sox2 (red), Lgr4, Lgr6, and Rspo3 (all green). Nuclei are stained with DAPI (blue). Arrowheads indicate the marginal zone (MZ) (scale bar, 100 μm).
Figure 3—figure supplement 2
Neonatal pituitary stem cells show a pronounced WNT profile.
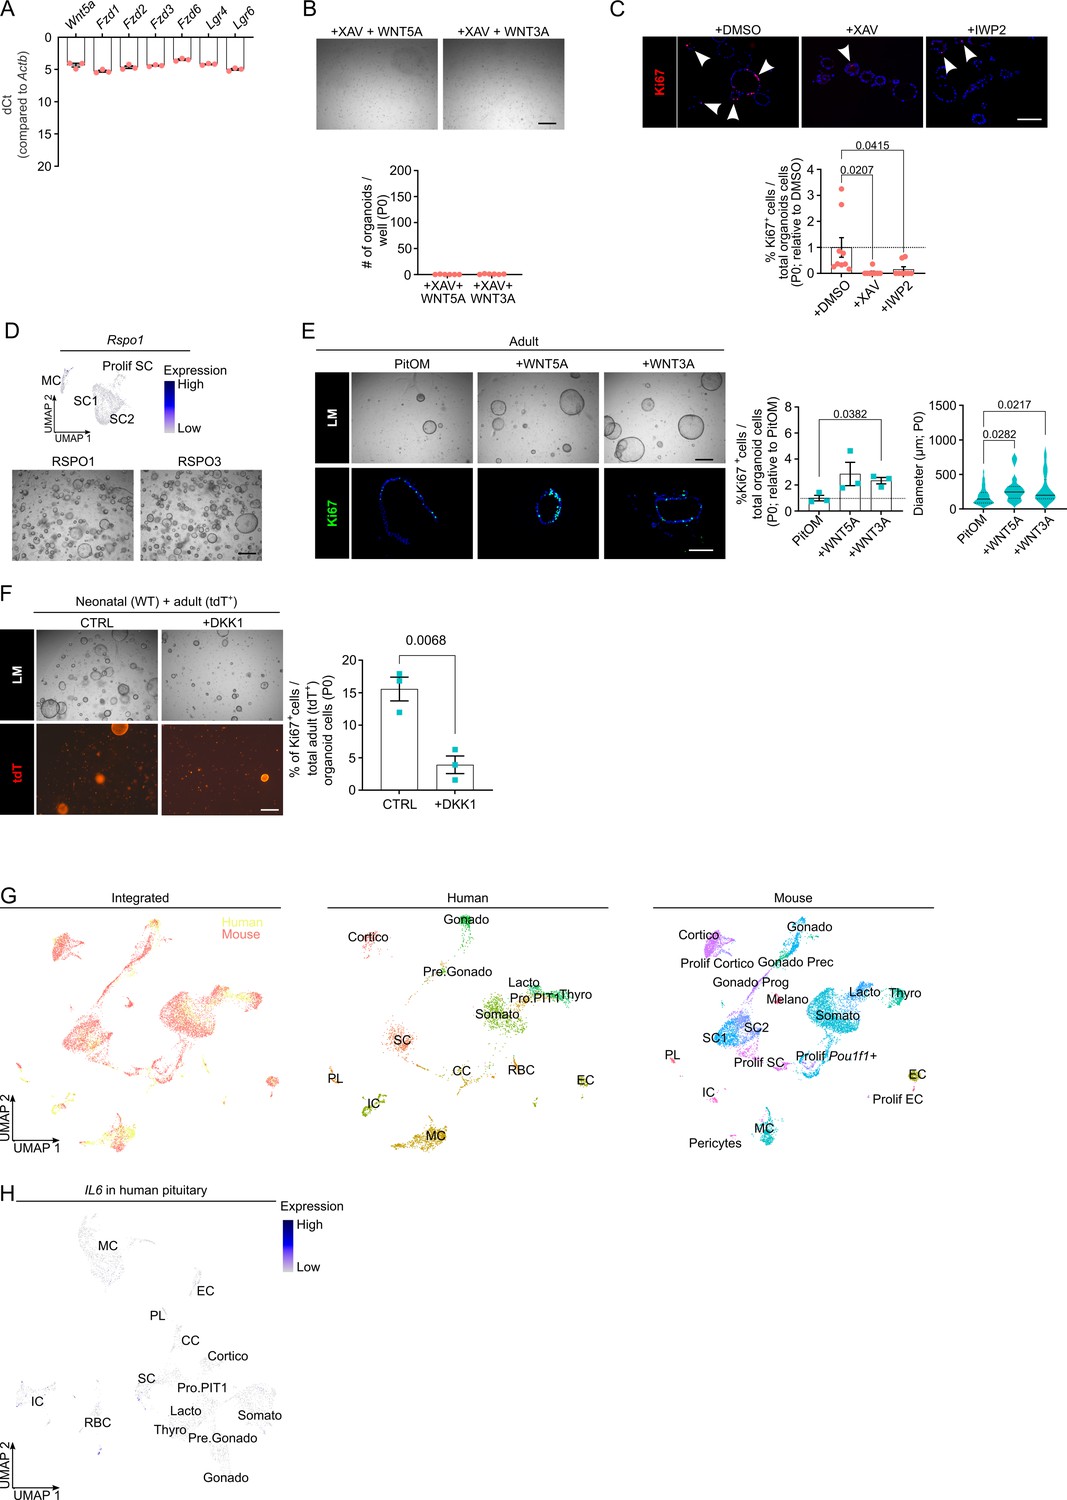
(A) Bar graph displaying relative gene expression level of indicated genes in neonatal anterior pituitary (AP)-derived organoids (mean ± standard error of the mean [SEM]). Data points represent biological replicates ( = 3). (B) Organoid development from neonatal AP cells, cultured and exposed to WNT ligands as indicated (P0). Top: Representative brightfield pictures of organoid cultures (scale bar, 500 μm). Bottom: Bar graph showing number of organoids formed under conditions as indicated (mean ± SEM). Data points represent biological replicates (n = 6). (C) Top: Immunofluorescence staining of Ki67 (red) in neonatal AP organoids formed under conditions as indicated (P0). Nuclei are stained with Hoechst33342 (blue). Arrowheads indicate Ki67+ cells (scale bar, 100 µm). Bottom: Bar graphs showing percentage of Ki67+ cells in organoids as indicated (relative to DMSO, set as 1 [dashed line]) (mean ± SEM). Data points represent individual organoids (n = 3; one-way analysis of variance [ANOVA] with Dunnett’s multiple comparisons test). (D) Top: Projection on UMAP plot of Rspo1 gene expression in neonatal stem cell (SC1, SC2, and Prolif SC) and MC clusters, with indication of cell clusters. Bottom: Organoid development from neonatal AP cells formed in standard RSpECT medium (with RSPO1) or RSpECT medium in which RSPO1 was replaced with RSPO3 (P0). Representative brightfield images are shown (scale bar, 500 μm). (E) Organoid development from adult AP cells formed under conditions as indicated (P0). Top left: Representative brightfield pictures of organoid cultures (scale bar, 500 μm). Bottom left: Immunofluorescence staining of Ki67 (green) in adult AP organoids, formed under conditions as indicated. Nuclei are stained with Hoechst33342 (blue) (scale bar, 100 µm). Middle: Bar graph showing percentage of Ki67+ cells in organoids as indicated (relative to PitOM, set as 1 [dashed line]) (mean ± SEM). Right: Violin plot showing diameter of organoids developed in conditions as indicated. Data points represent biological replicates (n = 3; one-way ANOVA with Dunnett’s multiple comparisons test). (F) Left: Representative brightfield and epifluorescence images of neonatal (WT) + adult (tdT+) AP organoid co-culture, in the indicated conditions. Scale bar, 500 µm. Right: Bar graph showing percentage of Ki67+ cells in adult (tdT+) organoids, in indicated conditions (mean ± SEM). Data points represent individual organoids (n = 3; unpaired t-test). (G) Left: UMAP plot of fetal human and neonatal mouse AP combined. Middle and right: UMAP plot of annotated cell clusters in human and mouse AP, respectively. Somato, somatotropes; Lacto, lactotropes; Cortico, corticotropes; Gonado, gonadotropes; Thyro, thyrotropes; Melano, melanotropes; SC1 and SC2, stem cell clusters 1 and 2; EC, endothelial cells; IC, immune cells; CT, connective tissue cells; PL, posterior lobe (pituicyte) cells; Gonado Prog, gonado progenitor cells; Gonado Prec, gonadotrope precursor cells; CC, cell cycle cells; RBC, red blood cells; Pro.PIT1, progenitor cells of PIT1 lineage; Pre.Gonado, precursor cells of gonadotropes. (H) Projection of Il6 gene expression on human fetal pituitary UMAP plot, with indication of cell clusters.
Figure 4 with 2 supplements
Neonatal pituitary’s reaction to local damage and efficient regeneration.
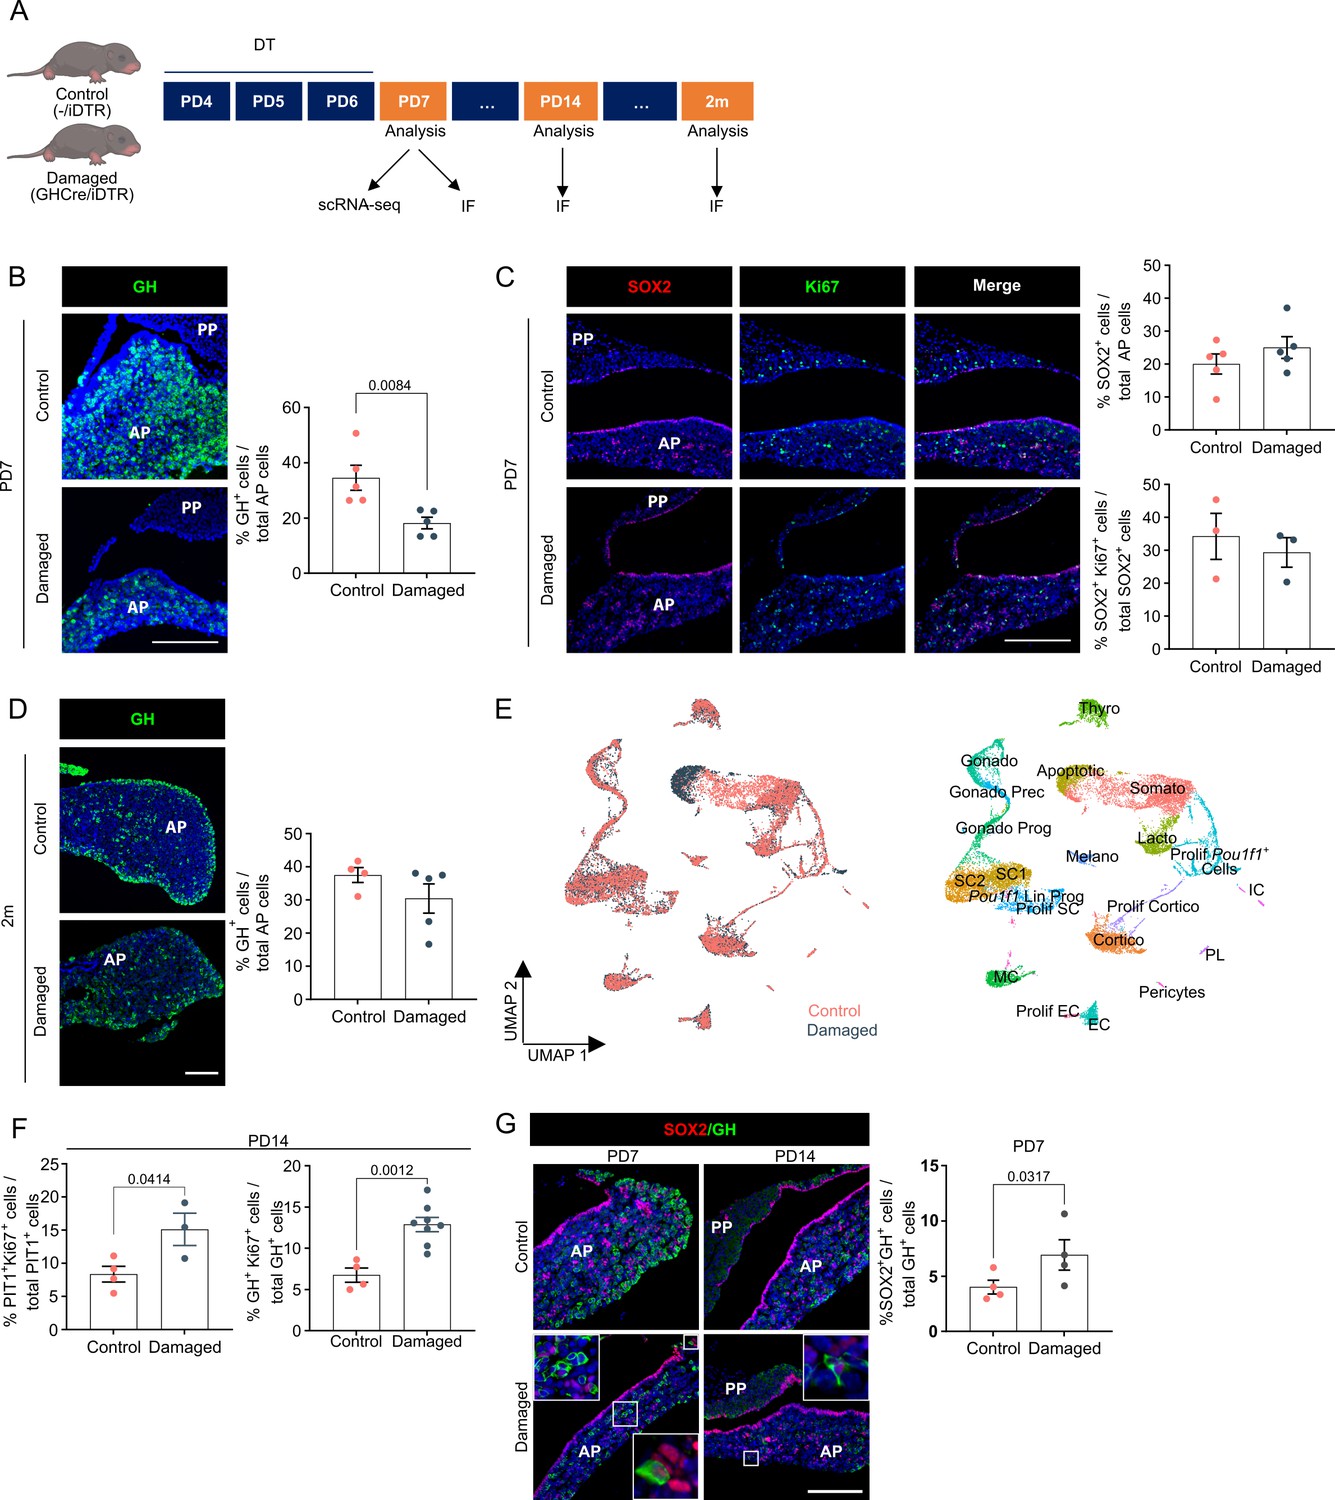
(A) Schematic of in vivo treatment schedule and analysis. DT, diphtheria toxin; m, months. Mouse icons obtained from BioRender. (B) Ablation of somatotropes (GH+ cells) in neonatal mouse anterior pituitary (AP). Left: Immunofluorescence staining of GH (green) in control and damaged pituitary following DT injection (PD7). Nuclei are labeled with Hoechst33342 (blue) (scale bar, 100 μm). Right: Bar graph showing proportion of GH+ cells in AP as indicated (mean ± standard error of the mean [SEM]). Data points represent biological replicates (n = 5; paired t-test). (C) SOX2+ stem cell reaction to damage. Left: Immunofluorescence staining of SOX2 (red) and Ki67 (green) in control and damaged pituitary following DT injection (PD7). Nuclei are labeled with Hoechst33342 (blue) (scale bar, 100 μm). Right: Bar graphs showing proportion of SOX2+ cells in AP as indicated, or of SOX2+Ki67+ cells in SOX2+ cell population (mean ± SEM). Data points represent biological replicates (n = 5 for % SOX2+ cells, n = 3 for % SOX2+Ki67+ cells). (D) Regeneration of somatotropes in neonatal mouse AP after their ablation. Left: Immunofluorescence staining of GH (green) in control and damaged pituitary 2 months after DT-induced ablation. Nuclei are labeled with Hoechst33342 (blue) (scale bar, 100 μm). Right: Bar graph showing proportion of GH+ cells in AP as indicated (mean ± SEM). Data points represent biological replicates (n = 4 for Control, n = 5 for Damaged). (E) Left: UMAP plot of control and damaged neonatal AP combined. Right: UMAP plot of annotated cell clusters in the integrated neonatal AP samples (i.e., collective single-cell transcriptome datasets from control and damaged AP). (F) Bar plots depicting proportion of PIT1+Ki67+ or GH+Ki67+ cells in PIT1+ or GH+ cell population, respectively, 1 week after DT-induced damage (PD14) (mean ± SEM). Data points represent biological replicates (n = 4 for Control, n = 3–8 for Damaged; unpaired t-test). (G) Left: Immunofluorescence staining of SOX2 (red) and GH (green) in control and damaged neonatal pituitary at indicated timepoints (PD7 and PD14) following DT-induced injury. Nuclei are stained with Hoechst33342 (blue). Boxed areas are magnified (scale bar, 100 µm). Right: Bar graph showing proportion of SOX2+GH+ cells in GH+ cell population following DT-induced damage (PD7) (mean ± SEM). Data points represent biological replicates (n = 4; paired t-test).
Figure 4—figure supplement 1
Neonatal pituitary’s reaction to local damage and efficient regeneration.
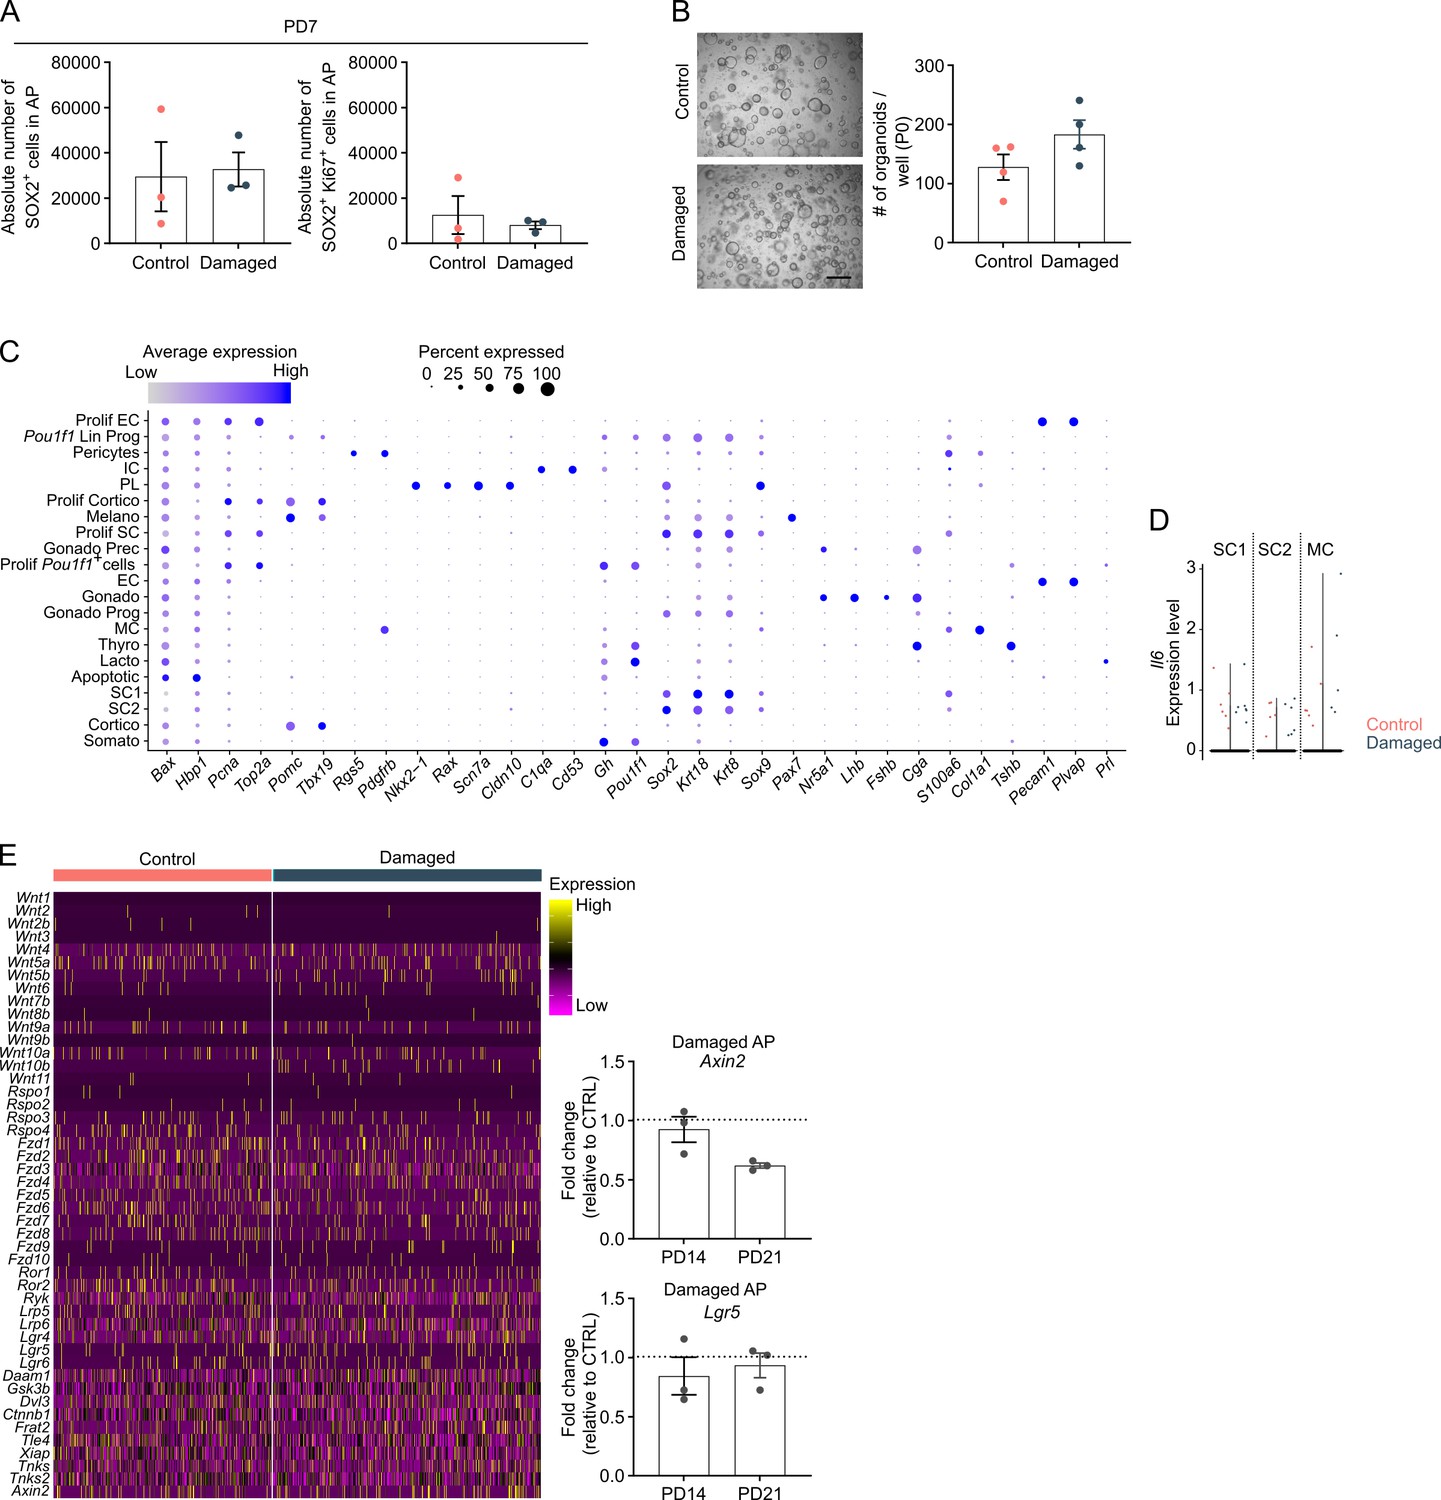
(A) Bar graphs showing absolute number of SOX2+ cells in anterior pituitary (AP) as indicated, or of SOX2+Ki67+ cells in SOX2+ cell population following DT injection (PD7) (mean ± standard error of the mean [SEM]). Data points represent biological replicates (n = 3). (B) Organoid development from control and damaged neonatal AP (P0). Left: Representative brightfield pictures of organoid cultures (scale bar, 500 μm). Right: Bar graph showing number of organoids formed per well (mean ± SEM). Data points represent biological replicates (n = 4). (C) Dot plot displaying percentage of cells (dot size) expressing indicated marker genes with average expression levels (color intensity; see scales on top) in the collective neonatal AP samples (i.e., control and damaged neonatal AP). (D) Violin plots displaying mRNA expression level of Il6 in SC1, SC2, and MC of control and damaged neonatal AP. (E) Left: Heatmap displaying scaled expression of selected WNT-associated genes in control and damaged neonatal AP. Right: Bar plots depicting relative expression level of indicated genes in neonatal damaged AP, at indicated timepoints (PD14 and PD21) (relative to control [CTRL], set as 1 [dashed line]) (mean ± SEM) (n = 3).
Figure 4—figure supplement 2
Neonatal pituitary’s reaction to local damage and efficient regeneration.
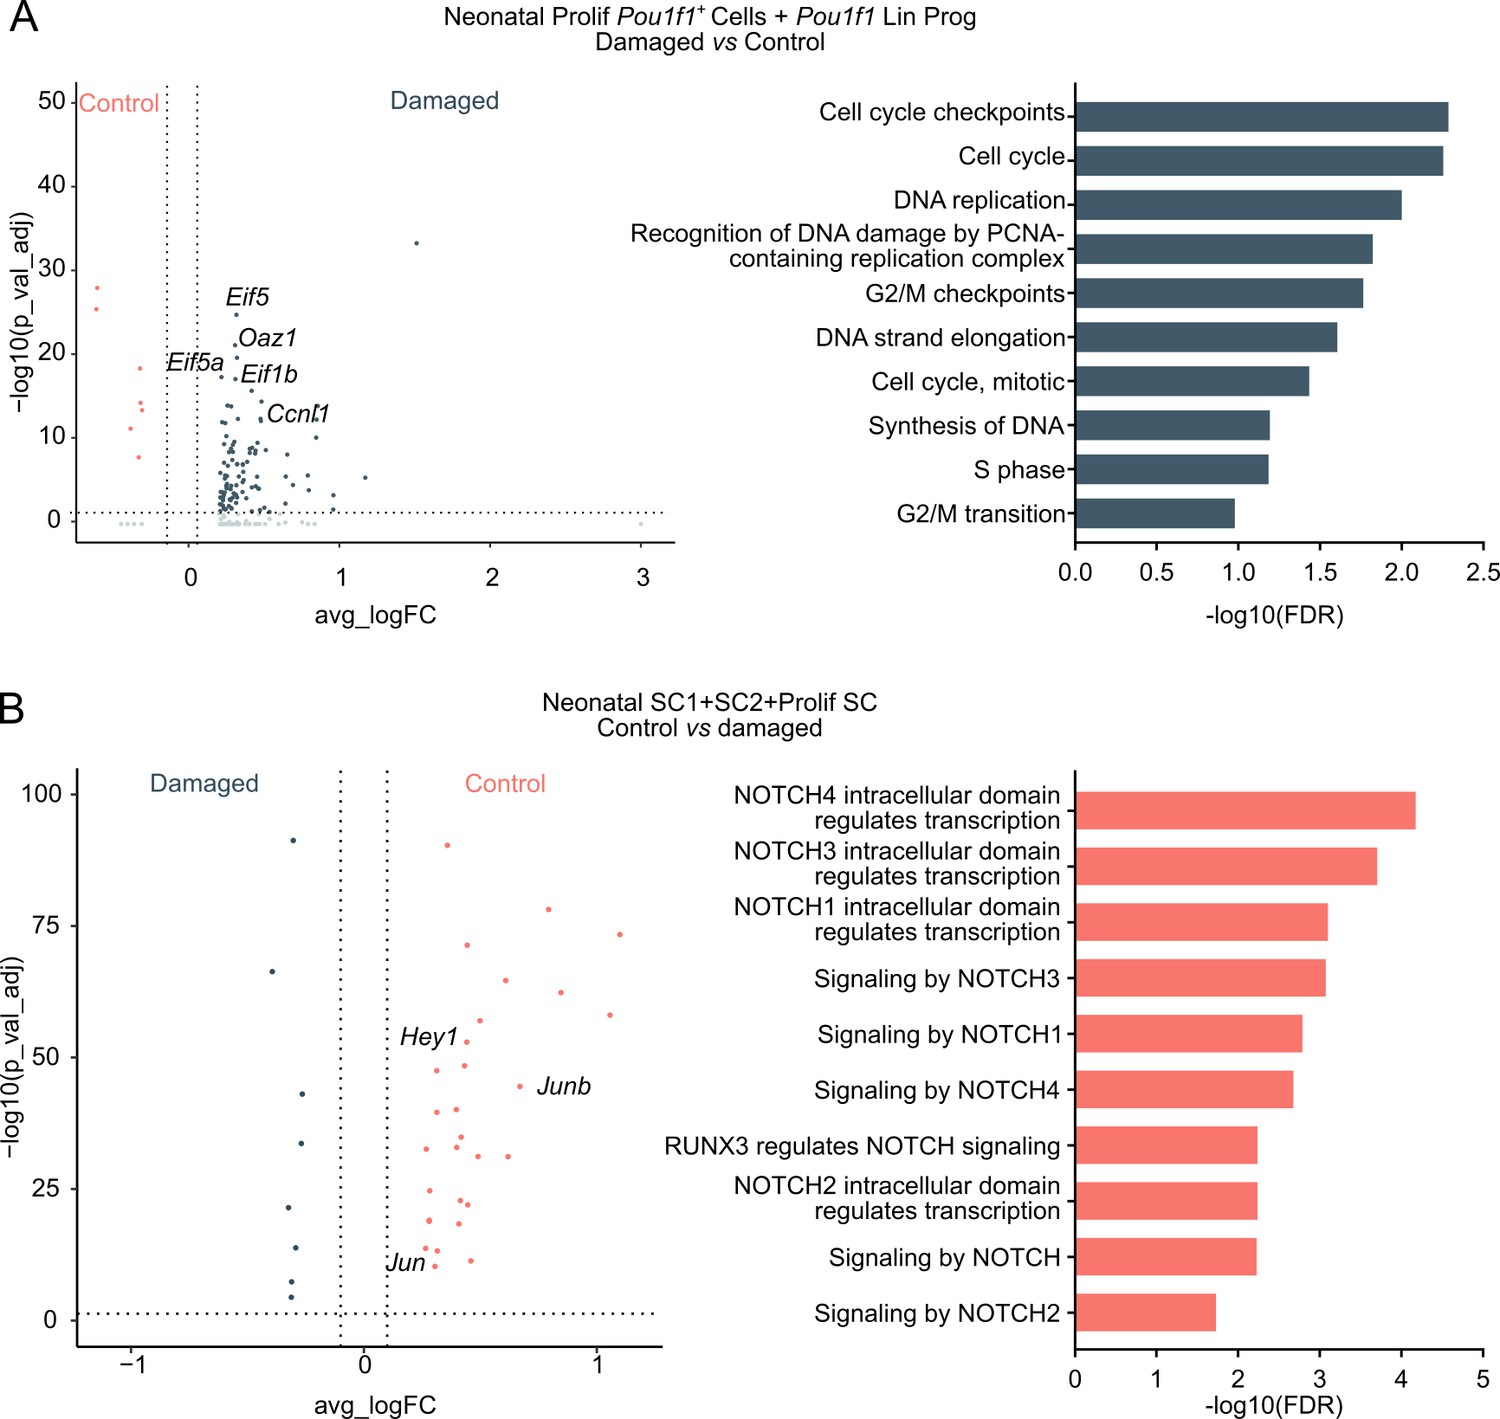
(A) Left: Volcano plot displaying differentially expressed genes (DEGs) in Prolif Pou1f1+ cells and Pou1f1 Lin Prog clusters from neonatal damaged and control anterior pituitary (AP). Colored dots represent significantly up- (gray) or down- (orange) regulated genes in damaged versus control AP. A selection of cell cycle-associated genes is indicated. Right: DEG-associated Gene Ontology (GO) terms linked with cell cycle processes enriched in Prolif Pou1f1+ cells and Pou1f1 Lin Prog clusters in neonatal damaged versus control AP. (B) Left: Volcano plot displaying DEGs in SC1, SC2, and Prolif SC clusters from neonatal damaged and control AP. Colored dots represent significantly up- (orange) and down- (gray) regulated genes in control versus damaged AP. A selection of NOTCH-associated genes is indicated. Right: DEG-associated GO terms linked with NOTCH signaling enriched in SC1, SC2, and Prolif SC of neonatal control versus damaged AP.
-
Figure 4—figure supplement 2—source data 1
Differentially expressed gene (DEG) and Gene Ontology (GO) analysis in Prolif Pou1f1+ cells + Pou1f1 Lin Prog of damaged versus control neonatal anterior pituitary (AP).
(A) DEG analysis in Prolif Pou1f1+ cells + Pou1f1 Lin Prog of damaged versus control neonatal AP. The columns represent: gene names (Gene), p values (p_val), average log fold change expression (avg_logFC; positive values indicate upregulation and negative values downregulation in damaged), percentage of cells expressing the indicated gene in damaged (pct.1) and in the control (pct.2), and the FDR adjusted p value (p_val_adj). (B) Gene Ontology (GO) analysis of genes upregulated in neonatal damaged versus control Prolif Pou1f1+ cells + Pou1f1 Lin Prog. Analyses were performed using Reactome overrepresentation analysis. Pathway name, number of mapped identifiers that match the pathway (#Entities found), total number of identifiers in the pathway (#Entities total), total entities in the pathway/total number of entities for the entire species (Entities ratio), p value, FDR, and −log10(FDR) are shown in the columns. Associated with Figure 4—figure supplement 2A.
- https://cdn.elifesciences.org/articles/75742/elife-75742-fig4-figsupp2-data1-v2.xlsx
-
Figure 4—figure supplement 2—source data 2
Differentially expressed gene (DEG) and Gene Ontology (GO) analysis in SC1+SC2+Prolif SC of control versus damaged neonatal anterior pituitary (AP).
(A) DEG analysis in SC1+SC2+Prolif SC of control versus damaged neonatal AP The columns represent: gene names (Gene), p values (p_val), average log fold change expression (avg_logFC; positive values indicate upregulation and negative values downregulation in control), percentage of cells expressing the indicated gene in control (pct.1) and in damaged (pct.2), and the FDR adjusted p value (p_val_adj). (B) Gene Ontology (GO) analysis of genes upregulated in neonatal control versus damaged SC1+SC2+Prolif SC. Analyses were performed using Reactome overrepresentation analysis. Pathway name, number of mapped identifiers that match the pathway (#Entities found), total number of identifiers in the pathway (#Entities total), total entities in the pathway/total number of entities for the entire species (Entities ratio), p value, FDR, and −log10(FDR) are shown in the columns. Associated with Figure 4—figure supplement 2B.
- https://cdn.elifesciences.org/articles/75742/elife-75742-fig4-figsupp2-data2-v2.xlsx
Author response image 1
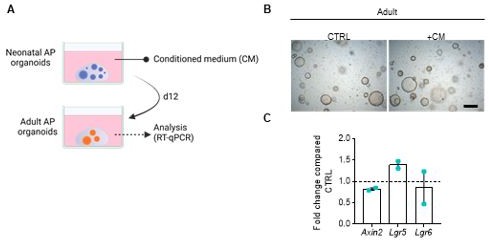
(A) Schematic overview of the organoid CM experiment. (B) Representative brightfield images of adult AP organoids exposed to CM or not (CTRL). Scale bar, 500 µm. (C) Gene expression analysis for main WNT target genes in adult AP organoids exposed to CM, compared to CTRL, set as 1 (dashed line). Bars represent mean ± SD (n=2).
Author response image 2

FS cell markers from (Ho et al., 2020).
These markers are mainly found in the MC population of mouse and human pituitary (and in the pericytes). Col3a1, Itih5 and Col1a1 were also identified and used in (Cheung et al., 2018) and (Vennekens et al., 2021) to annotate the CT cluster (thus, the MC cluster in our paper, see Figure 1 —figure supplement 1B).
Author response image 3

FS cell markers from (Fletcher et al., 2022) (rat pituitary).
These markers are mainly found in the neonatal AP stem cell and progenitor cell populations. As these markers are also present in many other cell clusters (as also apparent in the human fetal pituitary data), they do not seem to be highly specific for FS cells.
Author response image 4
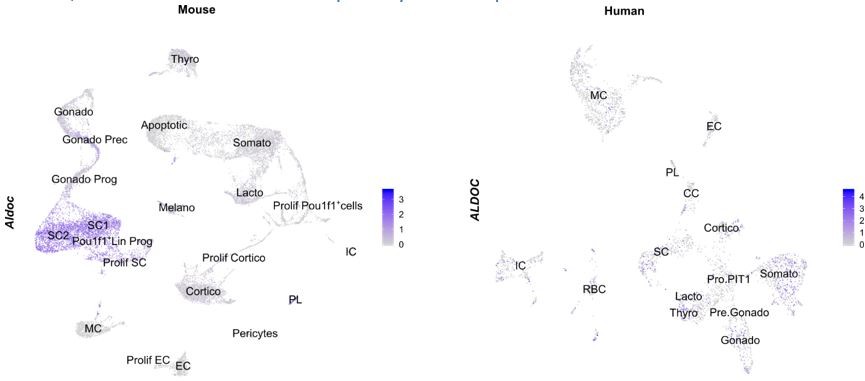
Aldolase C (Aldoc) expression, mapped on our neonatal mouse AP atlas (left) and the human fetal pituitary atlas (right).
Author response image 5
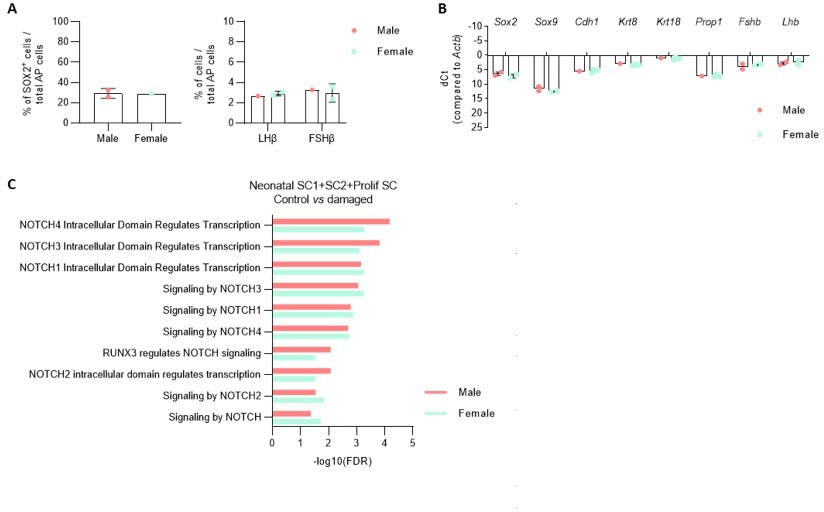
A.
Proportion of indicated cell types in the AP of male and female PD7 mice. B. Expression of indicatedgenes in the AP of male and female PD7 mice. (NB. sex determination by PCR amplification of the Y chromosome specific gene Kdm5d). C. DEG associated GO terms linked with NOTCH signaling enriched in SC1, SC2 and Prolif SC, in separate comparison of damaged male and female AP versus control (corresponding to Figure 4 - figure supplement 2B, in which both sexes are combined for comparison).
Videos
Video 1
Time-lapse video of neonatal anterior pituitary (AP) organoid formation.
Video reconstruction of live time-lapse brightfield images captured by IncuCyte S3 (following the timepoints shown in the timetable on the video) of organoid culture after neonatal AP cell seeding (P0). Cultures were scanned automatically every 3 hr for 12 days.
Video 2
3D imaging of neonatal anterior pituitary (AP) organoids.
Movie of z-stack through a neonatal AP organoid immunofluorescently stained for SOX2 (red) and E-cadherin (green). Hoechst33342 was used as nuclear stain (blue).
Video 3
3D imaging of neonatal anterior pituitary (AP) organoids.
3D reconstruction of a neonatal AP organoid immunofluorescently stained for SOX2 (red) and E-cadherin (green). Hoechst33342 was used as nuclear stain (blue).
Tables
Appendix 1—table 1
Overview of medium components in PitOM and RSpECT, used for organoid culturing.
| Pituitary organoid medium (PitOM) | |||
|---|---|---|---|
| Component | Concentration | Catalogue number | Company |
| SFDM | Thermo Fisher Scientific | ||
| B27 | 1× | 12587010 | Thermo Fisher Scientific |
| L-Glutamine | 2 mM | 25030081 | Thermo Fisher Scientific |
| N2 | 1× | 17502048 | Thermo Fisher Scientific |
| N-Acetyl-cysteine | 1.25 mM | A7250 | Sigma-Aldrich |
| EGF | 50 ng/ml | 236-EG | R&D systems |
| SB202190 (=p38 i) | 10 µM | S7067 | Sigma-Aldrich |
| Cholera toxin | 100 ng/ml | C8052 | Sigma-Aldrich |
| RSPO1 | 200 ng/ml | 120-38 | Peprotech |
| Nicotinamide | 10 mM | N0636 | Sigma-Aldrich |
| bFGF (=FGF2) | 20 ng/ml | 234-FSE | R&D systems |
| IGF1 | 100 ng/ml | 100-11 | Peprotech |
| FGF8 | 200 ng/ml | 100-25 | Peprotech |
| FGF10 | 100 ng/ml | 100-26 | Peprotech |
| A83-01 | 0.5 µM | SML0788 | Sigma-Aldrich |
| SHH | 100 ng/ml | 464-SH | R&D systems |
| Noggin | 100 ng/ml | 120-10C | R&D systems |
-
Bold: components of RSpECT medium.
Appendix 1—table 2
Overview of primers, used for RT-qPCR.
| Primer sequences | ||
|---|---|---|
| Target | Forward (5′ > 3′) | Reverse (5′ > 3′) |
| Actb | GCTGAGAGGGAAATCGTGCGTG | CCAGGGAGGAAGAGGATGCGG |
| Axin2 | CGACCCAGTCAATCCTTATCAC | GGGACTCCATCTACGCTACTG |
| Cdh1 | AGAAGATCACGTATCGGATTTGG | TTCTTCACATGCTCAGCGTC |
| Cga | CAAGCTAGGAGCCCCCATCTA | CACTCTGGCATTTCCCATTACT |
| Cntf | TCTGTAGCCGCTCTATCTGG | GGTACACCATCCACTGAGTCAA |
| Ct1 | AAGATCCGCCAGACACACAACC | TGAGAAGCCCGGCAGCCCAAA |
| Fgf10 | ATCACCTCCAAGGAGATGTCCG | CGGCAACAACTCCGATTTCCAC |
| Fgfr2 | GTCTCCGAGTATGAGTTGCCAG | CCACTGCTTCAGCCATGACTAC |
| Fzd1 | CAGCAGTACAACGGCGAAC | GTCCTCCTGATTCGTGTGGC |
| Fzd2 | AAGAATGACCTCCTTTCCCT | CACAACCCAATCCTACAAACAG |
| Fzd3 | CCCTATTTGTATGGAATATGGACG | TCATCACAATCTGGAAACCTACTG |
| Fzd6 | TCTTCCCTAACCTGATGGGTC | ACAATTTCCGACAGGGTAGAAC |
| Gata2 | AAGGATGGCGTCAAGTACCAA | TATCGGGTGGTGTGTTGCAG |
| Gh | GCTACAGACTCTCGGACCTC | GGAAAAGCACTAGCCTCCTGA |
| Ifng | GCCACGGCACAGTCATTGA | TGCTGATGGCCTGATTGTCTT |
| Igf1 | GTGGATGCTCTTCAGTTCGTGTG | TCCAGTCTCCTCAGATCACAGC |
| Igf1r | CGGGATCTCATCAGCTTCACAG | TCCTTGTTCGGAGGCAGGTCTA |
| Il11 | CTGACGGAGATCACAGTCTGGA | GGACATCAAGTCTACTCGAAGCC |
| Il1b | TGGACCTTCCAGGATGAGGACA | GTTCATCTCGGAGCCTGTAGTG |
| Il31 | ACAACGAAGCCTACCCTGGT | ACATCCCAGATGCCTGCTTTAT |
| Il6 | CACGGCCTTCCCTACTTCAC | TGCCATTGCACAACTCTTTTCT |
| Krt18 | ACTCCGCAAGGTGGTAGATGA | TCCACTTCCACAGTCAATCCA |
| Krt8 | TGGAAGGACTGACCGACGAGAT | GGCACGAACTTCAGCGATGAT |
| Lgr4 | CTCTCAACAACATCTCAAGCA | TAATTCAAGTCCAGGGTTTCCA |
| Lgr5 | GTAGGCAACCCTTCTCTTATCAC | CAAAGTCAGTGTTCTTAGTTCAGG |
| Lgr6 | CTCTCAACCATATCCGCCAC | TATAGTTCAGGTCTAGTGTCTCCA |
| Lif | CCCATGCCTGATACGCCTG | CAAGTGGGAGTGCAAACTGAC |
| Nog | GGTGGAGTTCAACATCCTGTGG | ATCCGCATCTCGTAGGCACTCA |
| Osm | ATGCAGACACGGCTTCTAAGA | TTGGAGCAGCCACGATTGG |
| Pou1f1 | ATGAGTTGCCAATCTTTCACC | TAATGAAGTCCTGTCGCTGTG |
| Pomc | AGAGGTTAAGAGCAGTGACTAAGAG | AACATGTTCAGTCTCCTGCCT |
| Prl | CTGGCTACACCTGAAGACAAG | CGAGGACTGCACCAAACTGA |
| Prop1 | CCATCTTTGGTTTGGGTGG | CAGAGCTCCTGTCTACCGT |
| Sox2 | AAAGTATCAGGAGTTGTCAAGG | CTCTTCTTTCTCCCAGCCC |
| Sox9 | CGGAACAGACTCACATCTCTCC | GCTTGCACGTCGGTTTTGG |
| Tacstd2 | GTCTGCCAATGTCGGGCAA | GTTGTCCAGTATCGCGTGCT |
| Tbx19 | AGCTGTGTCTACATTCACCC | TCAGCATTATCTGCCCACCT |
| Tnf | GGTGCCTATGTCTCAGCCTCTT | GCCATAGAACTGATGAGAGGGAG |
| Wnt5a | ATGCAGTACATTGGAGAAGGTG | CGTCTCTCGGCTGCCTATTT |
Appendix 1—key resources table
| Reagent type (species) or resource | Designation | Source or reference | Identifiers | Additional information |
|---|---|---|---|---|
| Genetic reagent (Mus musculus) | Sox2eGFP/+; Sox2tm1Lpev | DOI: 10.1159/000082134. PMID:15711057. | MGI:3589809 | |
| Genetic reagent (Mus musculus) | Il6−/−; Il6tm1Kopf | DOI: 10.1038/368339a0. PMID:8127368. | MGI:1857197; RRID:IMSR_JAX:002650 | Gifted by Dr. Pura Muñoz Cánoves, University of Valencia |
| Genetic reagent (Mus musculus) | GHCre/+; Tg(Gh1-cre)bKnmn | DOI: 10.1210/en.2006–1542. PMID:17289844. | MGI:4442901 | |
| Genetic reagent (Mus musculus) | ROSA26iDTR/+; Gt(ROSA)26Sortm1(HBEGF)Awai; −/iDTR | DOI: 10.1038/nmeth762. PMID:15908920. | MGI:3772576; RRID:IMSR_JAX:007900 | |
| Biological sample (Mus musculus) | Primary anterior pituitary (AP) cells | This paper | N/A | Freshly isolated from Mus musculus |
| Antibody | Anti-SOX2 (rabbit monoclonal) | Abcam | Cat. #:AB92494; RRID:AB_10585428 | (1:2000) |
| Antibody | Anti-SOX2 (goat polycolonal) | Immune Systems | Cat. #:GT15098; RRID:AB_2732043 | (1:750) |
| Antibody | Anti-ACTH (rabbit polyclonal) | National Hormone and Peptide Program (NHPP) | Cat. #:AFP-6328031; RRID:AB_2665562 | (1:5000) |
| Antibody | Anti-CK8/18 (guinea pig polyclonal) | Progen | Cat. #:GP11; RRID:AB_2904125 | (1:20) |
| Antibody | Anti-E-cad (rabbit monoclonal) | Cell Signalling Technology | Cat. #:3195; RRID:AB_2291471 | (1:400) |
| Antibody | Anti-GH (guinea pig polyclonal) | National Hormone and Peptide Program (NHPP) | Cat. #:AFP12121390;RRID: B_2756840 | (1:1000) |
| Antibody | Anti-GH (rabbit polyclonal) | National Hormone and Peptide Program (NHPP) | RRID:AB_2629219 | (1:10,000) |
| Antibody | Anti-Ki67 (rabbit monoclonal) | Thermo Fisher Scientific | Cat. #:RM-9106; RRID:AB_2341197 | (1:50) |
| Antibody | Anti-Ki67 (mouse monoclonal) | BD Bioscience | Cat. #:550609; RRID:AB_393778 | (1:100) |
| Antibody | Anti-PIT1 (rabbit polyclonal) | Other | Cat. #:422_Rhodes; RRID:AB_2722652 | (1:500) Gifted by Dr. S. J. Rhodes (IUPUI, USA); Dr. K. Rizzoti (Francis-Crick institute, UK) |
| Antibody | Anti-PRL (rabbit polyclonal) | National Hormone and Peptide Program (NHPP) | RRID:AB_2629220 | (1:10,000) |
| Antibody | Anti-TACSTD2 (goat polyclonal) | R&D systems | Cat. #:AF1122; RRID:AB_2205662 | (1:50) |
| Antibody | Anti-aGSU (guinea pig polyclonal) | National Hormone and Peptide Program (NHPP) | (1:10,000) | |
| Antibody | Anti-VIM (rabbit monoclonal) | Cell Signalling Technology | Cat. #:5741 S; RRID:AB_10695459 | (1:50) |
| Antibody | Anti-TdT (rabbit monoclonal) | Abcam | Cat. #:ab76544; RRID:AB_2094447 | (1:100) |
| Antibody | Anti-goat IgG 555 (donkey polyclonal) | Thermo Fisher Scientific | Cat. #:A-21432; RRID:AB_2535853 | (1:1000) |
| Antibody | Anti-mouse IgG 555 (donkey polyclonal) | Thermo Fisher Scientific | Cat. #:A-31570; RRID:AB_2536180 | (1:1000) |
| Antibody | Anti-mouse IgG 488 (donkey polyclonal) | Thermo Fisher Scientific | Cat. #:A-32766; RRID:AB_2762823 | (1:1000) |
| Antibody | Anti-rabbit IgG 488 (donkey polyclonal) | Thermo Fisher Scientific | Cat. #:A-21206; RRID:AB_2535792 | (1:1000) |
| Antibody | Anti-rabbit IgG 555 (donkey polyclonal) | Thermo Fisher Scientific | Cat. #:A-31572; RRID:AB_162543 | (1:1000) |
| Antibody | Anti-guinea pig FITC (donkey polyclonal) | Jackson ImmunoResearch | Cat. #:706-545-148; RRID:AB_2340472 | (1:500) |
| Sequence-based reagent | RNAscope probe M. musculus Sox2 | Advanced Cell Diagnostics | Cat. #:401041 C3 | |
| Sequence-based reagent | RNAscope probe M. musculus Rspo3 | Advanced Cell Diagnostics | Cat. #:483781 C2 | |
| Sequence-based reagent | RNAscope probe M. musculus Lgr4 | Advanced Cell Diagnostics | Cat. #:318321 C2 | |
| Sequence-based reagent | RNAscope probe M. musculus Lgr6 | Advanced Cell Diagnostics | Cat. #:404961 C2 | |
| Peptide, recombinant protein | R-Spondin 1; RSPO1 | R&D systems | Cat. #:4645-RS | |
| Peptide, recombinant protein | WNT3A | R&D systems | Cat. #:5036-WN | |
| Peptide, recombinant protein | Interleukin-6; IL-6 | Peprotech | Cat. #:200-06 | |
| Peptide, recombinant protein | Epidermal growth factor; EGF | R&D systems | Cat. #:236-EG | |
| Peptide, recombinant protein | Basic fibroblast growth factor; bFGF; FGF2 | R&D systems | Cat. #:234-FSE | |
| Peptide, recombinant protein | Insulin-like growth factor 1; IGF1 | Peprotech | Cat. #:100-11 | |
| Peptide, recombinant protein | Fibroblast growth factor 8; FGF8 | Peprotech | Cat. #:100-25 | |
| Peptide, recombinant protein | Fibroblast growth factor 10; FGF10 | Peprotech | Cat. #:100-26 | |
| Peptide, recombinant protein | Sonic hedgehog; SHH | Peprotech | Cat. #:464-SH | |
| Peptide, recombinant protein | Noggin | Peprotech | Cat. #:120-10C | |
| Peptide, recombinant protein | IL-1β | Peprotech | Cat. #:200-01B | |
| Peptide, recombinant protein | Tumor necrosis factor-α; TNFα | Peprotech | Cat. #:300-01A | |
| Peptide, recombinant protein | Leukemia-inhibitory factor; LIF | Peprotech | Cat. #:300-05 | |
| Peptide, recombinant protein | IL-11 | Peprotech | Cat. #:200-11 | |
| Peptide, recombinant protein | WNT5A | AMSBIO | Cat. #:AMS.P5172 | |
| Peptide, recombinant protein | RSPO3 | Peprotech | Cat. #:120-44 | |
| Commercial assay or kit | RNAscope Multiplex Fluorescent Reagent Kit v2 | Advanced Cell Diagnostics | Cat. #:323,100 | |
| Commercial assay or kit | RNeasy Micro kit | Qiagen | Cat. #:74,004 | |
| Commercial assay or kit | V-PLEX mouse IL-6 kit | Meso Scale Discovery | Cat. #:K152QXD-1 | |
| Commercial assay or kit | Superscript III First-Strand Synthesis Supermix | Invitrogen | Cat. #:18080400 | |
| Commercial assay or kit | SYBR Green PCR Master Mix | Thermo Fisher Scientific | Cat. #:4309155 | |
| Chemical compound, drug | LGK-974; LGK | Biogems | Cat. #:1241454 | |
| Chemical compound, drug | Diphtheria toxin; DT | Sigma-Aldrich | Cat. #:D0564 | |
| Chemical compound, drug | Cholera toxin; CT | Sigma-Aldrich | Cat. #:C8052 | |
| Chemical compound, drug | SB202190; P38i | Sigma-Aldrich | Cat. #:S7067 | |
| Chemical compound, drug | A83-01 | Sigma-Aldrich | Cat. #:SML0788 | |
| Chemical compound, drug | Nicotinamide | Sigma-Aldrich | Cat. #:72,340 | |
| Chemical compound, drug | N-Acetyl-cysteine | Sigma-Aldrich | Cat. #:A7250 | |
| Chemical compound, drug | B-27 | Thermo Fisher Scientific | Cat. #:12587010 | |
| Chemical compound, drug | L-Glutamine | Thermo Fisher Scientific | Cat. #:25030081 | |
| Chemical compound, drug | N2 | Thermo Fisher Scientific | Cat. #:17502048 | |
| Chemical compound, drug | STATTIC | Merck | Cat. #:573,099 | |
| Chemical compound, drug | XAV939; XAV | Merck | Cat. #:575,545 | |
| Chemical compound, drug | IWP2 | Merck | Cat. #:681,671 | |
| Chemical compound, drug | Matrigel | Corning | Cat. #:356,234 | |
| Software, algorithm | GraphPad Prism Software | GraphPad Prim (https://www.graphpad.com/) | RRID:SCR_002798 | Version 9.3.1 |
| Software, algorithm | Fiji | ImageJ (http://imagej.nih.gov/ij/) DOI: 10.1038/nmeth.2019 PMID:22743772 | RRID:SCR_002285 | |
| Software, algorithm | IncuCyte software | Sartorius (https://www.sartorius.com/en/products/live-cell-imaging-analysis/live-cell-analysis-software/incucyte-s3-software-v2018b) | Version 2018B | |
| Software, algorithm | MSD discovery workbench software | MSD (https://www.mesoscale.com/en/products_and_services/software) | RRID:SCR_019192 | Version 4.0.12 |
| Other | Deposited Data, scRNA-seq | ArrayExpress | EMBL-EBI:E-MTAB-11337 | scRNA-seq of neonatal mouse AP in steady-state conditions and after transgenically inflicted local damage (see Materials and methods) |
Additional files
Download links
A two-part list of links to download the article, or parts of the article, in various formats.
Downloads (link to download the article as PDF)
Open citations (links to open the citations from this article in various online reference manager services)
Cite this article (links to download the citations from this article in formats compatible with various reference manager tools)
Decoding the activated stem cell phenotype of the neonatally maturing pituitary
eLife 11:e75742.
https://doi.org/10.7554/eLife.75742


