Unique structure and positive selection promote the rapid divergence of Drosophila Y chromosomes
- Department of Biology, University of Rochester, United States
- School of Biological Sciences, University of Nebraska-Lincoln, United States
Figures
Figure 1 with 5 supplements
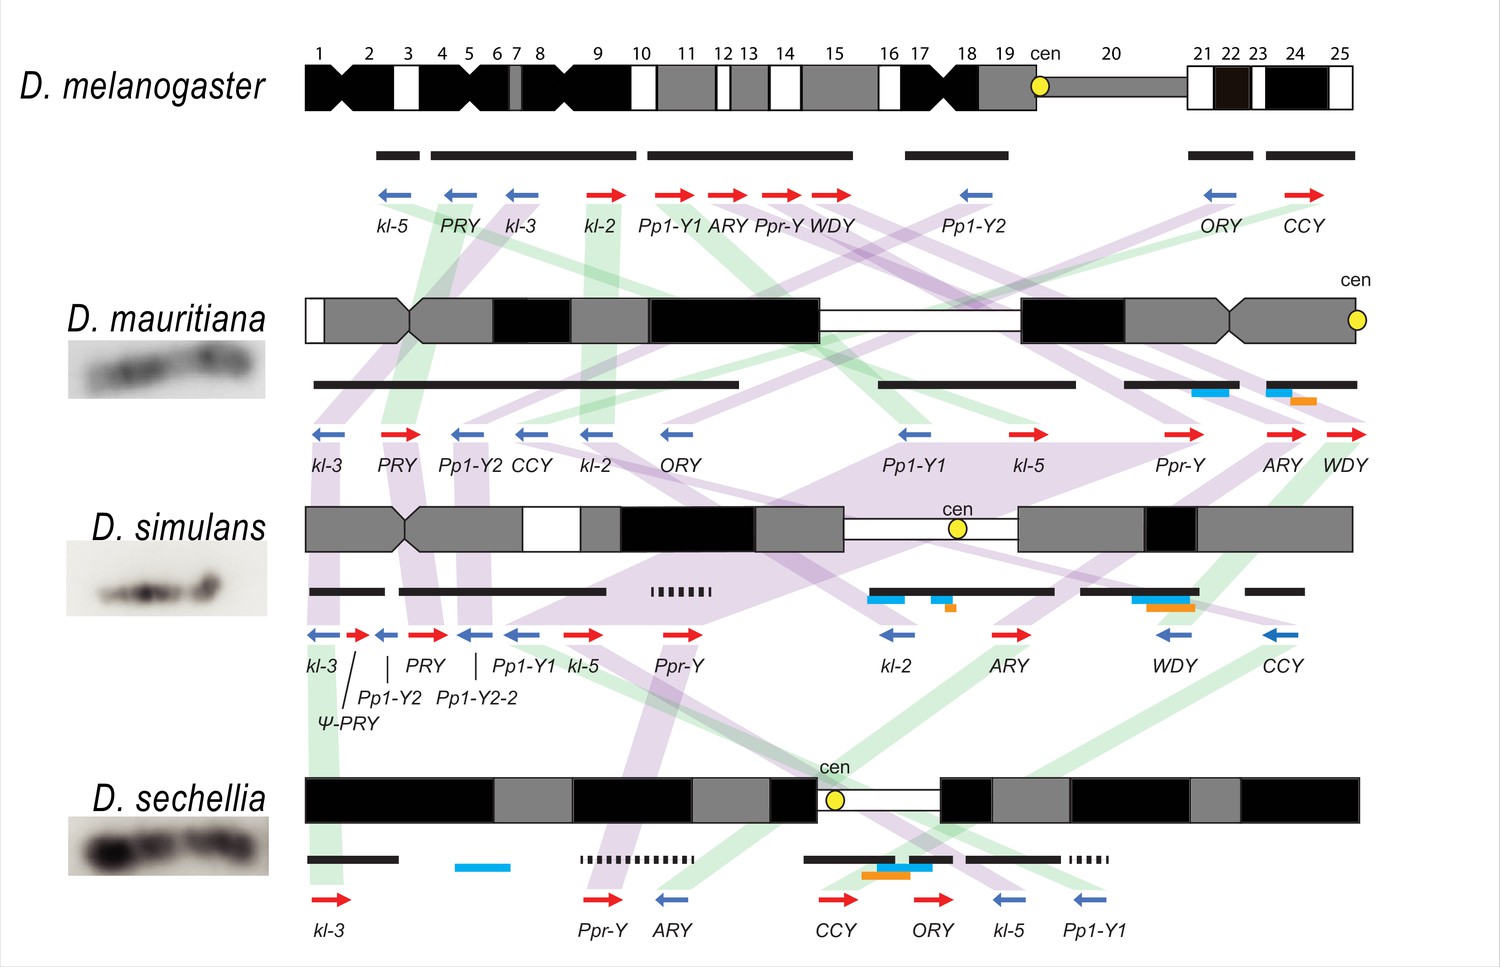
Y chromosome organization in D. melanogaster and the three D. simulans clade species.
Schematics of the cytogenetic maps note the locations of Y-linked genes in D. melanogaster and D. simulans clade species. The bars show the relative placement of the scaffolds on the cytological bands based on FISH results. The solid black and dotted bars represent the scaffolds with known and unknown orientation information, respectively. The light blue and orange bars represent two new Y-linked gene families, Lhk and CK2ßtes-Y in the D. simulans clade, respectively. The arrows indicate the orientation of the genes (blue- minus strand; red- plus strand). Yellow circles denote centromere locations (cen). The blocks connecting genes between species highlight the structural rearrangements between species (purple for same, and green for inverted, orientation).
Figure 1—figure supplement 1
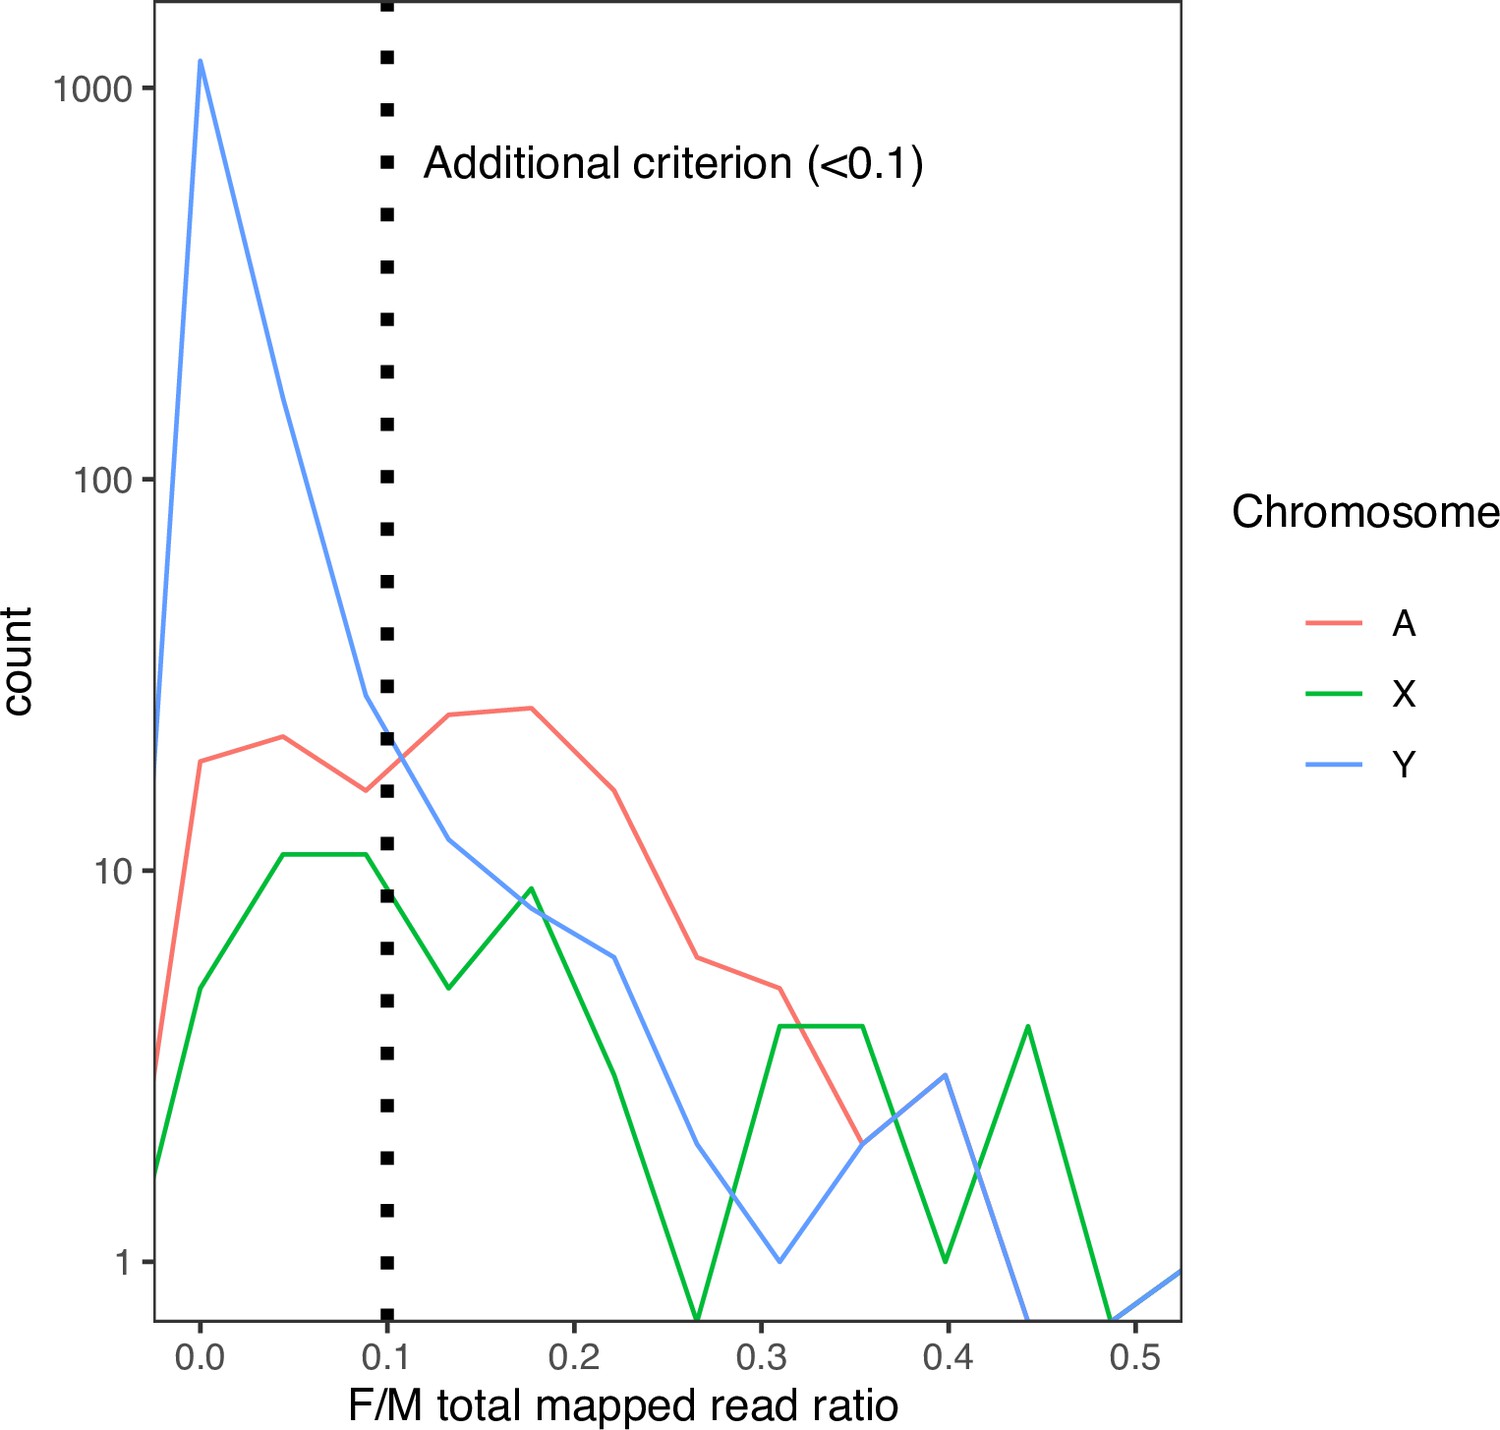
The distribution of female-to-male total mapped read ratio in each 10-kb window in D. mauritiana.
Many non-Y regions have median male-to-female coverage 0 in our D. mauritiana data. Therefore, we applied an additional criterion based on the female-to-male total mapped reads ratio (<0.1) to reduce the false-positive rate.
Figure 1—figure supplement 2
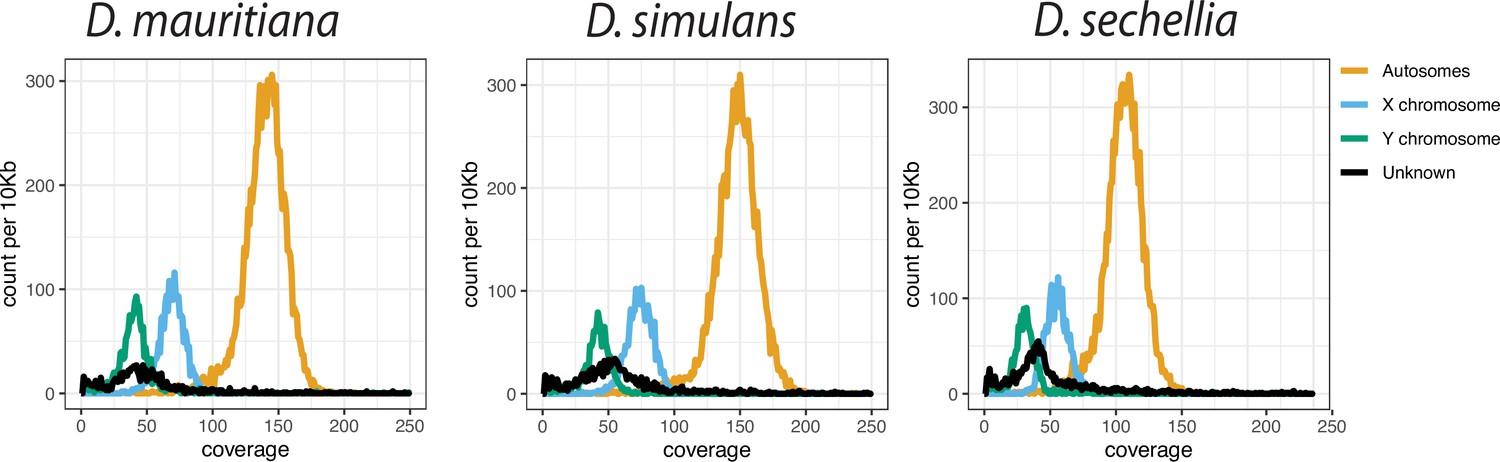
The low Pacbio coverage on Y chromosomes in the D. simulans clade.
We calculated the median coverage of Pacbio reads every 10-kb and plotted the histogram of depth across genomes based on their chromosome location.
Figure 1—figure supplement 3
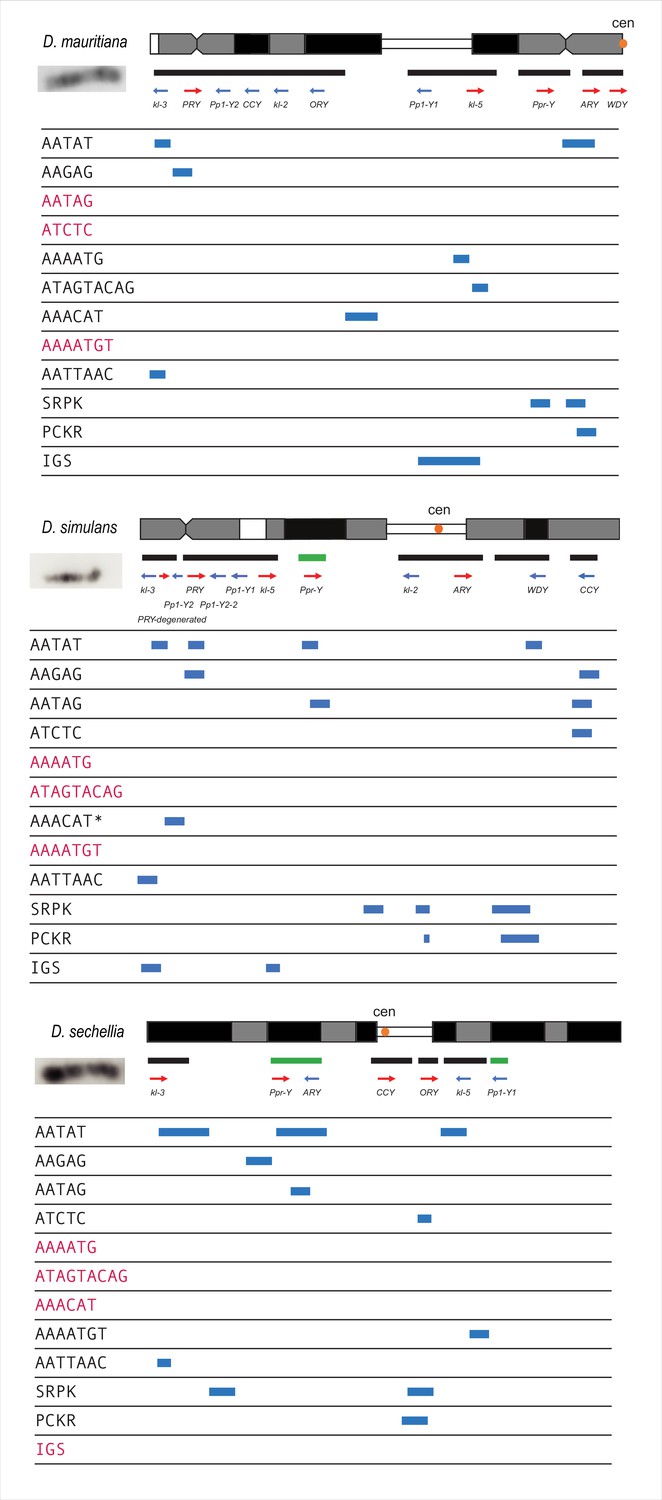
Summarized cytological location of satellite DNA, gene families, and conserved genes on the Y chromosome of the D. simulans clade.
We used FISH as well as our assemblies to infer the cytological location of Y-linked sequences. The bars represent the location of scaffolds or contigs, and the green bars are scaffolds or contigs without known direction. The satellites in red are sequences we cannot detect on Y chromosomes using FISH.
*Based on the repeat content from the Illumina data (Supplementary file 6), the AAACAT signal is probably from the AAACAAT tandem array, instead of AAACAT, in D. simulans.
Figure 1—figure supplement 4
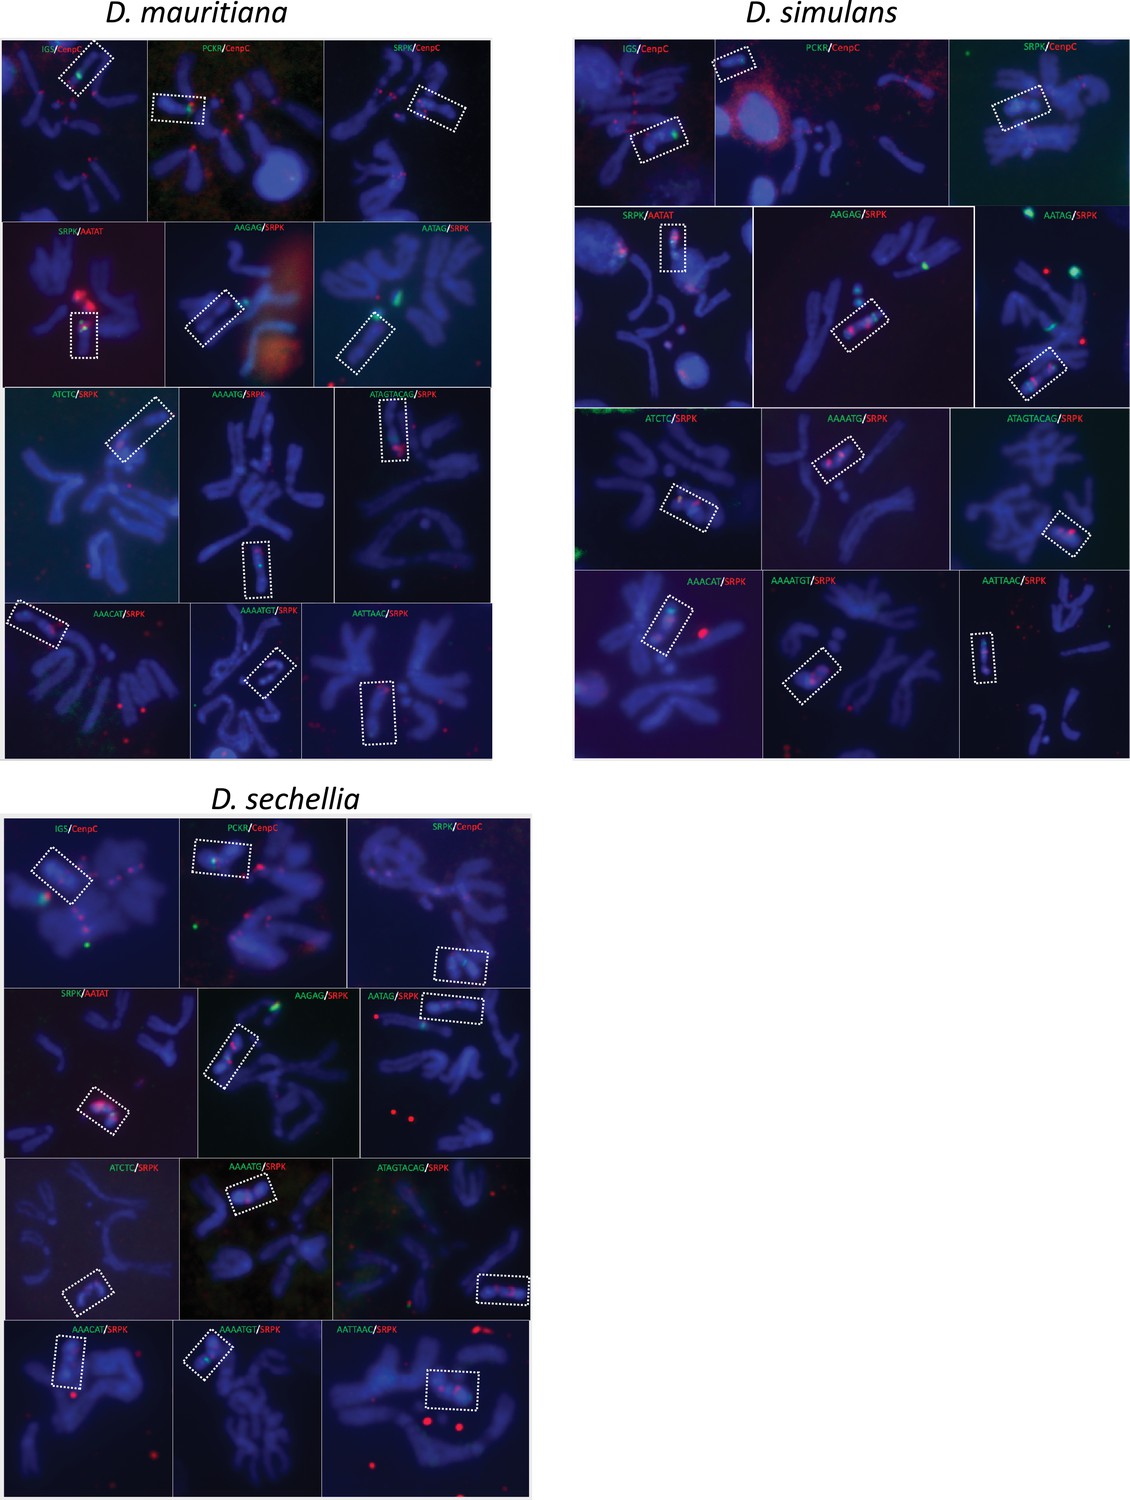
FISH for satellite and gene families, and conserved genes in the D. simulans clade.
We surveyed the location of 12 Y-linked sequences using FISH and immunostaining. The colors on the figure represent the probes we used for the experiments.
Figure 1—figure supplement 5
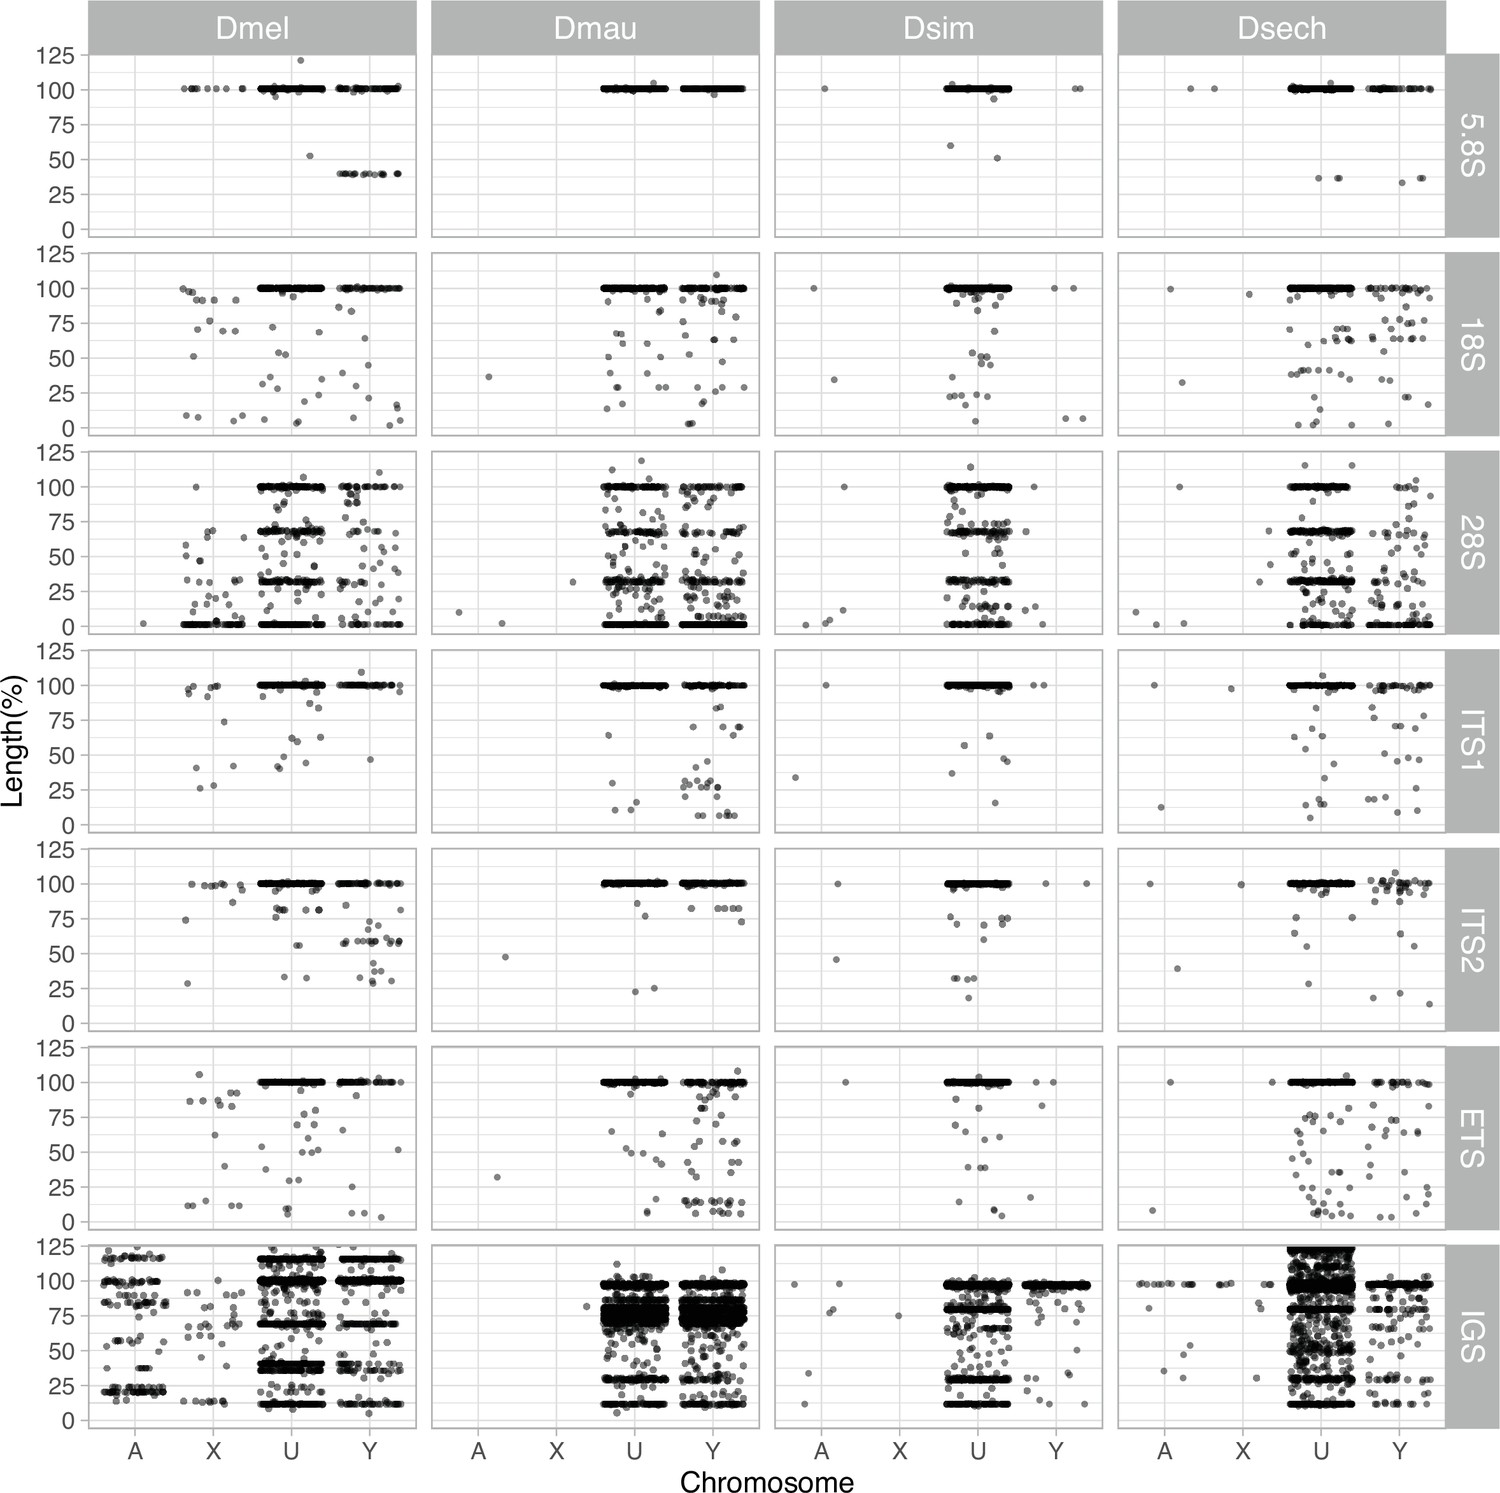
The length of rDNA elements across chromosomes in D. melanogaster and the D. simulans clade.
We surveyed the length of rDNA elements across chromosomes (A: autosomes, X: X chromosome, U: unknown location and Y: Y chromosome). The length of elements is normalized by the length of consensus from functional elements.
Figure 2 with 3 supplements
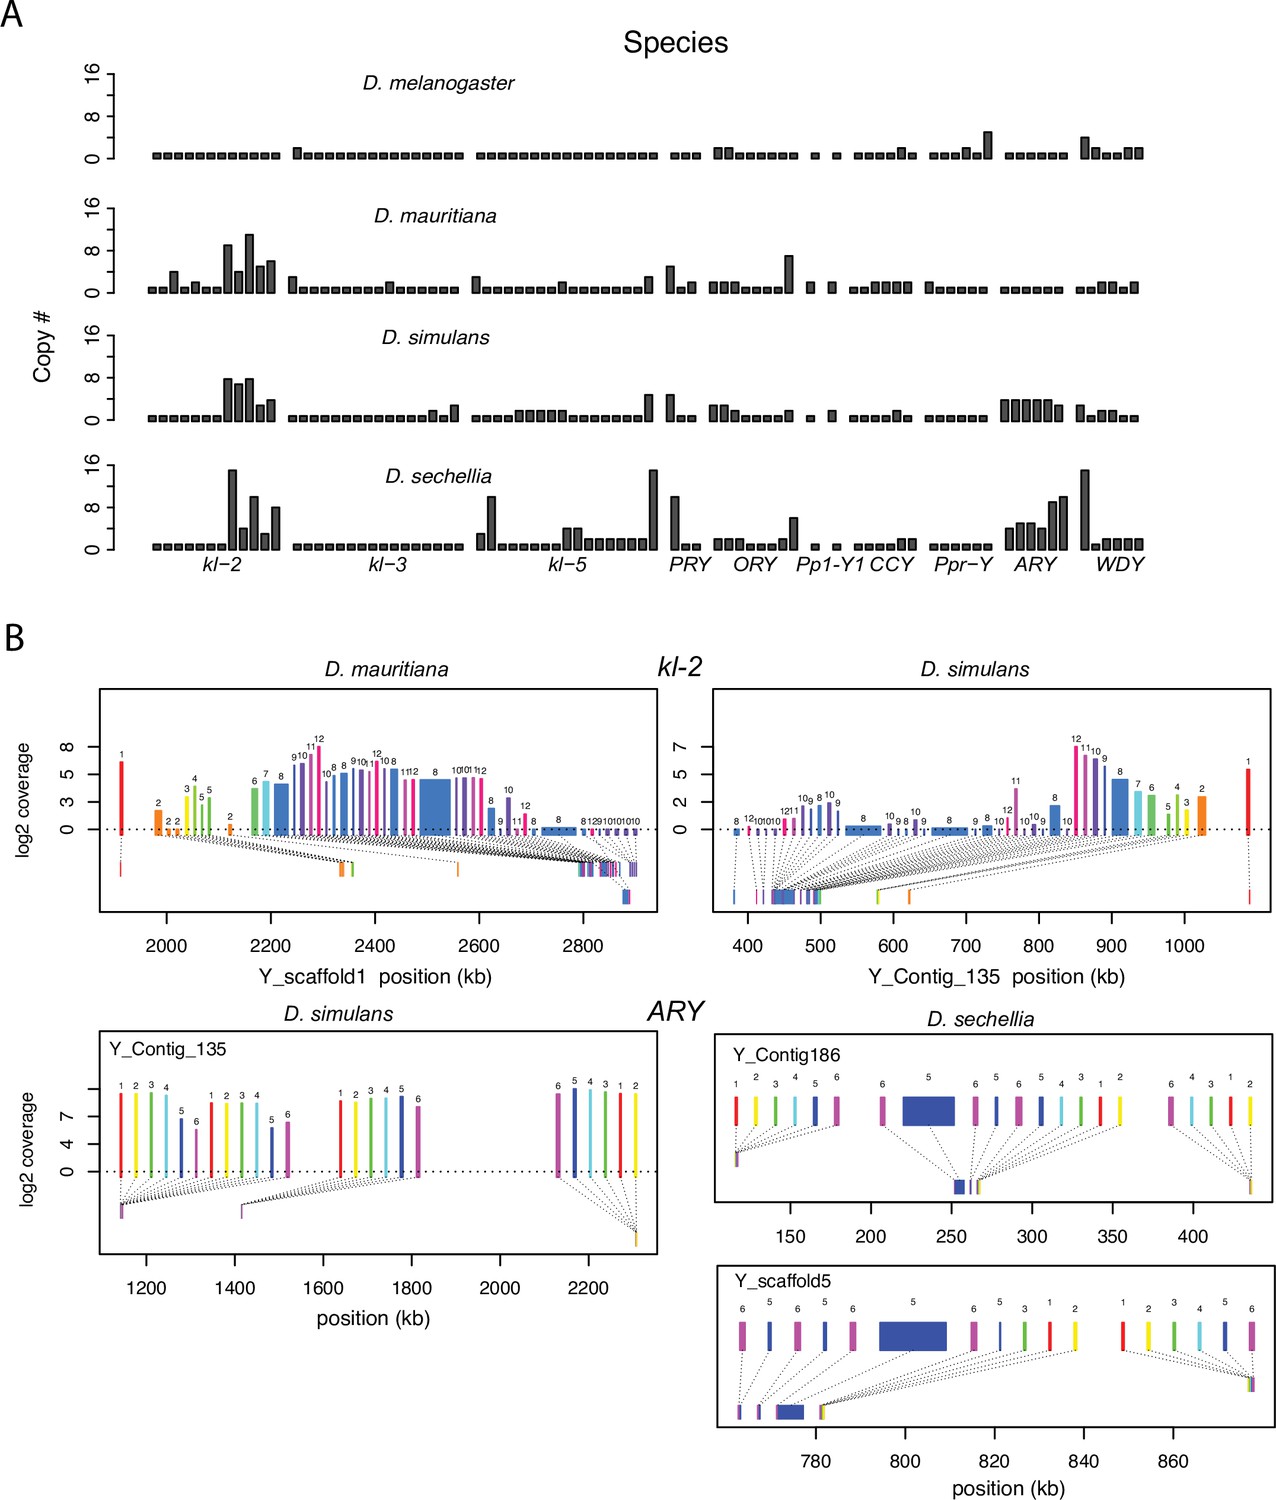
Duplication of canonical Y-linked exons.
(A) Exon copy number is highly variable across the three D. simulans clade species and generally greater than in D. melanogaster. (B) Gene structure of kl-2 and ARY inferred from assemblies and RNA-seq data. Upper bars indicate exons that are colored and numbered, with their height showing average read depth from sequenced testes RNA (D. simulans and D. mauritiana only). Lower bars indicate exon positions on the assembly and position on the Y-axis indicates coding strand. Some of the duplicated exons are expressed. For short genes (e.g., ARY), the duplicates may be functional and influence protein expression level, unlike duplicated exons of long genes (e.g., kl-2).
Figure 2—figure supplement 1
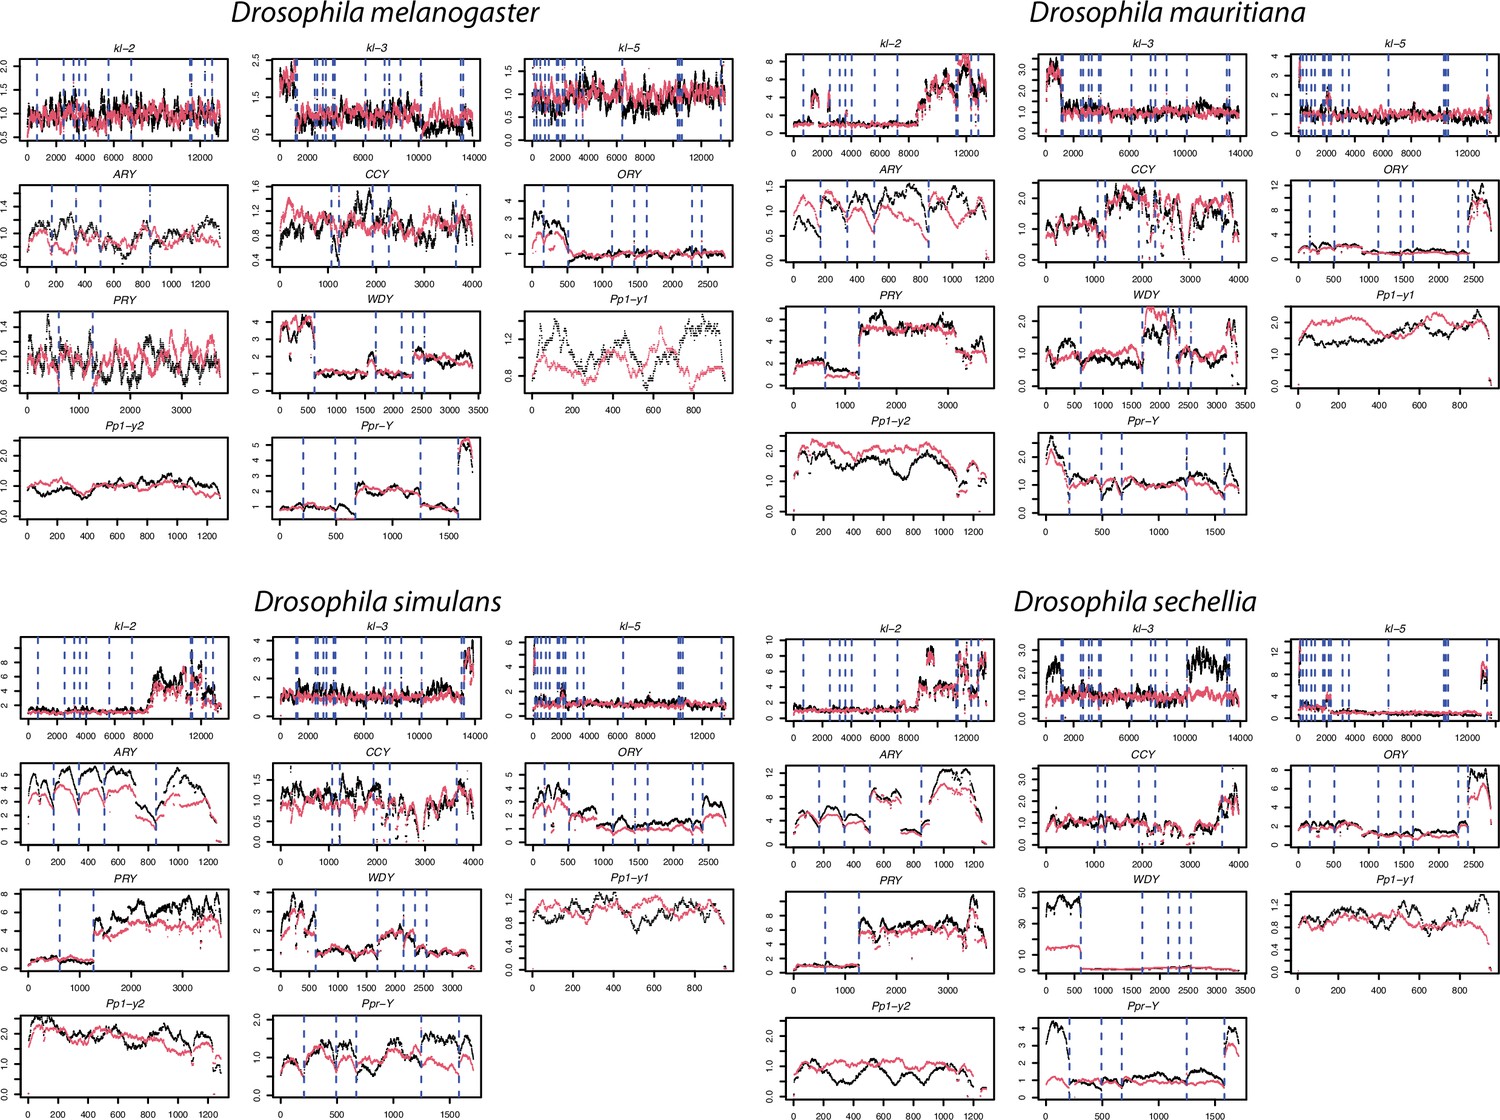
The coverage of male Illumina DNA-seq reads in 11 canonical Y-linked genes.
To confirm the copy number of Y-linked genes across species in our assembly, we mapped the Illumina reads from males to a single of D. melanogaster Y-linked transcripts and estimated the copy number based on their coverage (black lines). For the comparison, we also simulated Illumina reads from our assemblies and mapped them to the same reference to estimate their copy number (red lines). The dotted lines separate each exon.
Figure 2—figure supplement 2
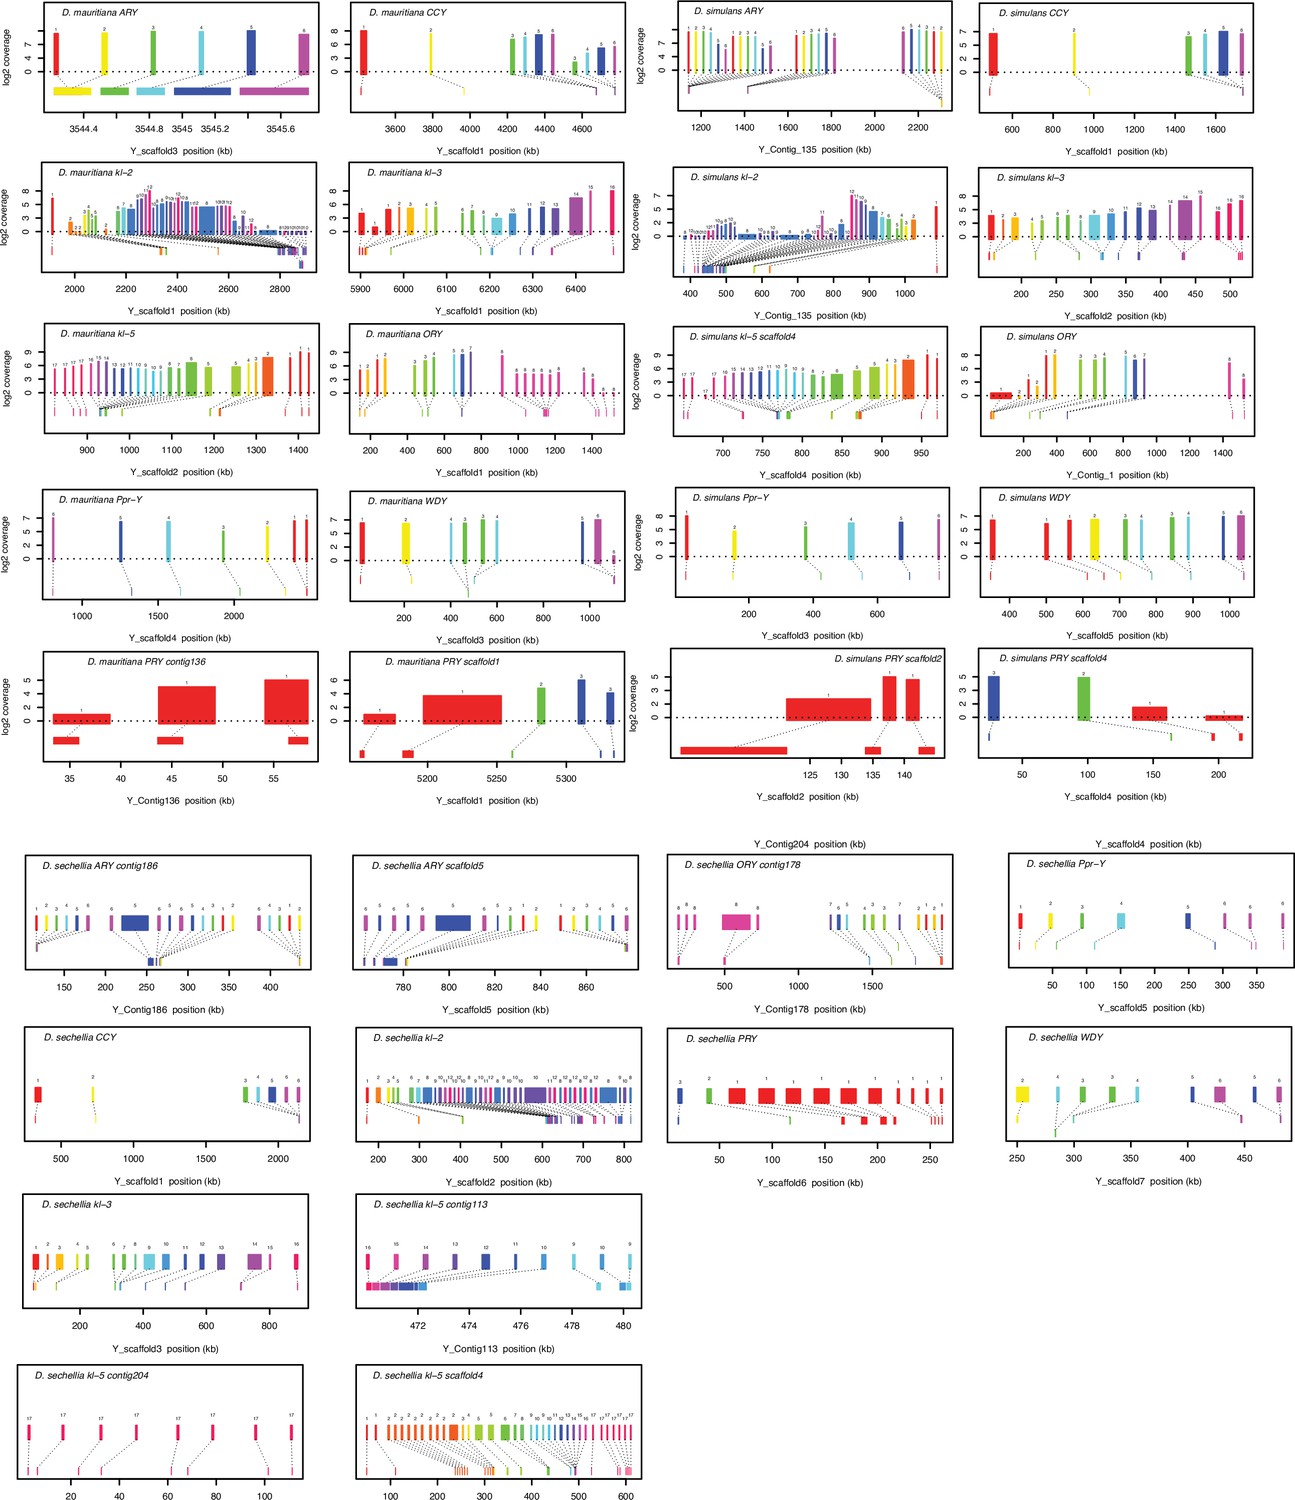
Gene structure of 11 conserved Y-linked genes inferred from assemblies and RNA-seq data.
Upper bars indicate exons that are colored and numbered, with their height indicating average read depth from sequenced testes RNA (D. simulans and D. mauritiana only). Lower bars indicate exon positions on the assembly and position on the Y-axis indicates coding strand.
Figure 2—figure supplement 3
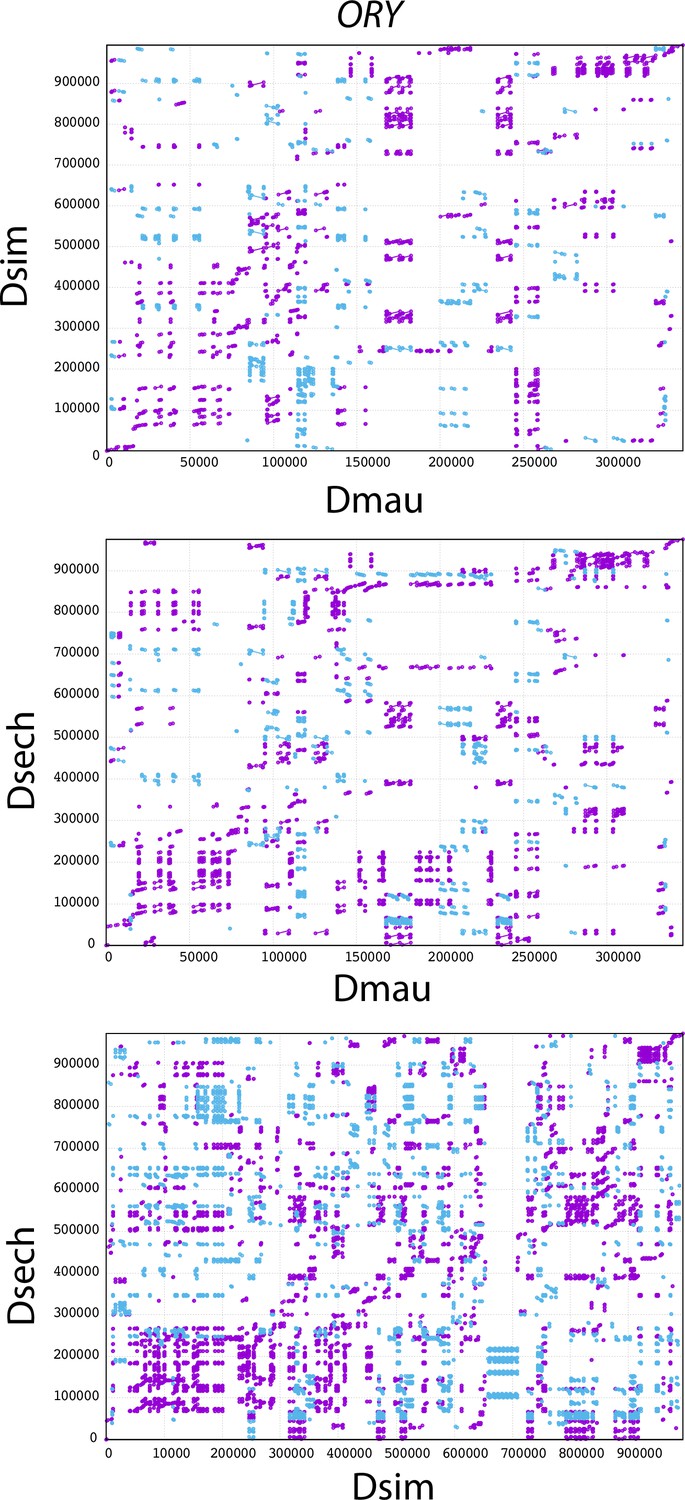
The mummerplot of the ORY alignment in the D. simulans clade.
We used MUMMER to align ORY from different species and plot the figure. Purple lines and dots represent forward matches, and blue lines and dots represent reverse matches.
Figure 3
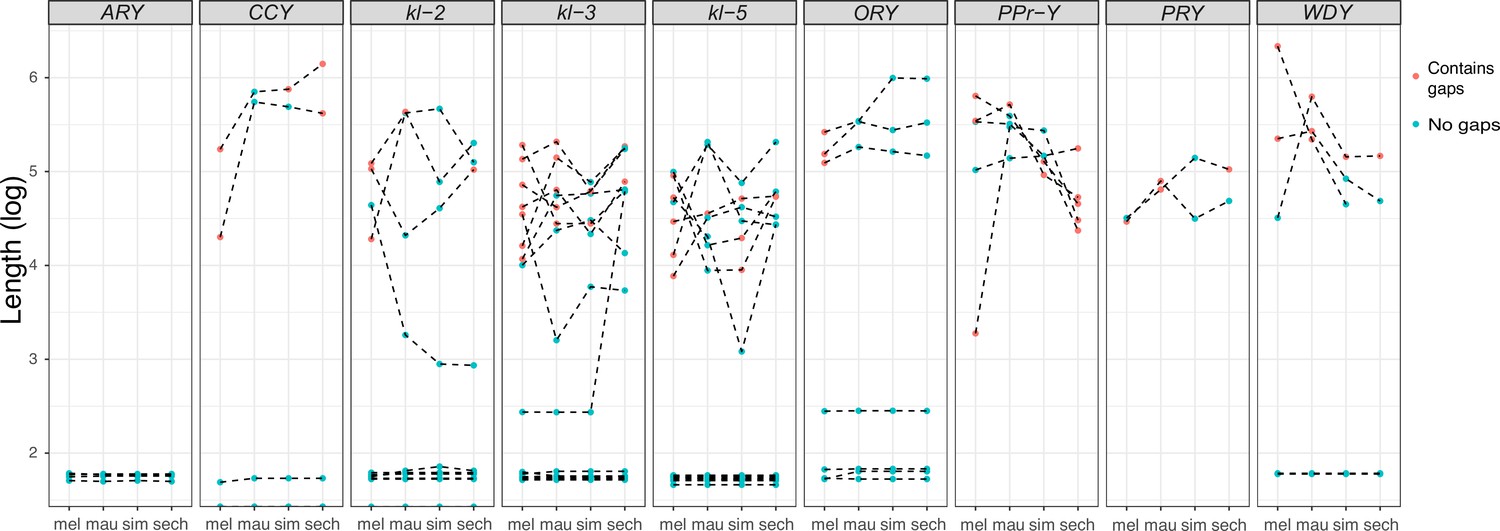
Evolution of intron lengths in canonical Y-linked genes.
The intron length in canonical Y-linked genes is different between D. melanogaster and the three D. simulans clade species. Orthologous introns are connected by dotted lines. Completely assembled introns are in blue and introns with gaps in the assembly are in red, and are therefore minimum intron lengths.
Figure 4
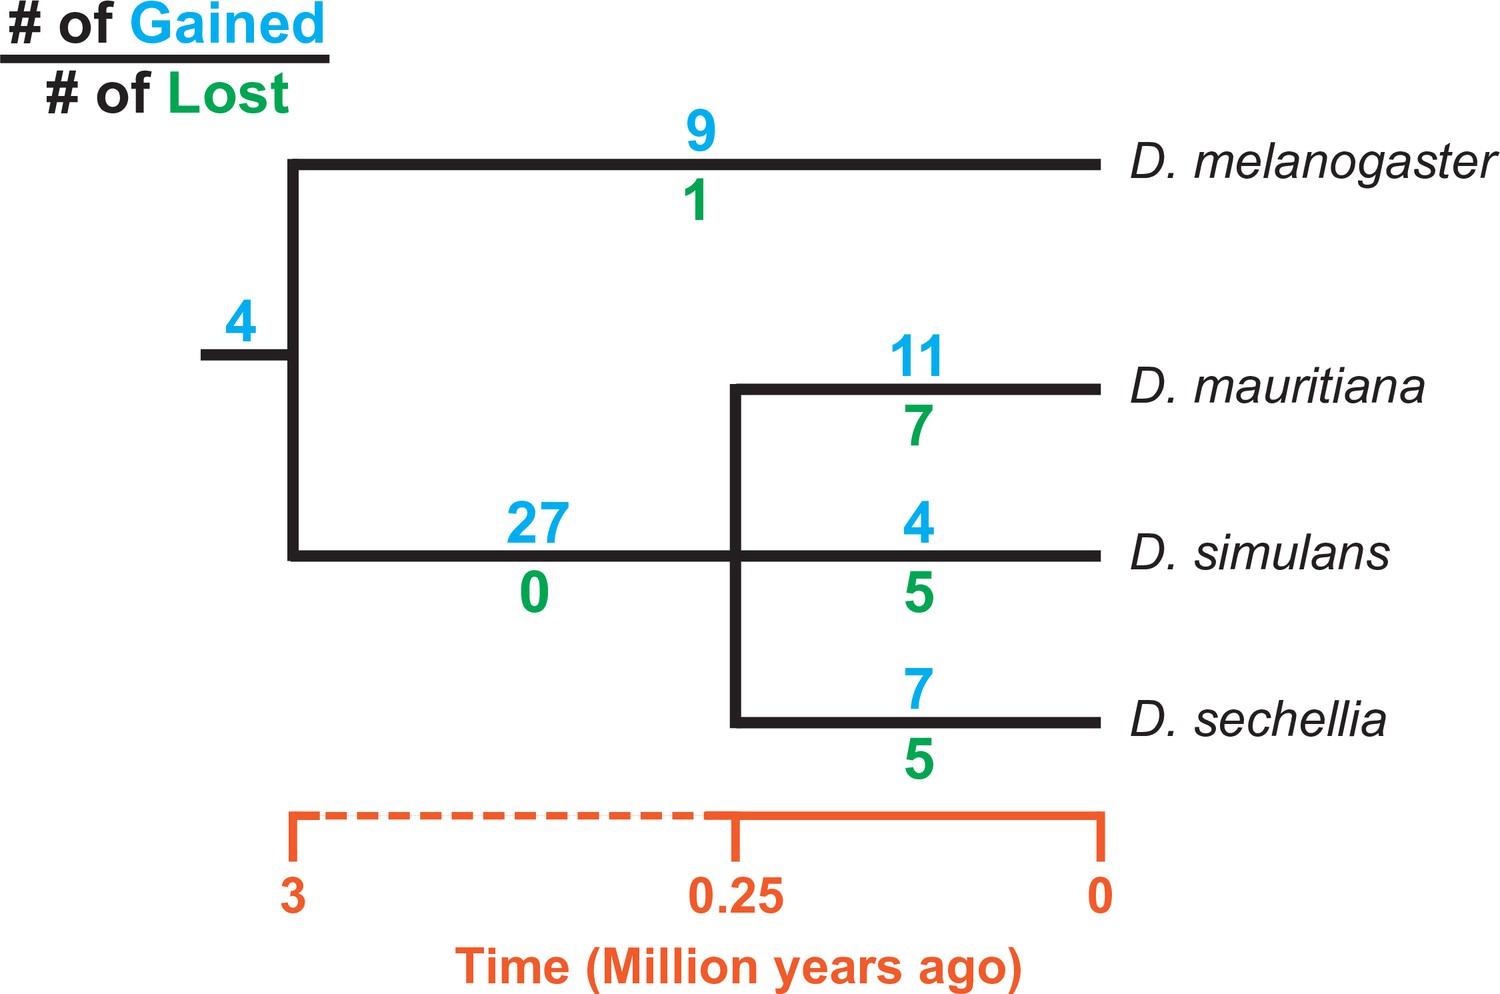
Turnover of new duplications to Y chromosomes in D. melanogaster and three species in the D. simulans clade.
Using phylogenetic analyses, we inferred the evolutionary histories of new Y-linked duplications. The blue and green numbers represent the number of independent duplications and deletions observed in each branch, respectively. We also detected four duplications presented in the ancestor of these four species. The deletion events that happened in the ancestor of these four species cannot be inferred without a Y chromosome assembly in the outgroup.
Figure 5
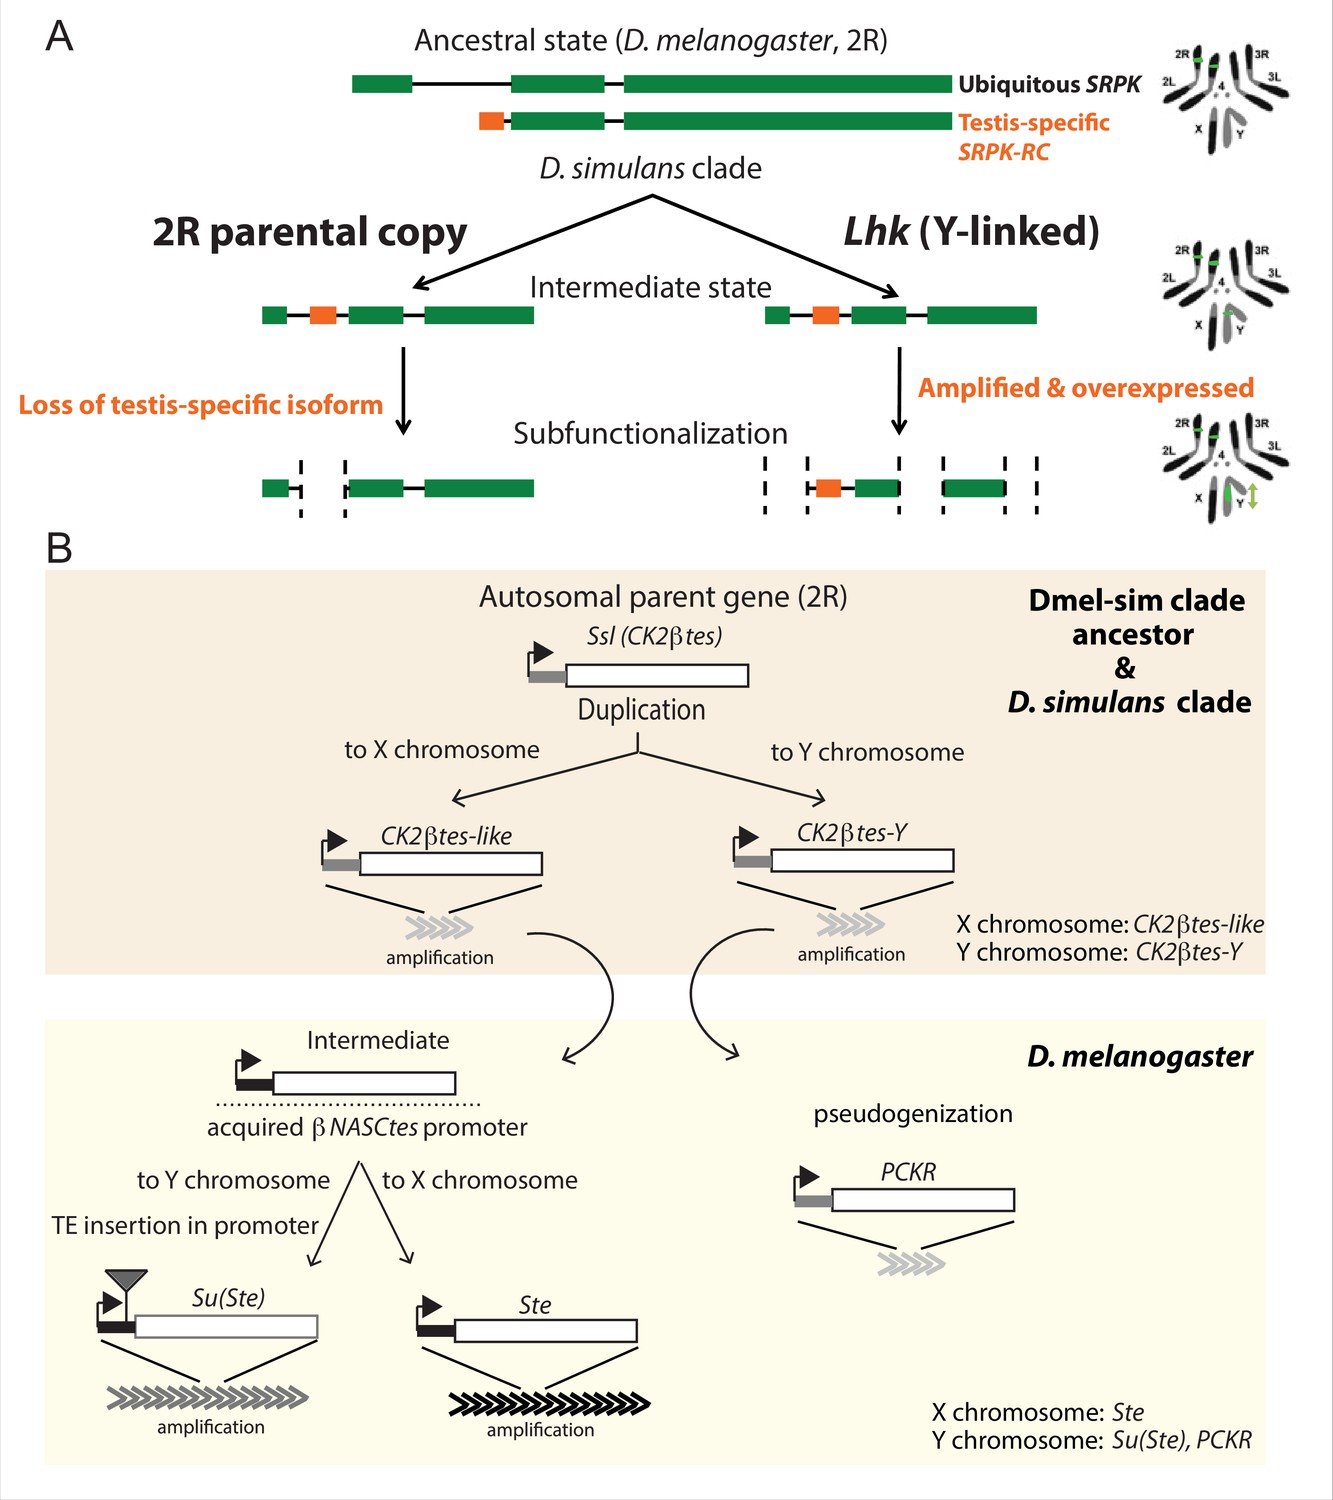
The history of Y-linked ampliconic genes.
(A) Schematic showing the inferred evolutionary history of SRPK-Y. SRPK duplicated to the ancestral Y chromosome in the D. simulans clade. The Y-linked copy (Lhk) retained an exon with testis-specific expression, which was lost in the parental copy on 2R. The Y-linked copy (Lhk) further duplicated and increased their expression in testes. (B) Schematic showing the inferred evolutionary history of sex-linked Ssl/CK2ßtes paralogs. In the D. melanogaster – D. simulans clade ancestor, the autosomal gene Ssl/CK2ßtes duplicated from chromosome 2R to the sex chromosome and independently amplified into the multi-copy gene families CK2ßtes-like on the X chromosome and CK2ßtes-Y on the Y chromosomes (shaded orange box). The gene structures are maintained in the D. simulans clade species, but not in D. melanogaster. In the D. melanogaster lineage (shaded yellow box), CK2ßtes-Ys became pseudogenes (PCKR) and CK2ßtes-like acquired a promoter from ßNASCtes to create a chimeric gene. Subsequent duplication of the chimeric gene to the X chromosome gave rise to the X-linked Ste loci in D. melanogaster. Duplication of the chimeric gene to the Y chromosome, with a subsequent TE insertion in the promoter and amplification event, gave rise to the Y-linked Su(Ste) loci in D. melanogaster.
Figure 6 with 3 supplements
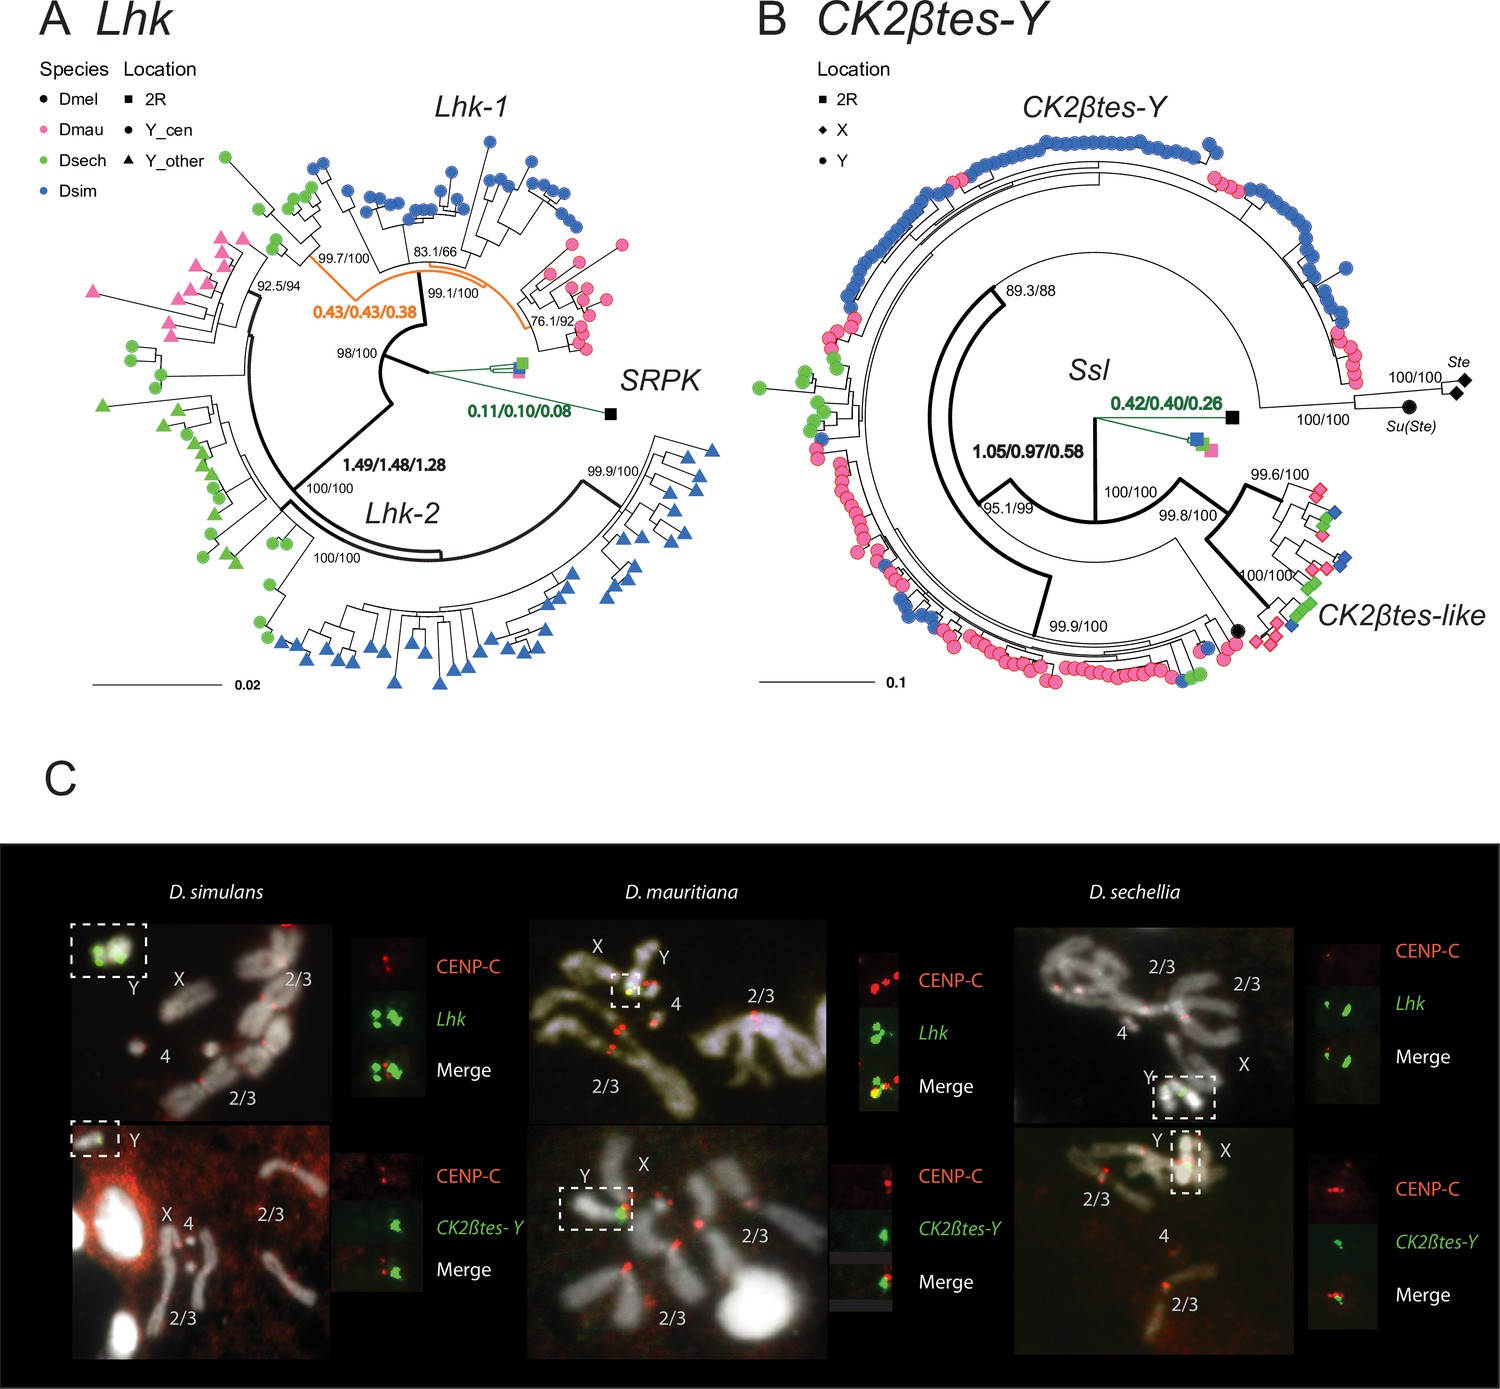
The rapid evolution and gene conversion of Y-linked ampliconic genes.
(A) The inferred maximum likelihood phylogeny for Lhk. Node labels indicate SH-aLRT and ultrafast bootstrap (e.g. 100/100) or rates of protein evolution from PAML with CodonFreq = 0,1, or 2 (e.g. 1.01/1.02/1.03) (Figure 6—figure supplement 1 and Figure 6—figure supplement 3). Lhk shows evidence for positive selection (branch tests and branch-site tests with ω>1) after the duplication from 2R (SRPK) to the Y chromosome in the D. simulans clade. One Lhk subfamily (Lhk-1) is under recent purifying selection and is located close to the centromere, but the other (Lhk-2) is rapidly evolving across the species of the D. simulans clade. (B) Same as A but for CK2ßtes-Y. Both Y-linked CK2ßtes-Y and X-linked CK2ßtes-like also show positive selection. All ω values shown are statistically significant (LRT tests, P0.05; Supplementary file 12 and Supplementary file 14). (C) Cytological location of Y-linked gene families detected using Immunolabeling with fluorescence in situ hybridization (immunoFISH) for the centromere (CENP-C antibody, red signal). On the Y chromosomes, Lhk FISH signals suggest that this gene family occurs in 2–3 cytological locations (green signal), with one near the centromere. CK2ßtes-Y FISH signals are only located near centromeres. Based on our analysis of sequence information, we suggest that most Lhk-1 copies are located near CK2ßtes-Y and the centromere.
Figure 6—figure supplement 1

The phylogeny of Lhk used in PAML analyses.
We marked the branches used in branch-model and branch-site model tests. We did all comparisons using the branch with different colors in likelihood-ratio tests. Please see detailed results in Supplementary file 12.
Figure 6—figure supplement 2

The expression of different copies from Lhk and CK2ßtes-Y gene families.
(A) We quantify the frequency of each derived SNP within the genome using DNA-seq and the expression level of each allele using RNA-seq. We cataloged each SNP as synonymous, nonsynonymous or UTR. (B) We found that across three Y-linked gene families, only highly expressed Lhk-1 copies have fewer nonsynonymous mutations than lowly expressed copies in D. simulans, consistent with purifying selection (Supplementary file 13 and Supplementary file 21; Chi-square test’s P=0.01). We did not detect other significant changes in other comparisons (Supplementary file 13 and Supplementary file 21; Chi-square test’s P > 0.01).
Figure 6—figure supplement 3
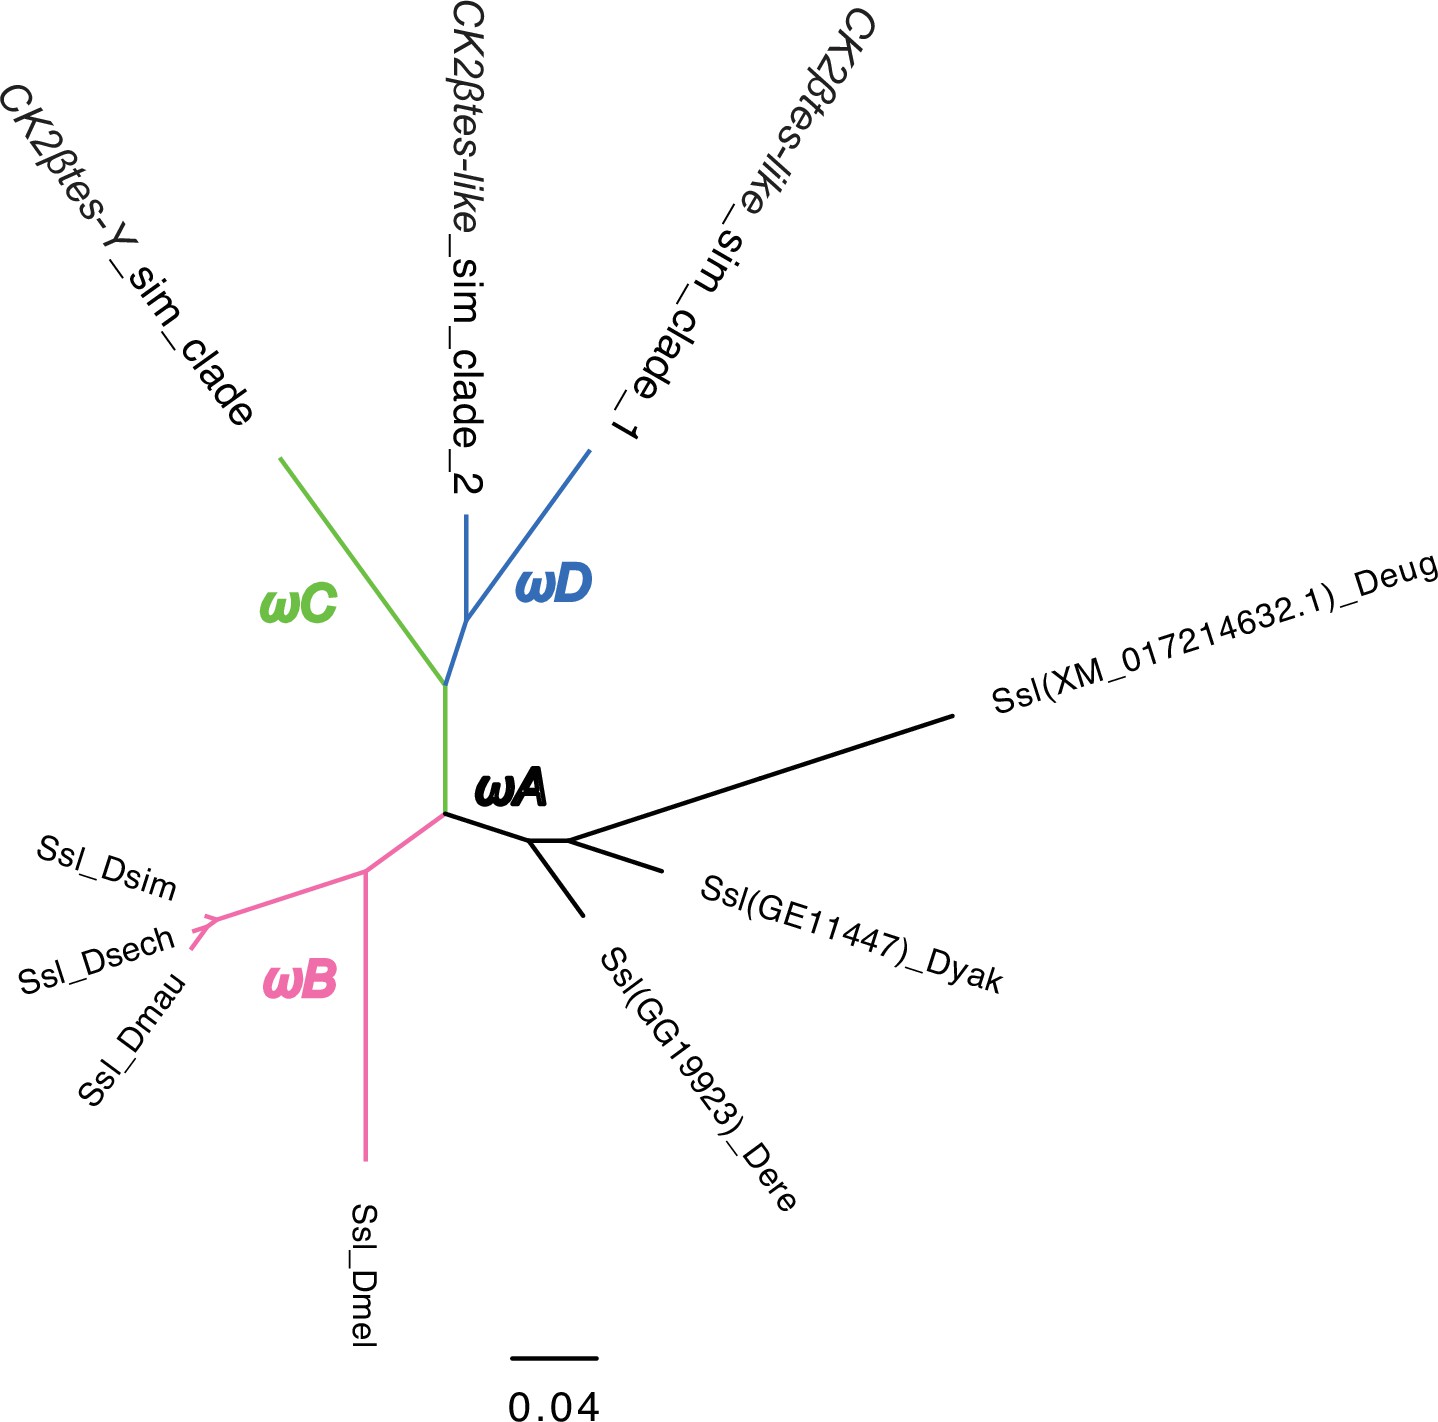
The phylogeny of CK2ßtes-Y used in PAML analyses.
We marked the branches used in branch-model and branch-site model tests. We did all comparisons using the branch with different colors in likelihood-ratio tests. Please see the detailed results in Supplementary file 14.
Figure 7 with 3 supplements
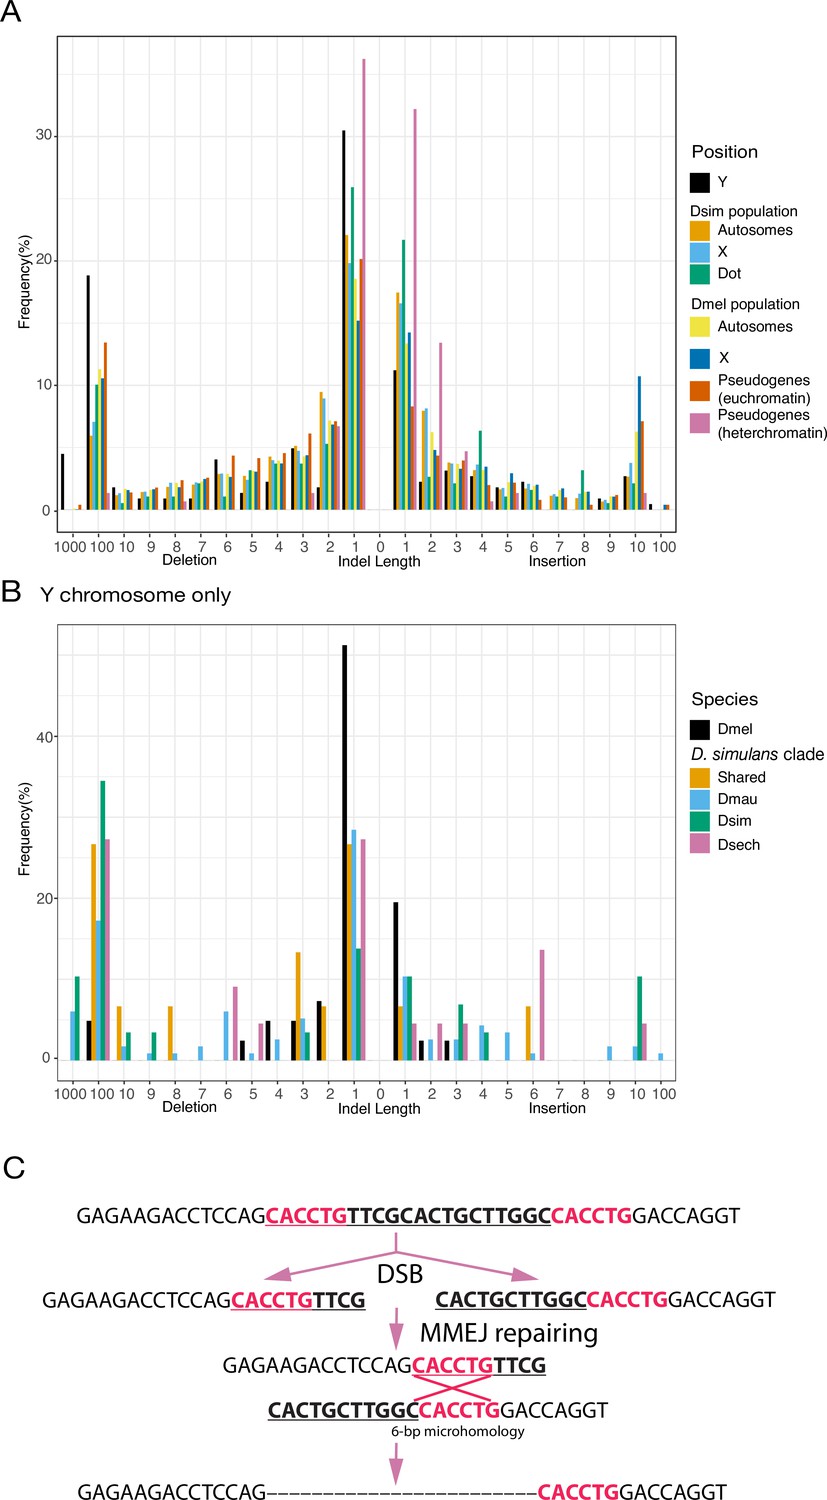
An excess of large deletions on Y chromosomes compared to population data suggests a preference for MMEJ.
(A) We compared the size of 223 indels on 21 recently duplicated Y-linked genes in D. melanogaster and the D. simulans clade species to the indels polymorphic in the D. melanogaster and D. simulans populations. For the indels in D. melanogaster and D. simulans populations, we separated them based on their location, including autosomes (excluding dot chromosomes), X chromosomes, and dot chromosomes. We excluded the D. melanogaster dot-linked indels due to the small sample size (12). We also surveyed indel polymorphism in pseudogenes in D. melanogaster using population data. (B) We classify Y-linked indels by whether they are shared between species or specific in one species (C) The excess of large deletions (underlined) on the Y chromosomes is consistent with MMEJ between short regions of microhomology (red).
Figure 7—figure supplement 1

The abundance of repetitive elements on Y chromosomes of D. melanogaster and the D. simulans clade species.
We plotted the density of 20 most enriched (by total occupying sequences) repetitive elements on Y chromosomes across four species. The colors represent the proportion of repetitive sequences in all assembled Y-linked sequences.
Figure 7—figure supplement 2
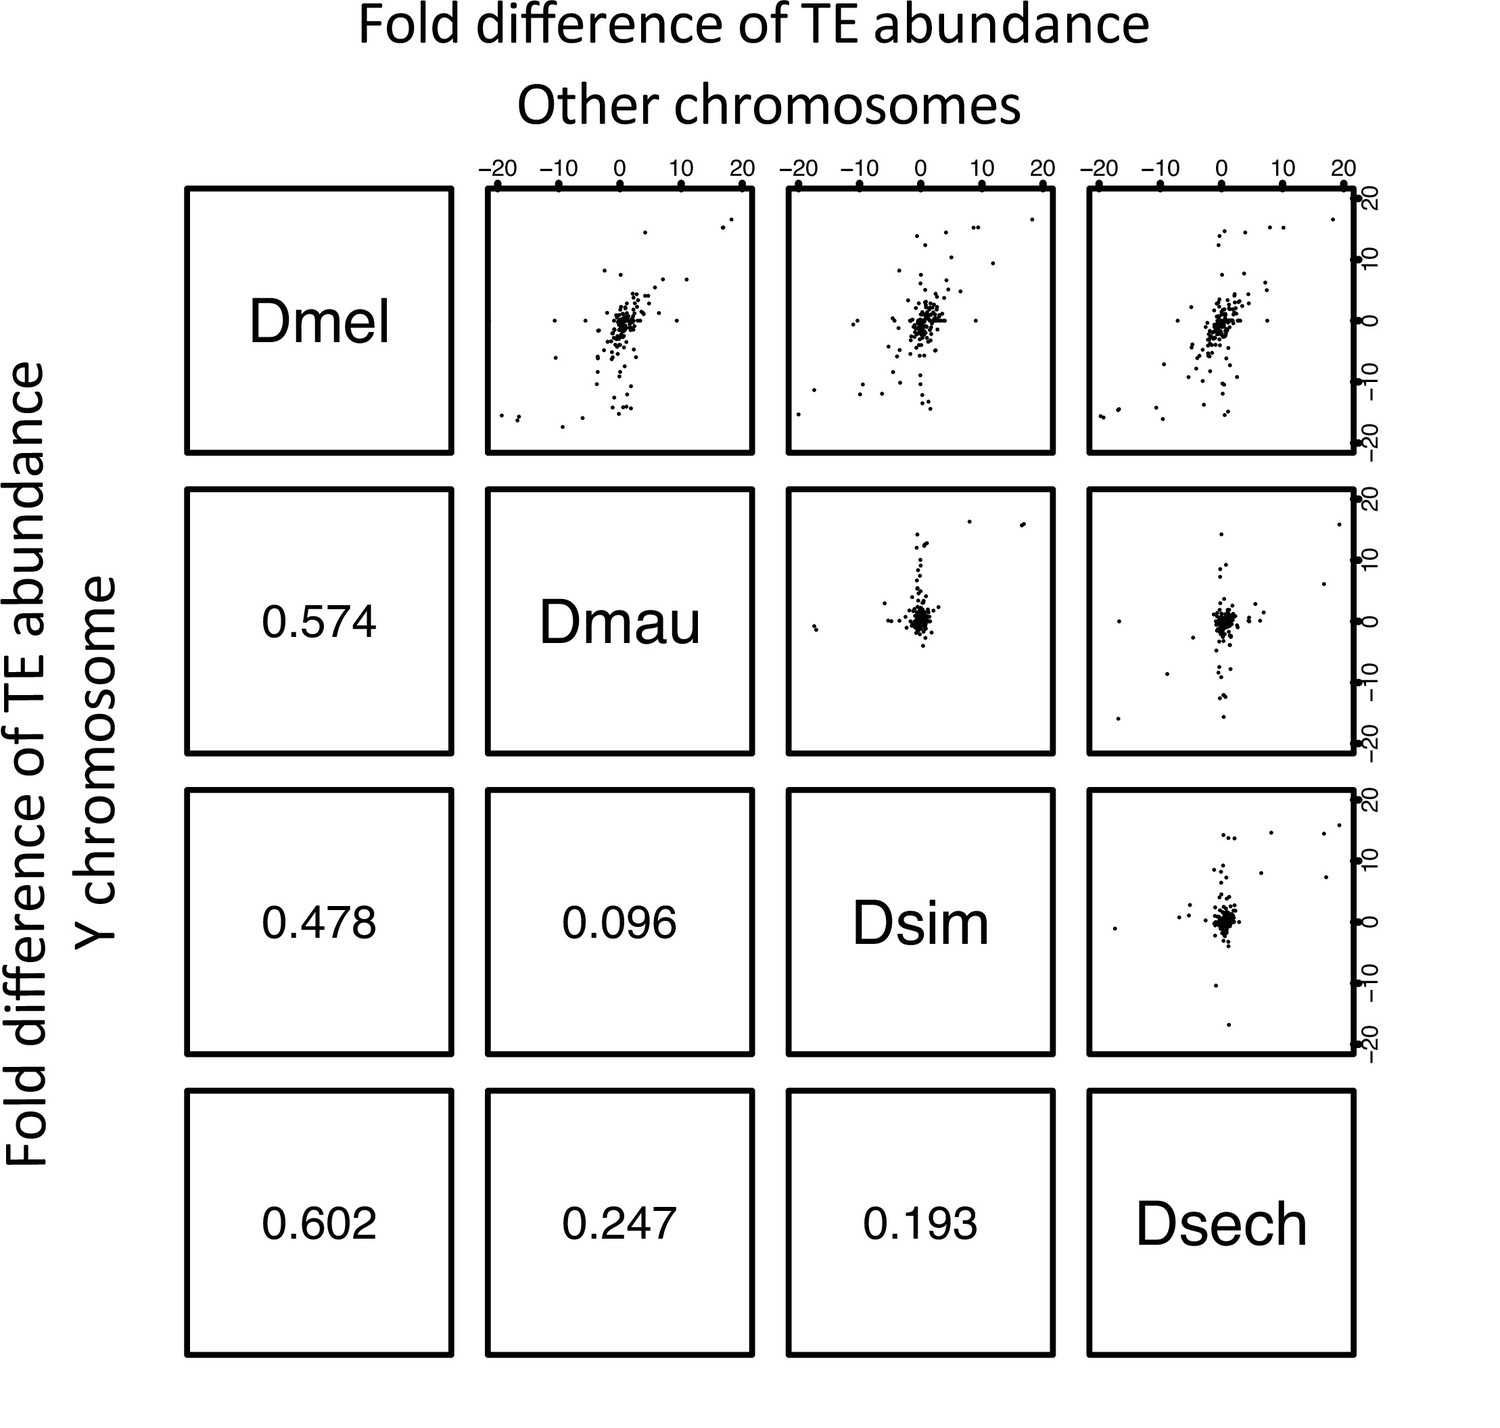
The correlation of TE abundance between Y chromosomes and other chromosomes of D. melanogaster and the D. simulans clade.
We calculated the fold changes of TE occupying sites (bp) between species by chromosomes. Each point from the figures above the diagonal represents the changes of a TE element on the Y chromosome and the other (non-Y) chromosomes. The number below the diagonal shows Spearman’s rank correlation coefficient for each comparison.
Figure 7—figure supplement 3
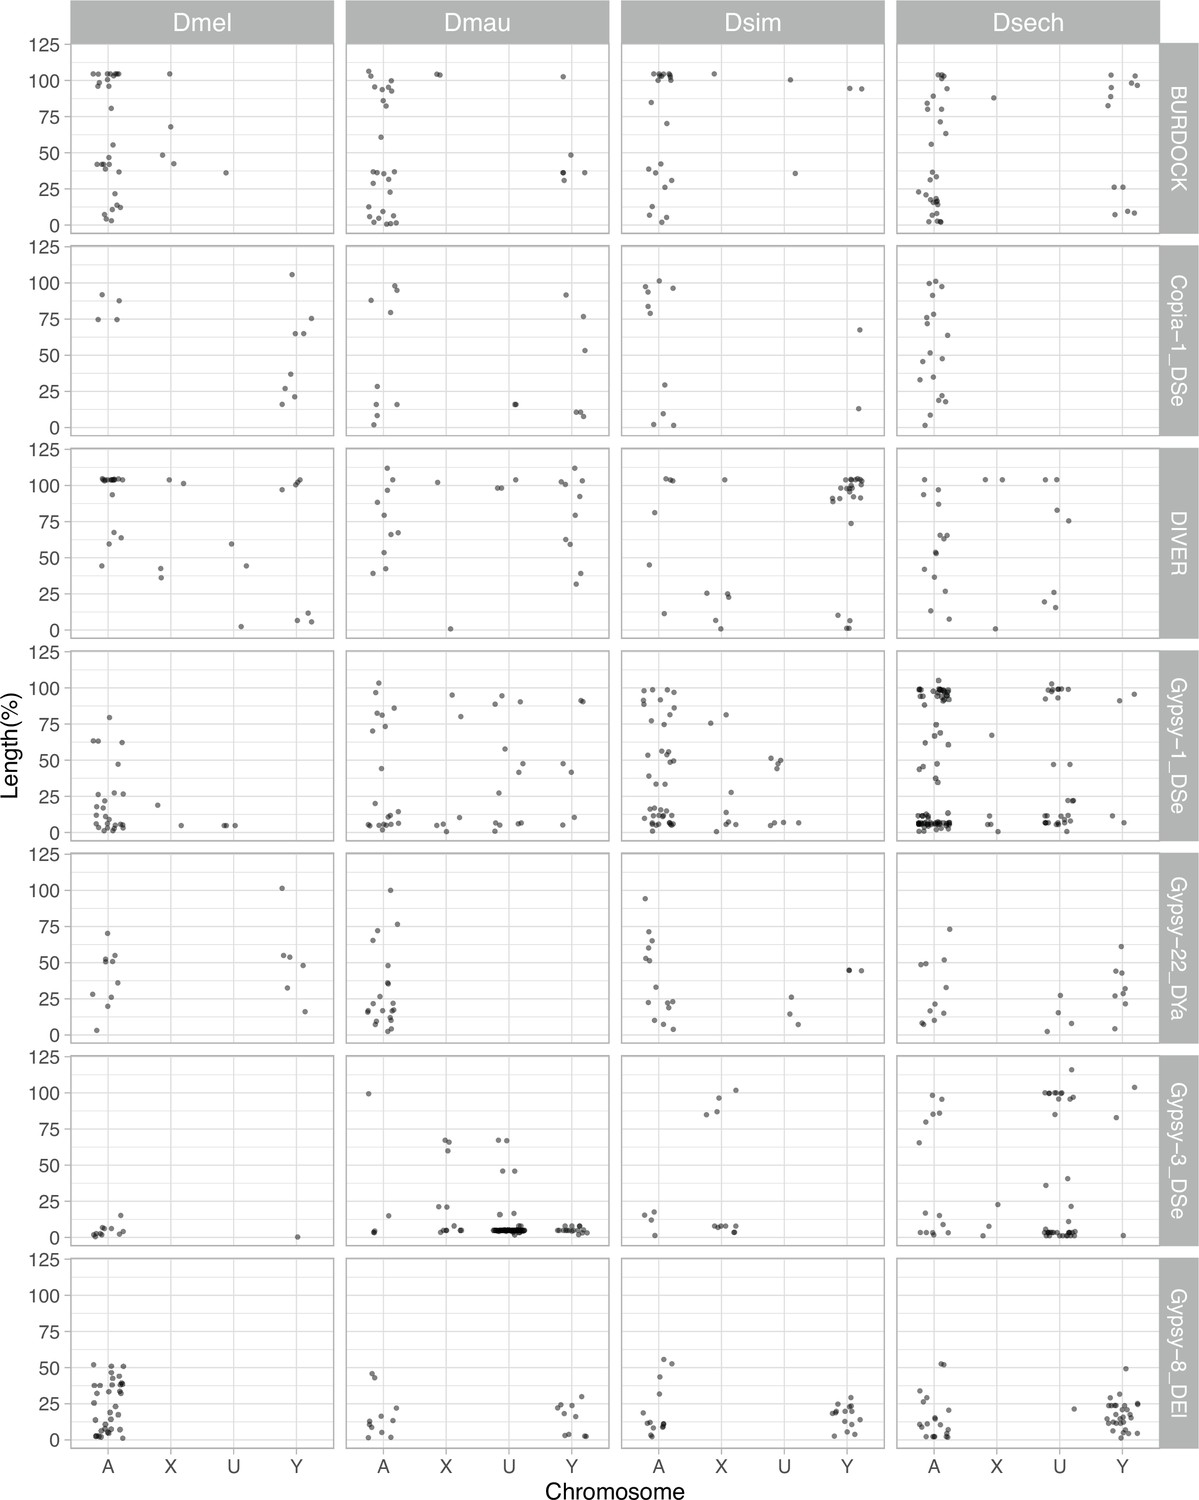
The length of LTR retrotransposons between Y chromosomes and other chromosomes of D. melanogaster and the D. simulans clade.
We surveyed the length of LTR retrotransposons across chromosomes (A: autosomes, X: X chromosome, U: unknown location and Y: Y chromosome). The length of elements is normalized by the length of consensus from full-length elements and represents the ages of each LTR retrotransposon.
Tables
Table 1
Table 2
PAML analyses reveal positive selection on Y-linked ampliconic gene families.
| Lhk | Branch test with CodonFreq = 0 | Branch-site test site class | |||||||||||
|---|---|---|---|---|---|---|---|---|---|---|---|---|---|
| ω1 | ω2 | ω3 | L | 2∆lnL | LRT’s P | ω0 | ω1 | ω2a | ω2b | 2∆lnL | LRT’s P | Positively selected sites (BEB > 0.95)* | |
| one ω | 0.17 | –3250.74 | |||||||||||
| two ω† | 0.11 | 1.05 | –3218.26 | 64.94 | 7.71E-16 | 0.01 | 1 | 4.87 | 4.87 | 13.04 | 3.05E-04 | I4, H11, V32, V75, N99, Y100, D193, D199 | |
| three ω‡ | 0.11 | 1.49 | 0.43 | –3216.30 | 3.92 | 0.05 | |||||||
| CK2ßtes | |||||||||||||
| one ω | 0.35 | –3295.01 | |||||||||||
| two ω§ | 0.25 | 1.05 | –3272.00 | 46.01 | 1.18E-11 | 0.05 | 1 | 2.21 | 2.21 | 6.54 | 1.06E-02 | D33, T38, K44, K100, F101, K104, M152, M155 | |
| three ω‡ | 0.20 | 0.42 | 1.05 | –3266.33 | 11.35 | 7.56E-04 | |||||||
-
*
See Supplementary files 12 and 14 for all sites.
-
†
Autosomal and Y lineage have protein evolution of ω1 and ω2, respectively.
-
‡
See Supplementary files 12 and 14, Figure 6—figure supplement 1 and Figure 6—figure supplement 3 for the assignment of lineages.
-
§
Autosomal and sex chromosomal (X and Y) have protein evolution of ω1 and ω2, respectively.
Additional files
-
Supplementary file 1
The copy number of exons in conserved Y-linked genes.
We listed the copy number of each exon in conserved Y-linked genes based on BLAST results.
- https://cdn.elifesciences.org/articles/75795/elife-75795-supp1-v2.xlsx
-
Supplementary file 2
The estimates of sensitivity and specificity of our Y-linked sequence assignment methods using 10 kb regions with known chromosomal location.
We calculated the median female-over-male coverage in our Illumina data in every 10 kb region with known chromosomal location. We then estimated the sensitivity and specificity of our methods using these data.
- https://cdn.elifesciences.org/articles/75795/elife-75795-supp2-v2.xlsx
-
Supplementary file 3
Probe and primer information.
- https://cdn.elifesciences.org/articles/75795/elife-75795-supp3-v2.xlsx
-
Supplementary file 4
The genomic location of duplicated exons in conserved Y-linked genes.
We listed the genomic location of each exon in conserved Y-linked genes in our assemblies based on BLAST results.
- https://cdn.elifesciences.org/articles/75795/elife-75795-supp4-v2.xlsx
-
Supplementary file 5
The intron length of all conserved Y-linked genes across species.
We showed the length of each Y-linked exon in all conserved Y-linked genes based on BLAST results. If there are multiple copies of an exon, we choose the copy with a complete open reading frame and the highest expression level.
- https://cdn.elifesciences.org/articles/75795/elife-75795-supp5-v2.xlsx
-
Supplementary file 6
The abundance of simple repeats in Illumina reads from male flies estimated with kseek and from our genome assemblies.
We used kseek to measure the relative abundance of simple repeats in our Illumina reads. We also used TRF finder to calculate repeat contents in our assemblies. We compared the two results and picked probes for our FISH experiments.
- https://cdn.elifesciences.org/articles/75795/elife-75795-supp6-v2.xlsx
-
Supplementary file 7
Recent Y-linked duplications in D. melanogaster and species in the D. simulans clade.
We list information on the recent Y-linked duplications and genes, including copy numbers, expression levels, phylogenies, and open reading frames. We also included some duplications from repetitive regions where we can date their origins.
- https://cdn.elifesciences.org/articles/75795/elife-75795-supp7-v2.xlsx
-
Supplementary file 8
Enriched GO terms in Y-linked duplicated genes in D. melanogaster and the D. simulans clade.
We identified GO terms associated with genes that recently duplicated to the Y chromosome listed in Supplementary file 7 using PANTHER (Released 20190711; [163]). We listed all GO terms significantly enriched in the duplication (FDR < 0.05).
- https://cdn.elifesciences.org/articles/75795/elife-75795-supp8-v2.xlsx
-
Supplementary file 9
The summary of conserved Y-linked genes and ampliconic genes expression.
We summarized the expression level of conserved Y-linked genes and ampliconic genes. We sum up the gene expression for genes with multiple duplicated copies on Y chromosomes.
- https://cdn.elifesciences.org/articles/75795/elife-75795-supp9-v2.xlsx
-
Supplementary file 10
The number of small RNA reads mapped to the repetitive sequences and Y-linked gene families in the D. simulans clade.
- https://cdn.elifesciences.org/articles/75795/elife-75795-supp10-v2.xlsx
-
Supplementary file 11
Gene conversion rates for Y-linked ampliconic genes in the D. simulans clade.
We listed the gene conversion rates and gene similarities on each Y-linked ampliconic gene family (e.g., Lhk-1, Lhk-2, and CK2ßtes-Y). We estimated gene conversion rates using both gene similarities (p) and population recombination rates (Rmin and rho).
- https://cdn.elifesciences.org/articles/75795/elife-75795-supp11-v2.xlsx
-
Supplementary file 12
PAML results for branch and branch-site model analyses of Lhk in the D. simulans clade.
We showed raw results and LRT tests for branch and branch-site model analyses from PAML. We also report rates of protein evolution for each branch in each model and sites under positive selection in the branch-site model analyses.
- https://cdn.elifesciences.org/articles/75795/elife-75795-supp12-v2.xlsx
-
Supplementary file 13
The number of new mutations observed in highly and lowly expressed copies of Y-linked gene families.
We list the number of synonymous, nonsynonymous and UTR changes in highly and lowly expressed copies of Y-linked genes families. We suggest that highly expressed copies evolve under stronger selection (positive or purifying) than other copies. Therefore, we compared the number of synonymous changes over nonsynonymous changes in highly expressing copies to the other copies. See Supplementary file 21 for detailed information.
- https://cdn.elifesciences.org/articles/75795/elife-75795-supp13-v2.xlsx
-
Supplementary file 14
PAML results for branch and branch-site model analyses of CK2ßtes-Y in the D. simulans clade.
We showed raw results and LRT tests for branch and branch-site model analyses from PAML. We also report rates of protein evolution for each branch in each model and sites under positive selection in the branch-site model analyses.
- https://cdn.elifesciences.org/articles/75795/elife-75795-supp14-v2.xlsx
-
Supplementary file 15
Indels in Y-linked duplications in D. melanogaster and the D. simulans clade.
We listed the position and sizes of all indels we found in Y-linked duplications. We also inferred the potential microhomologies used for MHEJ repairing. We also infer other DSB repairing mechanisms, including tandem duplications and replication slippages, based on the sequence information.
- https://cdn.elifesciences.org/articles/75795/elife-75795-supp15-v2.xlsx
-
Supplementary file 16
Polymorphic indels in D. melanogaster and D. simulans populations.
We listed the position and sizes of polymorphic indels from D. melanogaster and D. simulans populations. We also inferred the potential microhomologies causing the deletions.
- https://cdn.elifesciences.org/articles/75795/elife-75795-supp16-v2.xlsx
-
Supplementary file 17
Repeat composition across chromosomes in D. melanogaster and the D. simulans clade.
We list the composition of LTR retrotransposon, LINE, DNA transposons, satellite, simple repeats, rRNA, and other repeats across every chromosome in our assemblies.
- https://cdn.elifesciences.org/articles/75795/elife-75795-supp17-v2.xlsx
-
Supplementary file 18
The detail of repetitive sequences across chromosomes in D. melanogaster and the D. simulans clade.
We list the total sequence length from each transposon or complex repeat on Y-linked contigs/scaffolds and other contigs/scaffolds in our assemblies.
- https://cdn.elifesciences.org/articles/75795/elife-75795-supp18-v2.xlsx
-
Supplementary file 19
The Illumina coverage and blast result for each contig in the D. simulans clade.
We used Blast v2.7.1+ [135] with blobtools (v1.0; [136]) to search the nt database (parameters “-task megablast -max_target_seqs 1 -max_hsps 1 -evalue 1e-25”). We estimated the Illumina coverage of each contig in males of D. mauritiana, D. simulans and D. sechellia, respectively.
- https://cdn.elifesciences.org/articles/75795/elife-75795-supp19-v2.xlsx
-
Supplementary file 20
The summary of reads data used in this study.
- https://cdn.elifesciences.org/articles/75795/elife-75795-supp20-v2.xlsx
-
Supplementary file 21
The information and read coverage of each SNP in Y-linked gene families from Illumina reads.
We listed the coverage of each SNP in Y-linked gene from each RNA-seq replicate and DNA-seq. We also recorded their frequency in our assembly and their translated amino acid. We estimated the expression level of each variant based on the SNP frequency in the genome. We also performed Welch’s t-test to compare SNP frequency from DNA-seq and assemblies to it from RNA-seq. We further identify the SNPs associated with the allele that change more than 5 TPM compared to its estimated expression level from its frequency. The SNPs significant in the Welch’s t-test and located in lowly or highly expressing alleles are chosen to perform the Chi-square test.
- https://cdn.elifesciences.org/articles/75795/elife-75795-supp21-v2.xlsx
-
Transparent reporting form
- https://cdn.elifesciences.org/articles/75795/elife-75795-transrepform1-v2.docx
Download links
A two-part list of links to download the article, or parts of the article, in various formats.
Downloads (link to download the article as PDF)
Open citations (links to open the citations from this article in various online reference manager services)
Cite this article (links to download the citations from this article in formats compatible with various reference manager tools)
Unique structure and positive selection promote the rapid divergence of Drosophila Y chromosomes
eLife 11:e75795.
https://doi.org/10.7554/eLife.75795


