Genetically controlled mtDNA deletions prevent ROS damage by arresting oxidative phosphorylation
- Centre for Integrative Genetics, Department of Animal and Aquacultural Sciences, Norwegian University of Life Sciences, Norway
- Department of Chemistry and Molecular Biology, University of Gothenburg, Sweden
- State Key Laboratory of Oncology in South China, Collaborative Innovation Center for Cancer Medicine, Guangdong Key Laboratory of Nasopharyngeal Carcinoma Diagnosis and Therapy, Sun Yat-sen University Cancer Center, China
- Université Côte d’Azur, CNRS, INSERM, IRCAN, France
- Department of Biology and Biological Engineering, Chalmers University of Technology, Sweden
- Department of Circulation and Medical Imaging, Cardiac Exercise Research Group, Norwegian University of Science and Technology, Norway
Figures
Figure 1 with 2 supplements
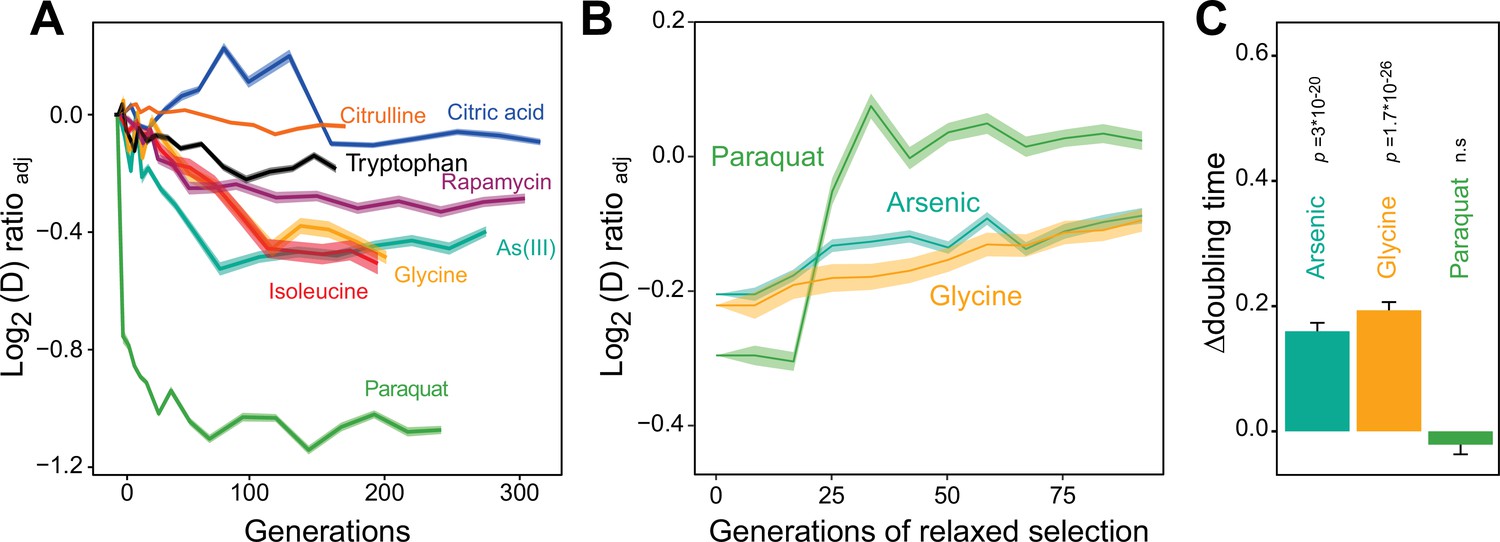
Distinct adaptation to paraquat.
(A) Mean temporal adaptive response to paraquat and seven other stressors. y-axis shows log2 fold reduction in cell doubling time (h) from pre-stress, adjusting for plate, position and pre-culture effects. 96 populations for each stressor (n=6). Shade: S.E.M. (B) Loss of the acquired adaptation as a function of number of cell generations after release from the selection pressure. Colored lines: mean of 96 populations (each measured at n=5). Shade: S.E.M. The populations were released from stress after reaching 70–90% of their endpoint (t50) adaptation. (C) The difference in cell doubling time (h) in a no-stress environment between 96 populations (each measured at n=5) having achieved 70–90% of their endpoint adaptation to paraquat, arsenic and glycine, respectively, and the founder population. The difference reflects the selective advantage of losing the acquired adaptations when the populations are no longer exposed to stress. p-values: one-sided t-test. Error bars: S.E.M. See also Figure 1—figure supplements 1 and 2.
-
Figure 1—source data 1
Doubling time data of 96 populations adapted to each of eight different environments over G generations; doubling times are in the respective selection environment.
Data are shown in Figure 1A and Figure 6D.
- https://cdn.elifesciences.org/articles/76095/elife-76095-fig1-data1-v2.xlsx
-
Figure 1—source data 2
Difference in doubling time in absence of stress and in the respective selection environment, for adapted populations having achieved 70-90% of their final adaptation.
Data are shown in Figure 1C.
- https://cdn.elifesciences.org/articles/76095/elife-76095-fig1-data2-v2.xlsx
-
Figure 1—source data 3
Doubling time data of 96 populations adapted to paraquat, arsenic and glycine over Gs generations and then released from selection for Gr generations; doubling times are in paraquat, arsenic, and glycine, respectively.
Data are shown in Figure 1B.
- https://cdn.elifesciences.org/articles/76095/elife-76095-fig1-data3-v2.xlsx
Figure 1—figure supplement 1
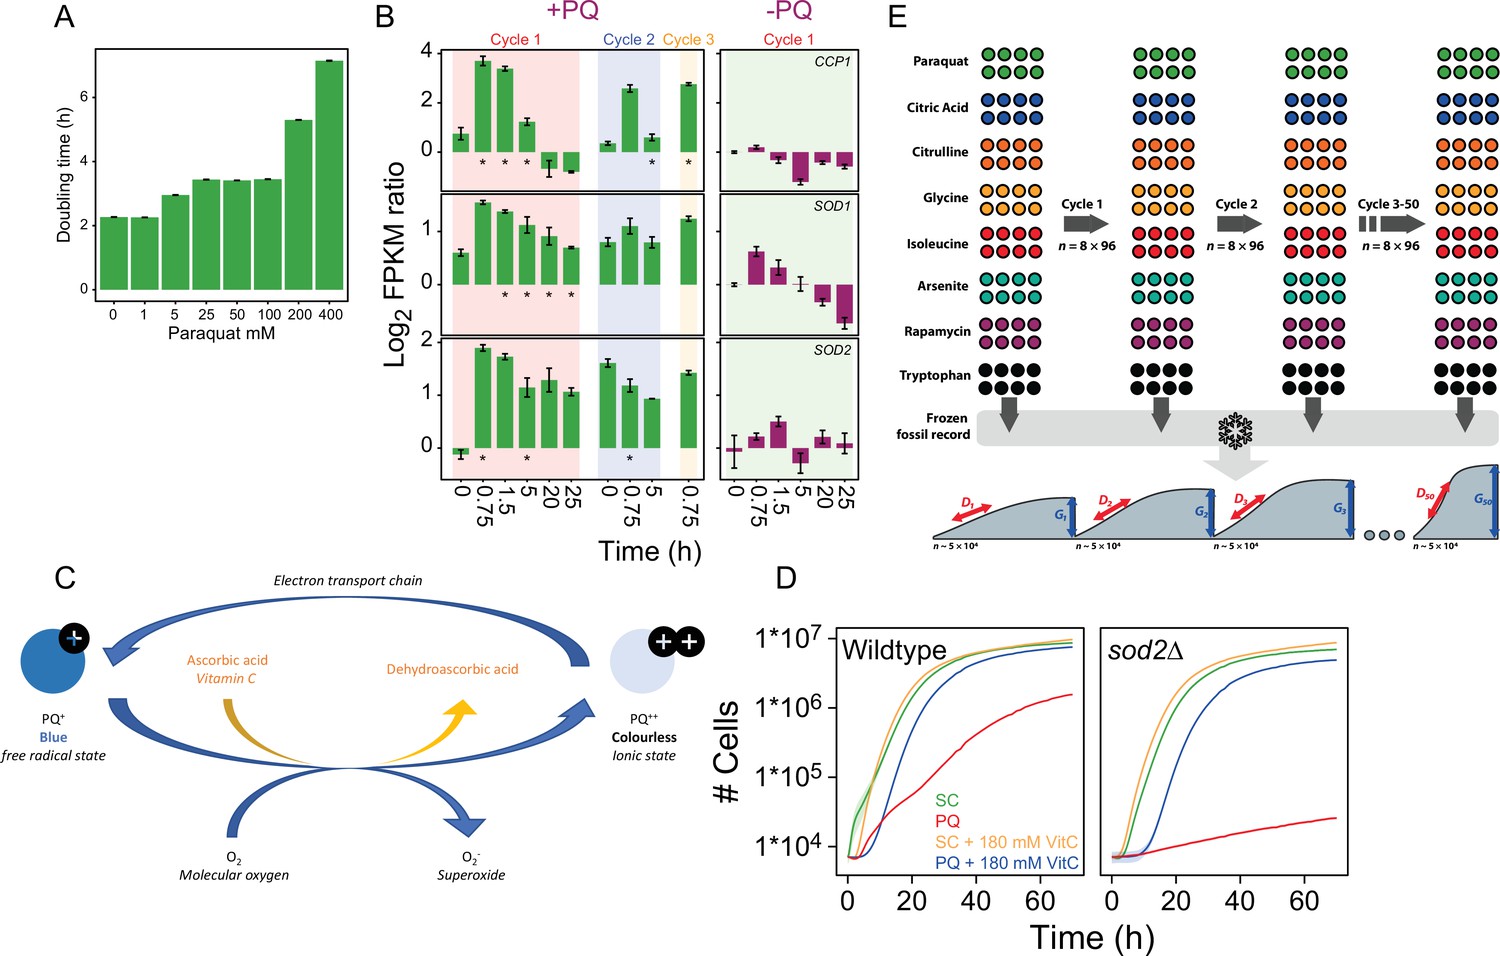
Titration of the paraquat (PQ) dose and design of adaptation experiment.
(A) Mean doubling time of wildtype yeast cell populations grown with and w/o (0-400 μg/mL) of paraquat. Error bars: S.E.M. (n=122-144). (B) Left panel: Color columns show the mRNA expression (FPKM; Fragments Per Kilobase Million) of CCP1, SOD1, and SOD2, during the first, second, and third growth cycle in the presence of 400 μg/mL paraquat. Note that the cells have not yet been exposed to paraquat at time, t=0 in Cycle 1. Right panel: mRNA expression in the founder population in a paraquat-free growth medium. x-axis: time (h) in each growth cycle. y-axis: Expression values are shown as a log2 ratio in relation to expression in a paraquat-free medium at t=0. Error bars: S.E.M (n=3). * = significant (Wald test, FDR q=0.05) difference. (C) Schematic representation of how vitamin C counters paraquat toxicity. Outside cells, paraquat remain in the colorless ionic Pq2+ state. Upon cellular and mitochondrial uptake, Pq2+ accepts electrons from OXPHOS complex III and assumes the damaging Pq+ free radical form, which turn cells slightly blue. Pq+ donates an electron to O2, forming O2∙− while resuming the Pq2+ state. When present, vitamin C, accepts electrons from Pq+, preventing it from generating O-2. This shifts paraquat back to the colourless Pq2+ state. Vitamin C may also accept electrons from the O2∙− that is formed, further reducing the intracellular pool of O2∙−. (D) Growth (mean) of wildtype (left panel; n=96) and sod2Δ (right panel; n=96) yeast cell populations in the absence and presence of 400 μg/mL of paraquat and/or 180mM of the antioxidant ascorbic acid. Shade=S.E.M. (E) Design of adaptation experiment. We adapted 96 initially homogeneous, asexually reproducing, haploid yeast populations to paraquat ( stress) and seven non-mitochondrial challenges (Supplementary file 1) over 50 growth cycles (t1-t50). Populations were maintained as an array of 96 colonies on solid agar medium in which the stressor had been imbedded. Each growth cycle corresponded to 72 h of growth from lag to stationary phase, in which ~5x10⁴ cells were subsampled to seed the next growth cycle. We stored subsamples from the end of batch cycles 0-5, 7, 9, 12, 15, 20, 25, 30, 35, 40, 45, and 50 of all 96 populations as a frozen record. We revived and reanalyzed these (n=6) in a randomized design to accurately capture the adaptation kinetics for 768 populations. We counted cells in each population at 20 min intervals and extracted cell doubling times, (D), from the mid-exponential phase and estimated cell generations, (G), as the number of population doublings from the start to end of each batch cycle. We extracted cell doubling times, (D), and log2 normalized these to those of many founder controls, Dnorm. We subtracted the Dnorm before stress exposure, Dnorm,0, to estimate the doubling time adaptation achieved, which is annotated as Log2 (D) ratioadj.
-
Figure 1—figure supplement 1—source data 1
FPKM data of selected oxidative defense genes, obtained from RNA-sequencing of cells exposed to paraquat.
Data are shown in Figure 1—figure supplement 1.
- https://cdn.elifesciences.org/articles/76095/elife-76095-fig1-figsupp1-data1-v2.xlsx
-
Figure 1—figure supplement 1—source data 2
Doubling time data of WT, mip1Δ and sod2Δ populations, with and without paraquat and with and without vitamin C.
Data are shown in Figure 1—figure supplement 1.
- https://cdn.elifesciences.org/articles/76095/elife-76095-fig1-figsupp1-data2-v2.xlsx
-
Figure 1—figure supplement 1—source data 3
Doubling time data of WT in different concentrations of paraquat.
Data are shown in Figure 1—figure supplement 1A.
- https://cdn.elifesciences.org/articles/76095/elife-76095-fig1-figsupp1-data3-v2.xlsx
Figure 1—figure supplement 2
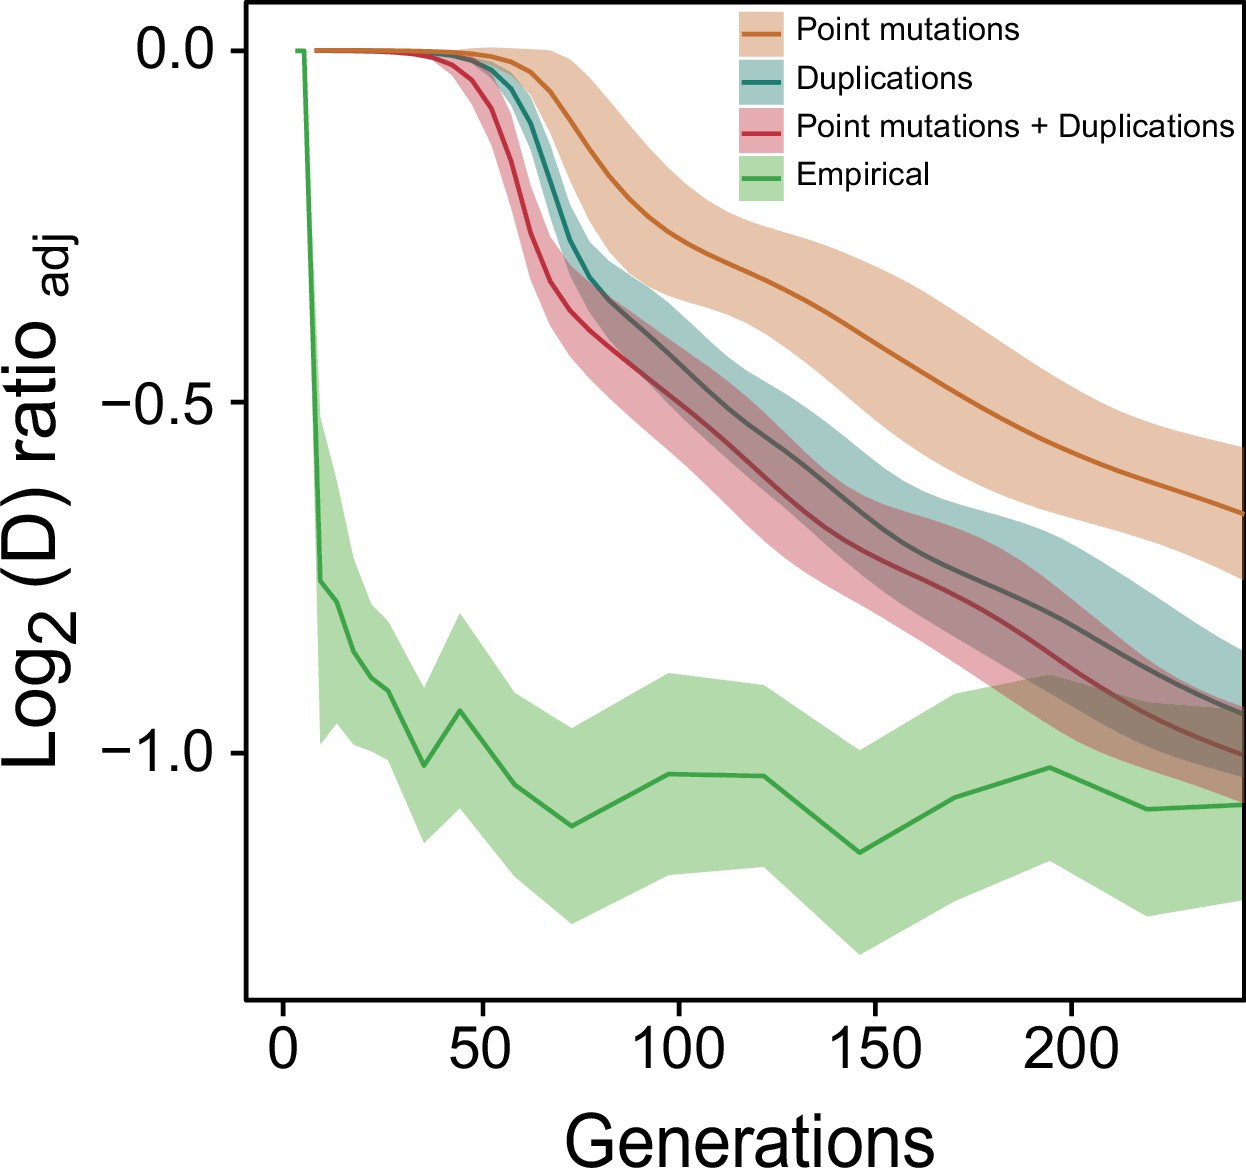
Comparison of predicted paraquat adaptation with the experimental data.
The experimental adaptation data (green) on 96 populations (each measured at n=6) are the same as in Figure 1. The three prediction graphs generated by the numerical model are each based on 1152 replicate runs. Shade: S.D.
-
Figure 1—figure supplement 2—source data 1
Doubling time data for the BY4741 single gene deletion collection under paraquat exposure; used as input for simulations in Figure 1—figure supplement 2.
- https://cdn.elifesciences.org/articles/76095/elife-76095-fig1-figsupp2-data1-v2.xlsx
-
Figure 1—figure supplement 2—source data 2
Doubling time data of disomic strains growing in paraquat; used as input for simulations in Figure 1—figure supplement 2.
- https://cdn.elifesciences.org/articles/76095/elife-76095-fig1-figsupp2-data2-v2.xlsx
Figure 2 with 1 supplement
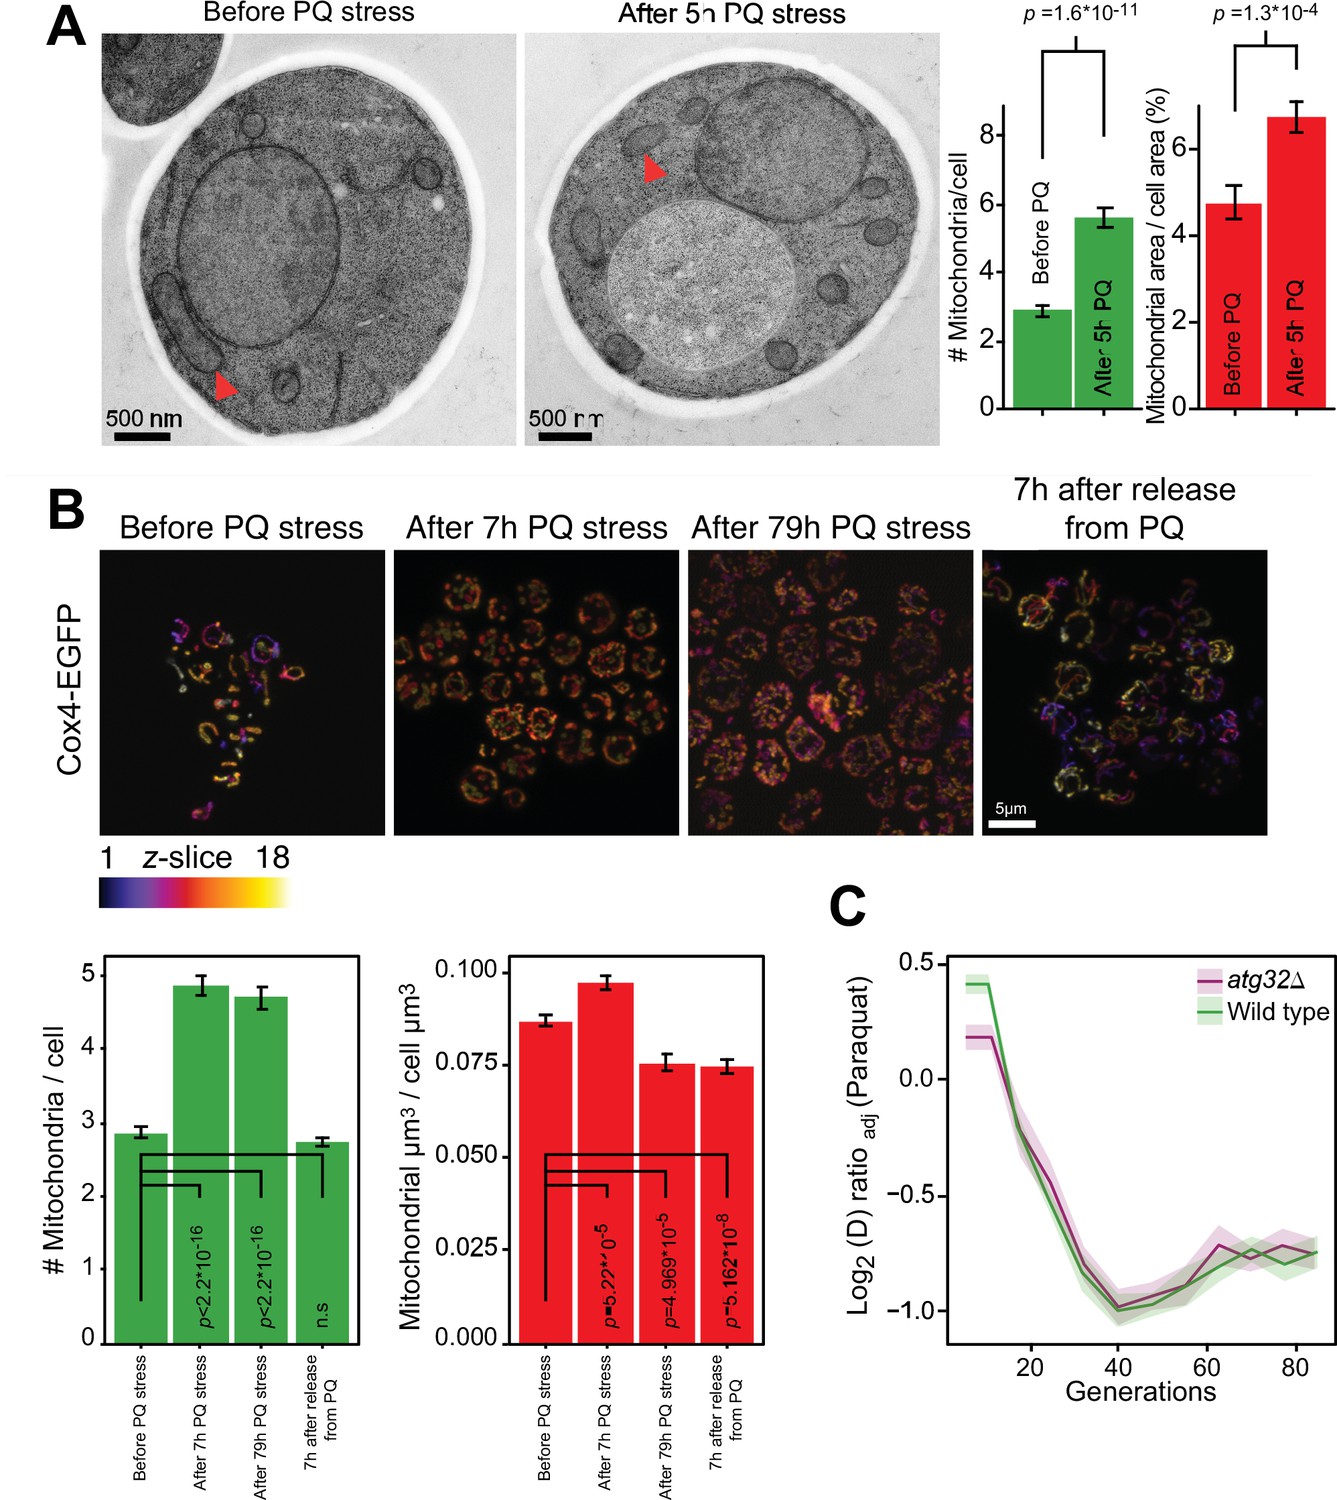
Mitochondrial fragmentation precedes the swift adaptation to paraquat (PQ).
(A) EM microscopy of cells before (panel 1) and after short-term stress (panel 2, red arrowheads mark representative mitochondria). Panel 3 shows the number of mitochondria per imaged cell (left) and the imaged cell area occupied by mitochondrial area (%) (right), used as proxy for mitochondrial volume. Error bars: S.E.M. (n=100 cells). p-values: Welch two-sided t-test. (B) Confocal microscopy of cells with a Cox4-GFP mitochondrial tag. Color: z-dimension (yellow = front, purple = back; 18 slices). Lower left diagram: Number of mitochondria per imaged cell. Lower right diagram: Mean sum of mitochondrial volume as a fraction of cell volume. Error bars: S.E.M. (n=473–910 cells). p-values: Welch two-sided t-test (C) Adaptation of atg32Δ and wild-type populations to paraquat. Shade: S.E.M. (n=16 populations, each measured at n=6). See also Figure 2—figure supplement 1.
-
Figure 2—source data 1
Mitochondrial and cell area quantified, based on electron microscopy micrographs.
Data are shown in Figure 2A.
- https://cdn.elifesciences.org/articles/76095/elife-76095-fig2-data1-v2.xlsx
-
Figure 2—source data 2
Number of mitochondria quantified, based on electron microscopy micrographs.
Data are shown in Figure 2A.
- https://cdn.elifesciences.org/articles/76095/elife-76095-fig2-data2-v2.xlsx
-
Figure 2—source data 3
Number and volume of mitochondria of cells segmented from confocal microscopy micrographs of cells exposed to paraquat.
Data are shown in Figure 2B and in Figure 2—figure supplement 1.
- https://cdn.elifesciences.org/articles/76095/elife-76095-fig2-data3-v2.xlsx
-
Figure 2—source data 4
Doubling time data of wild type and populations adapting to paraquat over generations G; doubling times are in paraquat.
Data are shown in Figure 2C.
- https://cdn.elifesciences.org/articles/76095/elife-76095-fig2-data4-v2.xlsx
Figure 2—figure supplement 1
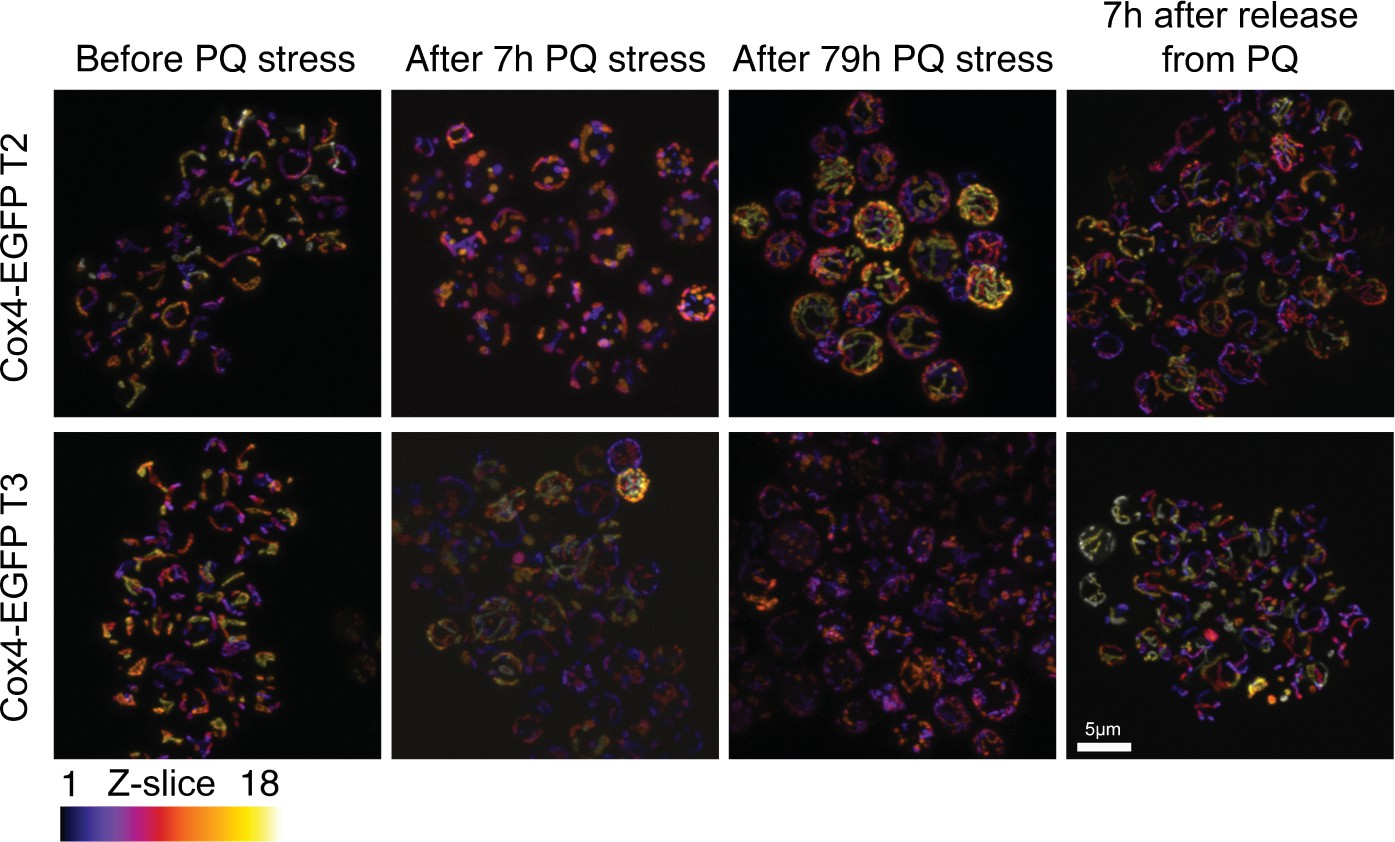
Paraquat (PQ) stress leads to rapid mitochondrial fragmentation.
(A) Confocal microscopy of yeast cells with a Cox4-GFP inner mitochondrial membrane marker. Panels show cells before PQ exposure, after 7 hr of exposure, after exposure over one growth cycle (72 hr+7 hr), and 7 hr after release from two growth cycles under PQ stress. Color: z-dimension (yellow = front, black = back), samples were sliced in 18 slices with the first slice being closest to the camera. Two Cox4-EGFP transformants, isolated independently from the one in Figure 2B, are shown.
Figure 3 with 3 supplements
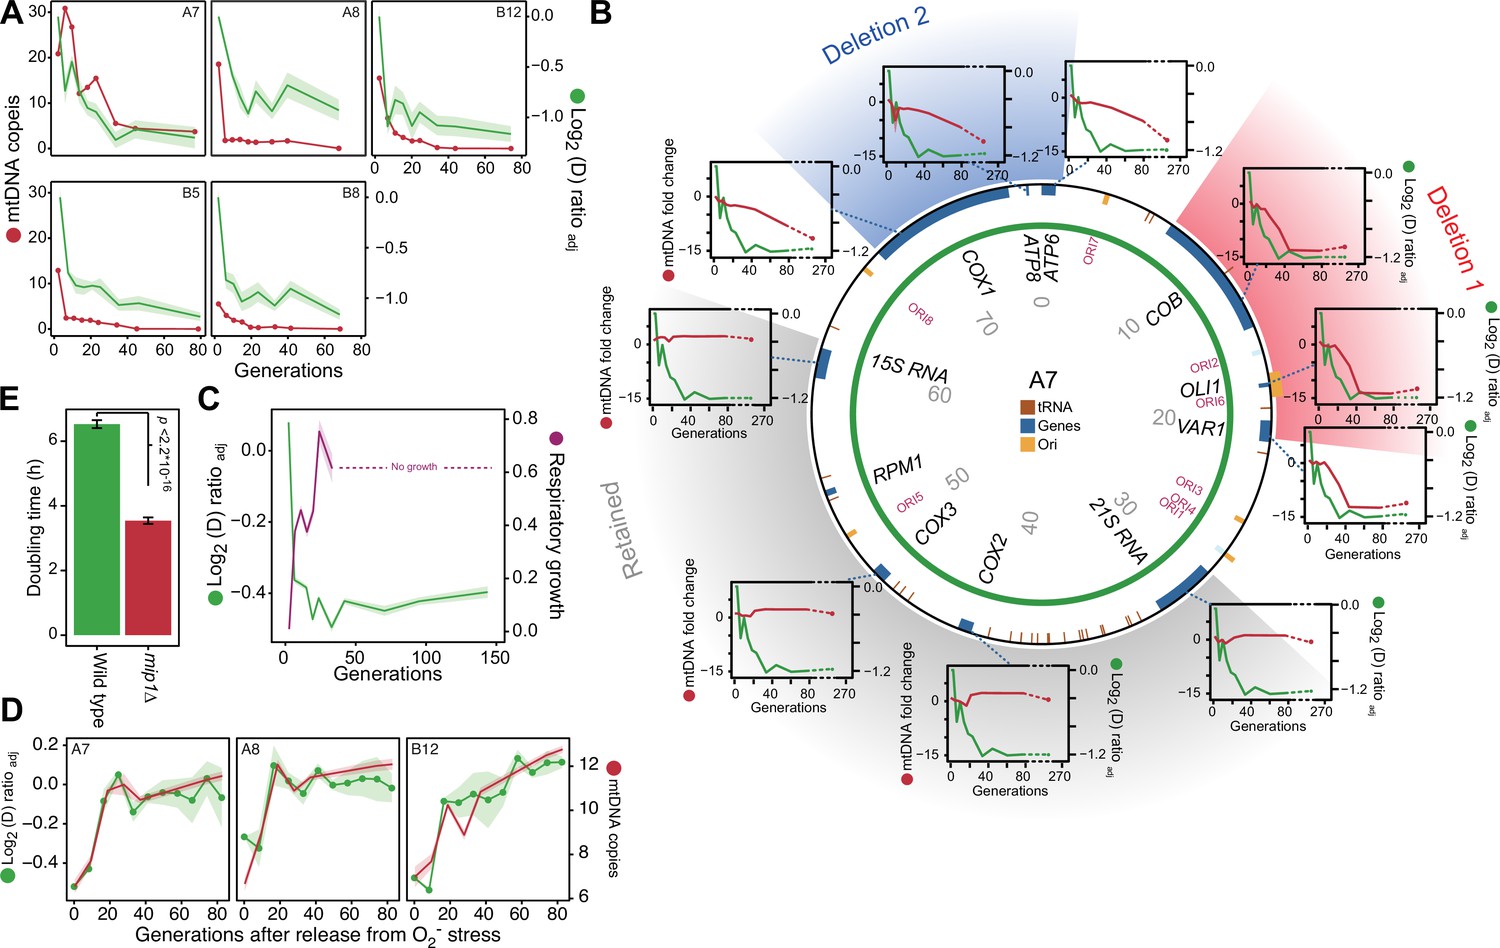
mtDNA editing causes the early adaptation to paraquat.
(A) mtDNA copy number change (left y-axis, red line, median coverage relative to the haploid nuclear genome) during paraquat adaptation (right y-axis, green line, n=6) for 5 populations (panels). Shade: S.E.M. (B) mtDNA deletions associate with the paraquat adaptation. Circle: mtDNA (77 kb) before exposure to paraquat. Genes, origins of replication and position (kb) are indicated. Coloured fields: mtDNA deletions with concerted copy number change. Diagrams: mtDNA copy number change (left y-axis, purple line) of individual mtDNA genes during adaptation (right y-axis, green line) in population A7. Shade: S.E.M. (n=3). (C) The early-phase paraquat adaptation coincides with the loss of respiratory (glycerol) growth. Shade: S.E.M. 96 populations, each measured at n=5. Broken line indicates no growth (cell doubling time >24 h). (D) Recovery of the copy number of deleted mtDNA (right y-axis, red line) after release from 6 generations of paraquat exposure coincides with loss of the early-phase paraquat adaptation (left y-axis, green line, shade = S.E.M (n=15)) in populations A7, A8, and B12. (E) Doubling time (h) of wild type and mip1Δ cell populations in paraquat. Error bars: S.E.M. (n=191). p-values: Welch two-sided t-test. See also Figure 3—figure supplements 1–3.
-
Figure 3—source data 1
Doubling time data of 96 populations adapted to paraquat for G generations exposed; doubling times are in paraquat and respiratory media (glycerol).
Data are shown in Figure 3C.
- https://cdn.elifesciences.org/articles/76095/elife-76095-fig3-data1-v2.xlsx
-
Figure 3—source data 2
Mean log2 coverage of 1 kb windows spanning the mitochondrial genome of five sequenced paraquat adapting populations over generations G of selection.
Data are shown in Figure 3A.
- https://cdn.elifesciences.org/articles/76095/elife-76095-fig3-data2-v2.xlsx
-
Figure 3—source data 3
Mean log2 coverage of 1 kb windows spanning the mitochondrial genome of sequenced populations adapting to paraquat and then released from this selection; data is given as a function of generations G of relaxation of selection.
Data are shown in Figure 3D and in Figure 3—figure supplement 2C.
- https://cdn.elifesciences.org/articles/76095/elife-76095-fig3-data3-v2.xlsx
-
Figure 3—source data 4
qPCR data for mitochondrial DNA genes and nuclear DNA controls over generations of paraquat adaptation.
Data are shown in Figure 3B and Figure 3—figure supplement 1.
- https://cdn.elifesciences.org/articles/76095/elife-76095-fig3-data4-v2.xlsx
Figure 3—figure supplement 1
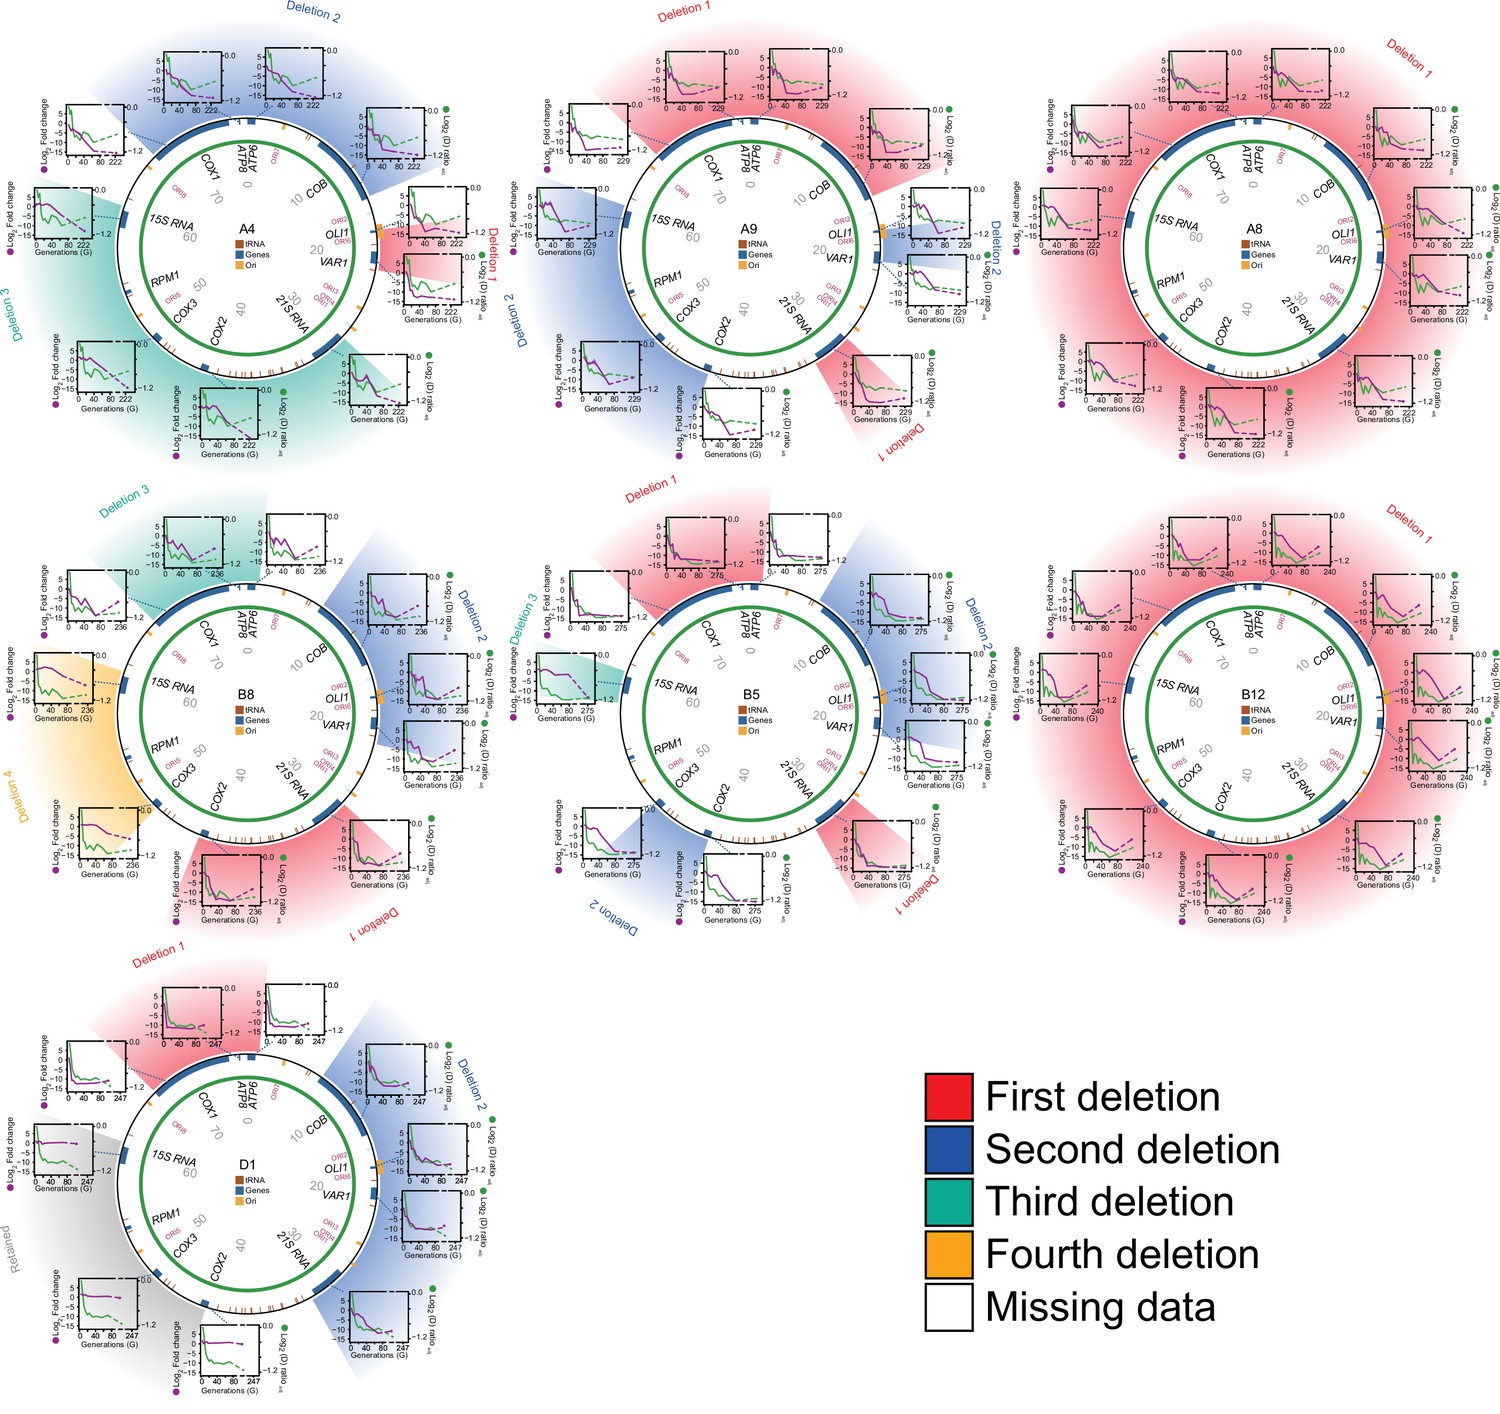
Editing of mtDNA during the early adaptation to paraquat.
Circle: mtDNA (77 kB) before exposure to paraquat stress, with genes, known origins of replication and position (numbers) indicated. Diagrams: mtDNA copy number (left y-axis, qPCR, purple line) of each protein and rRNA encoding gene, and the associated temporal adaptation profile (right y-axis, adjusted log2(D) ratio relative to founder, green line), in populations A4, A9, A8, B8, B5, B12, and D1. Error bars: S.E.M. (n=2). Colored fields describe concomitant copy number.
Figure 3—figure supplement 2
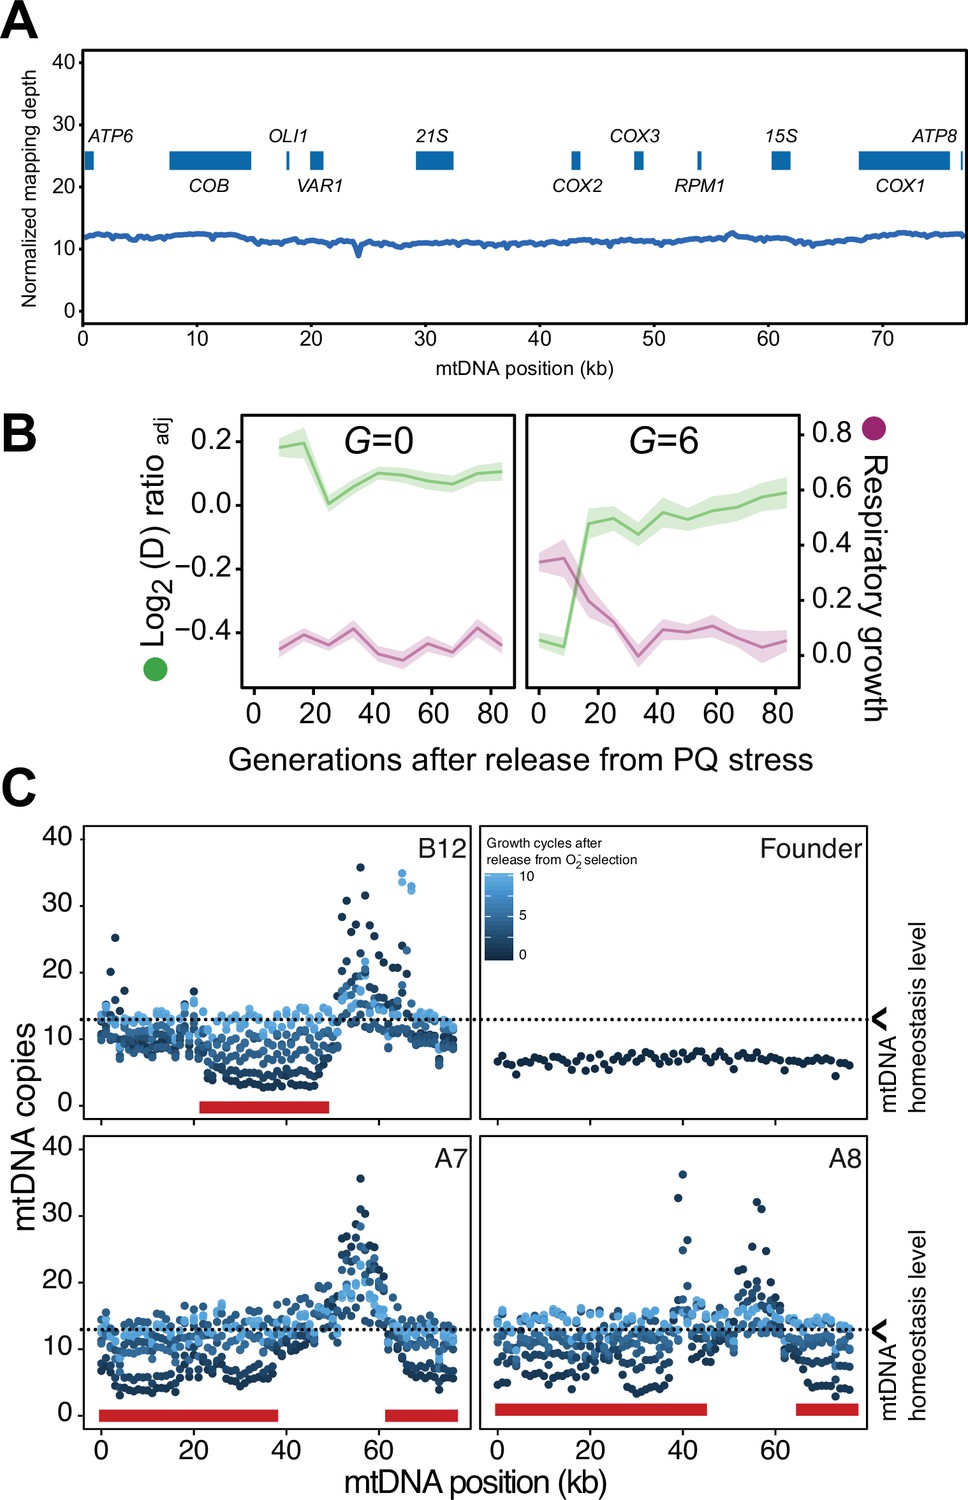
Homeostatic restoration of mtDNA copy numbers and ability for respiration after release from paraquat (PQ) stress.
(A) mtDNA copy numbers at pre-adaptation levels. y-axis, median mtDNA coverage, in 0.5 kb windows, relative to that of the haploid nuclear genome. x-axis: nucleotide position. Data is from long read sequencing. (B) Respiratory (glycerol) growth (right y-axis, purple line, log2 doubling time relative to founder), and loss of adaptation (left y-axis, green line), in cell populations not exposed to paraquat (G=0) (left panel, founder) and cell populations exposed to 6 generations of paraquat exposure (right panel) and then released from this selection over G generations (x-axis) of growth in absence of paraquat. The mean of five cell populations (A7, A8, B5, B8, and B12; same as in Figure 3A), each measured at n=5, is shown. Shade: S.E.M. (C) Recovery of mtDNA copy numbers (y-axis, median coverage in 1 kb windows relative to the euploid nuclear genome) in cell populations released from six generations of paraquat exposure (dot color: growth cycles after release from paraquat). Red bars: positions of mtDNA deletions.
-
Figure 3—figure supplement 2—source data 1
Doubling time data of populations adapted to paraquat for Gs generations and then released from selection for Gr generations; doubling times are in paraquat and respiratory media (glycerol).
Data are shown in Figure 3—figure supplement 2B and Figure 6A.
- https://cdn.elifesciences.org/articles/76095/elife-76095-fig3-figsupp2-data1-v2.xlsx
Figure 3—figure supplement 3
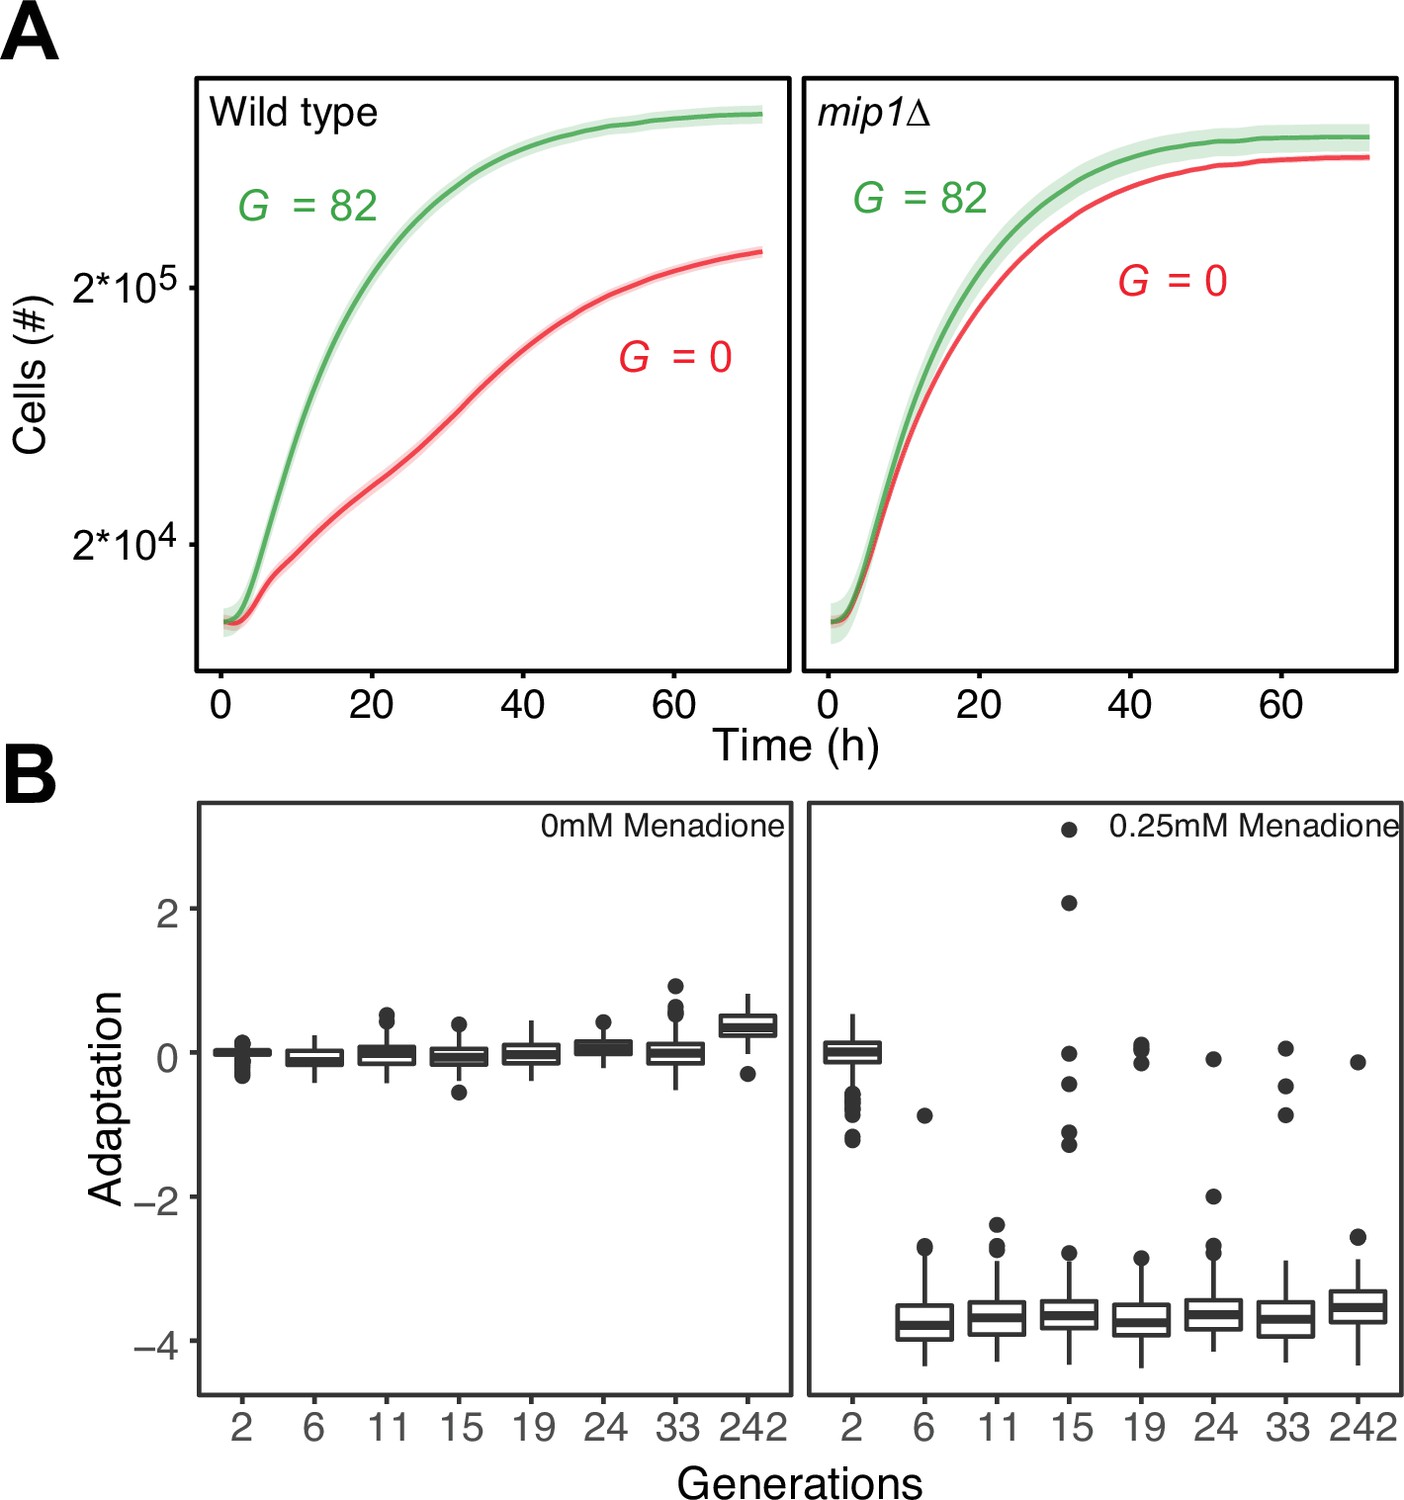
Control of paraquat resistance through mtDNA deletions.
(A) Comparisons of the growth of wild type (mean of n=64 populations; left panel) and mip1Δ (mean of n=24 populations; right panel) cells on paraquat (400 μg/mL), before and after 10 growth cycles (mean=82 generations) of adaptation to paraquat. Shade: S.E.M across cell populations (each measured at n=3). (B) Cell doubling time (log2 doubling time relative to wildtype) in presence of menadione (0.25 mM) as a function of generations of adaptation to paraquat (400 μg/mL). Boxplot shows median (horizontal line), interquartile range (box), 95% confidence interval (whiskers) and outliers (dots) of n=96 cell populations, each measured at n=1.
-
Figure 3—figure supplement 3—source data 1
Doubling time data of 96 populations adapted over G generations to paraquat; doubling times are in 0 and 0.25 mM of menadione.
Data are shown in Figure 3—figure supplement 3B.
- https://cdn.elifesciences.org/articles/76095/elife-76095-fig3-figsupp3-data1-v2.xlsx
Figure 4 with 1 supplement

The mtDNA editing critically involves Sod2.
(A) Doubling time (h) in wild type (400 µg/mL paraquat: green), sod2Δ (12.5 µg/mL paraquat: red; 50 µg/mL paraquat: yellow) and sod1Δ (12.5 µg/mL paraquat: blue) cell populations adapting to equivalent stress levels. (B) mtDNA change in sod2Δ cell populations 2E, 4E, 9C, and 3C adapting to 50 µg/mL paraquat. Circle: mtDNA (77 kb) before exposure to paraquat. Genes, origins of replication and nucleotide positions (kb) are indicated. Colored fields: mtDNA deletions with concerted copy number change. Diagrams: mtDNA copy number change left y-axis, purple line, (n=2) of individual mtDNA genes during the adaptation (right y-axis, green line). Shade: S.E.M. (C) Mean growth of wild type (n=480; green), mip1Δ (n=288; red), sod2Δ (n=96; purple), and sod2Δmip1Δ (n=384; blue) cell populations in the presence of 400 µg/mL (left) and 50 µg/mL (right) paraquat. See also Figure 4—figure supplement 1.
-
Figure 4—source data 1
Doubling time data of wild type, sod2∆, and sod1∆ populations adapting to paraquat; doubling times are in paraquat.
Data are shown in Figure 4A and B and in Figure 4—figure supplement 1B.
- https://cdn.elifesciences.org/articles/76095/elife-76095-fig4-data1-v2.xlsx
-
Figure 4—source data 2
Growth curves of populations of mip1∆sod2∆, mip1∆, sod2∆, and wild type exposed to paraquat.
Data are shown in Figure 4C.
- https://cdn.elifesciences.org/articles/76095/elife-76095-fig4-data2-v2.xlsx
-
Figure 4—source data 3
qPCR data for mitochondrial DNA genes and nuclear DNA controls in sod2Δ populations over generations of paraquat adaptation.
Data are shown in Figure 4B and in Figure 4—figure supplement 1B.
- https://cdn.elifesciences.org/articles/76095/elife-76095-fig4-data3-v2.xlsx
Figure 4—figure supplement 1
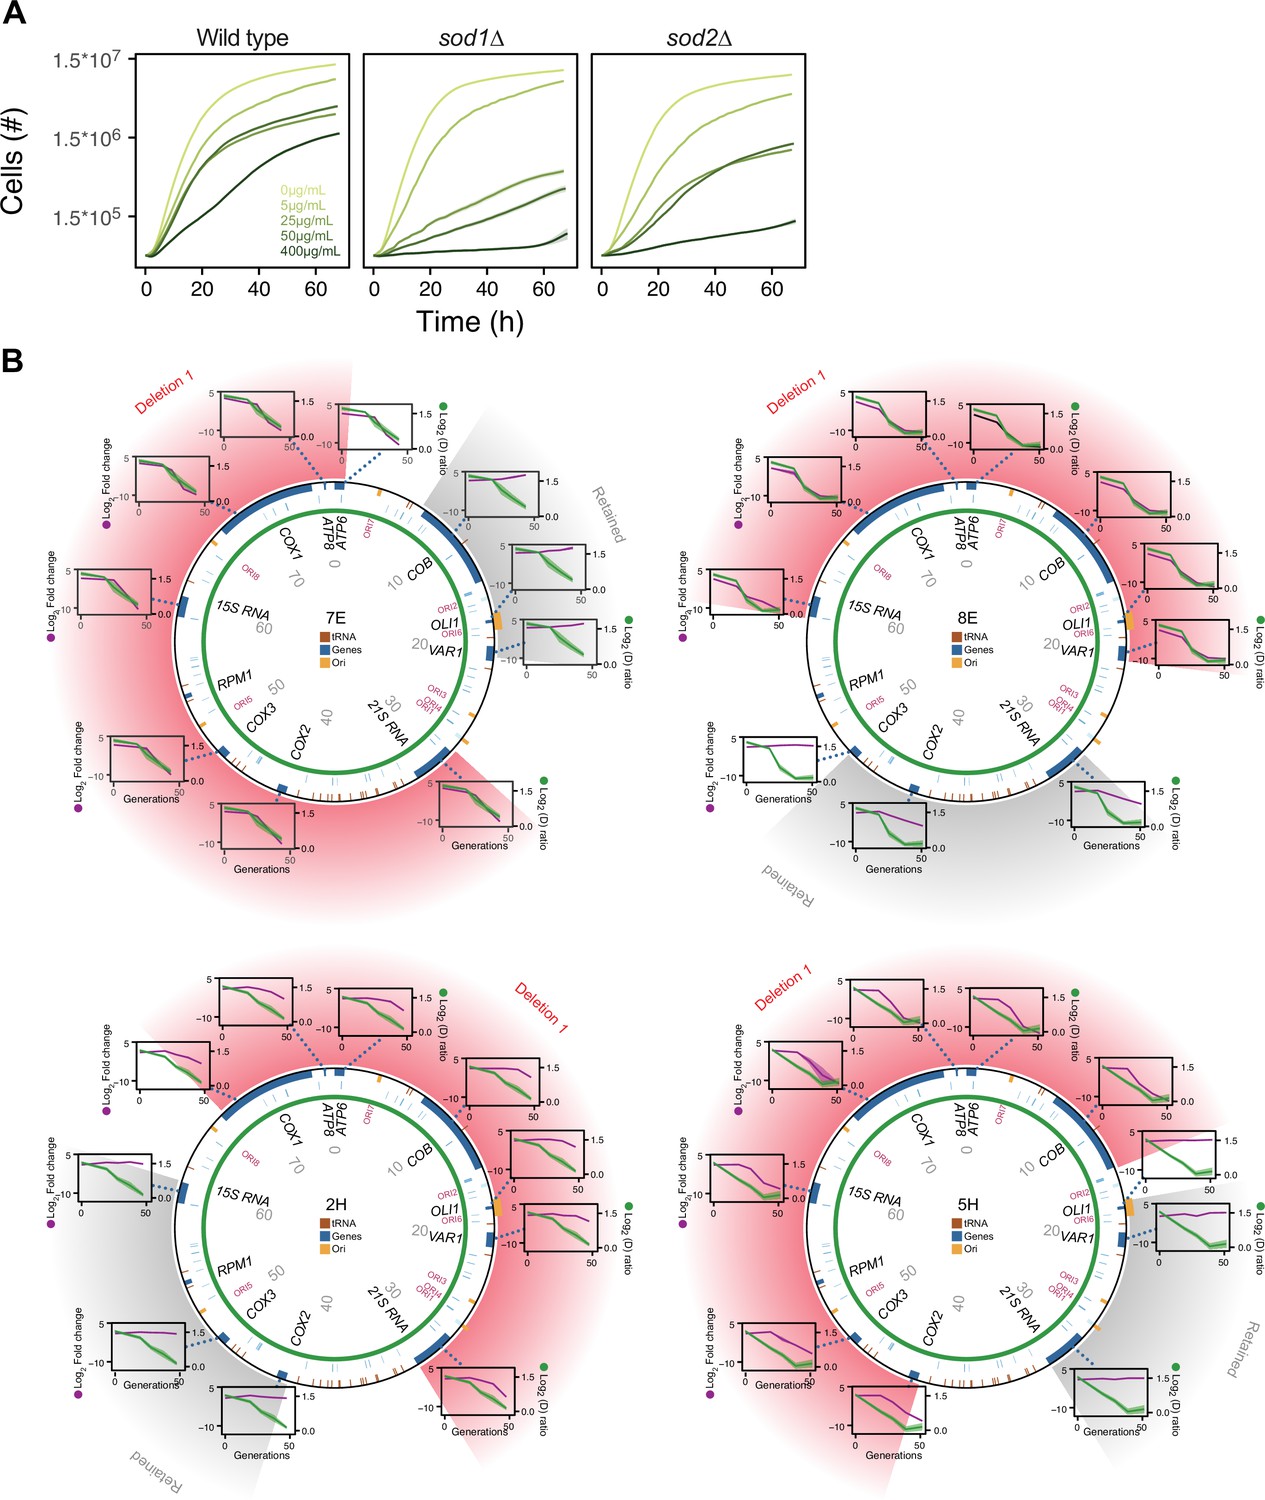
The mtDNA deletion process critically involves Sod2, but not Sod1.
(A) Comparison of the growth of wild type (left), sod1Δ (center), and sod2Δ (right) cell populations in increasing (color intensity) doses of paraquat. Shade: S.E.M. (n=96). (B) mtDNA deletions in four sod2Δ cell populations adapting to 12.5 μg/mL of paraquat. Circle: mtDNA (77 kb) before paraquat exposure. Genes, origins of replication and nucleotide positions (kb) are indicated. Colored fields describe mtDNA deletions with concomitant copy number change. Diagrams: mtDNA copy number change left y-axis, purple line, (n=2) of individual mtDNA genes during adaptation to paraquat (right y-axis, green line) in sod2Δ cell populations 7E, 8E, 2H, and 5H. Shade: S.E.M.
-
Figure 4—figure supplement 1—source data 1
Mean growth curves of wild type, sod1Δ, and sod2Δ and wild type exposed to different concentrations of paraquat.
Data are shown in Figure 4—figure supplement 1A.
- https://cdn.elifesciences.org/articles/76095/elife-76095-fig4-figsupp1-data1-v2.xlsx
Figure 5
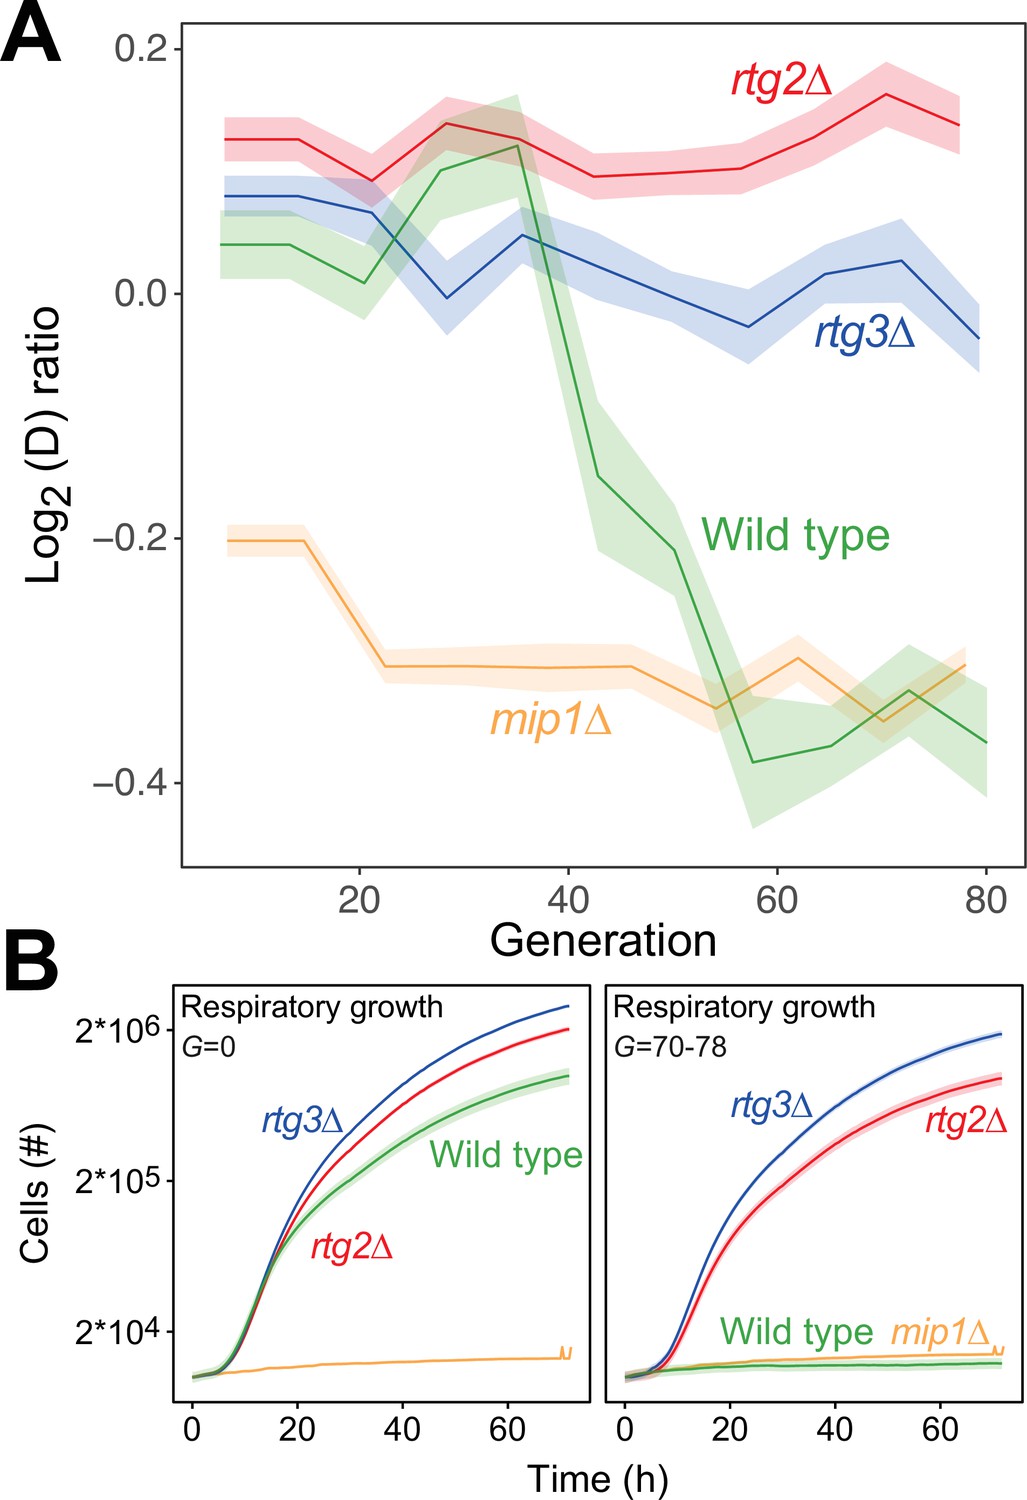
The mtDNA editing critically involves anterograde mito-nuclear communication.
(A) Doubling time adaptation of 18 wild type, rtg2Δ, rtg3Δ, and mip1Δ cell populations to 400 µg/mL of paraquat. Shade: S.E.M. Each population type measured at n=4. (B) Respiratory (glycerol) growth of wild type, rtg2Δ, rtg3Δ, and mip1Δ cell populations, before (left) and after (right) 70–78 generations of paraquat adaptation. Shade: S.E.M (n=72–144 populations, each measured at n=1).
-
Figure 5—source data 1
Doubling time data of wild type, rtg2∆, rtg3∆, and mip1Δ populations adapting to paraquat; doubling times are in paraquat.
Data are shown in Figure 5A.
- https://cdn.elifesciences.org/articles/76095/elife-76095-fig5-data1-v2.xlsx
-
Figure 5—source data 2
Growth curves of wild type, rtg2∆, rtg3∆, and mip1Δ, adapted and not adapted to paraquat; doubling times are in respiratory media (glycerol).
Data are shown in Figure 5B.
- https://cdn.elifesciences.org/articles/76095/elife-76095-fig5-data2-v2.xlsx
Figure 6 with 5 supplements
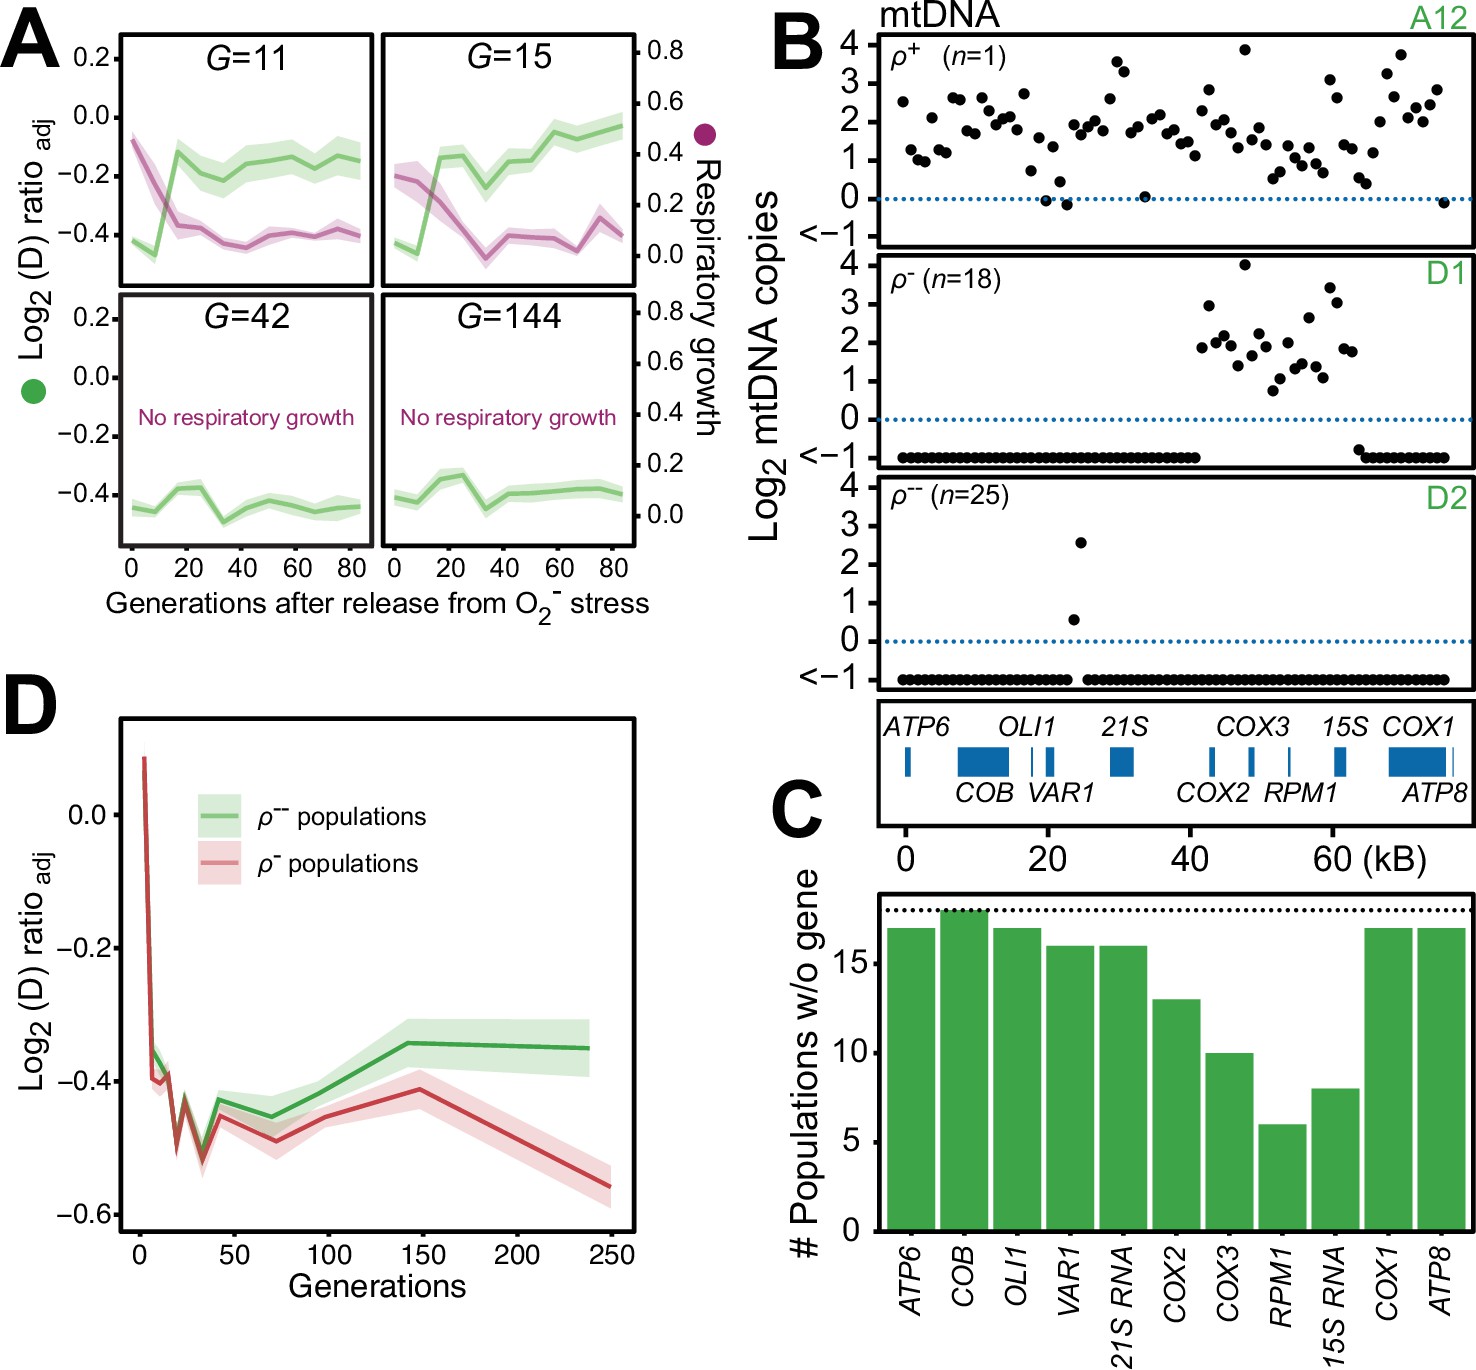
Chronic exposure to paraquat causes irreversible mitochondrial impairment by sustained mtDNA editing.
(A) Paraquat adapting cell populations (G=generations of exposure to paraquat) ultimately lose their capacity to recover respiratory (glycerol) growth (right y-axis, purple line, log2 doubling time relative to founder) and the loss coincides with the genetic fixation of the paraquat adaptation (left y-axis, green line). Shade: S.E.M. of 5 populations, each measured at n=5. (B) All but one (ρ+) sequenced cell population adapted to long-term paraquat stress (t50) retain only small (6–30 kb; ρ-) or very small (<2 kb, ρ--) mtDNA segments. Panels: Representative populations. y-axis: mtDNA copy number (median coverage in 1 kb windows relative to haploid nuclear genome). Gene positions are indicated. (C) Number of ρ- populations after long-term paraquat exposure (t50) in which the specified mtDNA gene was lost. (D) The ρ-- populations became less fit than the ρ- populations during a long-term exposure to paraquat. See also Figure 6—figure supplements 1–5.
-
Figure 6—source data 1
Mean log2 coverage of 1 kb windows spanning the mitochondrial genome of each sequenced paraquat adapted endpoint population.
Data are shown in Figure 6B and C, Figure 6—figure supplement 2A and Figure 6—figure supplement 4B.
- https://cdn.elifesciences.org/articles/76095/elife-76095-fig6-data1-v2.xlsx
Figure 6—figure supplement 1
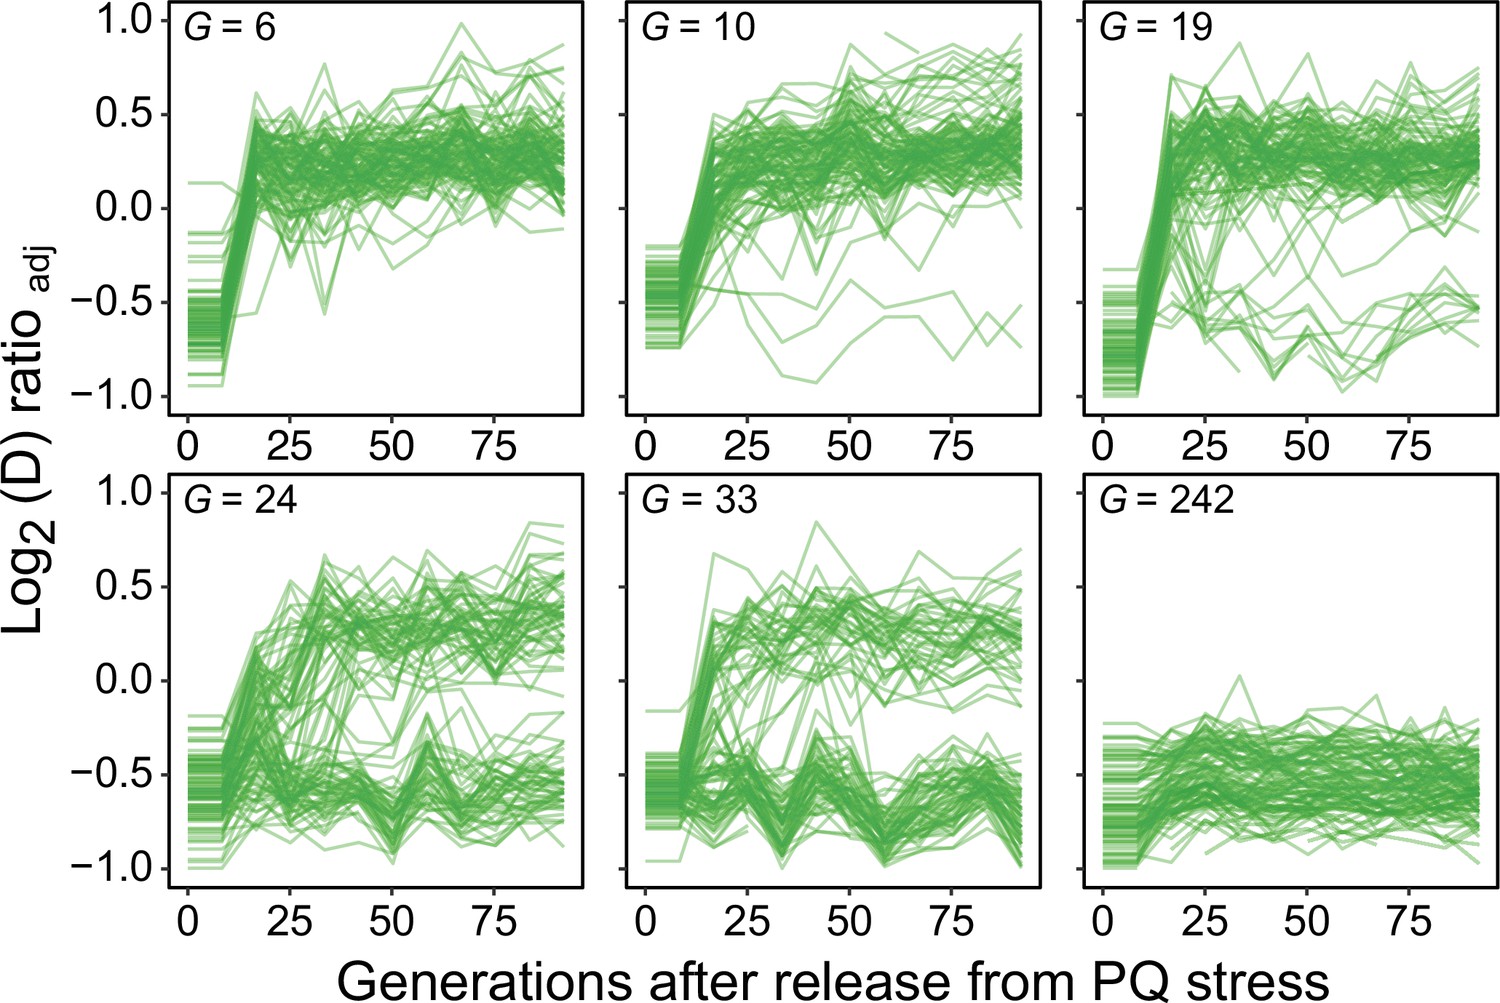
Long-term exposure to paraquat causes genetic fixation of adaptation.
We released 96 populations from paraquat exposure after 6, 10, 19, 24, 33, and 242 generations (means) of adaptation (panels), and by re-exposing the populations to paraquat after a given number of generations of growth on a paraquat-free medium we could monitor the fraction of populations where the paraquat adaptation had become genetically fixed. Lines: 96 populations (each measured at n=5). Note that after six generations of adaptation, all populations rapidly lose their acquired paraquat adaptation, implying no genetic fixation, while after 242 generations the adaptation has become genetically fixed in all populations.
-
Figure 6—figure supplement 1—source data 1
Doubling time data of 96 populations adapted to paraquat for Gs generations, followed by release from this selection over Gr generations; doubling times on paraquat.
Data are shown in Figure 6—figure supplement 1.
- https://cdn.elifesciences.org/articles/76095/elife-76095-fig6-figsupp1-data1-v2.xlsx
Figure 6—figure supplement 2
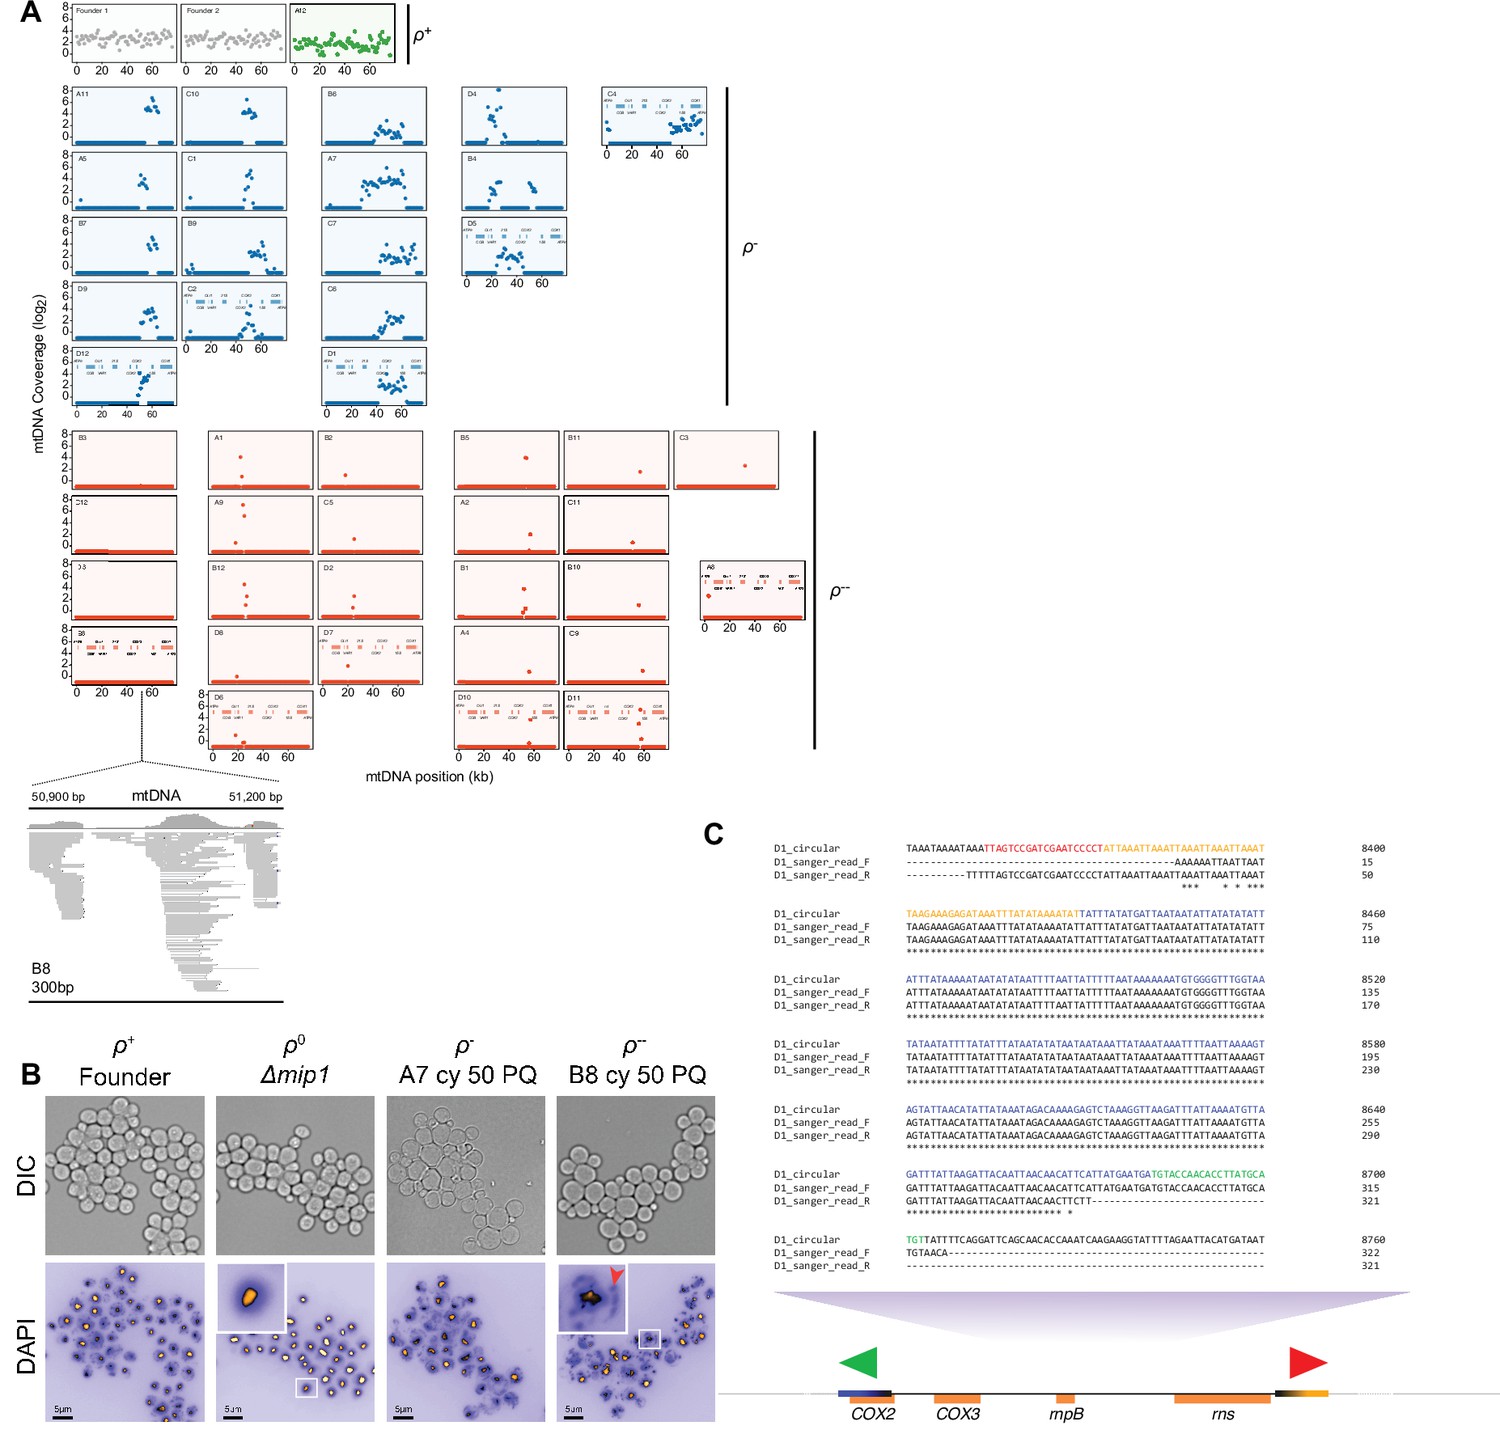
mtDNA loss during long-term exposure to paraquat.
(A) Sequenced populations (n=44) adapted (t50) to chronic paraquat exposure were classified (color) as ρ+ (mtDNA intact, green, n=1), ρ- (6–30 kb mtDNA segments retained, blue, n=18) and or near ρ0 (here called ρ-- ,<2 kb mtDNA segments retained, red, n=25). y-axis: mtDNA copy number (median coverage in 0.5 kb windows relative to the euploid nuclear genome). x-axis: mtDNA position. Below: gene positions. Read map: a zoom-in on a 300 bp mtDNA stretch which is mapped to by the ρ-- population B8 mtDNA sequence reads. (B) ρ-- cells with low mtDNA sequence coverage retain very short (<300 bp) mtDNA segments. Micrographs: Light (top; DIC) and fluorescence (bottom) microscopy of DAPI stained DNA in ρ-- (B8 at t50), ρ+ (founder), ρ- (A7 at t50), and true ρ0 (mip1Δ) cells. Insets: Zoom-in on indicated ρ-- and true ρ0 cells. Note that ρ-- cells contain mitochondrial DNA (red arrow) while true ρ0 cells do not. (C) Schematic view of a PCR of the retained mtDNA segment in cells from paraquat-adapted population D1 (t50), with primers directing the reaction outwards across the segment ends. Note that the presence of Sanger sequenced PCR product shows that at least some of the mtDNA molecules are circularized or linear tandem amplifications of the retained segment.
Figure 6—figure supplement 3
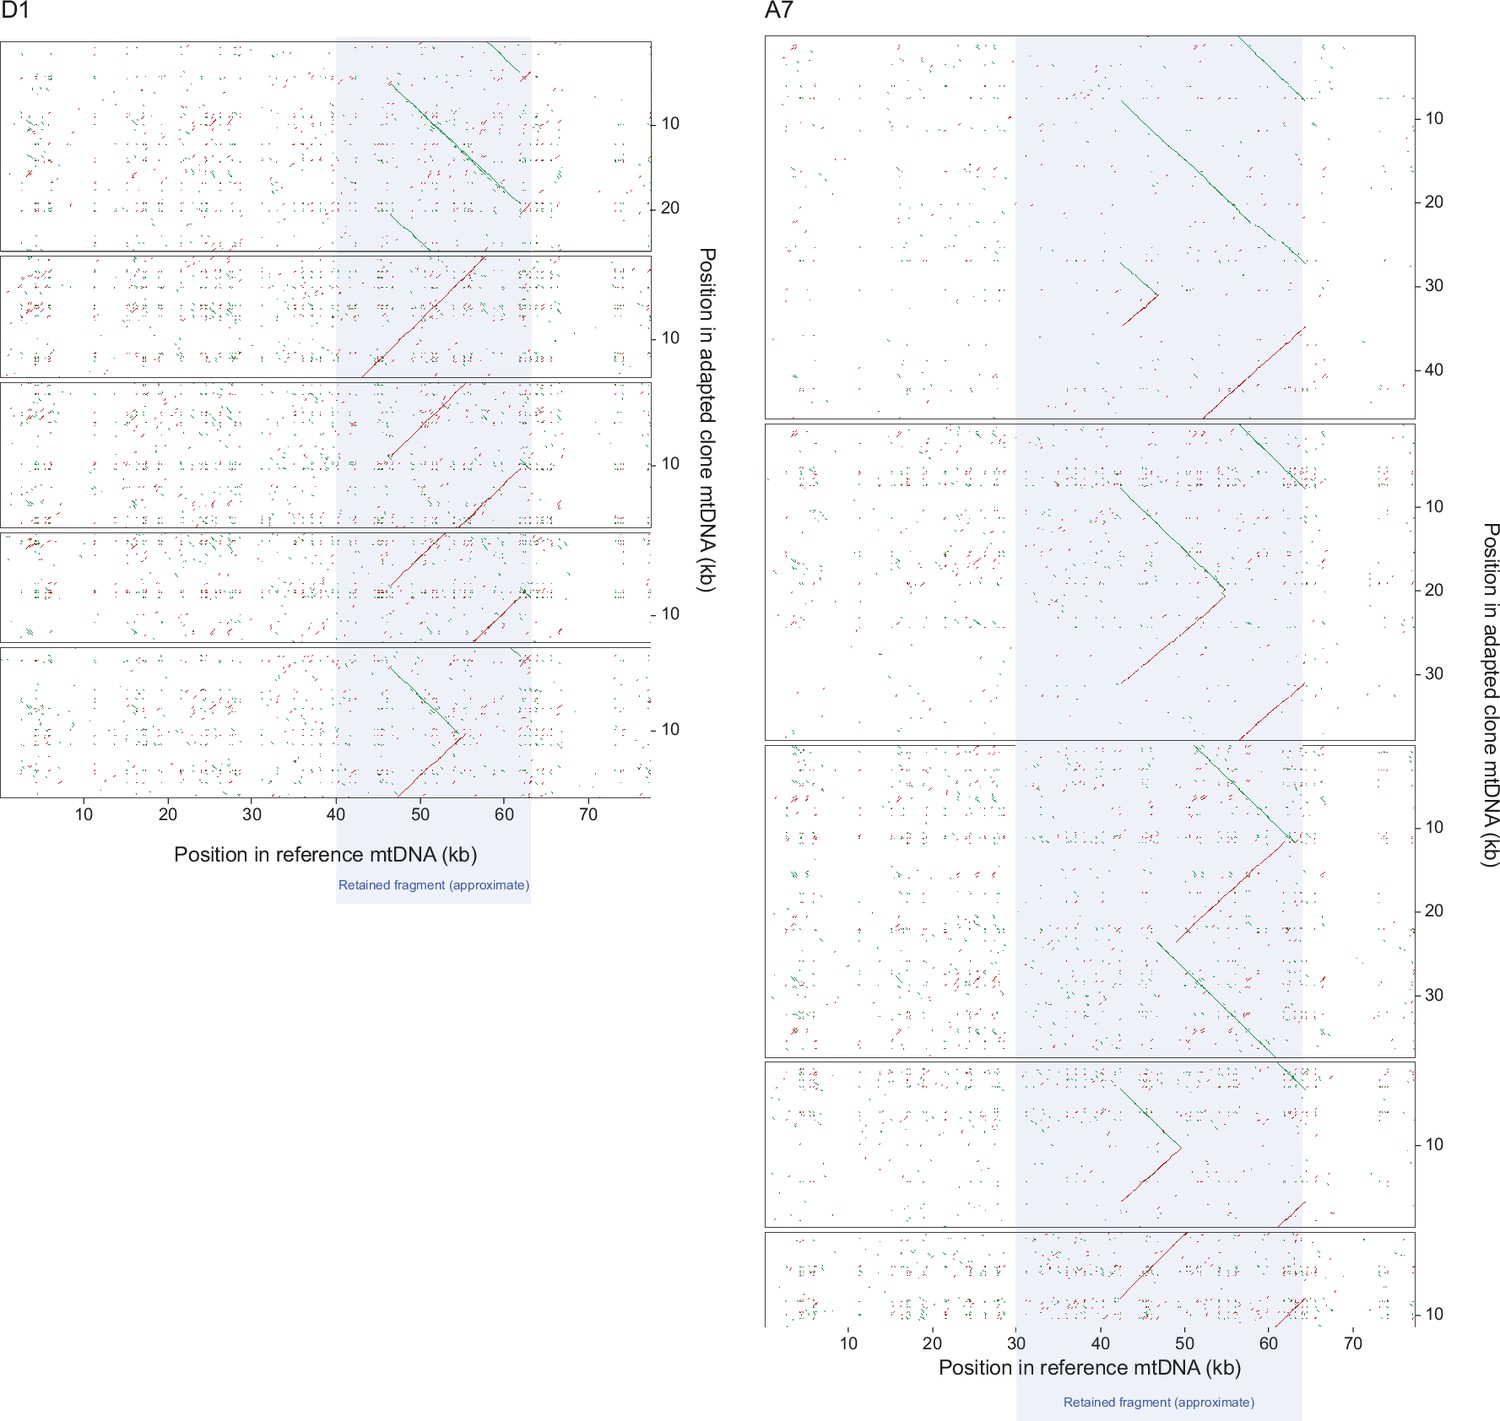
Dot-plot mapping of long mtDNA reads from Nanopore sequencing of clones from the D1 and A7 paraquat adapted populations.
Dot-plot mapping of 5 random long mtDNA reads (panels) from Nanopore sequencing of 1 clone from each the D1 (left panels) and A7 (right panels) populations (t50), exposed to chronic paraquat stress to the founder reference mitochondrial genome. Nucleotide position in the reference (x-axis) and sequenced clone (y-axis) mtDNA genomes are shown. Note that reads tend to cover most or all of the retained segment (grey field), which therefore corresponds to a continuous stretch of DNA.
Figure 6—figure supplement 4
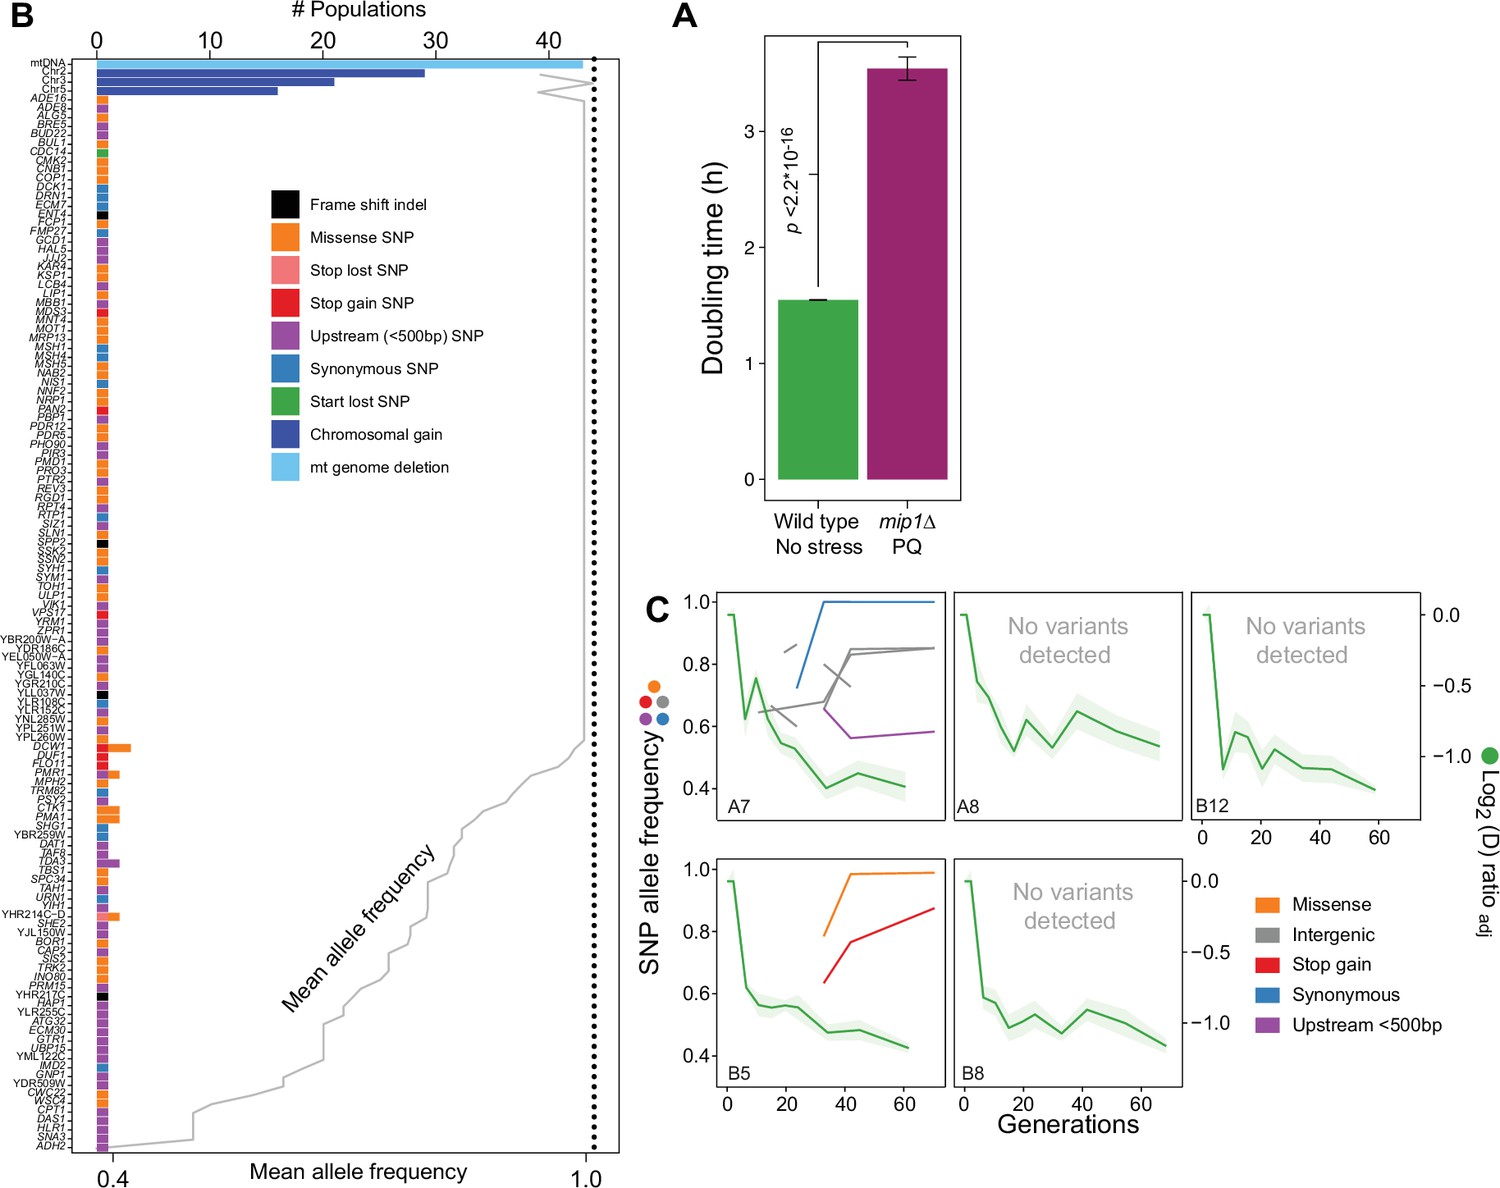
Nuclear genome evolution during long-term exposure to paraquat (PQ).
(A) Doubling time (h) of mip1Δ cell populations (n=432) growing in the presence of 400 μg/mL of paraquat, compared to that of founder cell populations (n=768) growing on ordinary medium. p-values Welch two-sided t-test. (B) mtDNA deletion and chromosome II, III and V duplications recur across populations adapted to long-term paraquat stress, but nuclear genes with point mutations rarely do. Upper x-axis: Number of populations in which a gene carries de novo point mutations, a chromosome is duplicated or a mtDNA segment is deleted. Dotted line: number of sequenced populations. Lower x-axis (grey line): For genes containing SNPs, the line shows the mean allele frequencies of SNPs in the gene. For chromosome or mtDNA copy number variations the line shows the mean sequence coverage across the chromosome or mtDNA relative to that of the haploid nuclear genome. y-axis: Genes with point mutations, chromosomes with duplications and mtDNA. Bar color: Type of variation. (C) The early, swift adaptation to paraquat (right y-axis, green line, A, shade: S.E.M., n=6) precedes point mutations (left y-axis, non-green lines, allele frequency). x-axis: Generations of exposure to paraquat. Panels: Sequenced populations (A7, A8, B5, B8, and B12; same as in Figure 3A). Line color: variant type. Variants pre-dating adaptation, supported by few (<10) reads or (<2) time points or shared across environments (>2) were filtered out.
-
Figure 6—figure supplement 4—source data 1
Small indels and SNPs called in sequenced paraquat adapted endpoint populations.
Data are shown in Figure 6—figure supplement 4B.
- https://cdn.elifesciences.org/articles/76095/elife-76095-fig6-figsupp4-data1-v2.xlsx
-
Figure 6—figure supplement 4—source data 2
Doubling time data of mip1Δ cells grown in stress, and of wild type cells grown in no stress.
Data are shown in Figure 6—figure supplement 4A.
- https://cdn.elifesciences.org/articles/76095/elife-76095-fig6-figsupp4-data2-v2.xlsx
Figure 6—figure supplement 5
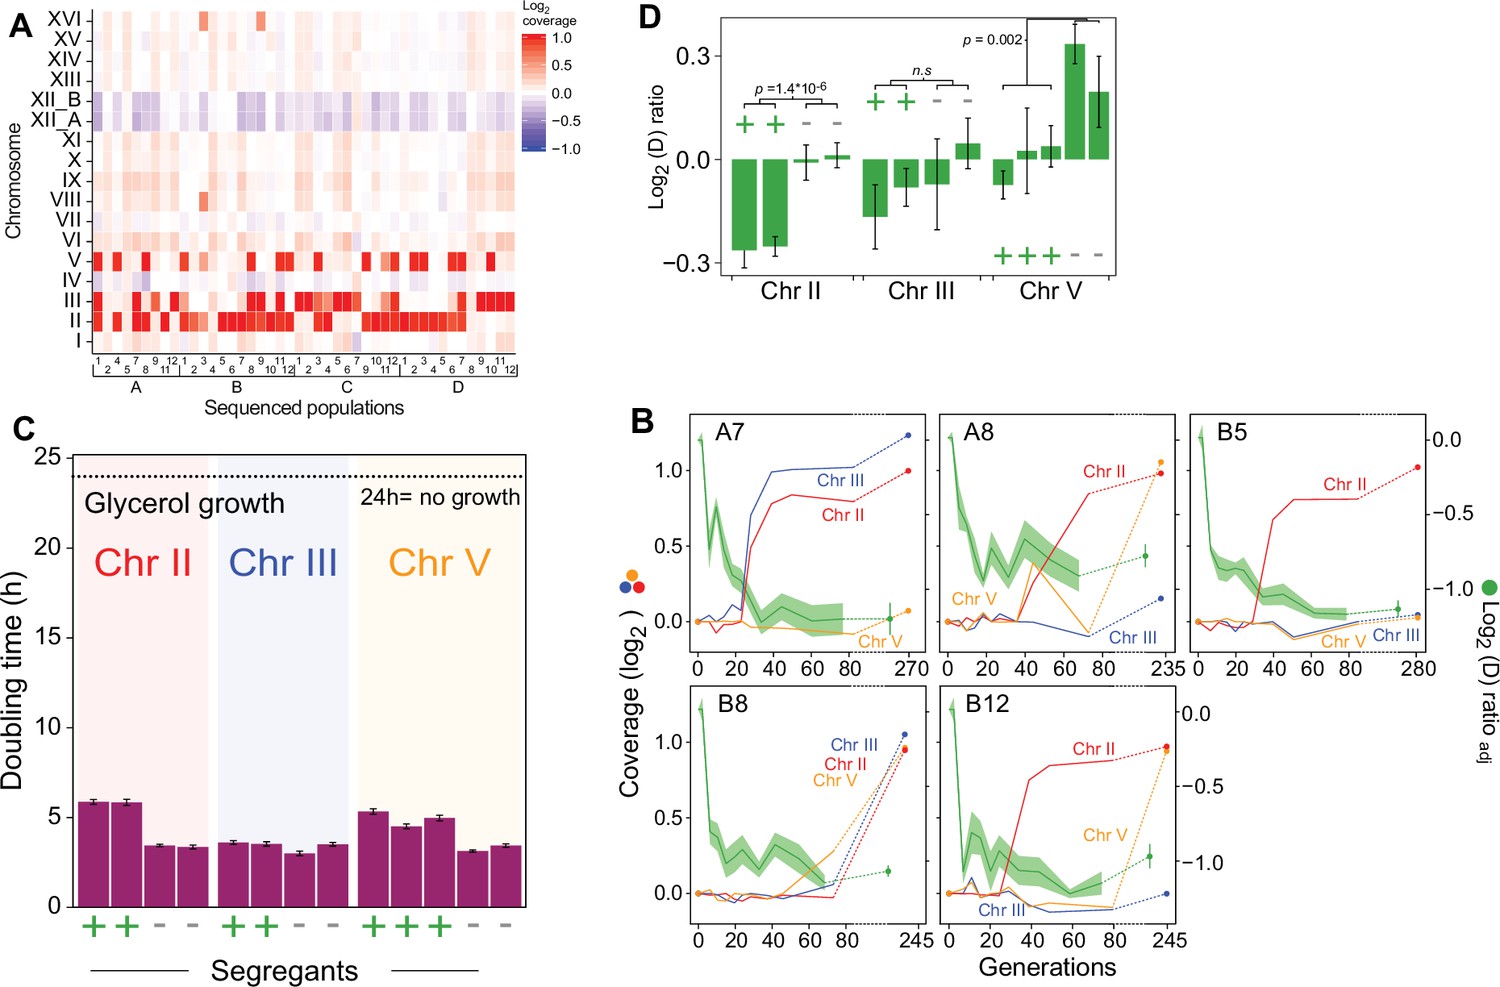
Chromosome duplications explain the second phase of adaptation to paraquat.
(A) Chromosome II, III, and V duplications are common after 50 cycles (mean of G=242 generations) of paraquat exposure. Color: Chromosome copy number log2 median coverage relative to haploid nuclear genome. (B) Chromosome II, III, and V duplications appear in the second phase of paraquat adaptation. Panels: five populations (A7, A8, B5, B8, and B12). Left y-axis (non-green lines): Chromosome copy number (log2 of median sequence coverage across the chromosome relative to the median of the nuclear genome). Color: chromosome (II=blue, III=red and V = yellow). Right y-axis (green line): paraquat adaptation. Shade: S.E.M. (n=6). Broken lines: no data. (C–D) Chromosome II and III duplications reduce the cell doubling time under paraquat stress (C) but cannot explain the complete loss of respiratory growth in the parent populations (D). We backcrossed (x3) cells adapted to 242 generations (t50) of paraquat exposure to founder cells over consecutive meioses and compared the growth on paraquat of 2–3 segregants with and without duplicated chromosome. x-axis: cells w. (+) and w/o (-) individual chromosome duplications. Error bars: S.E.M. (n=6). p-values: Welch two-sided t-test. Broken line: No growth, corresponding to doubling time >24 hr (the measurement limit).
-
Figure 6—figure supplement 5—source data 1
Mean log2 coverage for each chromosome in each sequenced paraquat adapted endpoint 1 population.
Data are shown in Figure 6—figure supplement 5A and in Figure 6—figure supplement 4B.
- https://cdn.elifesciences.org/articles/76095/elife-76095-fig6-figsupp5-data1-v2.xlsx
-
Figure 6—figure supplement 5—source data 2
Mean log2 coverage for each chromosome in five sequenced paraquat adapting populations over generations G of selection.
Data are shown in Figure 6—figure supplement 5B.
- https://cdn.elifesciences.org/articles/76095/elife-76095-fig6-figsupp5-data2-v2.xlsx
Additional files
-
Supplementary file 1
Description of stressor environments used as selection pressures.
- https://cdn.elifesciences.org/articles/76095/elife-76095-supp1-v2.docx
-
Transparent reporting form
- https://cdn.elifesciences.org/articles/76095/elife-76095-transrepform1-v2.docx
-
Source data 1
Primers used for strain construction and qPCR.
- https://cdn.elifesciences.org/articles/76095/elife-76095-data1-v2.xlsx
Download links
A two-part list of links to download the article, or parts of the article, in various formats.
Downloads (link to download the article as PDF)
Open citations (links to open the citations from this article in various online reference manager services)
Cite this article (links to download the citations from this article in formats compatible with various reference manager tools)
Genetically controlled mtDNA deletions prevent ROS damage by arresting oxidative phosphorylation
eLife 11:e76095.
https://doi.org/10.7554/eLife.76095


