Neocortical pyramidal neurons with axons emerging from dendrites are frequent in non-primates, but rare in monkey and human
- Ruhr University Bochum, Faculty of Biology and Biotechnology, Developmental Neurobiology, Germany
- Heidelberg University, Medical Faculty Mannheim, Mannheim Center for Translational Neuroscience, Institute of Neuroanatomy, Germany
- JARA-Institute Brain Structure Function Relationship, Germany
- Johannes Kepler University Linz, Faculty of Medicine, Institute of Anatomy and Cell Biology, Austria
- Ruhr University Bochum, Faculty of Biology and Biotechnology, Zoology and Neurobiology, Germany
- University of La Laguna, Faculty of Medicine, Department of Basic Medical Science, Spain
Figures
Figure 1
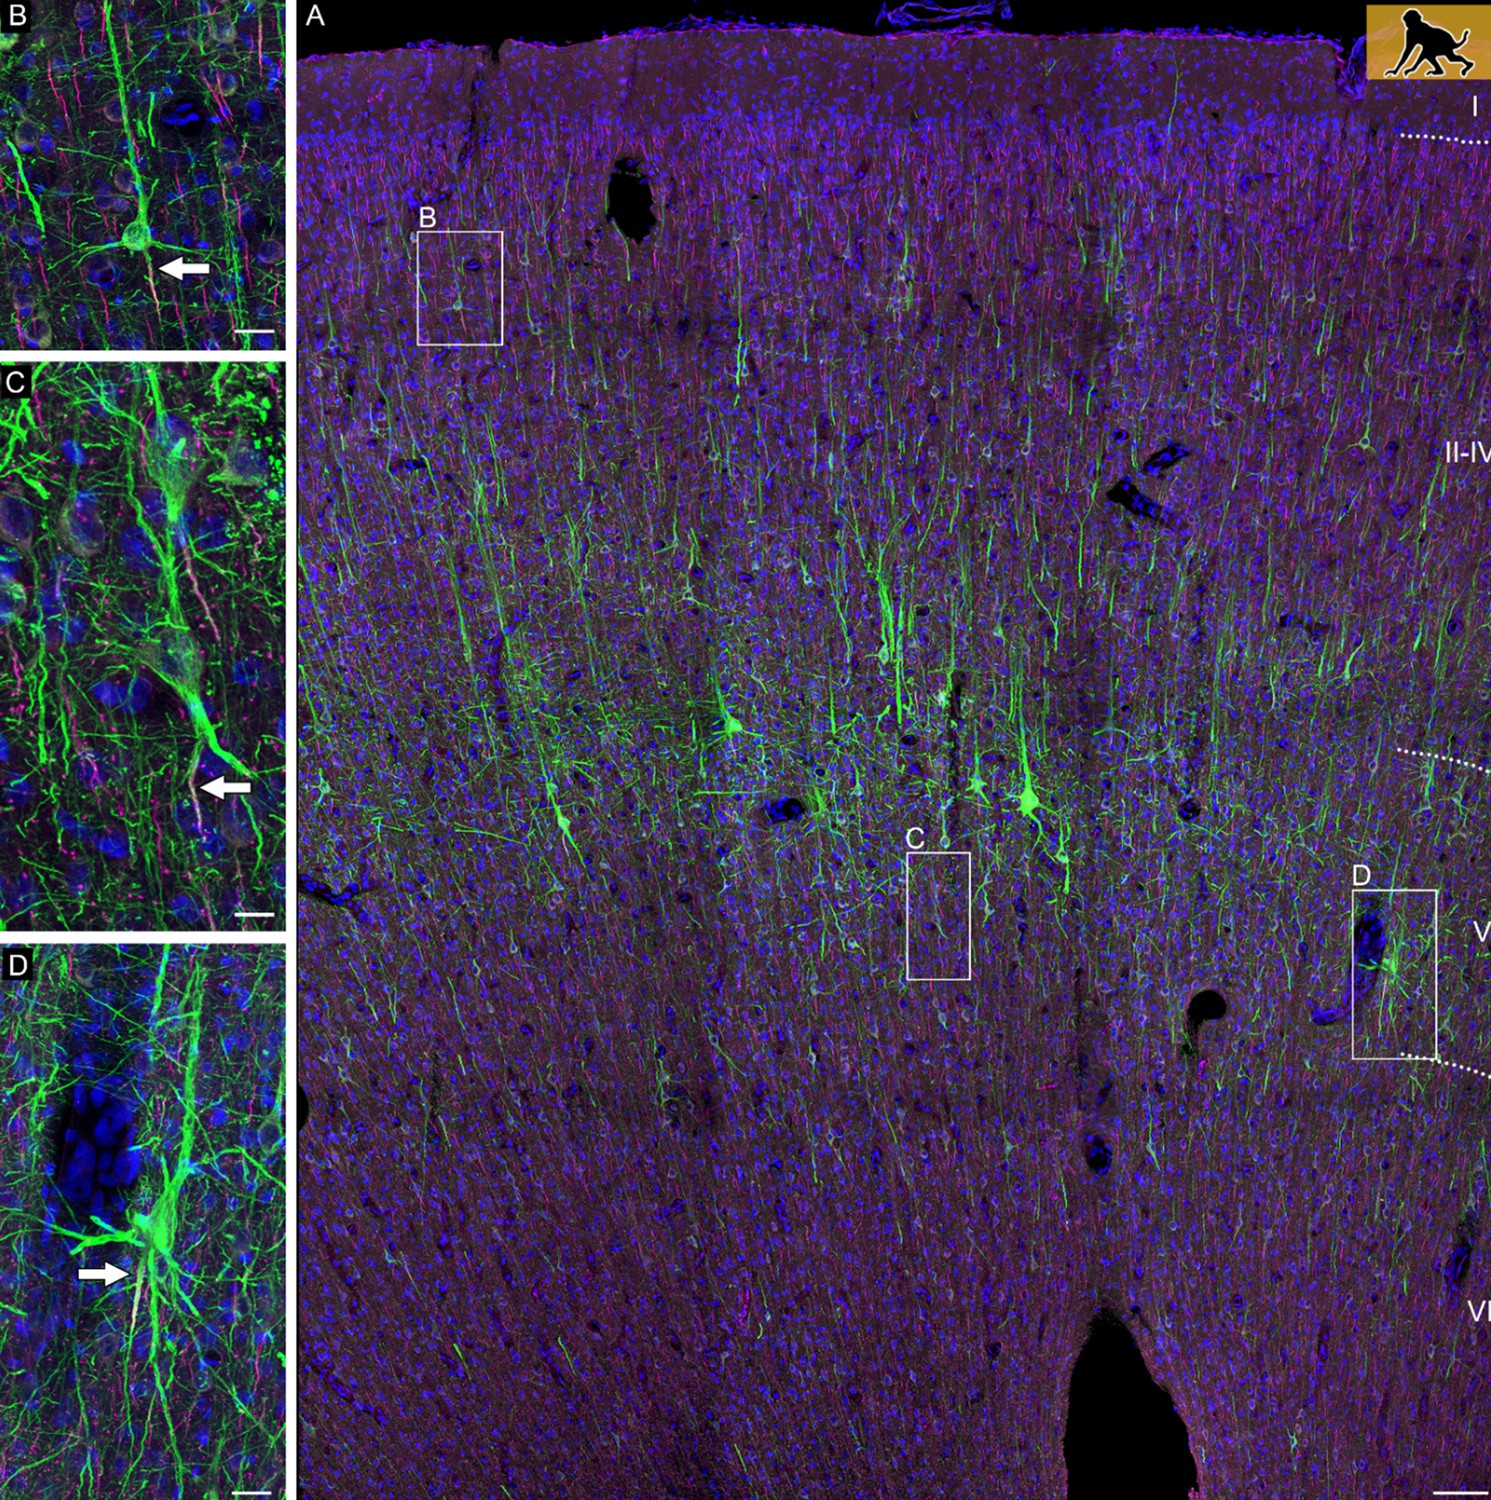
Confocal tile scan of dorsal neocortex (premotor area) of P60 infant macaque.
(A) Pyramidal cells were stained with SMI-32/βIV-spectrin to label dendrites and the axon initial segment, respectively. Insets depict neurons with an axon emerging from the soma (B), or from an axon carrying dendrite (C), or a shared root (D). Axons indicated by arrows. Scale bars 100 µm for the tile scan and 25 µm for the insets.
Figure 2 with 5 supplements
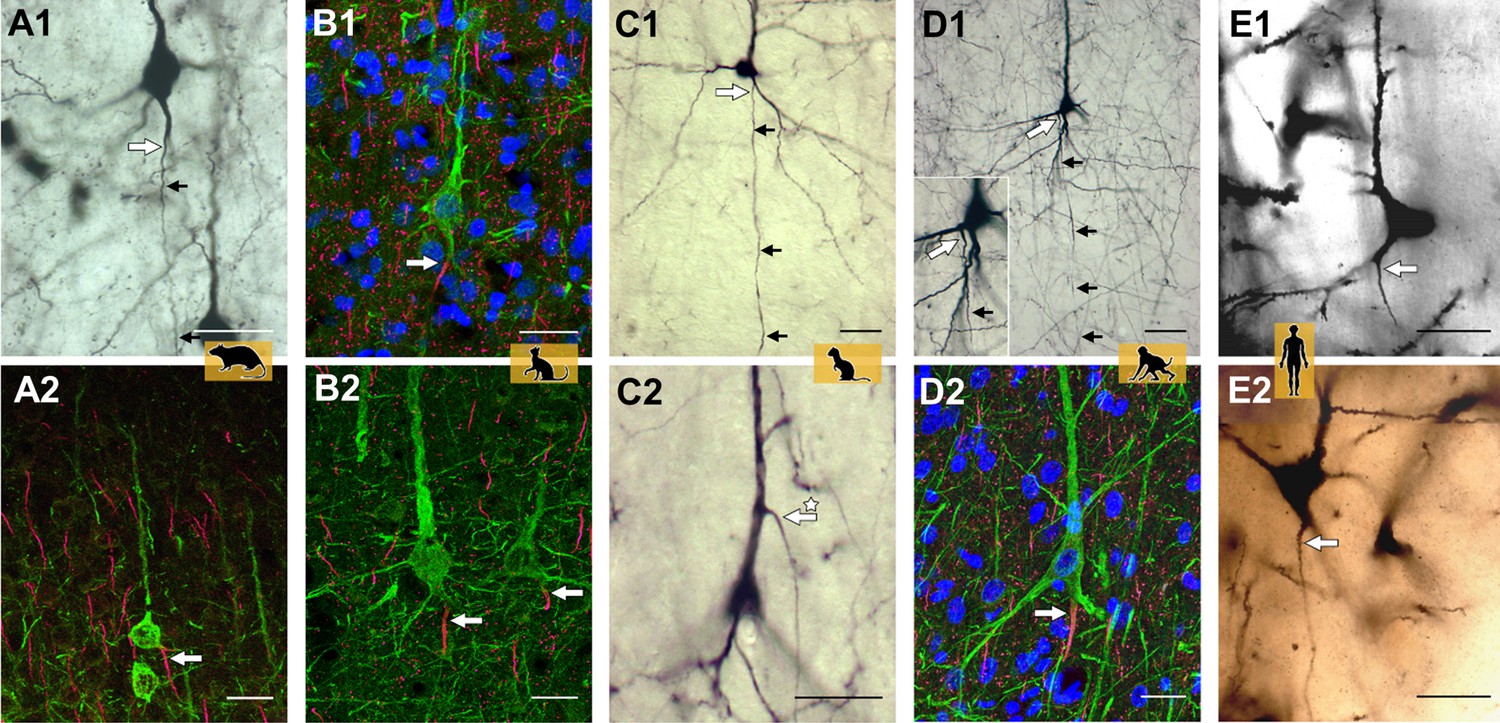
Representative axon carrying dendrite (AcD) neurons.
(A1, A2) From rat visual cortex (biocytin, immunofluorescence); (B1, B2) cat visual cortex (immunofluorescence); (C1, C2) ferret visual cortex (biocytin); (D1, D2) macaque premotor cortex (biocytin, immunofluorescence), the inset shows the axon origin at higher magnification; (E1, E2) human auditory cortex (Golgi method; D2 is a montage of two photos). Apical AcDs (asterisk in C2) were rare, less than 10 were detected among the neurons assessed in adult rat, ferret, and macaque, and none in our human material. In all cases, the axon immediately bent down toward the white matter. Axon origins are marked by large arrows, small arrows indicate the course of biocytin-labeled axons. Scale bars 25 µm.
Figure 2—figure supplement 1
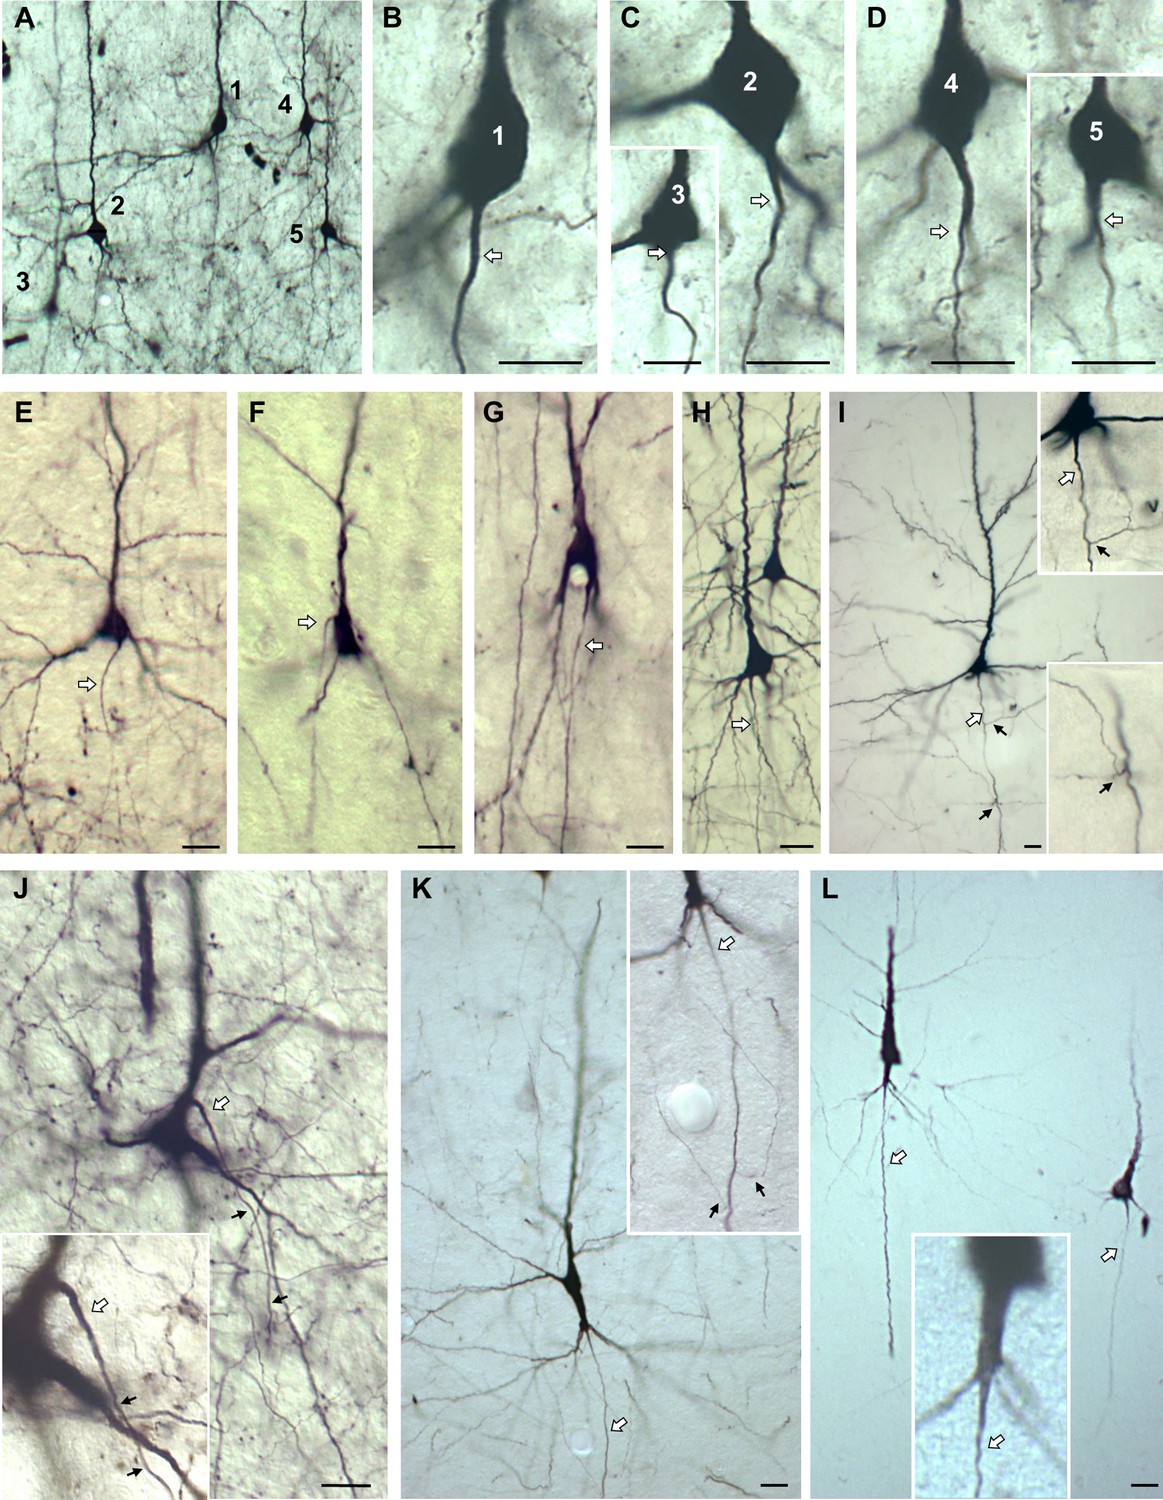
Variations of axon origins of biocytin-stained pyramidal neurons of rat (A–D) and ferret (E–G) visual cortex, and macaque premotor cortex (H–K), and macaque intraparietal sulcus (L).
The neurons in (L), an AcD cell next to a somatic axon cell, reside millimeters from the injection site, they are long projecting layer III pyramidal neurons. Cells with somatic axons are in B, C-inset, E, F, H, I, L (rightmost cell). Cells with shared root configuration are in C, G. Cells with axon carrying dendrites are D, D-inset, J, K, L. The neurons in K, L (the left one, enlarged in the inset in L) give rise to normal basal dendrites plus a single thick radially descending dendrite which carries the axon. Such cells have been described in macaque cortex (Hendry and Jones, 1983). Note that the axon of the cell in J emerged from the apical dendrite and bent down to the white matter. Axons marked by white arrows, axon collaterals marked by small black arrows. Scales: 15 µm in A–D; 25 µm in E–L.
Figure 2—figure supplement 2
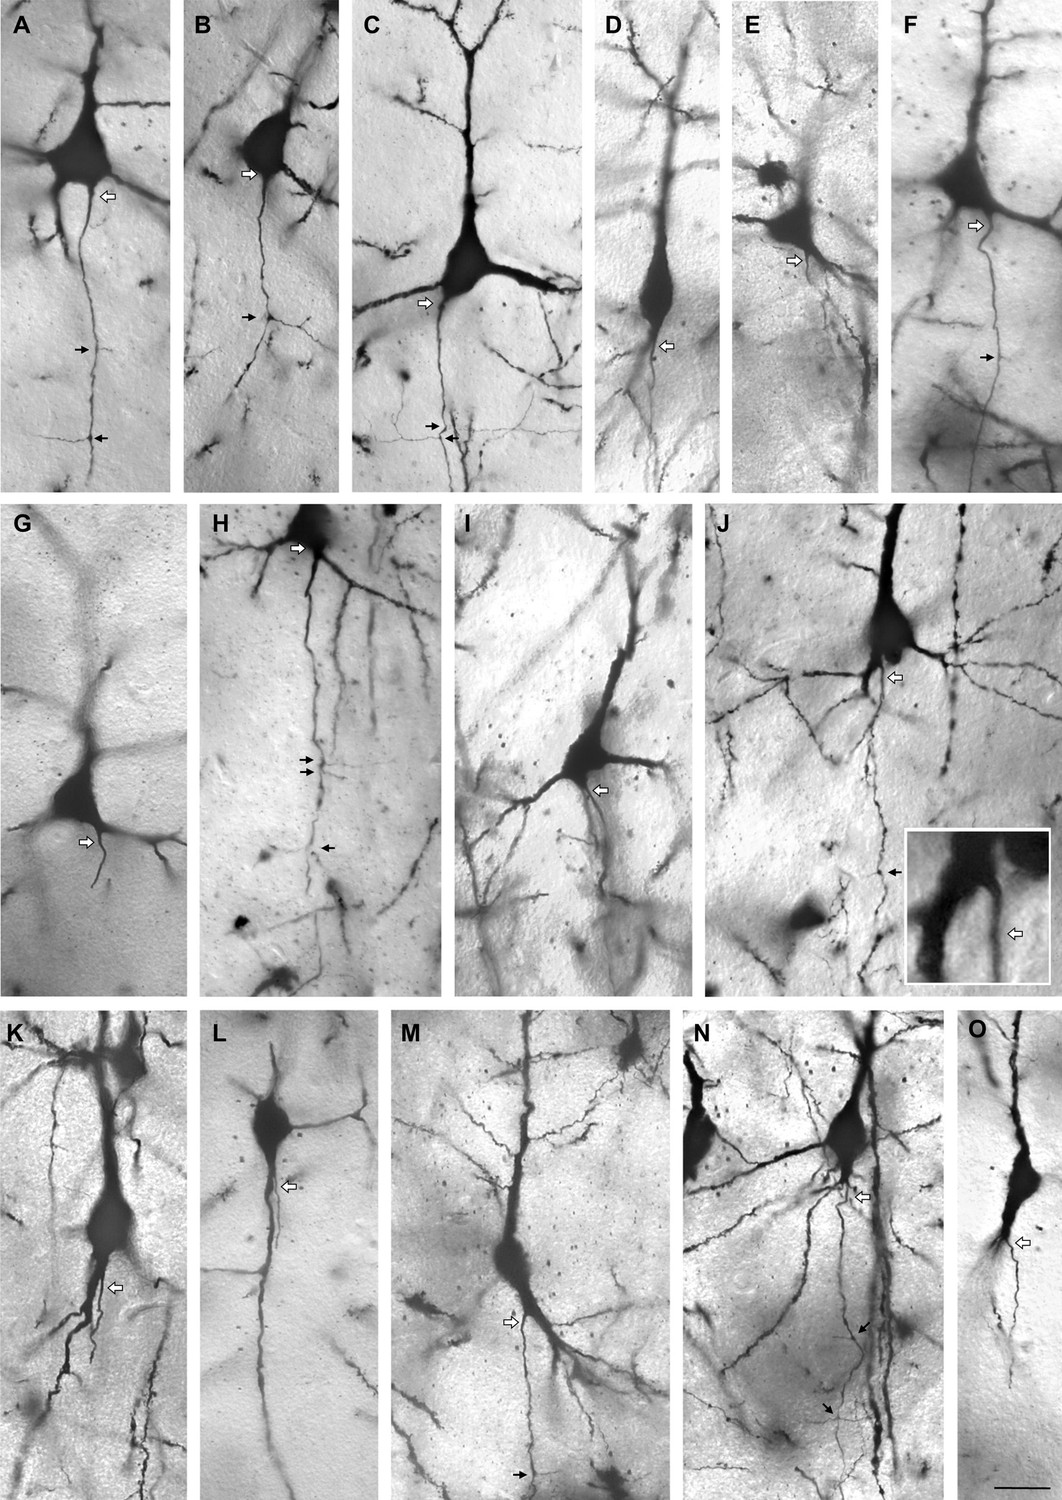
Variations of axon origins of Golgi-impregnated pyramidal neurons of human temporal cortex, all taken from Individual 2, 56 years of age and sampled from all layers.
Cells with somatic axons are in A, B, C, D, E, F. Cells with shared root configuration are in G, H, I. Cells with axon carrying dendrites are J, K, L, M, N, O. Axons marked by white arrows, axon collaterals marked by small black arrows. Scale: 25 µm.
Figure 2—video 1
Neuron classified as AcD cell in macaque cortex.
Figure 2—video 2
Neuron classified as shared root cell in macaque cortex.
Figure 2—video 3
Neuron classified as Von Economo neuron in macaque cortex.
Figure 3
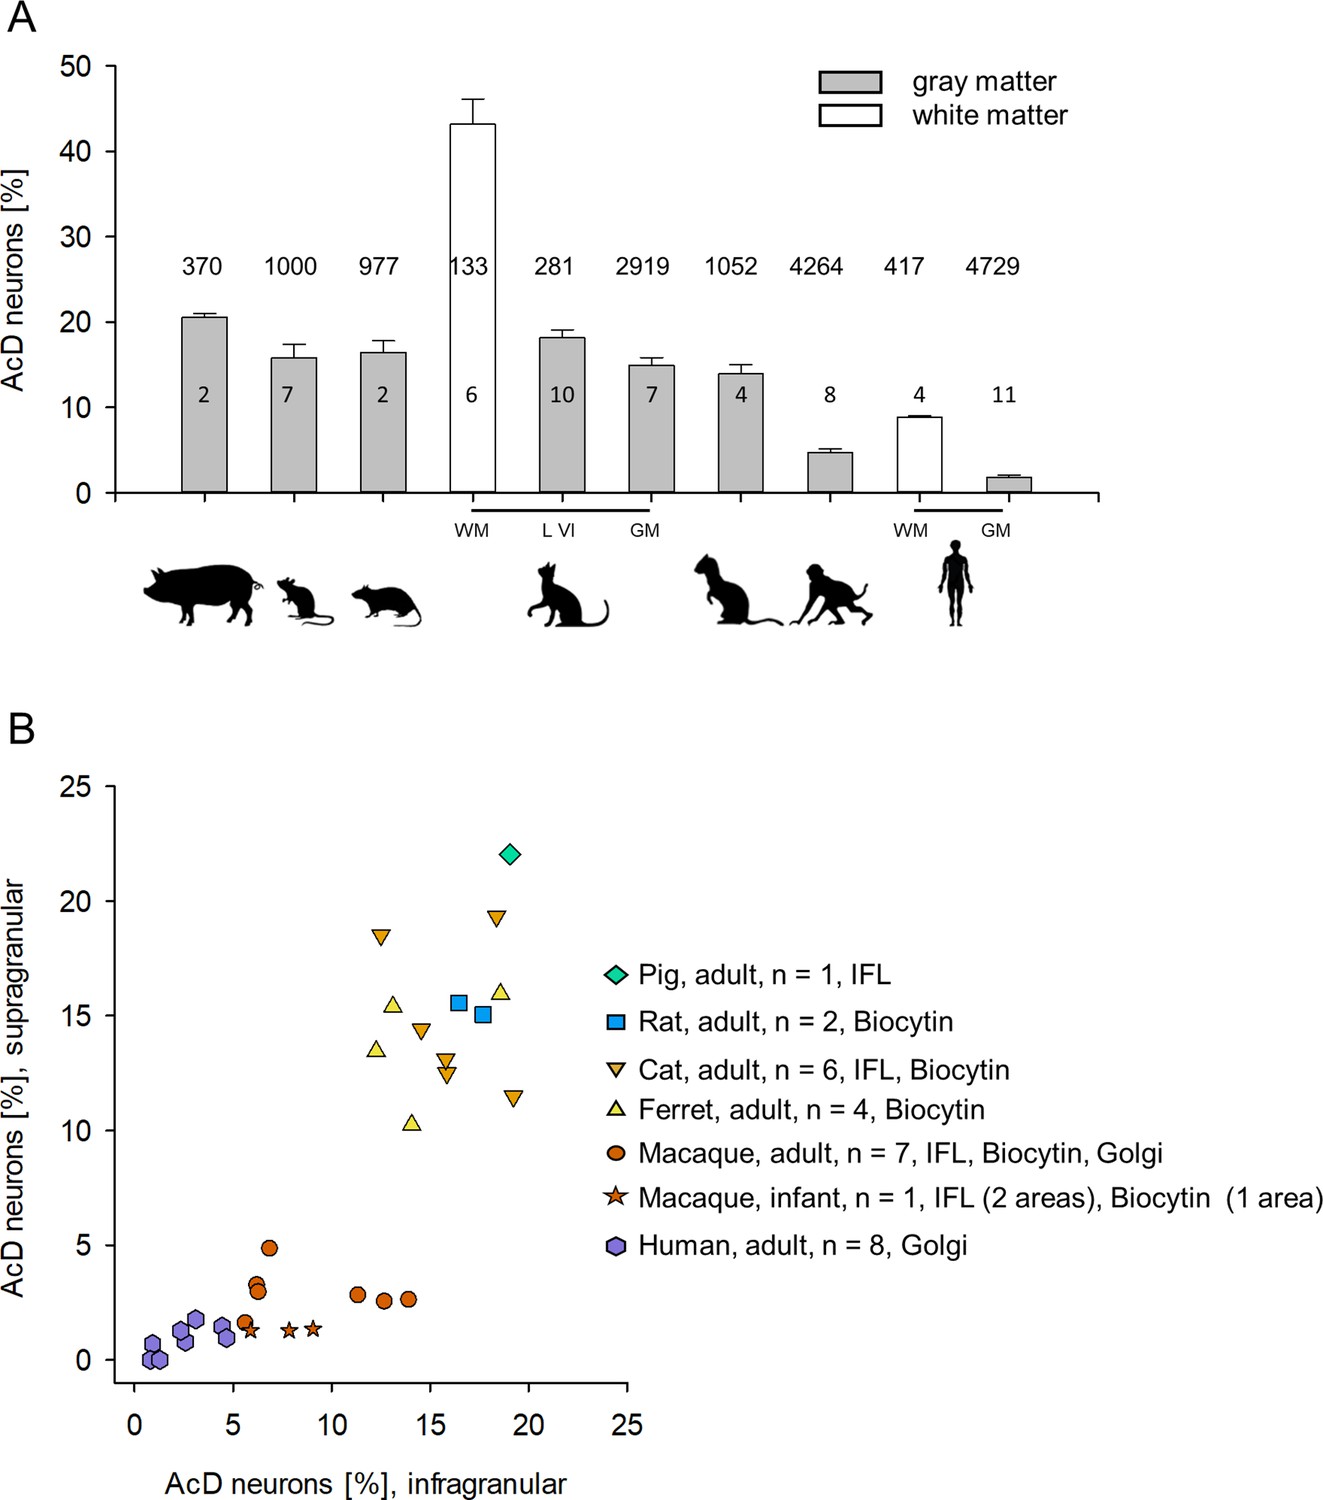
Proportion of axon carrying dendrite (AcD) neurons across species.
(A) Shown are mean ± SEM. of the individual percentages listed in Tables 1–4, which also indicate the staining methods. Numbers above the bars are the total number of pyramidal neurons assessed per species/cell class for this graph. Numbers in the bars indicate the number of individuals. (B) Laminar analysis. Non-primate species showed roughly equal proportions of AcD neurons in supra- and infragranular layers. With some individual variability the range was 10–21%. In contrast, in macaque, the cluster was downshifted along the ordinate due to overall much lower proportions. Furthermore, infragranular pyramidal cells displayed much higher proportions of AcD cells compared with supragranular pyramidal cells. A Mann-Whitney rank sum test of ‘all non-primate’ versus ‘all macaque’ percentages of supragranular and infragranular AcD cells, yielded p<0.001 and p<0.001, respectively. Human was not included in the statistical test because only one method was used to detect AcD cells. The legend indicates the number of individuals and the staining methods; IFL, immunofluorescence. Note that we could not do a laminar analysis for all individuals shown in (A) because staining of supragranular layers in some animals delivered too low numbers which might have led to a sampling error.
-
Figure 3—source data 1
Data and statistical analysis of experiments shown in Figure 3A, B.
- https://cdn.elifesciences.org/articles/76101/elife-76101-fig3-data1-v2.xlsx
Figure 4
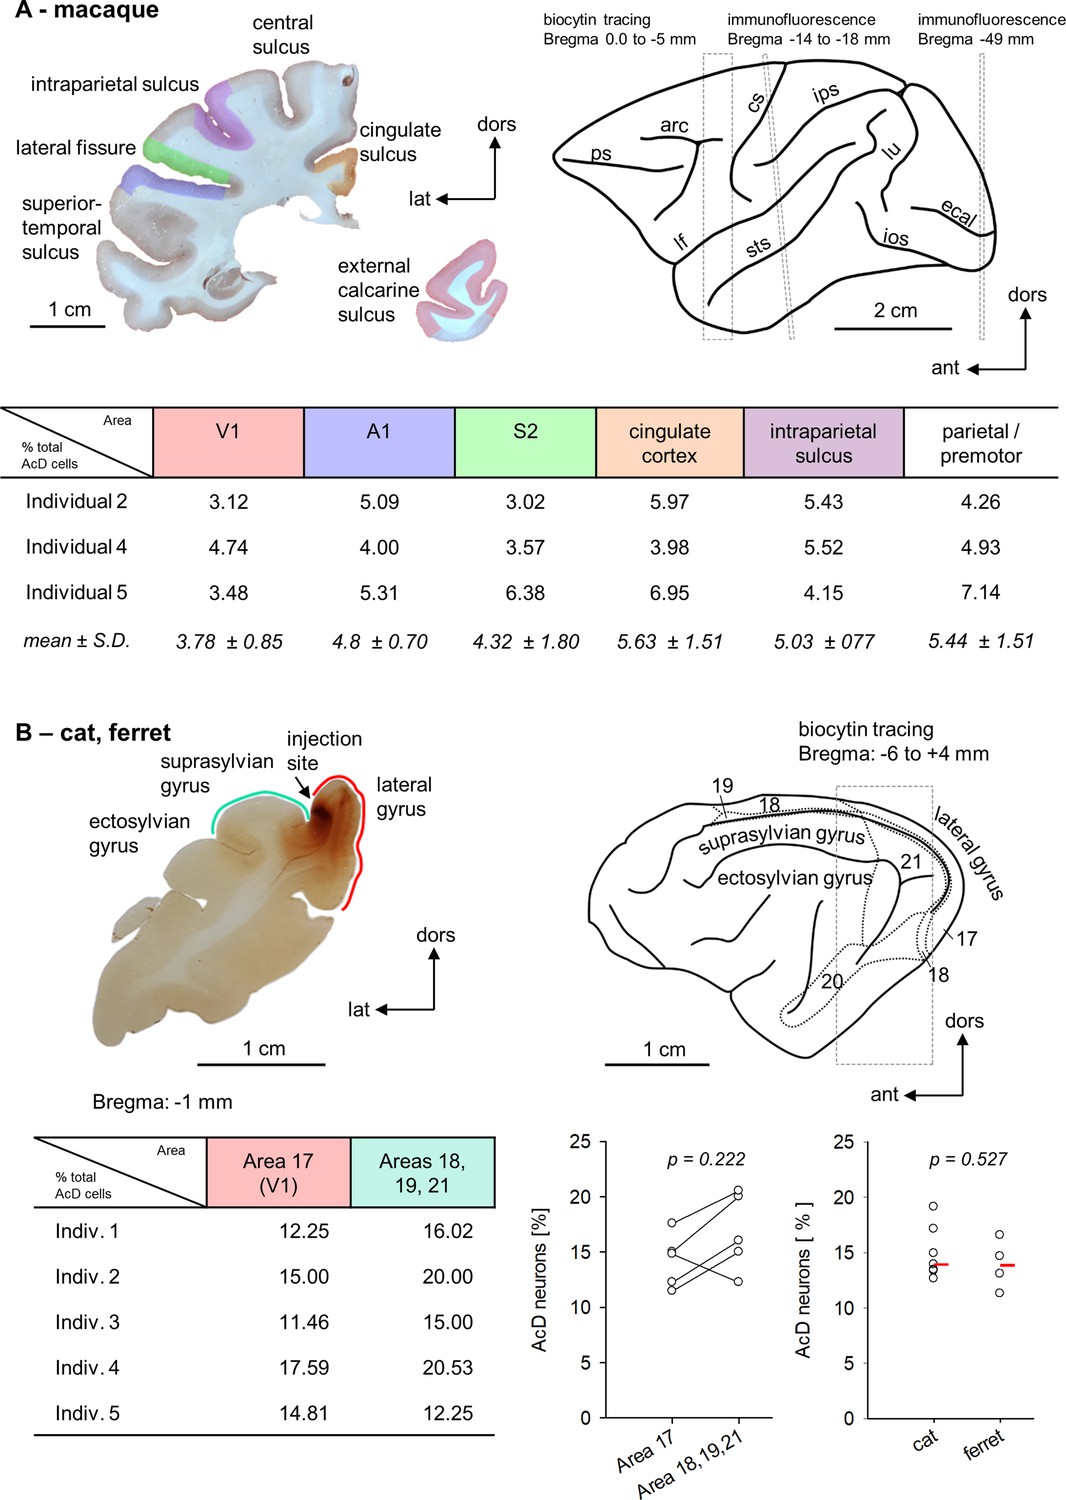
Within-species areal comparisons.
(A) Upper left is a photomicrograph of one of the coronal sections stained for immunofluorescence. The regions of interest are color coded. Upper right is the macaque brain (after Paxinos et al., 2009). The dashed boxes and Bregma distances indicate where our assessments were made. The rostral box overlaps the premotor cortex harboring the biocytin injections. Note that the analysis was spanning several millimeters of cortex (see Figure 4—source data 1). The middle box corresponds to the level of the section shown to the left. It is slightly tilted with respect to the stereotaxis coordinates (Paxinos et al., 2009). The posterior box corresponds to a fairly caudal level of the visual cortex. The table summarizes the percentages of AcD neurons obtained in the six areas and three individuals and gives the mean of each area with standard deviation. Abbreviations: arc, arcuate sulcus; cgs, cingulate sulcus; cs, central sulcus; ecal, external calcarine sulcus; ios, inferior occipital sulcus; ips, intraparietal sulcus; lf, lateral fissure; lu, lunate sulcus; prs, principal sulcus; sts, superior temporal sulcus. (B) Upper left is a photomicrograph of one of the coronal sections of cat occipital cortex analyzed for biocytin-stained AcD neurons. The injection site in this case was near the area 17/18 border, some other cats had an additional injection into the suprasylvian gyrus (see Figure 4—source data 1). Area 17 is along the medial flank, areas 18, 19, and 21 are in the lateral sulcus and on the suprasylvian gyrus. Upper right is the cat brain (after Reinoso-Suarez, 1961) with the visual fields indicated. The table summarizes the percentages of AcD neurons obtained in area 17 and the extrastriate areas. The graph pairs the data points of the five cats. To the right, we compared cat (n = 7) to ferret (n = 4) visual cortex (striate and extrastriate). Every point is one individual, the red bar represents the median for each column. The p-values were determined with a Mann-Whitney rank sum test.
-
Figure 4—source data 1
Data and statistical analysis of experiments shown in Figure 4A and B.
- https://cdn.elifesciences.org/articles/76101/elife-76101-fig4-data1-v2.xlsx
Figure 5
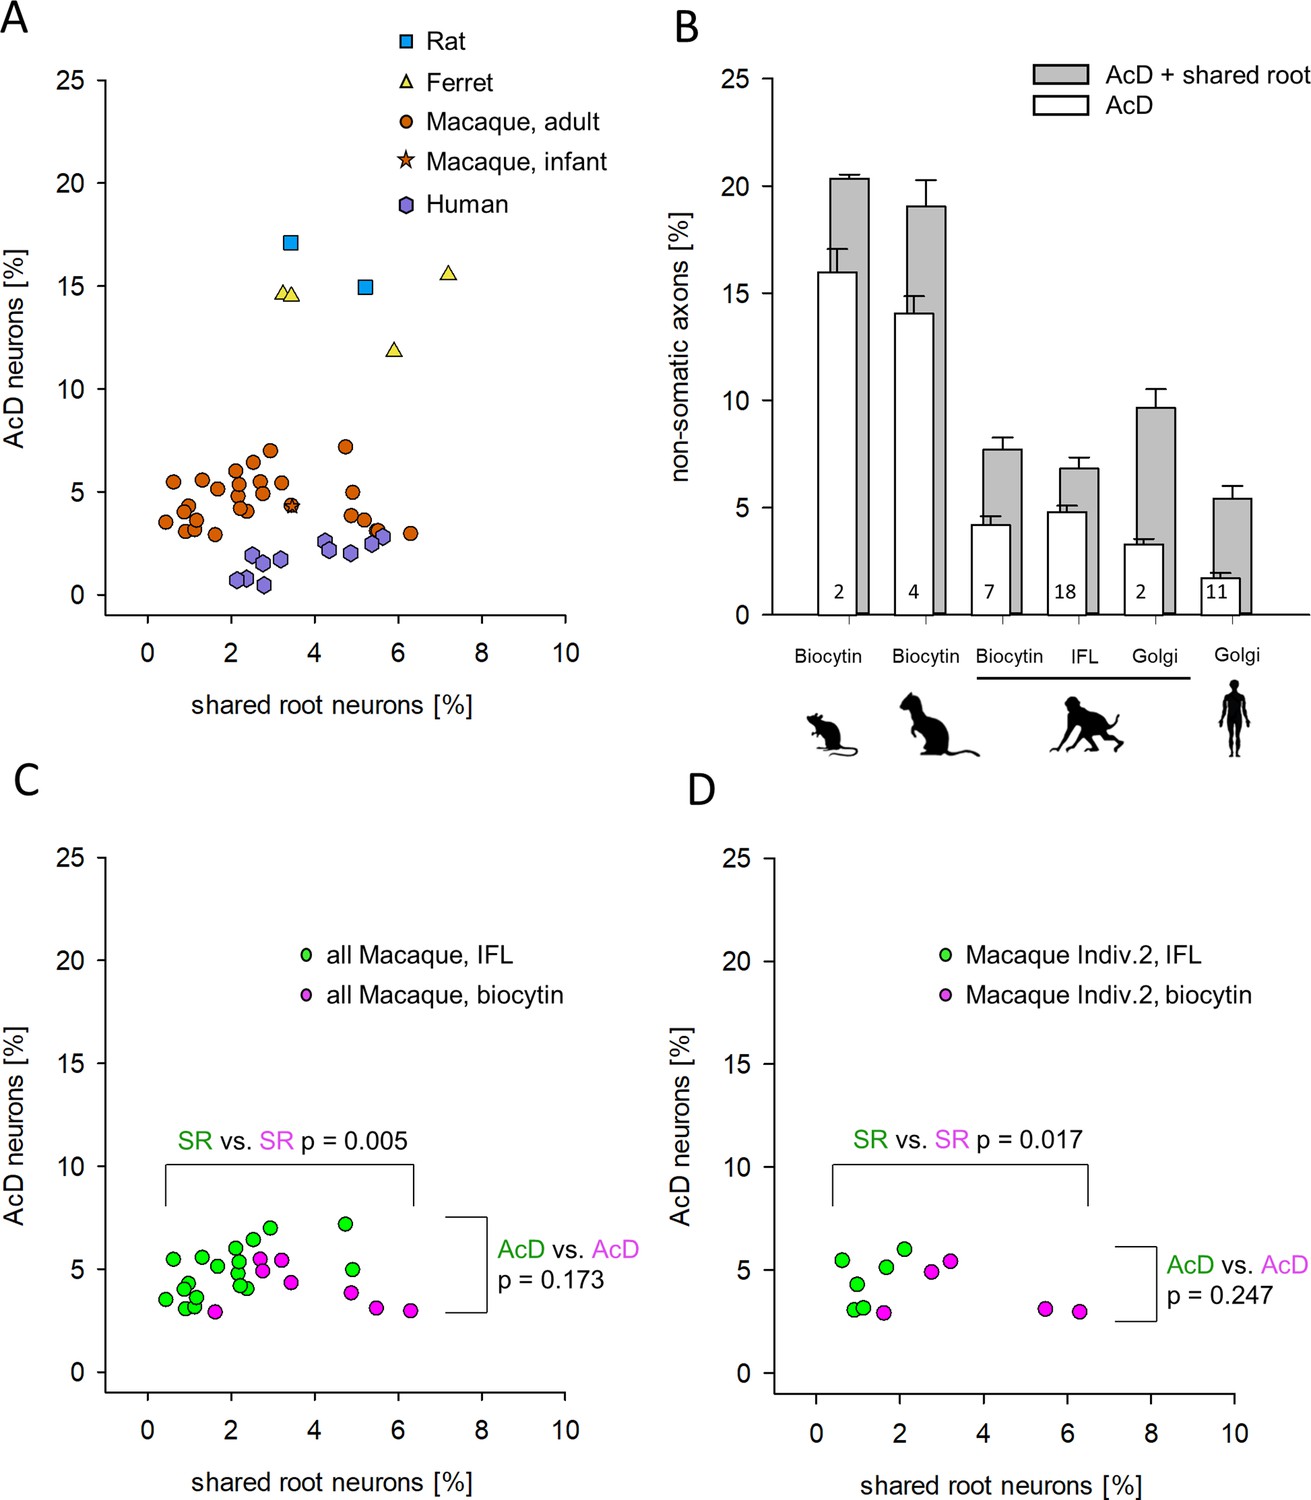
Proportion of axon carrying dendrite (AcD) cells versus shared root cells.
(A) Data from rat (biocytin), ferret (biocytin), macaque (biocytin, immunofluorescence, Golgi), and human (Golgi). The species cluster along the ordinate as already seen in Figure 3B. The Mann-Whitney rank sum test of ‘all non-primate’ versus ‘all macaque’ proportions of AcD cells yielded p <0.001. However, the shared root values scatter considerably along the abscissa. Mann-Whitney rank sum test of ‘all non-primate’ versus ‘all macaque’ proportions of shared root cells yielded p=0.008. (B) The percentages of AcD were graphically compared to the sum of AcD and shared root. For macaque, data were separated by staining methods. Note that the Golgi method in macaque and in human yielded a higher proportion of shared root compared to biocytin and immunofluorescence. Numbers in the bars represent the sample size (individuals and/or cortical areas). (C) Comparison of biocytin and immunofluorescence staining in macaque. (D) Comparison of biocytin and immunofluorescence staining within just one individual macaque. Note in C, D that AcD cells are detected equally well with both methods whereas the biocytin staining yielded higher numbers of shared root cells (SR). In C, D, colors indicate the comparisons, and the p-values were determined with a Mann-Whitney rank sum test. IFL, immunofluorescence.
-
Figure 5—source data 1
Data and statistical analysis of experiments shown in Figure 5A and B.
- https://cdn.elifesciences.org/articles/76101/elife-76101-fig5-data1-v2.xlsx
Figure 6
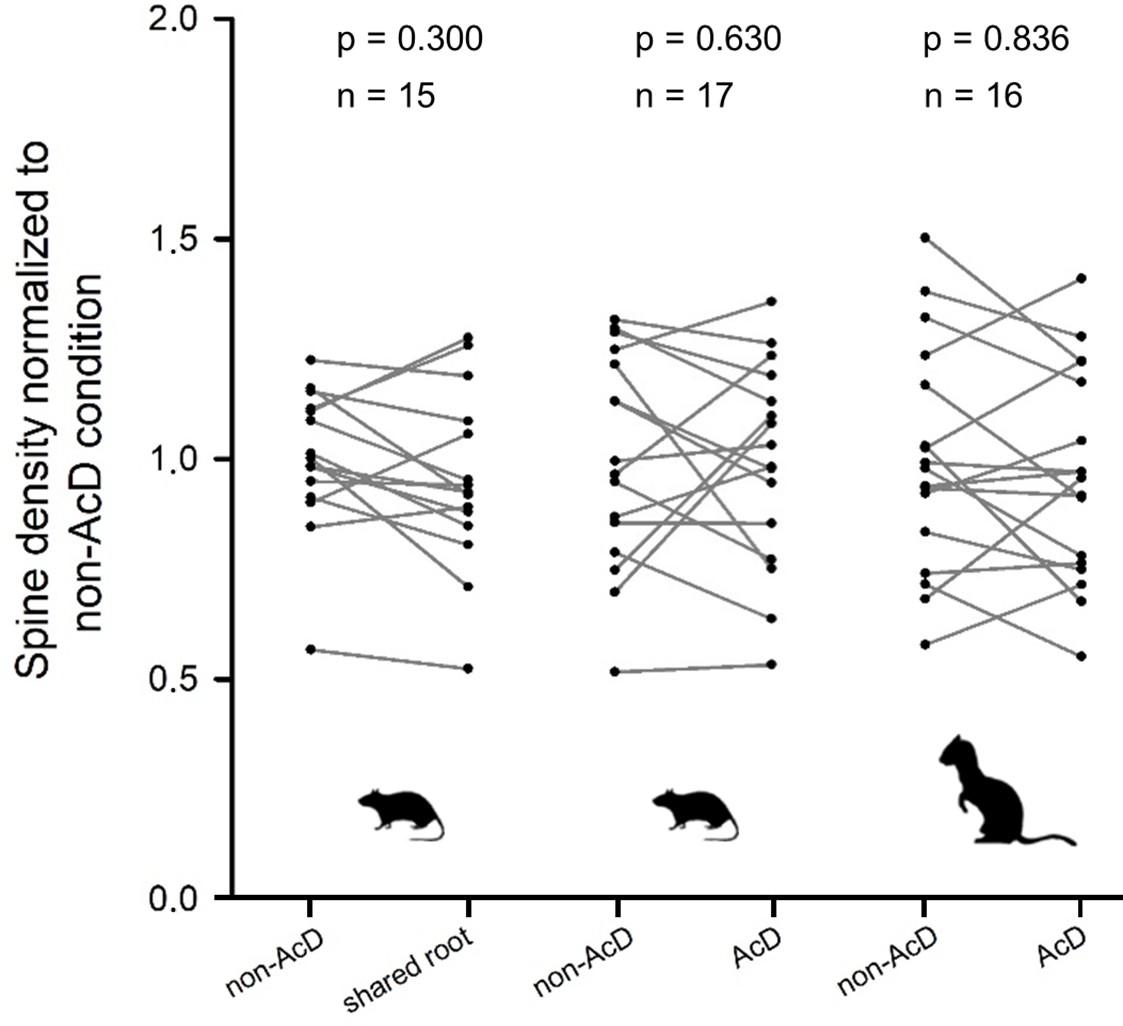
Spine density did not systematically differ between regular dendrites (non-axon carrying dendrites [non-AcDs]), dendrites sharing a root with a neighboring axon, and AcDs.
Data from adult rat and ferret biocytin material, values from each cell are connected by a line.
For normalization, the average of the non-AcD has been set to 1, and all values were expressed relative to this. Mann-Whitney rank sum test p-values and the sample size are reported above each plot.
-
Figure 6—source data 1
Data and statistical analysis of experiments shown in Figure 6.
- https://cdn.elifesciences.org/articles/76101/elife-76101-fig6-data1-v2.xlsx
Figure 7
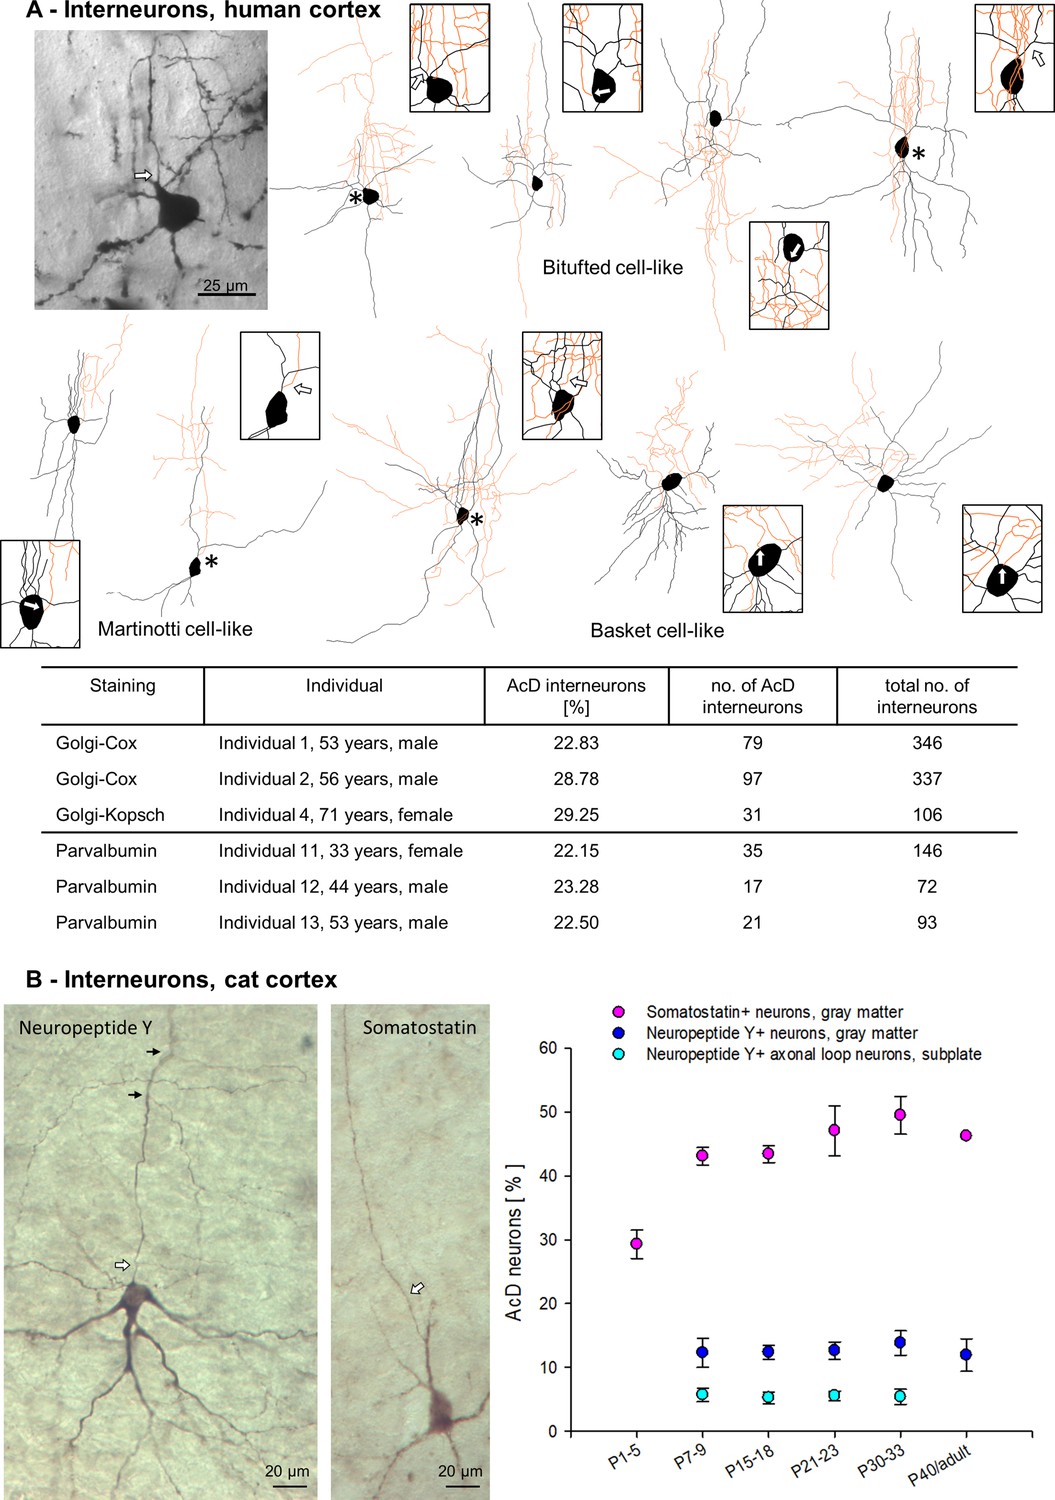
Axon carrying dendrite (AcD) interneurons in human and cat cortex.
(A) Photomicrograph of a representative Golgi-impregnated bitufted neuron with arcade-like initial axon from supragranular layers next to its reconstruction, followed by three further examples of bitufted, Martinotti (2), and basket cells (3). Axons in orange, somata and dendrites in black. Asterisks mark AcD neurons, boxes with arrows show the axon origin at higher magnification. In the table, the percentage of Golgi-impregnated AcD interneurons is reported for Individuals 1, 2, 4, followed by the percentages of Parvalbumin-positive AcD neurons of Individuals 11–13. (B) Photomicrograph of a layer VI neuropeptide Y-positive neuron with somatic axon, and a layer V Somatostatin-positive AcD neuron. Axons marked by white arrows, small black arrows mark collaterals. The graph shows percentages of AcD interneuron subsets at the ages indicated in developing cat occipital cortex (see Figure 7—source data 1 for sample size).
-
Figure 7—source data 1
Data and statistical analysis of experiments shown in Figure 7A and B.
- https://cdn.elifesciences.org/articles/76101/elife-76101-fig7-data1-v2.xlsx
Author response image 1
Tables
Table 1
Proportion of pyramidal neurons with AcD: rodents.
| Species; cortical area; staining method; age; sex | Proportion of AcD cells [%];n of cells assessed | By layers: supra %, infra % |
|---|---|---|
| Mouse S1 cortex, layer V;Thy1-EGFP/βIV-spectrin immunofluorescence | ||
| Adult, female | 17.42%, 178 cells | n.a. |
| Adult, female | 11.78%, 348 cells | n.a. |
| Adult, female | 15.79%, 36 cells | n.a. |
| Adult, female | 18.84%, 138 cells | n.a. |
| Adult, male | 21.93%, 187 cells | n.a. |
| Adult, male | 14.82%, 54 cells | n.a. |
| Adult, male | 10.17%, 59 cells | n.a. |
| Average [%], total n of cells | 15.82%, 1000 cells | |
| Rat visual cortex; biocytin tracing | ||
| Adult, male, two hemispheres | 17.82%, 174 cells | 15.06%, 17.69% |
| Adult, male, two hemispheres | 15.07%, 803 cells | 15.65%, 16.46% |
| Average [%], total n of cells | 16.45%, 977 cells | 15.36%, 17.08% |
-
AcD, axon carrying dendrite; n.a., not applicable.
Table 2
Proportion of pyramidal neurons with AcD: ungulate, carnivores.
| Species; cortical area; staining method; age; sex | Proportion of AcD cells [%];n of cells assessed | By layers: supra %, infra % |
|---|---|---|
| Kitten visual cortex gyral white matter; intracellular Lucifer yellow | ||
| P1, P2 (n = 2, sex n.d.) | 37.93%, 58 cells | n.a. |
| P10, P11 (n = 2, sex n.d.) | 44.64%, 56 cells | n.a. |
| P12, P14 (n = 2, sex n.d.) | 47.37%, 19 cells | n.a. |
| Average [%], total n of cells | 43.31%, 133 cells | |
| Kitten and adult cat visual cortex layer VI; intracellular Lucifer yellow | ||
| P1, P5 (n = 2, sex n.d.) | 20.18%, 114 cells | n.a. |
| P11 (n = 2, sex n.d.) | 17.65%, 51 cells | n.a. |
| P19, P30 (n = 2, sex n.d.) | 14.89%, 47 cells | n.a. |
| P52, P60 (n = 2, sex n.d.) | 20.00%, 30 cells | n.a. |
| Adult (n = 2, sex n.d.) | 17.95%, 39 cells | n.a. |
| Average [%], total n of cells | 18.13%, 281 cells | |
| Adult cat visual cortex;SMI-32/βIV-spectrin immunofluorescence | ||
| Individual 1, 3 months, sex n.d. | 13.35%, 978 cells | 14.42%, 14.55% |
| Individual 2, adult, sex n.d. | 14.92%, 496 cells | n.d. |
| Adult cat visual cortex; biocytin tracing | ||
| Individual 3, adult, sex n.d. | 13.44%, 655 cells | 12.50%, 15.85% |
| Individual 4, adult, sex n.d. | 17.14%, 70 cells | 18.52%, 12.50% |
| Individual 5, adult, sex n.d. | 13.93%, 316 cells | 13.12%, 15.79% |
| Individual 6, adult, sex n.d. | 19.13%, 230 cells | 19.34%,18.37% |
| Individual 7, adult, sex n.d. | 12.64%, 174 cells | 11.49 %, 19.23% |
| Average [%] individuals 1–7, total n of cells | 14.94%, 2919 cells | 14.90%, 16.05% |
| Ferret visual cortex; biocytin tracing | ||
| Individual 1, adult, female | 16.56%, 302 cells | 15.95%, 18.57% |
| Individual 2, adult, female | 14.66%, 191 cells | 15.39%, 13.11% |
| Individual 3, adult, female | 11.30%, 230 cells | 10.24%, 14.06% |
| Individual 4, adult, male | 13.07%, 329 cells | 13.45%, 12.26% |
| Average [%], total n of cells | 13.90%, 1052 cells | 13.76%, 14.50% |
| Pig dorsoparietal cortex;SMI-32/βIV-spectrin immunofluorescence | ||
| 3 months, European wild boar, female | 20.11%, 189 cells | 22.04%, 19.05% |
| 5 months, domestic, sex n.d. | 20.99%, 181 cells | n.d. |
| Average [%], total n of cells | 20.55%, 370 cells | 22.04%, 19.05% |
-
AcD, axon carrying dendrite; n.a., not applicable; n.d., not determined due to too weak staining.
Table 3
Proportion of pyramidal neurons with AcD: primates - macaque.
| Species; cortical area; staining method; age; sex | Proportion of AcD cells [%];n of cells assessed | By layers: supra %, infra % |
|---|---|---|
| Macaca mulatta premotor cortex; biocytin tracing | ||
| Individual 1, 11 years, male | 4.93%, 954 cells | 2.79%, 11.38% |
| Individual 2, 7 years, male | 3.10%, 816 cells | 2.93%, 6.32% |
| Individual 3, 5 years, male | 4.26%, 423 cells | 3.23%, 6.25% |
| Macaca mulatta parietal and visual cortex; SMI-32/βIV-spectrin immunofluorescence | ||
| Individual 4, 5 years, male | 5.99%, 717 cells | 2.59%, 13.95% |
| Individual 5, 10 years, male | 6.75%, 681 cells | 2.51%, 12.72% |
| Macaca fascicularis parietal cortex;Golgi-Kopsch method | ||
| Individual 6, adult, female | 3.58%, 307 cells | 4.82%, 6.90% |
| Individual 7, adult, male | 3.07%, 228 cells | 1.57%, 5.67% |
| Average [%] individuals 1–7, total n of cells | 4.53%, 4126 cells | 2.92%, 9.03% |
| Macaca mulatta visual cortex; biocytin tracing | ||
| Individual 8, P60, female | 4.51%, 377 cells | 1.28%, 5.88% |
| Macaca mulatta cingulate cortex;SMI-32/βIV-spectrin immunofluorescence | ||
| Individual 8, P60, female | 5.80%, 500 cells | 1.28%, 7.85% |
| Macaca mulatta premotor/M2 cortex;SMI-32/βIV-spectrin immunofluorescence | ||
| Individual 8, P60, female | 5.36%, 1249 cells | 1.34%, 9.05% |
| Average [%] individual 8, total n of cells | 5.22%, 2126 cells | 1.30%, 7.59% |
-
AcD, axon carrying dendrite.
Table 4
Proportion of pyramidal neurons with AcD: primates - human.
| Species; cortical area; staining method; age; sex | Proportion of AcD cells [%];n of cells assessed | By layers: supra %, infra % |
|---|---|---|
| Human temporal lobe;Golgi-Cox method | ||
| Individual 1, 53 years, male | 2.56%, 646 cells | 1.45%, 4.40% |
| Individual 2, 56 years, male | 2.79%, 825 cells | 0.96%, 4.66% |
| Human auditory cortex;Golgi-Kopsch method | ||
| Individual 3, 63 years, male | 0.79%, 253 cells | 0.69%, 0.91% |
| Individual 4, 71 years, female | 1.92%, 677 cells | 0.80%, 2.58% |
| Individual 5, 75 years, male | 0.47%, 215 cells | 0.00%, 0.80% |
| Individual 6, 88 years, female | 0.71%, 140 cells | 0.00%, 1.28% |
| Individual 7, 56 years, female | 1.72%, 407 cells | 1.27%, 2.34% |
| Human prefrontal agranular cortex;Golgi-Kopsch method | ||
| Individual 8, 46 years, female | 2.02%, 247 cells | n.d. |
| Individual 9, 77 years, male | 2.59%, 424 cells | n.d. |
| Individual 10, 87 years, female | 1.53%, 653 cells | n.d. |
| Human visual cortex area 18Golgi-Kopsch method | ||
| Individual 10, 87 years, female | 2.48%, 242 cells | 1.77%, 3.10% |
| Average [%] individuals 1–10, total n of cells | 1.96%, 4729 cells | 0.99%, 2.87% |
| Human auditory cortex gyral white matter;Golgi-Kopsch method | ||
| Individual 3, 63 years, male | 8.69%, 115 cells, | n.a. |
| Individual 4, 71 years, female | 8.88%, 135 cells, | n.a. |
| Individual 5, 75 years, male | 8.70%, 69 cells, | n.a. |
| Individual 6, 88 years, female | 9.18%, 98 cells, | n.a. |
| Average [%] individuals 3–6, total n of cells | 8.86%, 417 cells | n.a. |
-
AcD, axon carrying dendrite.
Key resources table
| Reagent type (species) or resource | Designation | Source or reference | Identifiers | Additional information |
|---|---|---|---|---|
| Antibody | anti-βIV-spectrin (Rabbit polyclonal) | Höfflin et al., 2017 | self-made | IF (1:500) |
| Antibody | anti-SMI-32 unphosphorylated neurofilaments (Mouse polyclonal) | Covance, Muenster, Germany | Cat # SMI-32r, RRID: AB_2315331 | IF (1:1000) |
| Antibody | anti-NeuN(Mouse monoclonal) | Merck (Millipore), Darmstadt, Germany | Cat # MAB377,RRID: AB_2298772 | IF (1: 1000) |
| Antibody | anti-Parvalbumin,(Rabbit recombinant) | SWANT, Marly Switzerland | Code No. PV 27 | IHC (1:5000) |
| Antibody | donkey anti-rabbit (Alexa-488 polyclonal) | Thermo Scientific, Waltham MA, USA | RRID: AB_2687506 | IF (1:1000) |
| Antibody | goat anti-rabbit (biotinylated polyclonal) | Dako A/S, Glostrup, Denmark | RRID: AB_2313609 | IHC (1:1000) |
| Antibody | goat, anti-mouse(Alexa-568 polyclonal) | Invitrogen, Carlsbad, CA, USA | RRID: AB_2534013 | IF (1:1000) |
| Antibody | sheep anti-mouse (biotinylated polyclonal) | GE Healthcare Life Sciences, Braunschweig Germany, | Amersham Cat # RPN1001 | IHC (1:200) |
| Chemical compound, drug | Streptavidin Alexa-488 | Thermo Scientific, Waltham MA, USA | Cat #S11223 | (1:1000) |
| Chemical compound, drug | ABC Elite horseradish peroxidase | Vector Labs Inc, Burlingame, CA, USA, | RRID: AB_2336827 | (1:250) |
| Other | DAPI stain | Invitrogen | D1306 | (1 µg/mL) |
| Software, algorithm | SigmaStat 12.3 | Systat Software GmbH | Frankfurt am Main, Germany |
Additional files
Download links
A two-part list of links to download the article, or parts of the article, in various formats.
Downloads (link to download the article as PDF)
Open citations (links to open the citations from this article in various online reference manager services)
Cite this article (links to download the citations from this article in formats compatible with various reference manager tools)
Neocortical pyramidal neurons with axons emerging from dendrites are frequent in non-primates, but rare in monkey and human
eLife 11:e76101.
https://doi.org/10.7554/eLife.76101


