Evolution and regulation of microbial secondary metabolism
- Program for Computational and Systems Biology, Memorial Sloan Kettering Cancer Center, United States
- BioISI – Biosystems & Integrative Sciences Institute, Faculty of Sciences, University of Lisboa, Portugal
- Department of Medicine, Weill Cornell Medical College, United States
Figures
Figure 1 with 2 supplements
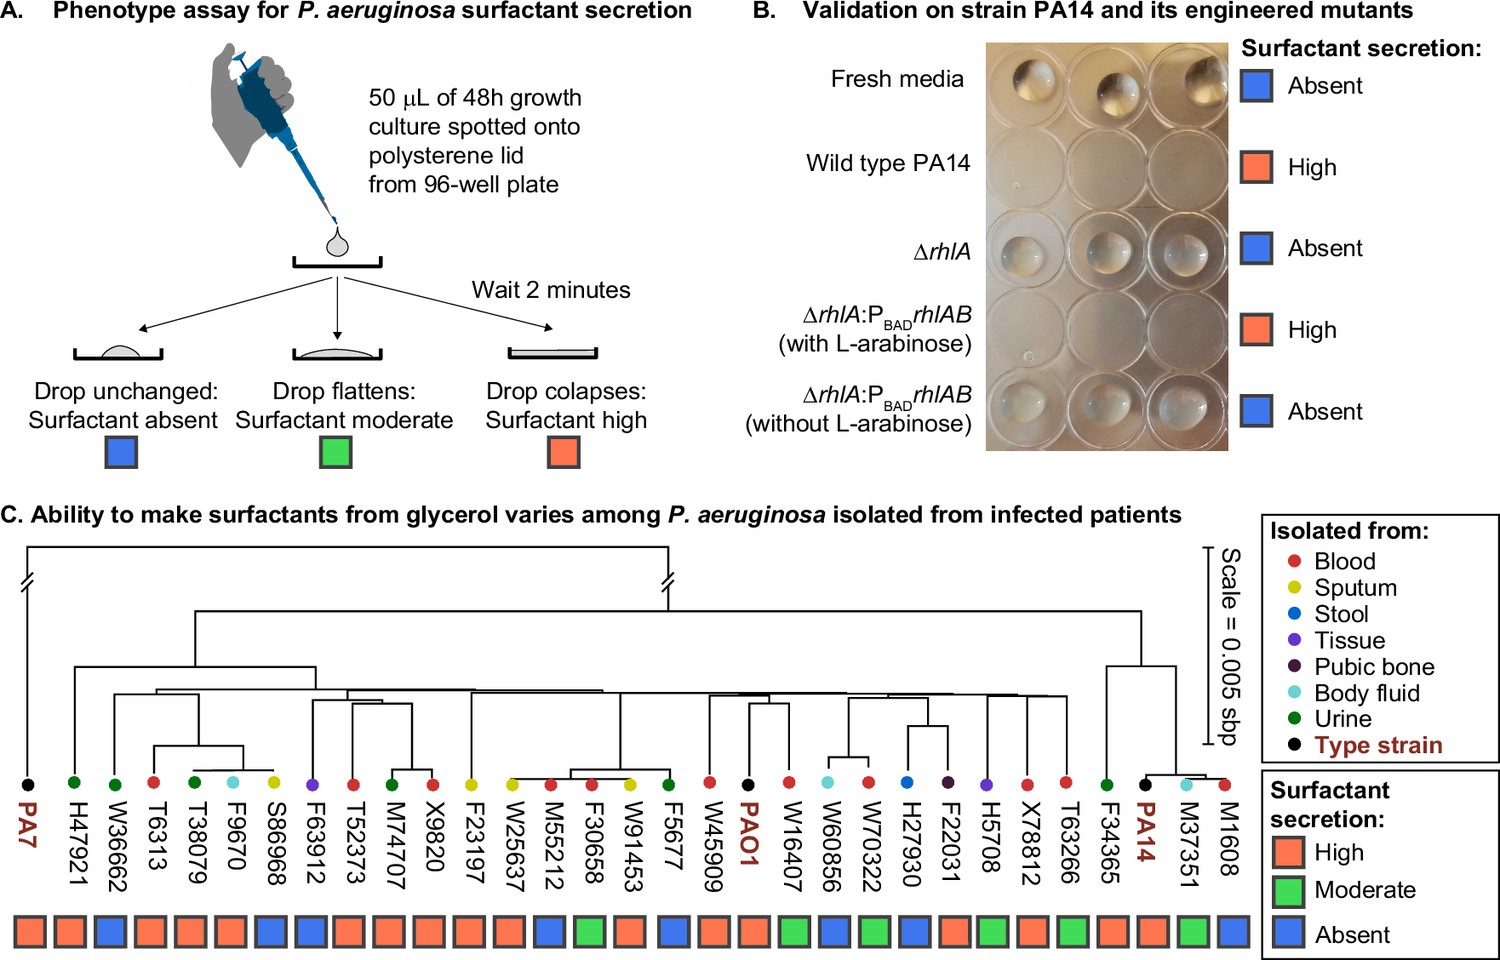
The ability to make surfactants from glycerol and reduce the surface tension of its liquid medium varies widely among clinical isolates of Pseudomonas aeruginosa, is uncorrelated with phylogeny, and is not associated with the tissue of origin.
(A) The drop collapse assay assesses the ability of P. aeruginosa to reduce the surface tension of its media by looking at the shape of a drop placed onto polystyrene. (B) The phenotypic assay in the wild-type PA14 (which can make surfactants from glycerol) is compared with the PA14 ΔrhlA isogenic mutant (which does not produce the rhamnolipid biosurfactants because it lacks a key biosynthetic gene). We also included the complementation mutant PA14 ΔrhlA PBADrhlA with and without the inducer of the PBAD promoter, L-arabinose. As expected, the ability to reduce surface tension is only present in the PA14 wild type and in the induced PBAD mutant. The ΔrhlA and the PBAD mutant in the absence of L-arabinose show high surface tensions like the fresh media. (C) A phylogenetic tree built from the core genome of 28 clinical isolates obtained from patients with cancer at Memorial Sloan Kettering Cancer Center (Lind et al., 2015; Cai et al., 2017) and the three type strains PAO1, PA14, and PA7. The tissue where each isolate was originally obtained from is indicated by the colored circles. The surfactant phenotype was assessed for all strains using the drop collapse assay after growth in glycerol minimal medium. The phenotype shows no obvious pattern with phylogeny or tissue of origin.
Figure 1—figure supplement 1

Phylogenetic ancestor state reconstruction of surfactant secretion from glycerol minimal media.
Pie charts at the ancestor nodes of branches represent the relative likelihood proportion of each phenotypic state. PA7, a Pseudomonas aeruginosa isolate is used to root the tree.
Figure 1—figure supplement 2

A principal component analysis (PCA) of the matrix of presence/absence of genes in each strain.
The matrix was constructed using the set of all genes in the accessory genome (genes present in some strains but not all) shows no obvious differences distinguishing surfactant producers from non-producers.
Figure 2 with 2 supplements

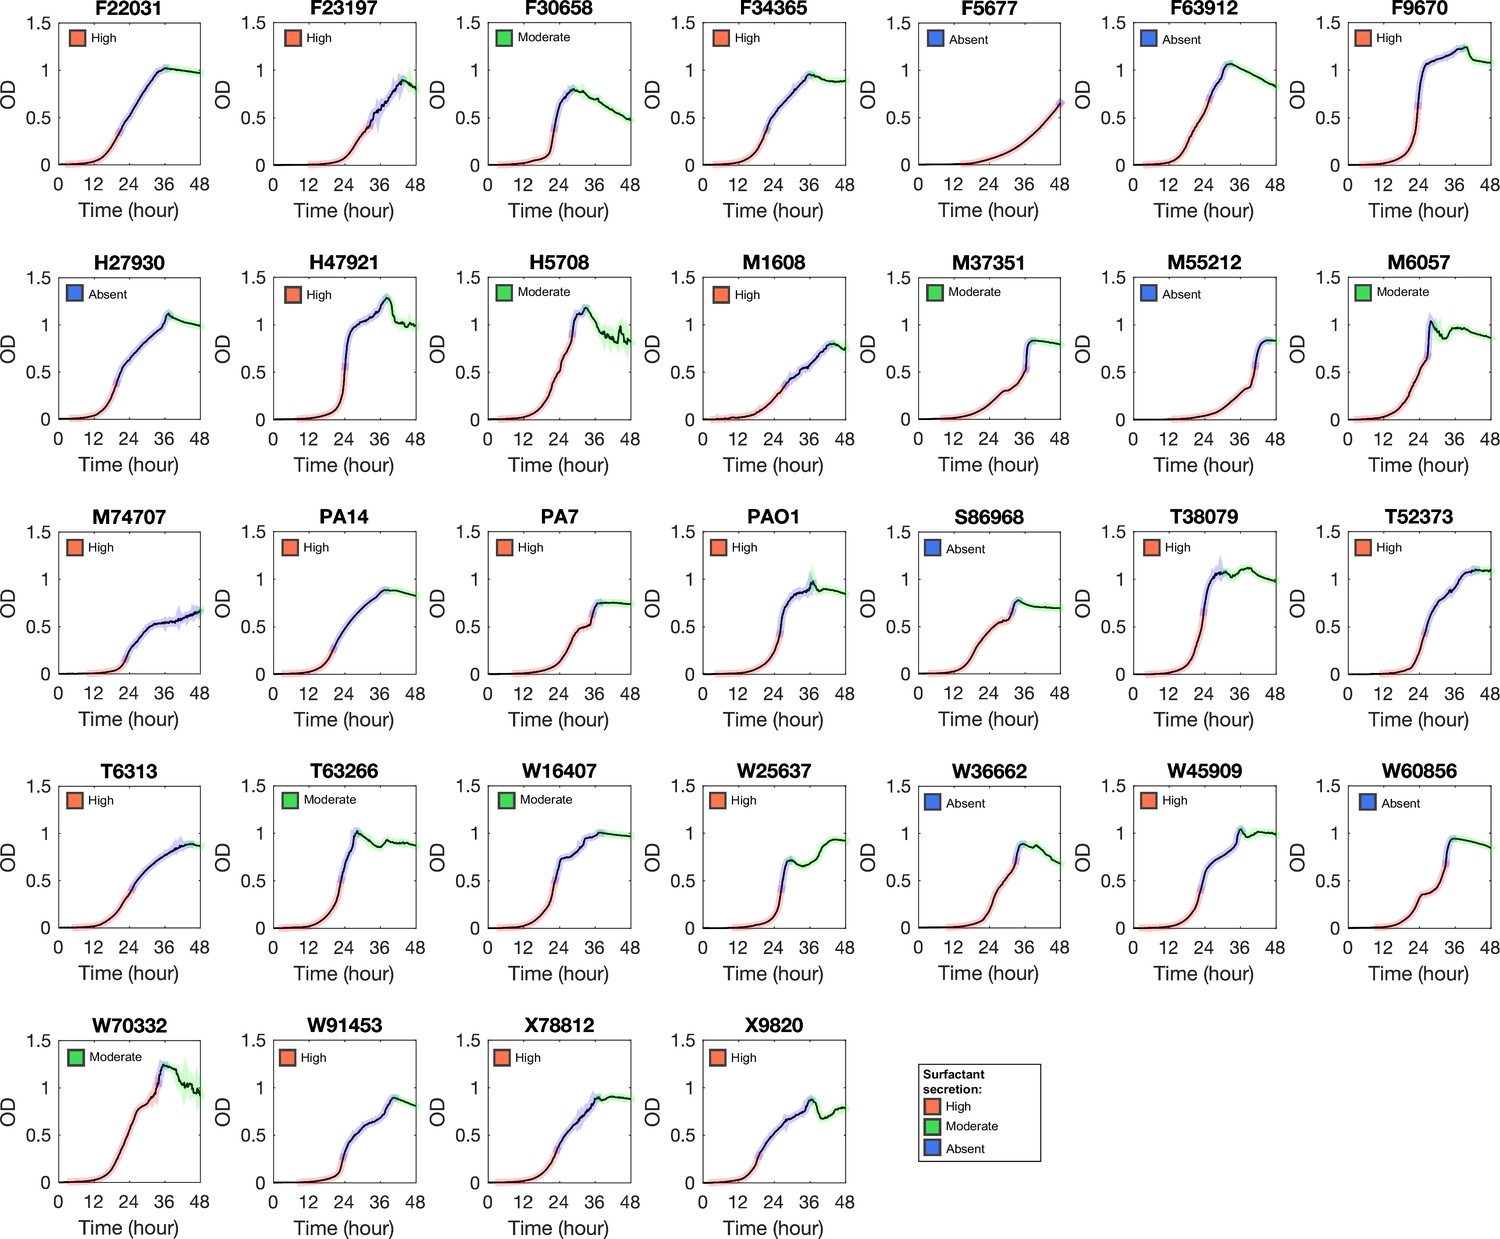
The shape of the growth curve in glycerol minimal media distinguishes surfactant producers from non-producers.
(A) Growth curves obtained in glycerol minimal media for producers (high and moderate, in orange) and non-producers (in blue). (B) We used two types of analysis: first, non-negative matrix factorization (NNMF) was used to decompose the growth curves into three additive basis functions (features). Each growth curve can be approximately represented by the weighted sum of these functions. The components 1 and 2 (basis function multiplied by weights; left panels) and weights (right panels) from NNMF of surfactant producers differ from non-producers. The shaded areas represent 95% bootstrap confidence intervals of the mean. (C) Second, we used supervised feature selection by random forest classifier, first divides each growth curve (excluding the initial lag phase) into three phases. (D) Each phase is described by seven quantitative features. (E) The random forest analysis quantifies the importance of each feature in distinguishing producers from non-producers. Inset: boxplot of maximum specific growth rate of phase I grouped by surfactant production. Welch’s t-test was used in (D) and (G) for significance testing. ****, p-value ≤0.0001; *, p-value ≤0.05; ns, p-value >0.05.
Figure 2—figure supplement 1
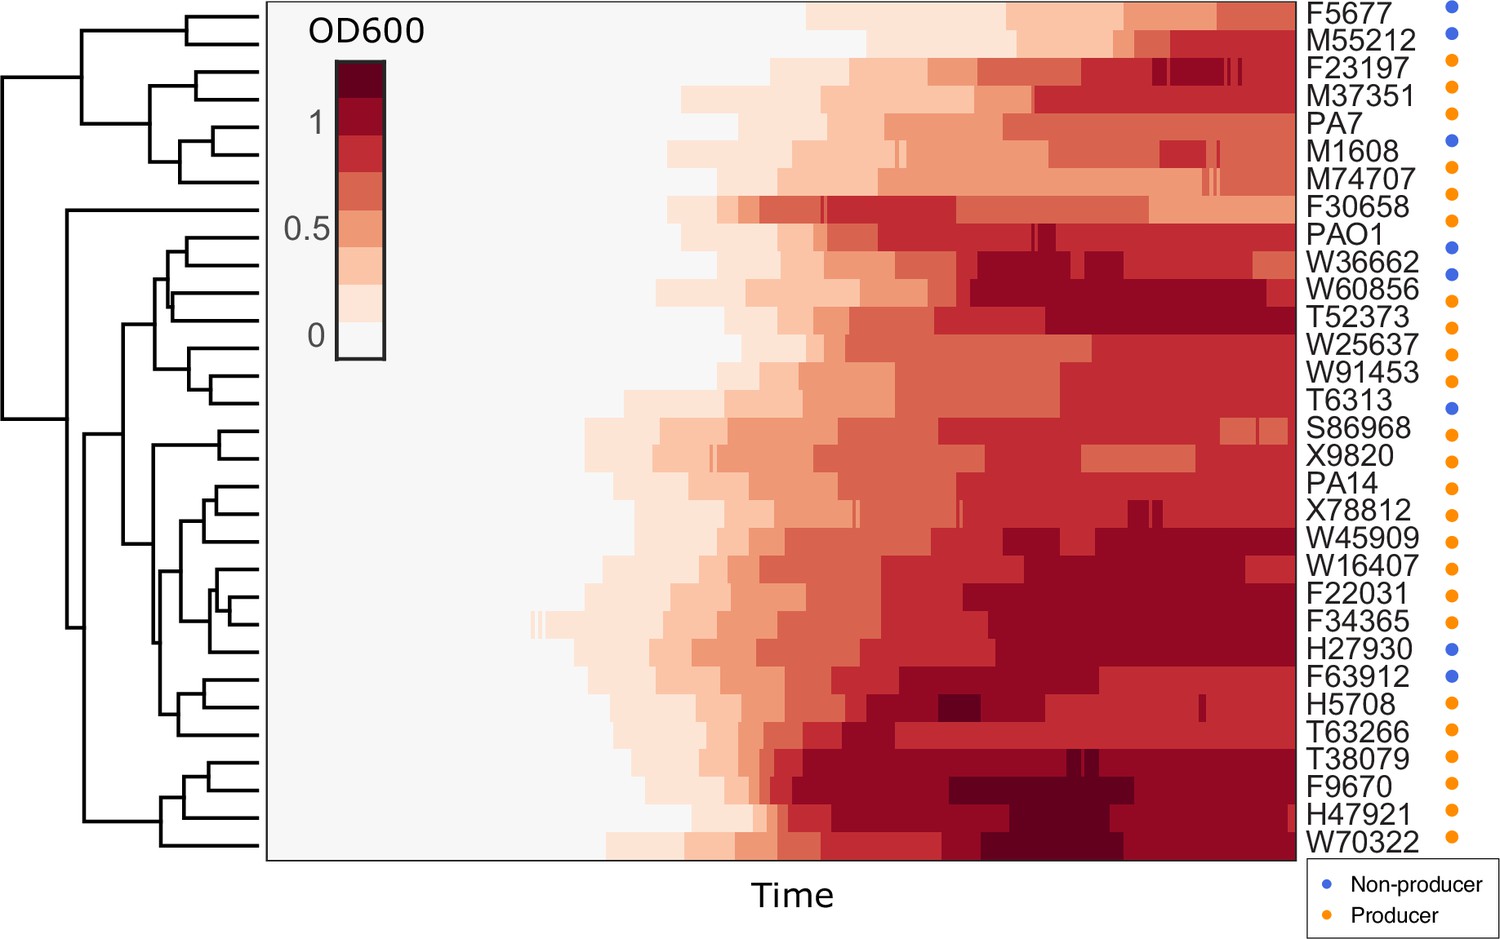
Hierarchical clustering of growth curves of Pseudomonas aeruginosa clinical isolates and three type strains PA14, PAO1, and PA7 in glycerol minimal medium.
Euclidean distance was used as the measure of similarity.
Figure 2—figure supplement 2
Growth curve of Pseudomonas aeruginosa strains in glycerol minimal medium.
Phase I, II, and III are colored by red, blue, and green, respectively.
Figure 3 with 4 supplements
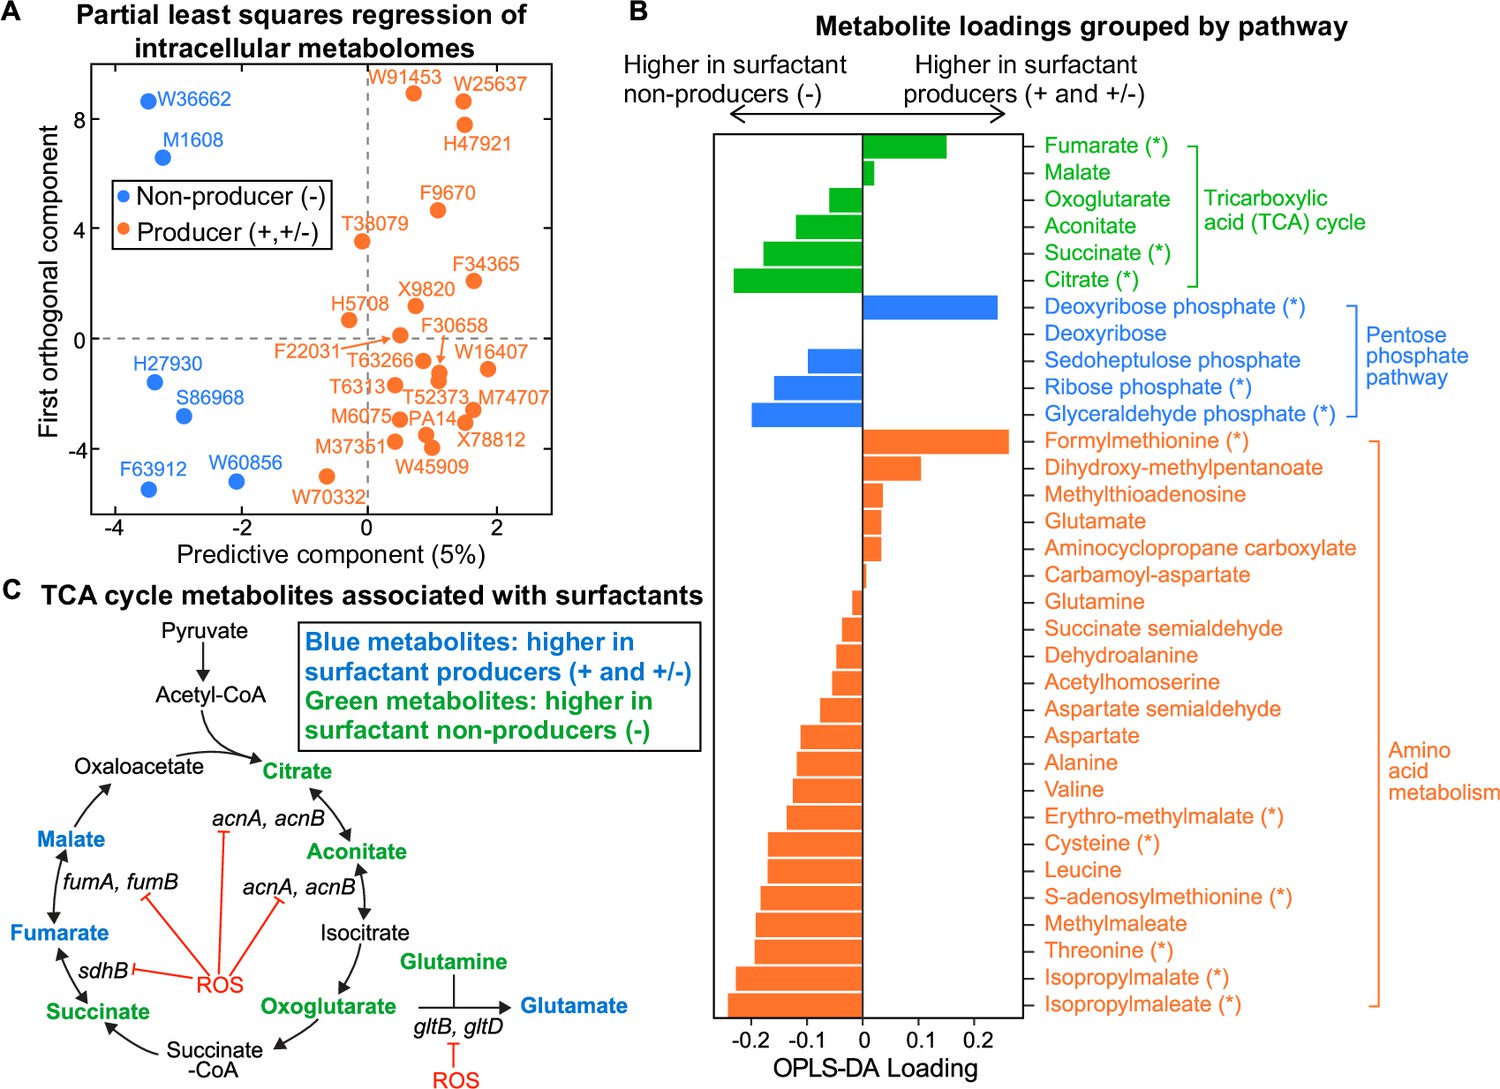
Intracellular metabolites measured in glycerol minimal media differ between surfactant producers and non-producers.
(A) OPLS-DA (orthogonal partial least squares discriminant analysis) was used to compare the intracellular metabolomes of producers (high and moderate) and non-producers. The predictive component is high in producers and low in non-producers. (B) OPLS-DA loading values for the predictive component of a selected number of metabolites. Metabolites with asterisk (*) are significantly different between producers and non-producers (adjusted p-value of a Mann-Whitney test <0.05). (C) Differential abundance of metabolites involved in reactions catalyzed by some Fe-S-containing enzymes whose activities are inhibited by reactive oxygen species (ROS). Abbreviations: acnA: aconitate hydratase A, acnB: aconitate hydratase B, sdhB: succinate dehydrogenase subunit, fumA: fumarase A; fumB: fumarase B; gltB: glutamate synthase subunit; gltD: glutamate synthase subunit.
Figure 3—figure supplement 1
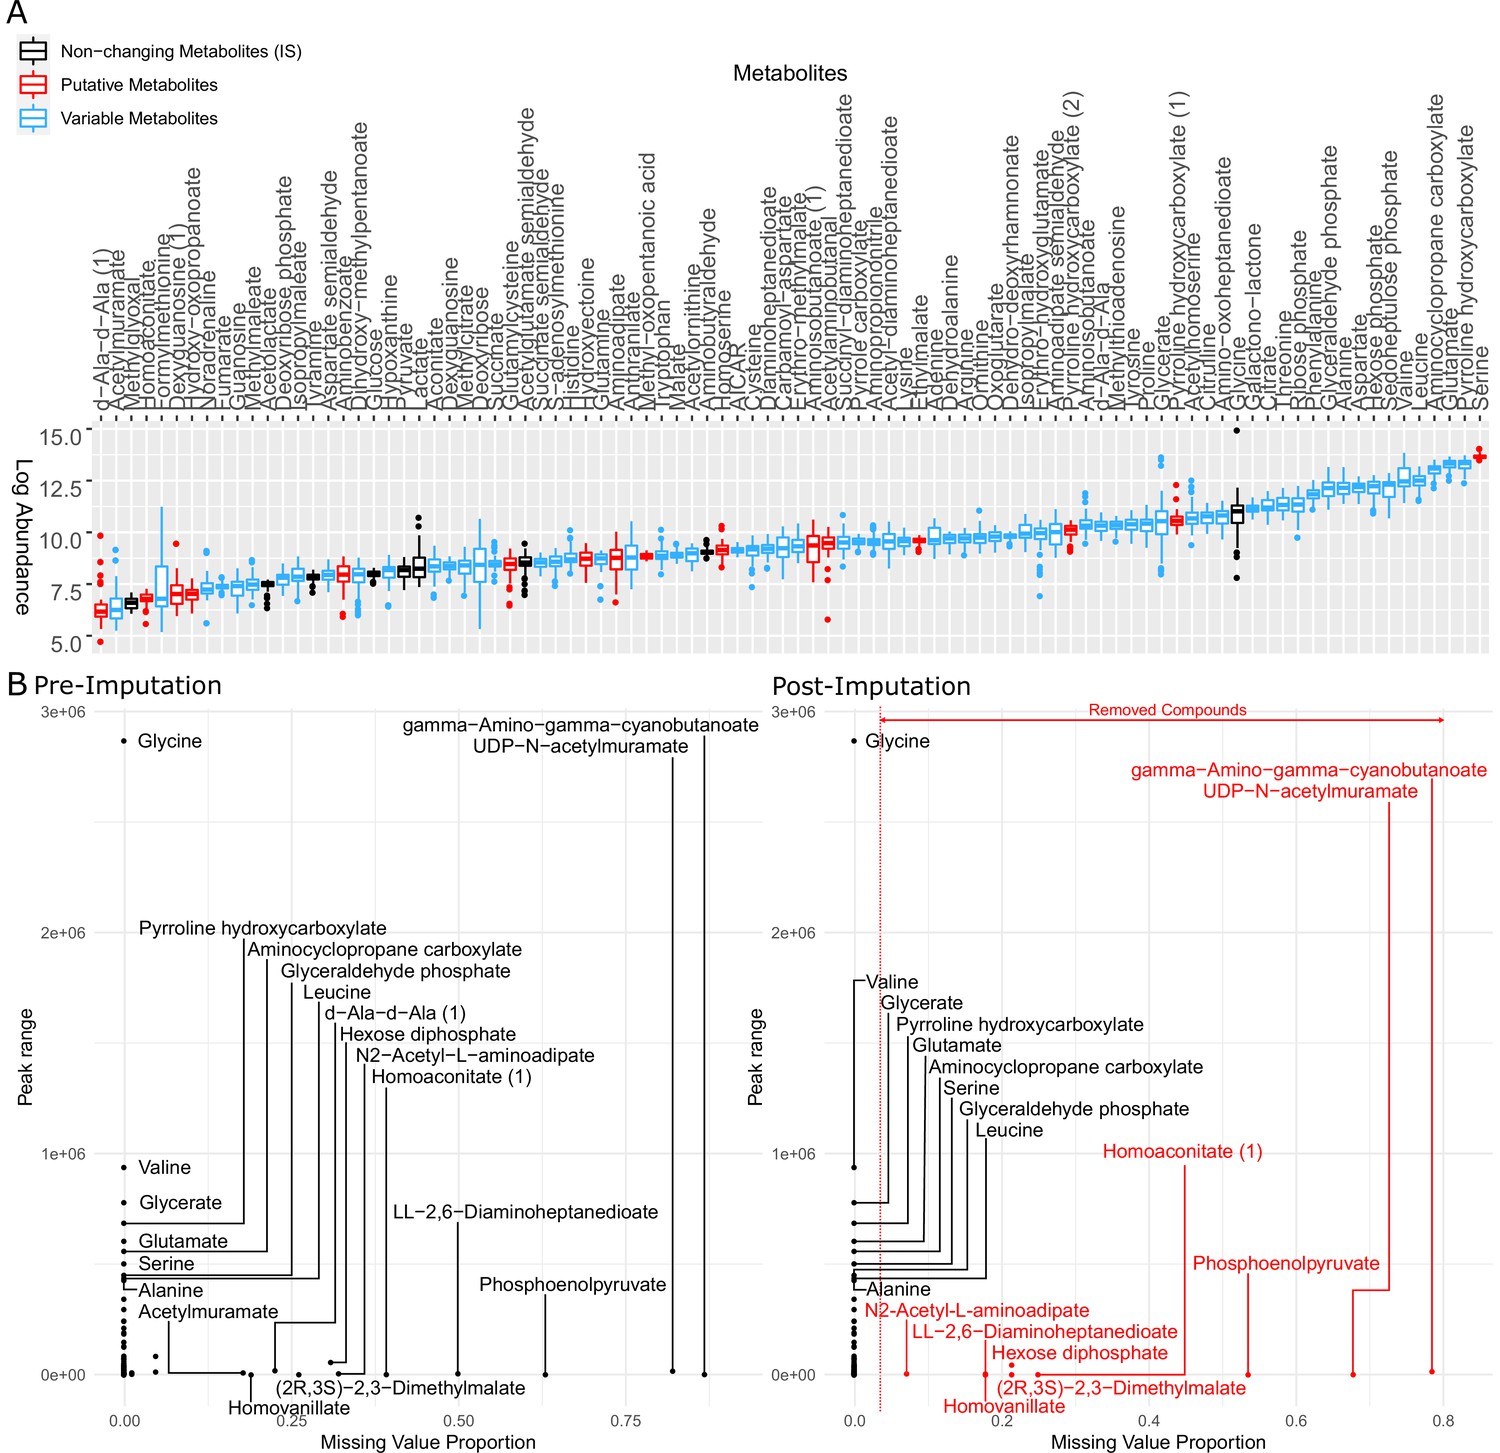
Metabolites identified in this study were examined and imputed to represent the profile of all 31 strains for further analysis.
(A) Logarithm of raw peak area of all metabolites identified by LC-MS (liquid chromatography-mass spectrometry). The metabolites in black were used as internal standard in the data normalization step but removed from the dataset afterward. The metabolites in red are putative metabolites that were initially included in clustering metabolomics but later removed from the heatmap (Figure 3—figure supplement 2). The metabolites in blue are variable among clinical isolates and therefore used for later on analysis. (B) Metabolite peak area before (left panel) and after (right panel) imputation. The missing value proportion of a metabolite in the x-axis represents the frequency of missing values of the metabolite across all replicates of all strains in our study. The peak range of a metabolite in the y-axis is defined as the maximum peak area minus the minimum peak area among all non-missing values of the same metabolite across all our strains.
Figure 3—figure supplement 2
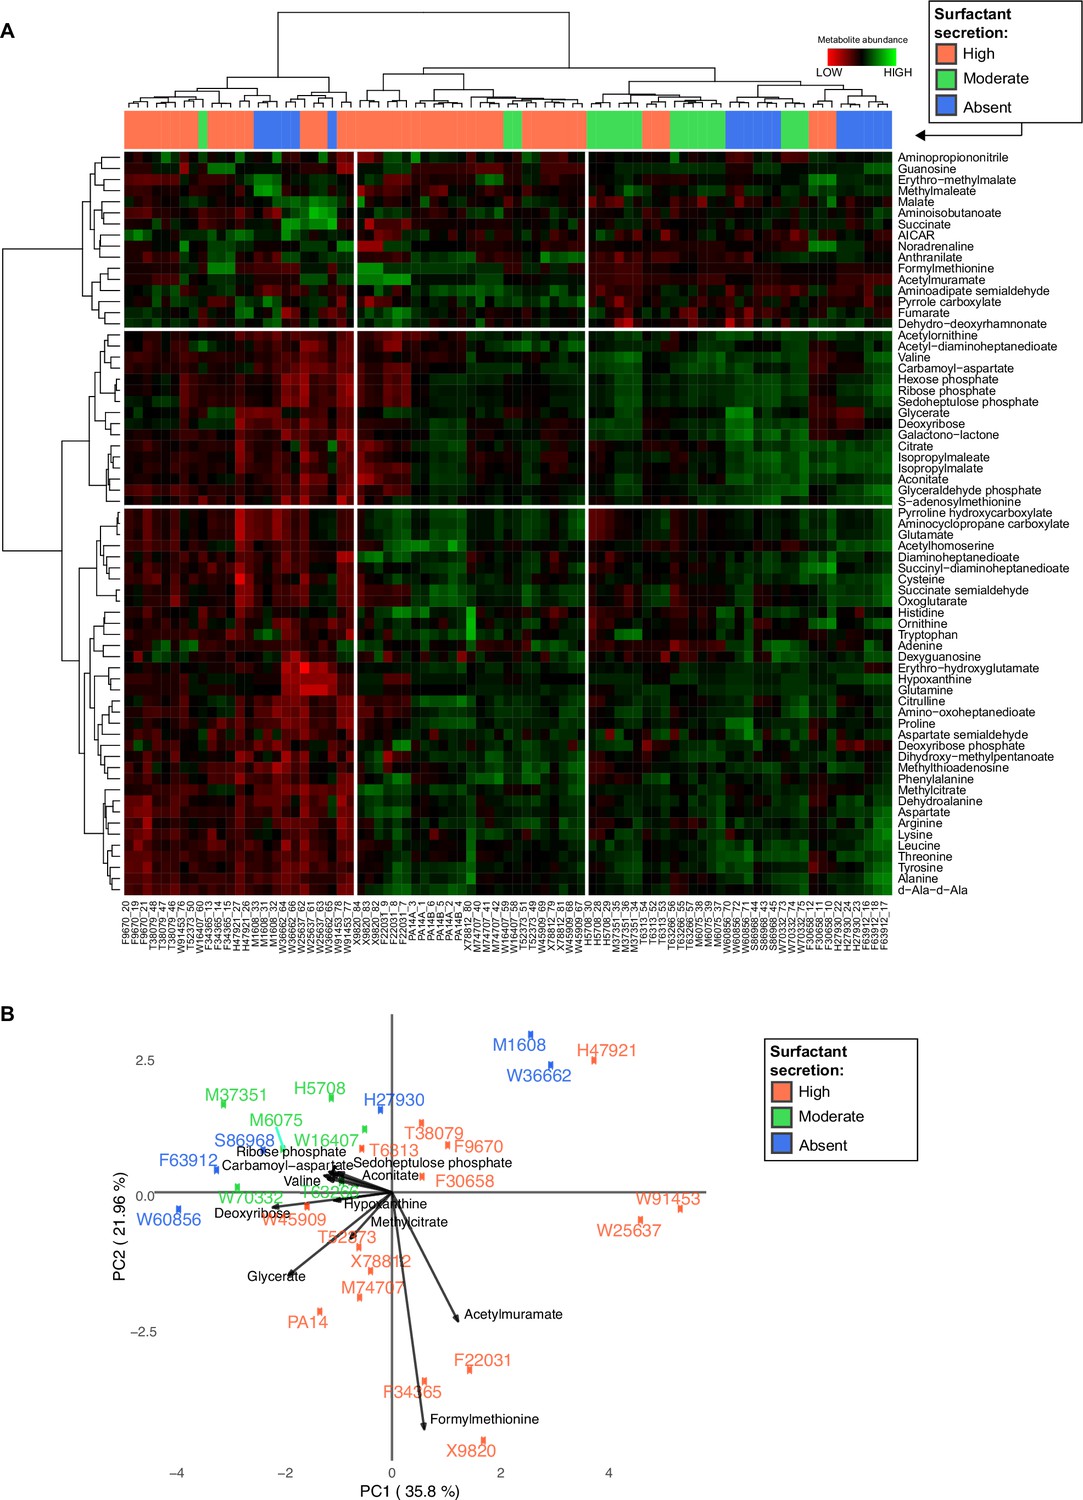
Variance and clustering analysis of metabolomics across Pseudomonas aeruginosa strains.
(A) Hierarchical clustering of the metabolic profiles using Euclidean distance and Ward aggregation method. Each row represents one metabolite, and each column represents a specific sample (both strain and sample number are indicated); high levels represented in green, and low levels represented in red. (B) Principal component analysis (PCA) plot of metabolites from liquid chromatography-mass spectrometry. The surfactant strong producers (+) occupy different regions, but the separation among the three groups cannot be explained using PC1 or PC2. Strains from the purple (−, production absent) and green (±, production moderate) groups occupy overlapping regions.
Figure 3—figure supplement 3
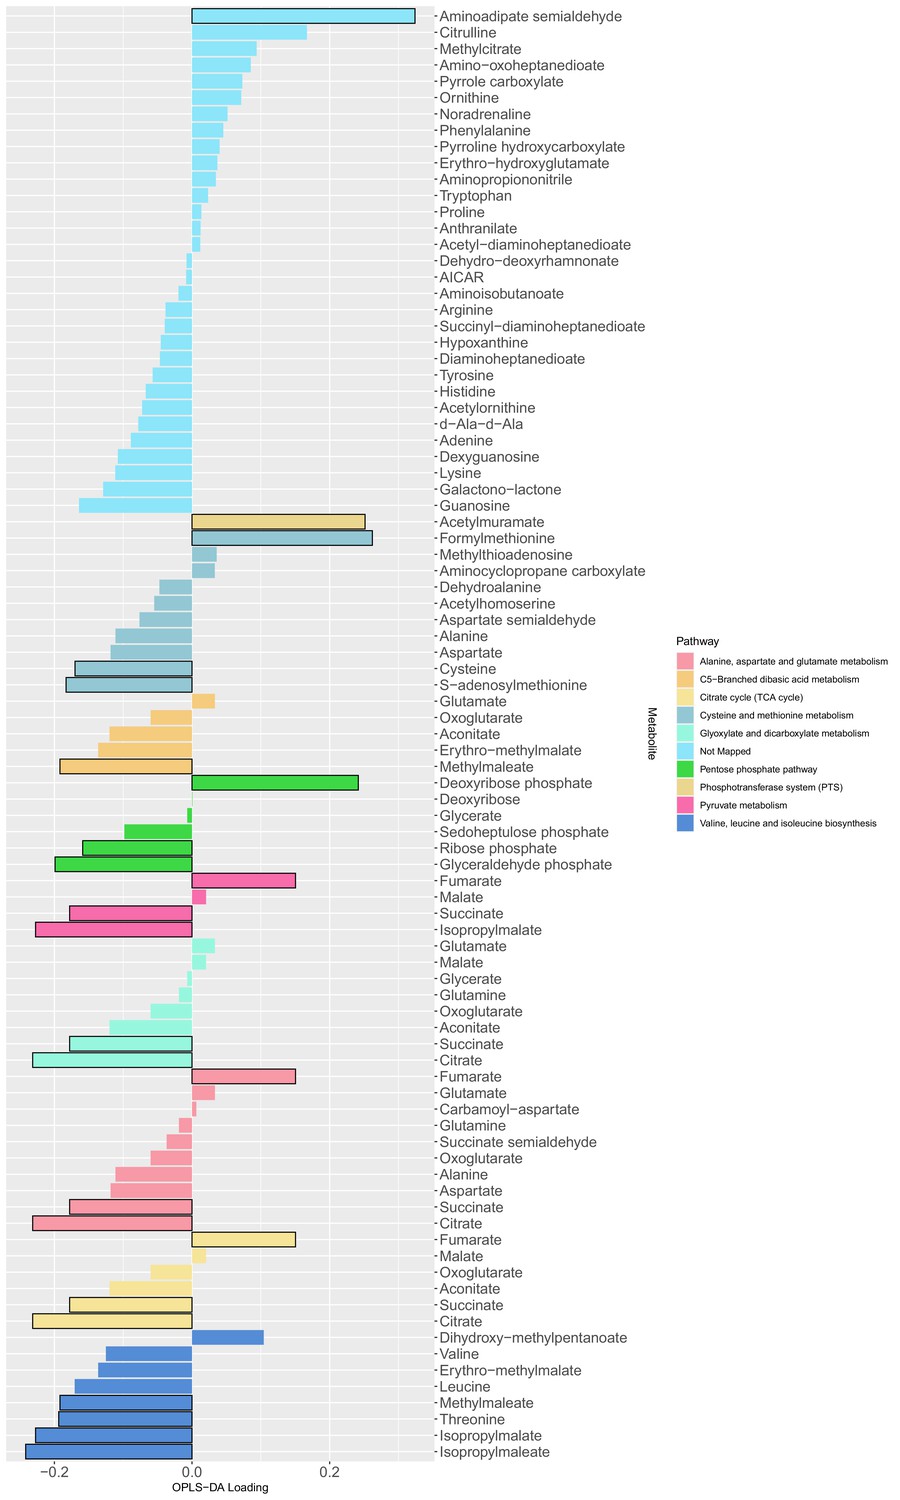
The loading values of all predictive metabolites of the orthogonal partial least squares discriminant analysis model.
The differential metabolites between producers and non-producers were determined by a Mann Whitney test (adjusted p-values with Benjamini-Hochberg method) with a level of significance of 0.05 (bars with black outline) and used as input for a metabolic pathway enrichment with FELLA algorithm. The colors indicate the mapped metabolite pathway for each metabolite.
Figure 3—figure supplement 4
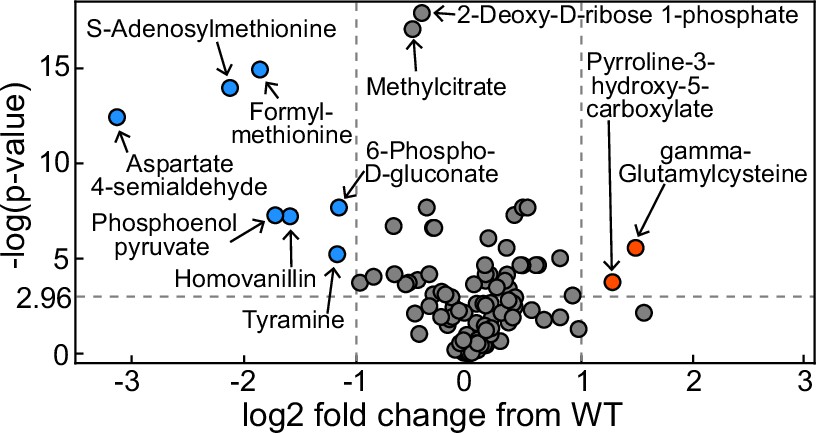
Volcano plot of metabolomics data between wildtype (WT) Pseudomonas aeruginosa PA14 strain and its ΔrhlA mutant grown in glycerol minimal medium (replotted with permission from Bayram et al., 2016).
A positive log2 fold change indicates a metabolite enriched in the mutant compared to theWT. The dots in red represent metabolites significantly enriched in the mutant, the dots in blue represent metabolites significantly reduced in the mutant.
Figure 4 with 1 supplement
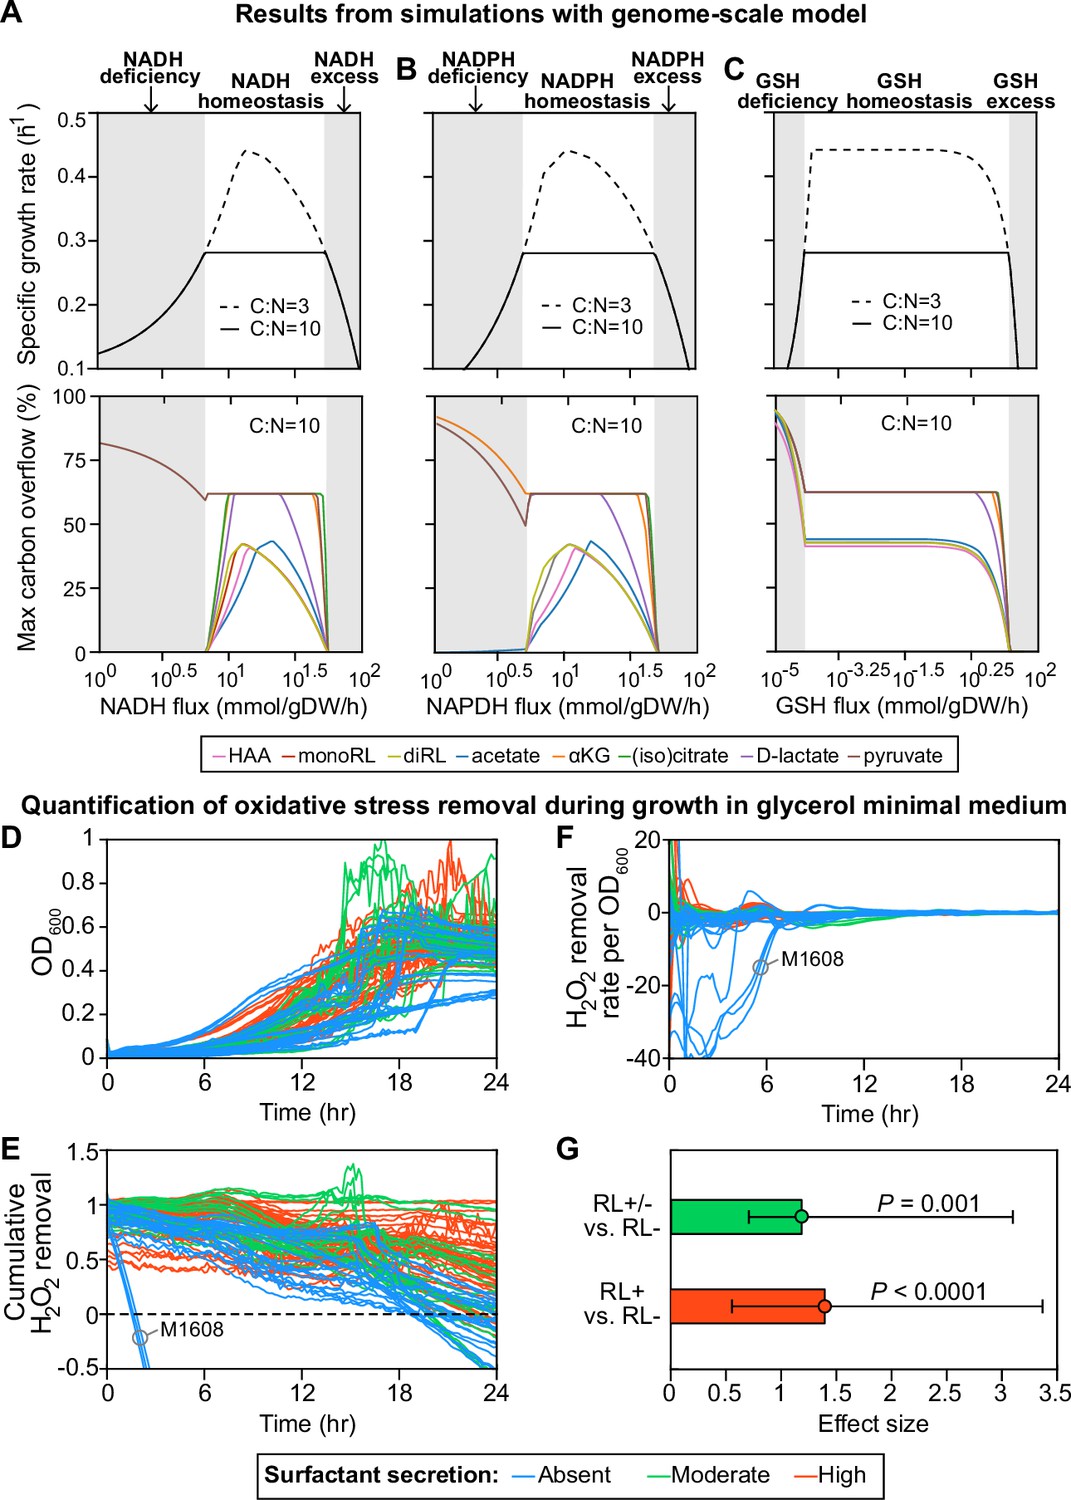
Computer simulations using flux-balance analysis and experiments with H2O2 indicate that the ability to produce surfactants in glycerol media depends on a strain’s ability to reduce oxidative stress.
(A-C) Computer model: the simulations vary the redox balance of Pseudomonas metabolism by altering the fluxes of (A) NADH (reduced nicotinamide adenine dinucleotide), (B) NADPH (reduced nicotinamide adenine dinucleotide phosphate), and (C) GSH (reduced glutathione). The upper panels show the predicted maximum growth rates, and lower panels are predicted maximum byproduct secretion fluxes. C:N indicates the carbon-to-nitrogen influx ratio provided by the culture medium. C:N=3 and C:N=10 represent carbon- and nitrogen-limiting conditions, respectively. Abbreviations: HAA: 3-(3-hydroxyalkanoyloxy) alkanoate; monoRL: monorhamnolipid; diRL: dirhamnolipid; aKG: alpha-ketoglutarate. (D–G). Experimental comparison of the ability to remove hydrogen peroxide (H2O2) among strong surfactant producers (+), weak producers (±), and non-producers (−). (D) Population density (OD600). (E) The total amount of hydrogen peroxide removed from the environment. Negative values indicate net cellular production of hydrogen peroxide released to the environment. (F) The specific hydrogen peroxide removal rate. In both (E) and (F), each trajectory of H2O2 fluorescence intensity was normalized to the averaged trajectory of the wild-type PA14 strain. (G) Effect size of surfactant production as a predictor of H2O2 removal rate per unit of OD600 determined by a linear mixed-effect model shows that producers can reduce oxidative stress better than non-producers.
Figure 4—figure supplement 1
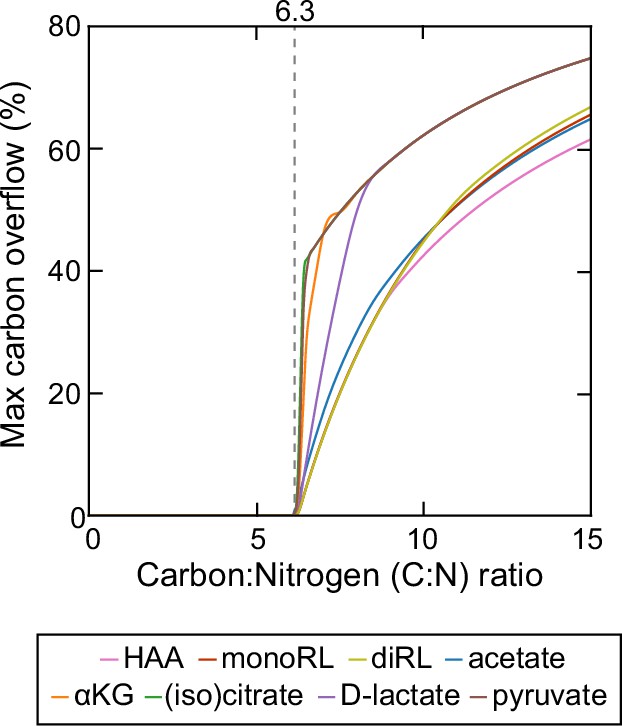
Theoretical estimation of threshold carbon (glycerol):nitrogen (ammonium) ratio above which carbon is in excess in the sense that carbon release through rhamnolipids and central carbon metabolites does not compromise biomass production.
Abbreviations: HAA: 3-(3-hydroxyalkanoyloxy) alkanoate; monoRL: monorhamnolipid; diRL: dirhamnolipid; aKG: alpha-ketoglutarate.
Figure 5 with 2 supplements
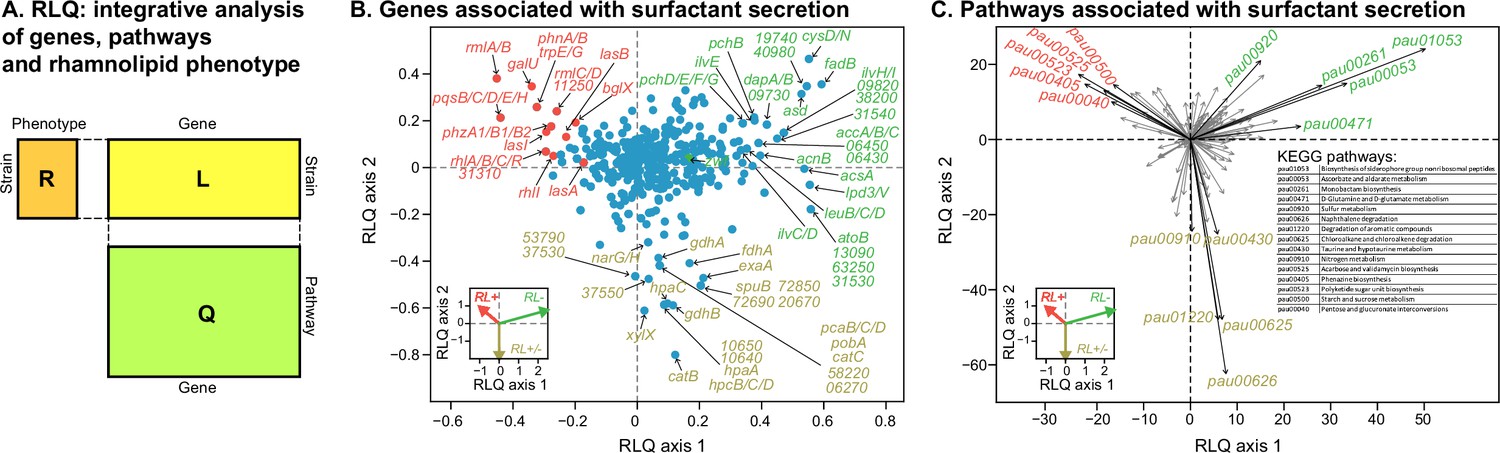
Transcriptomic data, analyzed using the RLQ analysis, reveals genes and metabolic pathways with expression associated with the ability to produce surfactants in glycerol minimal media.
(A) RLQ provides a way to analyze simultaneously associations from three tables. The results reveal not only the genes (B) but also the pathways (C) whose expression is associated with the rhamnolipid phenotype. The insets in both (B) and (C) represent the surfactant secretion phenotype (assessed in glycerol) in the two principal RLQ axes. Genes and pathways align with the direction of each phenotypic category: in panel (C), the top five pathways (‘pau’ are KEGG pathway IDs) associated with each phenotype are highlighted in black. The five-digit number in panel (C) represents the PA14 locus ID.
Figure 5—figure supplement 1
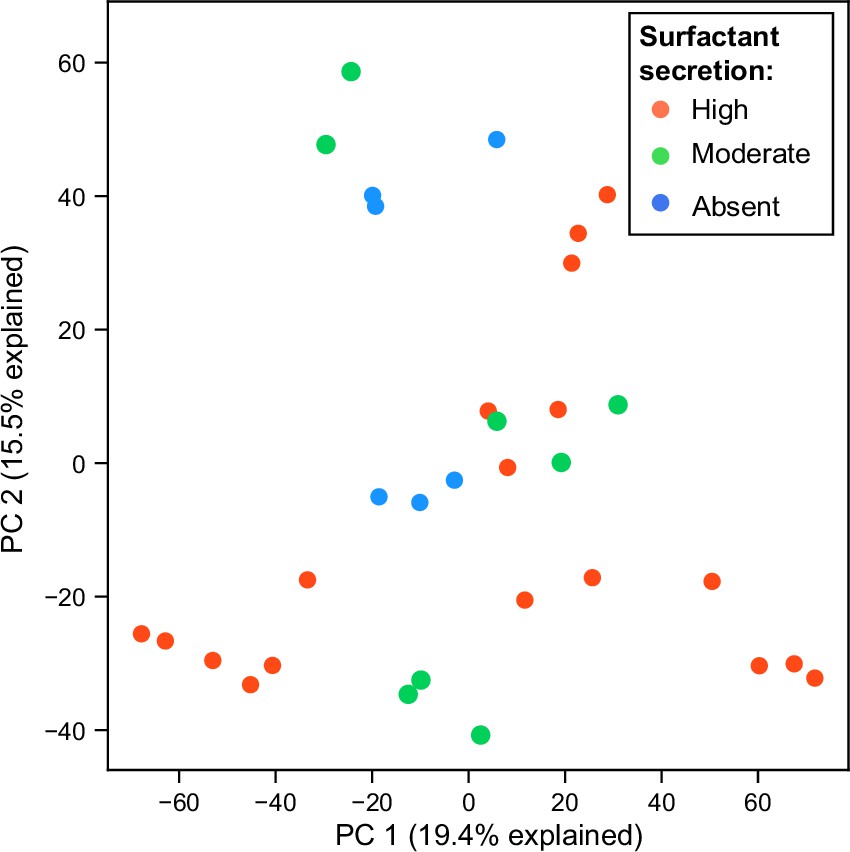
Principal component analysis (PCA) plot of RNA expression colored by surfact production phenotypes in glycerol minimal media.
Each dot represents a replicate of an RNA-seq experiment.
Figure 5—figure supplement 2
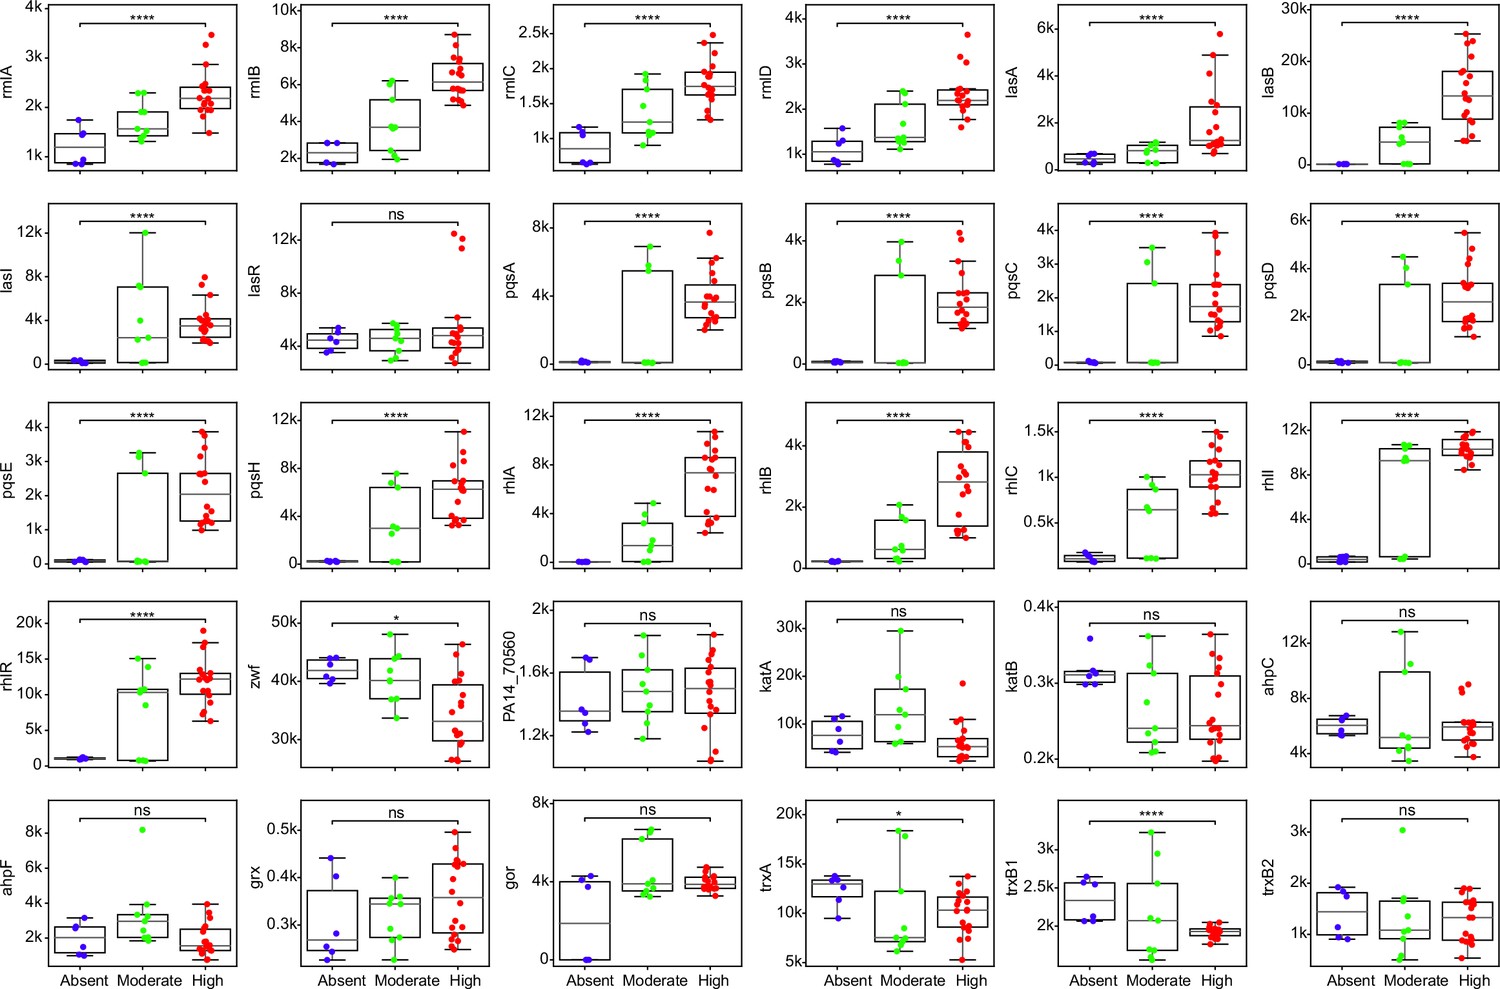
Comparisons of expression for selected genes across strains with different abilities of surfactant biosynthesis from glycerol.
Each dot represents a replicate of an RNA-seq experiment. Mann-Whitney U test with false discovery rate (FDR) method for multitest correction. ****, p<0.0001; *, p<0.05. ns, non-significant.
Figure 6
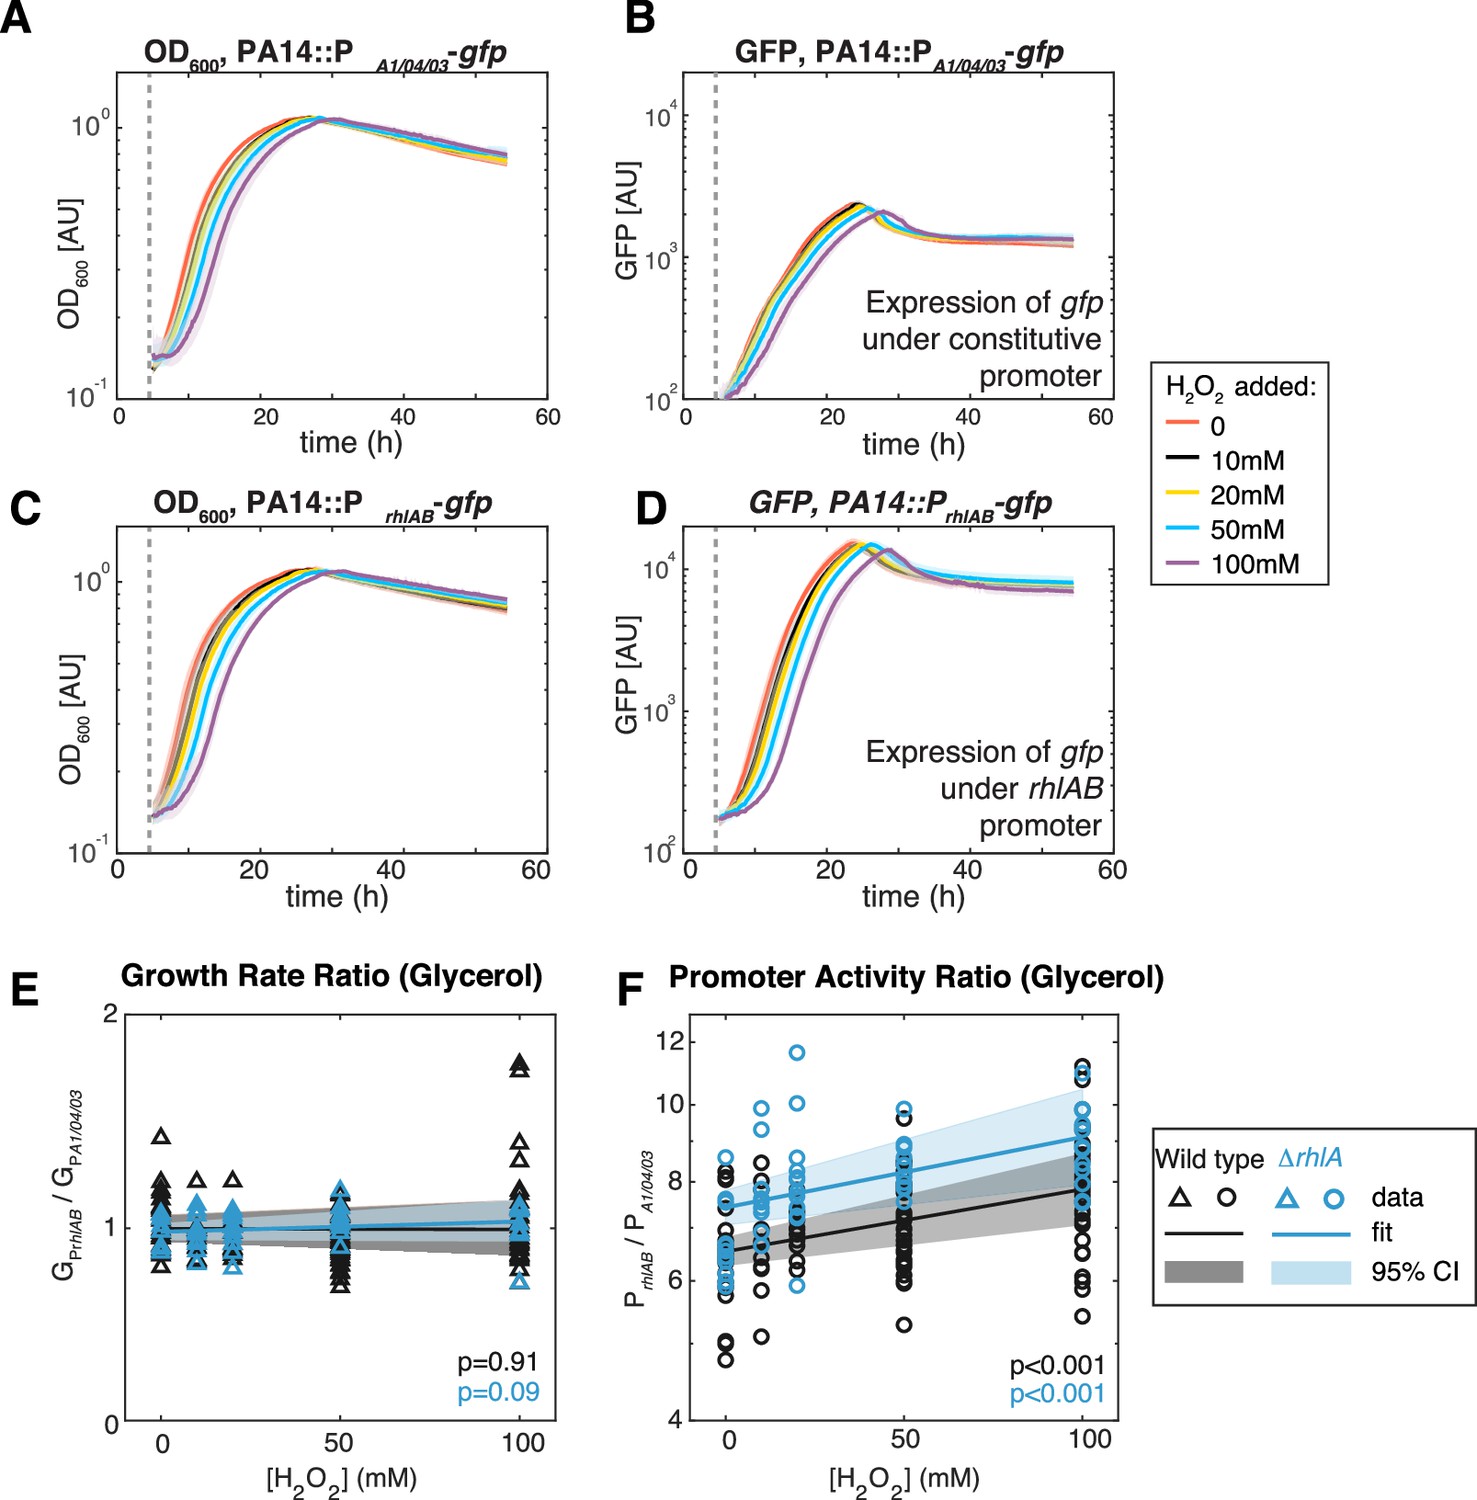
Extrinsic oxidative stress by adding H2O2 increases PrhlAB activity without impacting cell growth in the stain PA14 in glycerol medium.
(A–D) Growth (A, C) and gfp expression (B, D) of PA14::PA1/04/03-GFP (constitutive promoter) and PA14::PrhlAB-GFP (rhlAB promoter) with increasing levels of H2O2 added to the media at the beginning of exponential growth (gray dash line). The shaded area represents the range of all replicates from the same experiment. (E, F) The ratio of growth rate (E) and promoter activity (F) of PA14::PrhlAB-GFP to PA14::PA1/04/03-GFP in phase II under different levels of H2O2 in glycerol minimal media. The p-value quantifies the significance of the coefficient (slope) obtained from linear fitting.
Figure 7 with 1 supplement
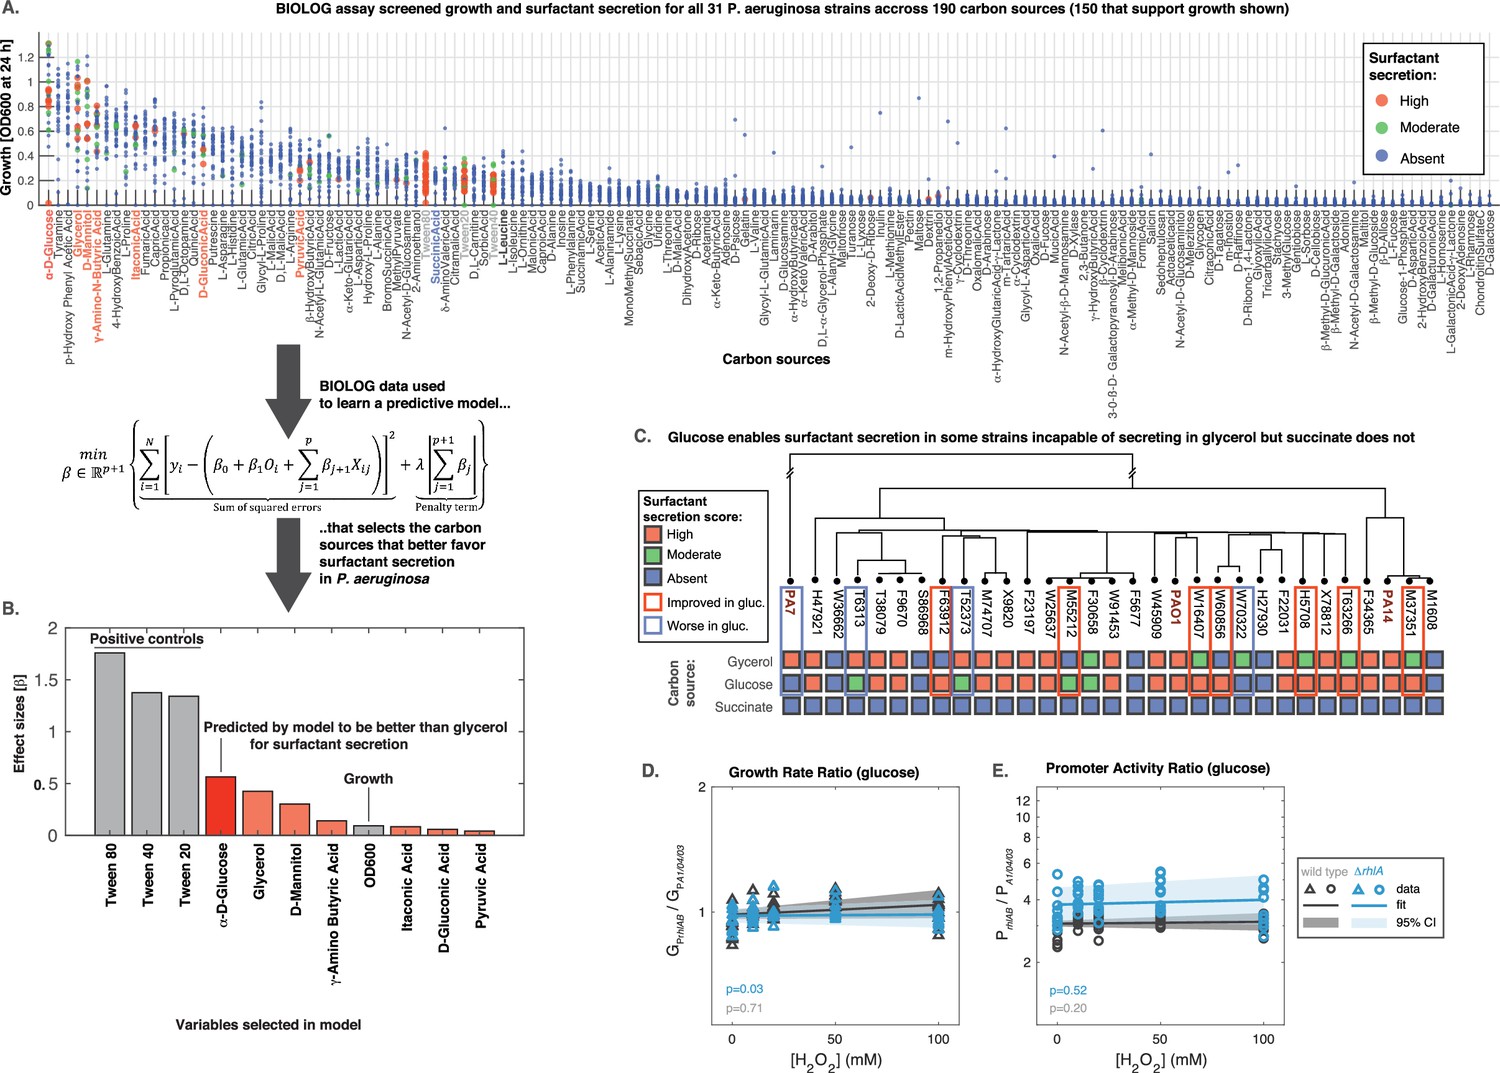
Glucose can make some strains secrete surfactants that could not do it from glycerol, further linking primary metabolism, oxidative stress, and surfactant secretion.
(A) The 31 strains were profiled for growth and surfactant secretion in 190 carbon sources (see supporting Figure 8 for full dataset), here ranked by their potential for growth (highest on top; the carbon sources selected by model highlighted in red; succinate in blue; and the tween positive controls in gray). (B) We trained a predictive model using the LASSO (least absolute shrinkage and selection operator), a supervised learning approach that shrinks linear regression parameters using an L1-penalty. The parameter fitting minimizes the sum of the squared errors of the model (left-hand term in the mathematical expression) and the sum of the absolute values of the betas, the model parameters (right-hand term in the mathematical expression) The values obtained for the parameters beta reveal D-glucose as the only carbon source (besides the positive controls) better than glycerol at inducing surfactant secretion. (C) Validation using glucose minimal medium reveals seven strains that improved surfactant secretion compared to glycerol, and four strains that worsened. This is in sharp contrast to succinate, a carbon source that imposes more oxidative stress and where no strain produces surfactants. (D) Similar experiment as in Figure 6 but now adding H2O2 to PA14 growing in glucose. The extrinsic stress had no significant impact on the growth rate, even in the mutant lacking rhlA. (E) The rhlAB expression was also unaffected by H2O2, indicating that glucose places a lower burden on primary metabolism, enabling cells to both cope with oxidative stress and keep their level of the genes needed to make the surfactants.
Figure 7—figure supplement 1
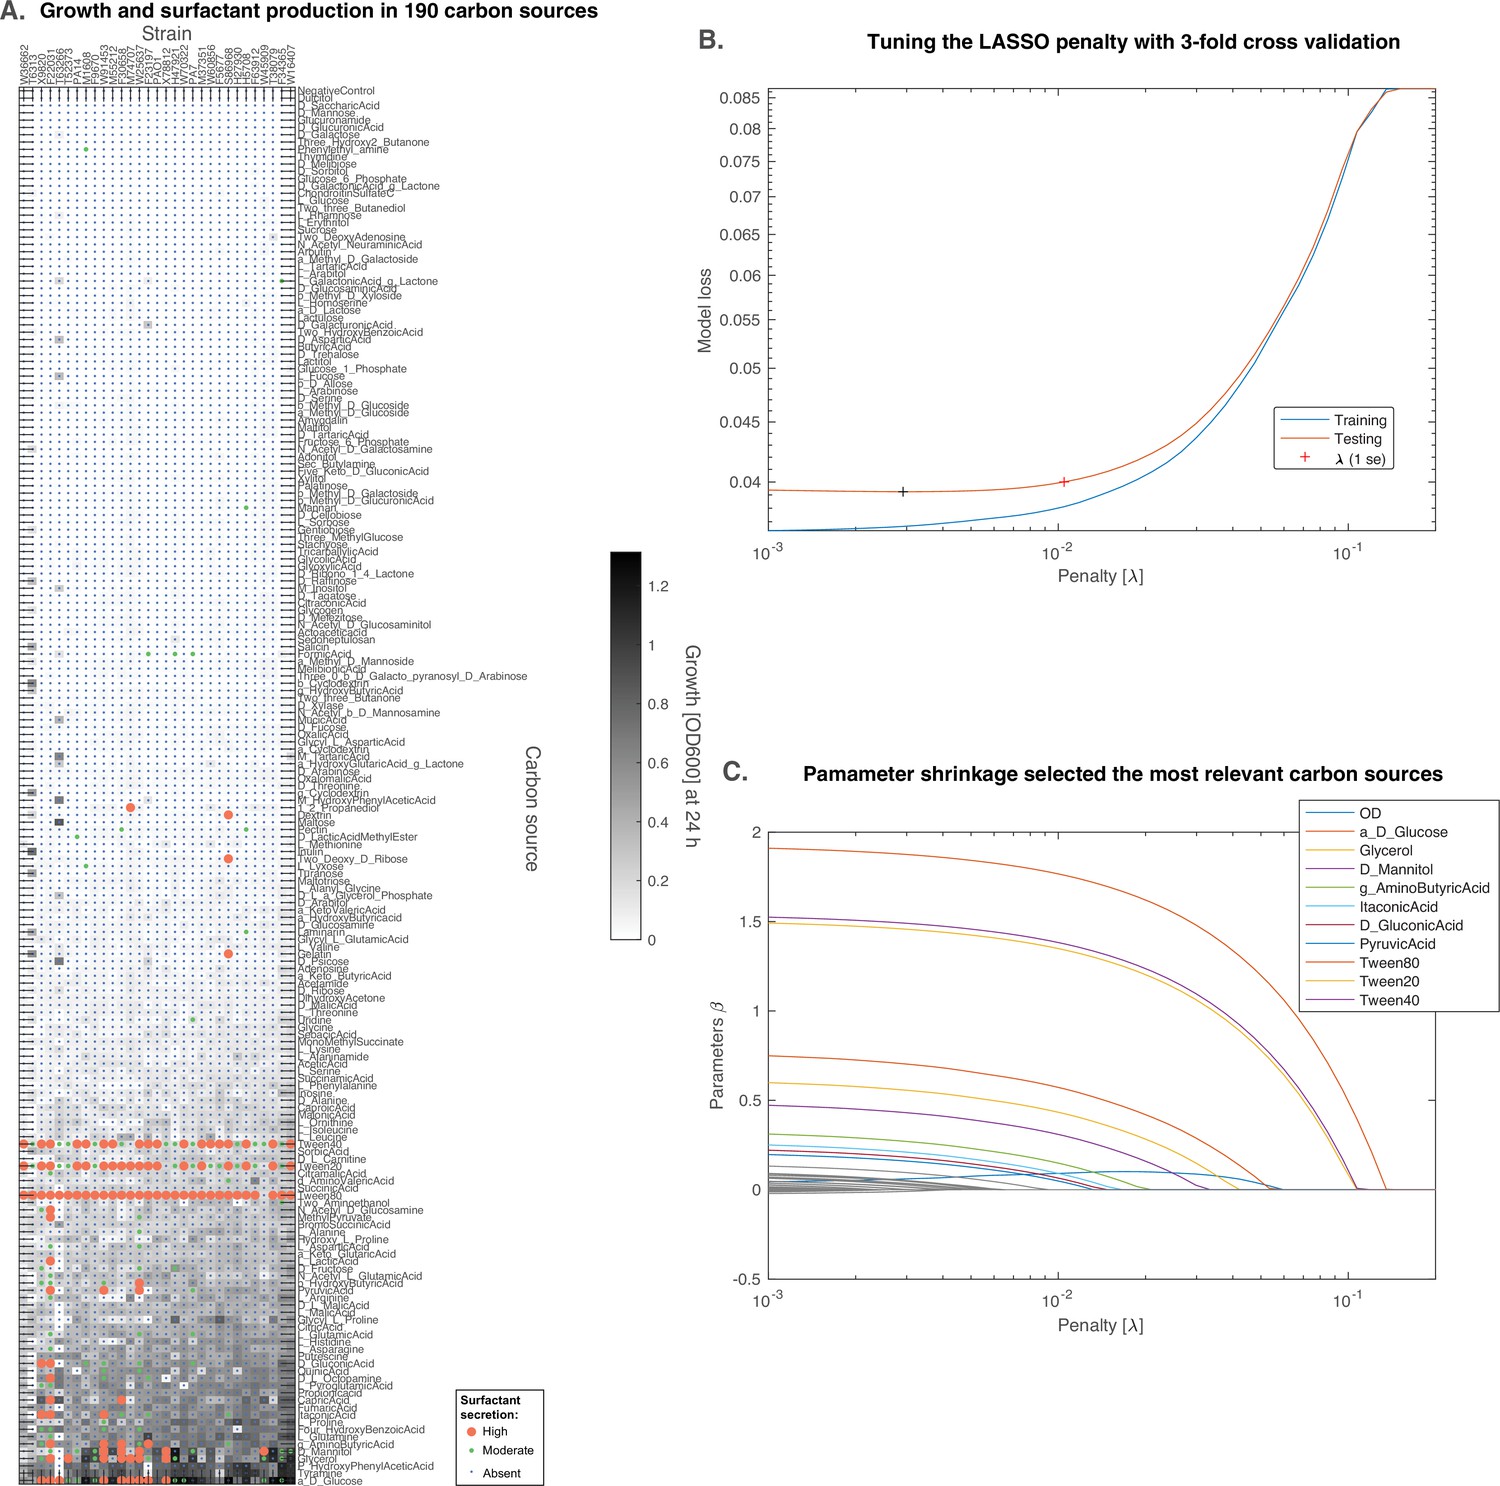
D-glucose is predicted to induce surfactant secretion better than glycerol.
(A) Full results from BIOLOG profiling of the strains were profiled for growth and surfactant secretion in 190 carbon sources, here ranked by their potential for growth (highest on top; the carbon sources discussed further are in bigger font sizes). (B) We trained a predictive model using the LASSO, a supervised learning approach that shrinks linear regression parameters using a L1-penalty. The value for the penalty (1 standard error) was determined by threefold cross-validation. (C) The parameters selected by the model reveal that D-glucose as the only carbon source (besides the positive controls) better than glycerol at inducing surfactant secretion.
Figure 8

The allocation of metabolic resources made from glycerol in primary vs secondary metabolism.
(A) Growth and rhamnolipid biosynthesis on glycerol as the sole carbon source place a strong burden on Pseudomonas aeruginosa: The bacterial cell has to make all the molecules needed for energy, biomass, and redox homeostasis; surfactant biosynthesis—a secondary metabolic pathway—competes for those resources. (B) P. aeruginosa lineages that retain the ability to make surfactants from glycerol meet their primary needs and use excess resources for secondary metabolism. (C) P. aeruginosa uncapable of making surfactants from glycerol was also worse at reducing the oxidative stress produced from growth in glycerol; the needs imposed on primary metabolism, such as maintaining redox homeostasis, may leave insufficient resources for secondary metabolism, explaining the loss of surfactant secretion.
Additional files
-
Supplementary file 1
Presence and absence of genes across the genomes of our clinical isolates.
- https://cdn.elifesciences.org/articles/76119/elife-76119-supp1-v2.xlsx
-
Supplementary file 2
Quantitative values for the seven local features of phase I, II, and III (phase start time point, phase duration, phase initial OD, OD change, area under the curve, mean specific growth rate, and maximum specific growth rate) of growth curves.
- https://cdn.elifesciences.org/articles/76119/elife-76119-supp2-v2.xlsx
-
Supplementary file 3
Different pathways that are significantly different in rhamnolipid producers and non-producers identified by FELLA.
- https://cdn.elifesciences.org/articles/76119/elife-76119-supp3-v2.xlsx
-
Supplementary file 4
Correlations between gene expressions or pathways with rhamnolipid production in RLQ analysis.
For each rhamnolipid production category (strong-, mild-, and non-producers), its correlation value with a single gene or a functional pathway was computed as the dot products between the arrow of phenotypic category and the arrow of the gene or pathway in RLQ axes.
- https://cdn.elifesciences.org/articles/76119/elife-76119-supp4-v2.xlsx
-
Supplementary file 5
Normalized peak area of metabolomics.
- https://cdn.elifesciences.org/articles/76119/elife-76119-supp5-v2.tsv
-
Supplementary file 6
Read counts of P. aeruginosa RNAseq aligned to the PA14 genome.
- https://cdn.elifesciences.org/articles/76119/elife-76119-supp6-v2.csv
-
Supplementary file 7
Metadata of RNAseq archived in NCBI SRA database.
- https://cdn.elifesciences.org/articles/76119/elife-76119-supp7-v2.tsv
-
Transparent reporting form
- https://cdn.elifesciences.org/articles/76119/elife-76119-transrepform1-v2.docx
Download links
A two-part list of links to download the article, or parts of the article, in various formats.
Downloads (link to download the article as PDF)
Open citations (links to open the citations from this article in various online reference manager services)
Cite this article (links to download the citations from this article in formats compatible with various reference manager tools)
Evolution and regulation of microbial secondary metabolism
eLife 11:e76119.
https://doi.org/10.7554/eLife.76119


